Figure 7.4
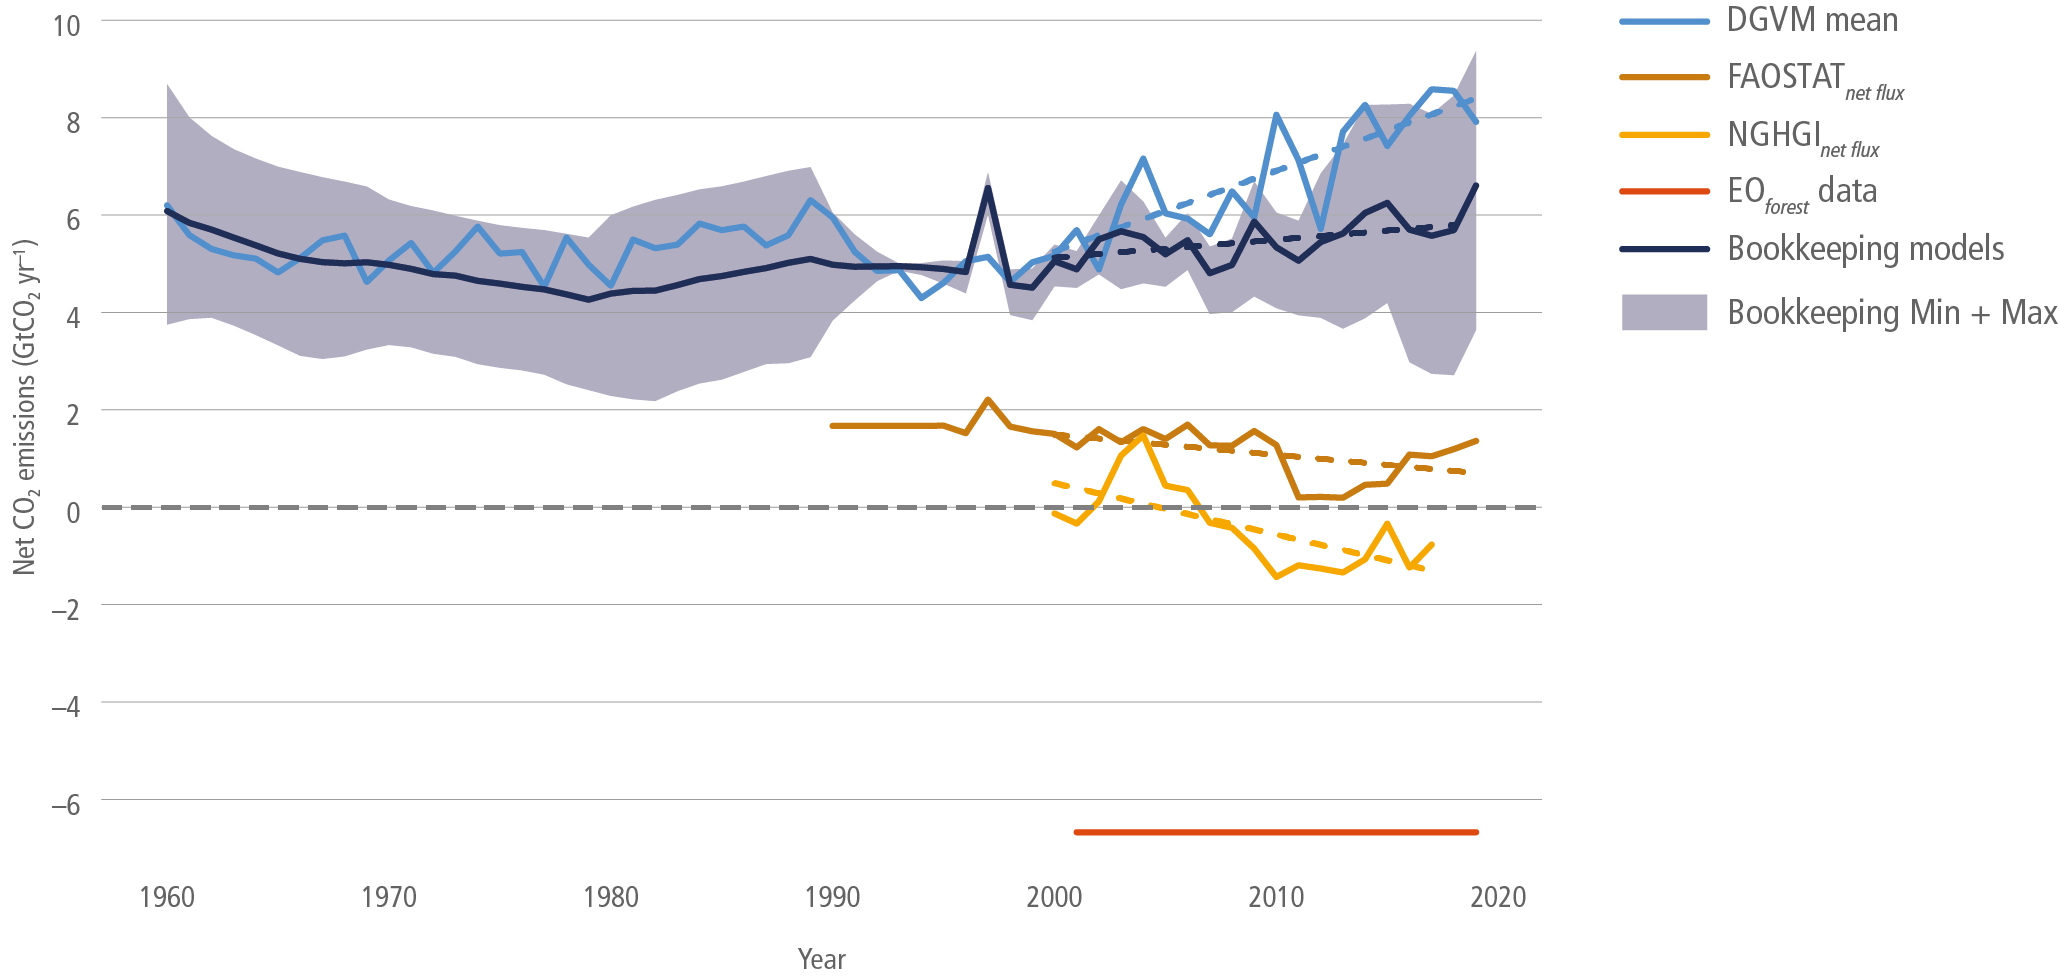
Figure caption
Figure 7.4 | Global net CO2 flux due to AFOLU estimated using different methods for the period 1960 to 2019 (GtCO2 yr–1). Positive numbers represent emissions. Light-blue line: The mean from 17 DGVMs all using the same driving data under TrendyV9 used within the Global Carbon Budget 2020 and including different degrees of management (Bastos et al. 2020; Friedlingstein et al. 2020). Brown line: Data downloaded 6 June 2021 from FAOSTAT (FAO 2021b; http://www.fao.org/faostat/) comprising: net emissions from (i) forest land converted to other land, (ii) net emissions from organic soils in cropland, grassland and from biomass burning, including peat fires and peat draining (Prosperi et al. 2020) and (iii) net emissions from forest land remaining forest land, which includes managed forest lands (Tubiello et al. 2020). Yellow line: Net flux estimate from National Greenhouse Gas Inventories (NGHGI) based on country reports to the UNFCCC for LULUCF (Grassi et al. 2021) which include land-use change, and flux in managed lands. Red EO line: The 2001–2019 average net CO2 flux from non-intact forest-related emissions and removals based on ground and Earth Observation data (EO) (Harris et al. 2021). Data to mask non-intact forest were used in the tropics (Turubanova et al. 2018) and extra-tropics (Potapov et al. 2017). Dark blue line: the mean estimate and minimum and maximum (dark-blue shading) from three bookkeeping models (Hansis et al. 2015; Houghton and Nassikas 2017; Gasser et al. 2020). These include land cover change (e.g., deforestation, afforestation), forest management including wood harvest and land degradation, shifting cultivation, regrowth of forests following wood harvest or abandonment of agriculture, grassland management, agricultural management. Emissions from peat burning and draining are added from external datasets (see text). Both the DGVM and bookkeeping global data is available at: https://www.icos-cp.eu/science-and-impact/global-carbon-budget/2020 (accessed on 4 October 2021). Data consistent with IPCC AR6 WGI Chapter 5. Dotted lines denote the linear regression from 2000 to 2019. Trends are statistically significant (P <0.05) with exception for the NGHGI trend (P <0.01).