Back to chapter figures
Figure 7.8
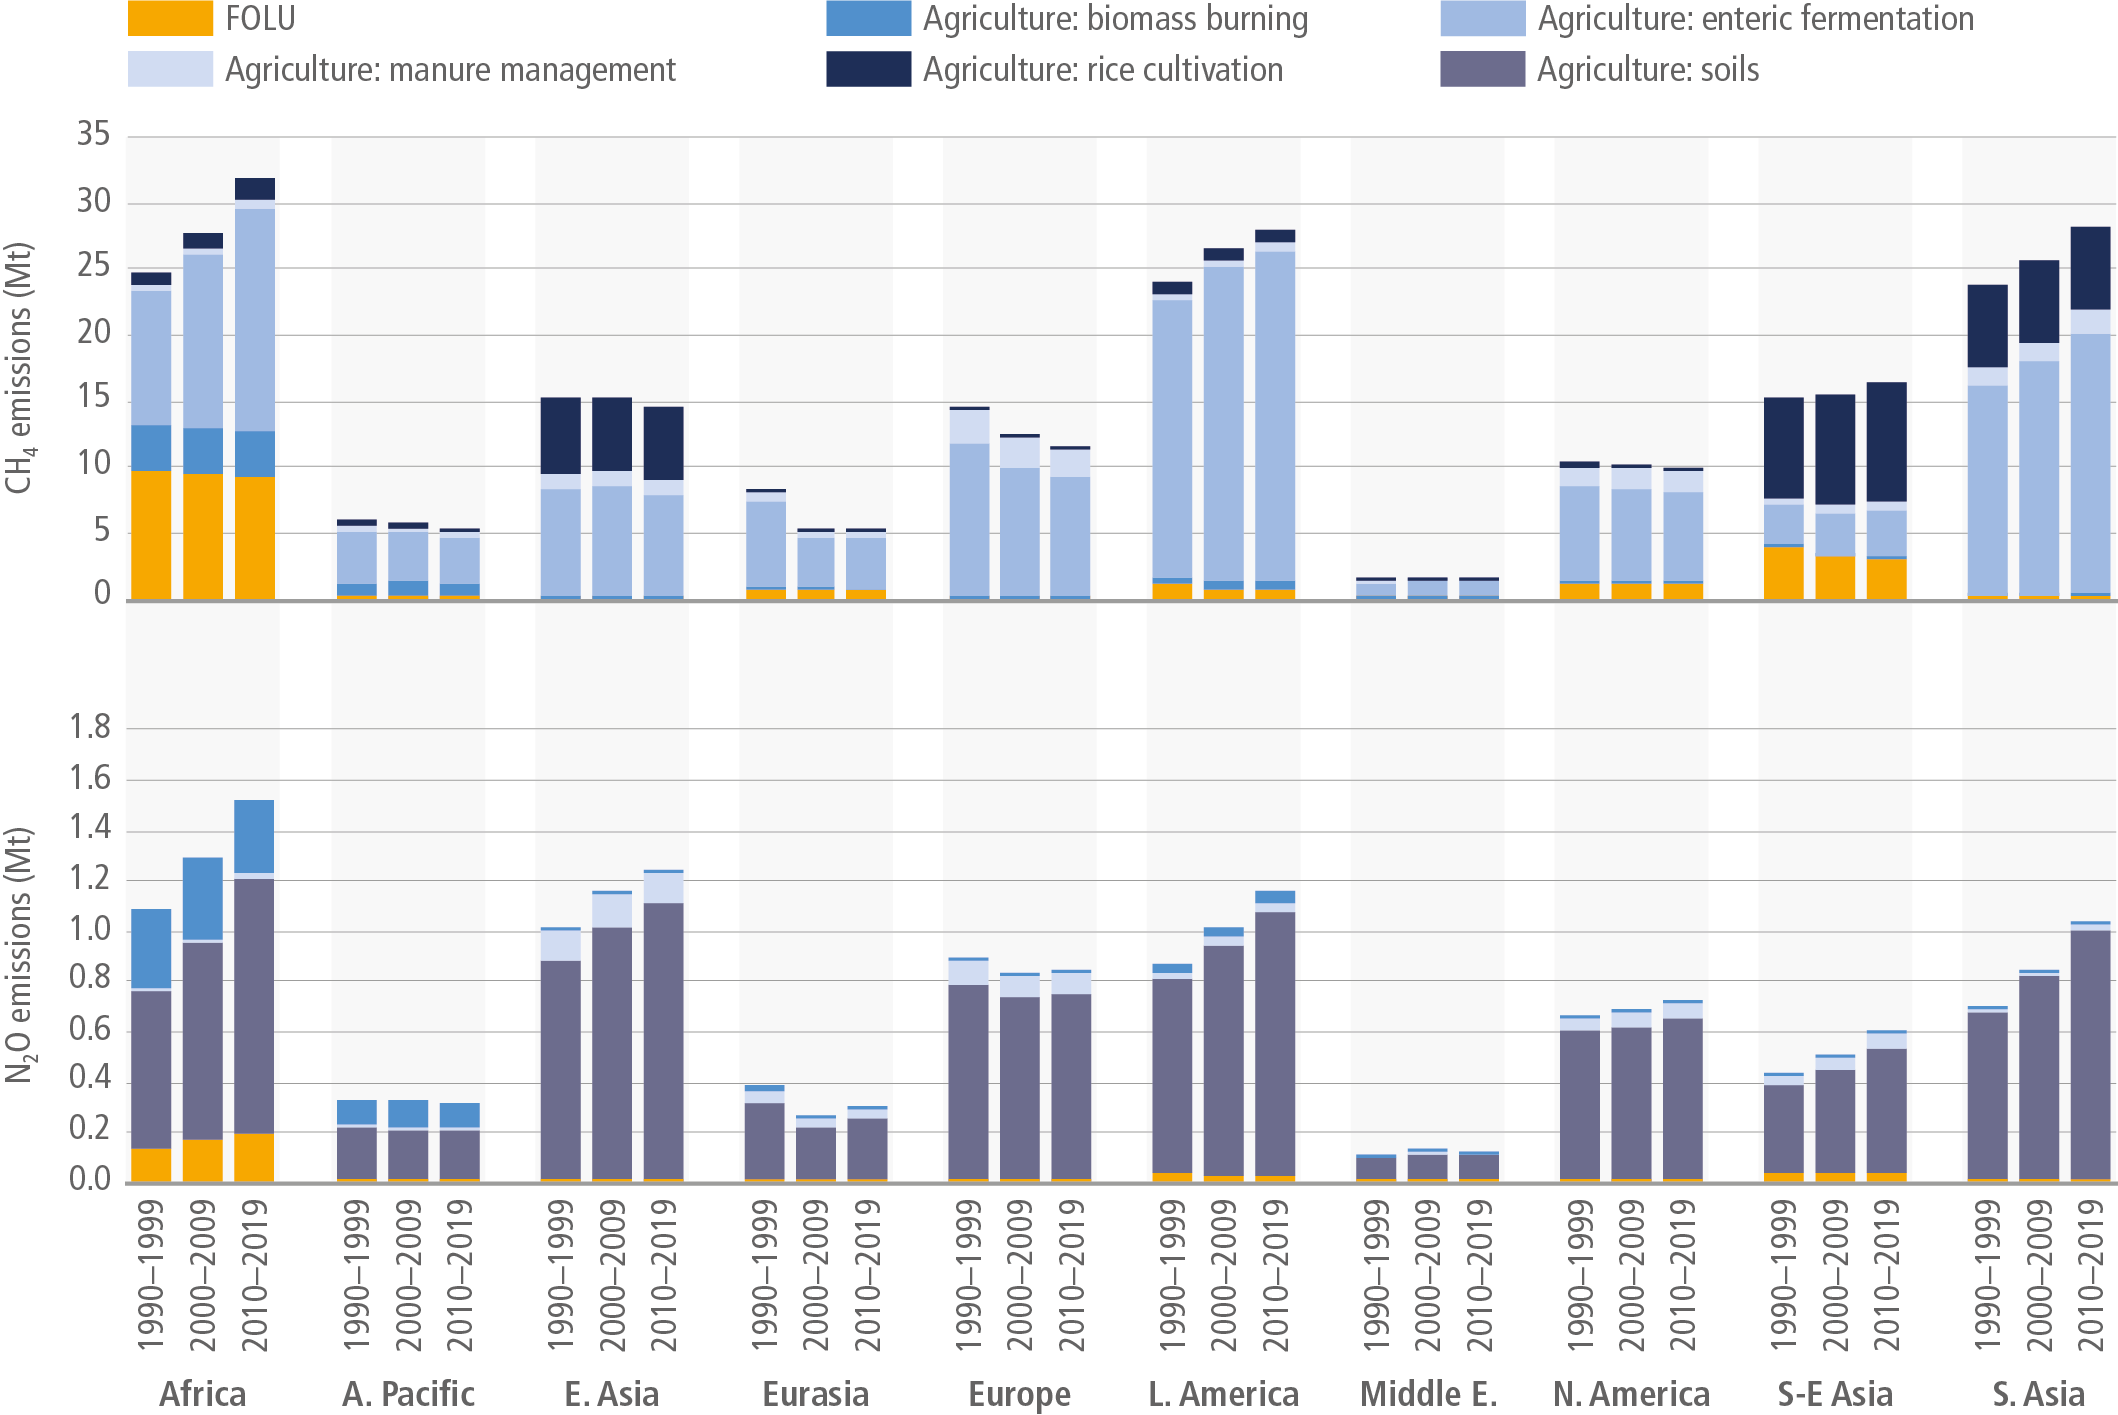
Figure caption
Figure 7.8 | Estimated average AFOLU CH4 (top) and N2O (bottom) emissions for three decades according to FAOSTAT data by ten global regions, with disaggregation of agricultural emissions (FAO 2020b; 2021a). Note for N2O: emissions from manure deposition and application to soils, crop residues and synthetic fertilisers are combined under ‘Agriculture: Soils’.