Figure 8.13
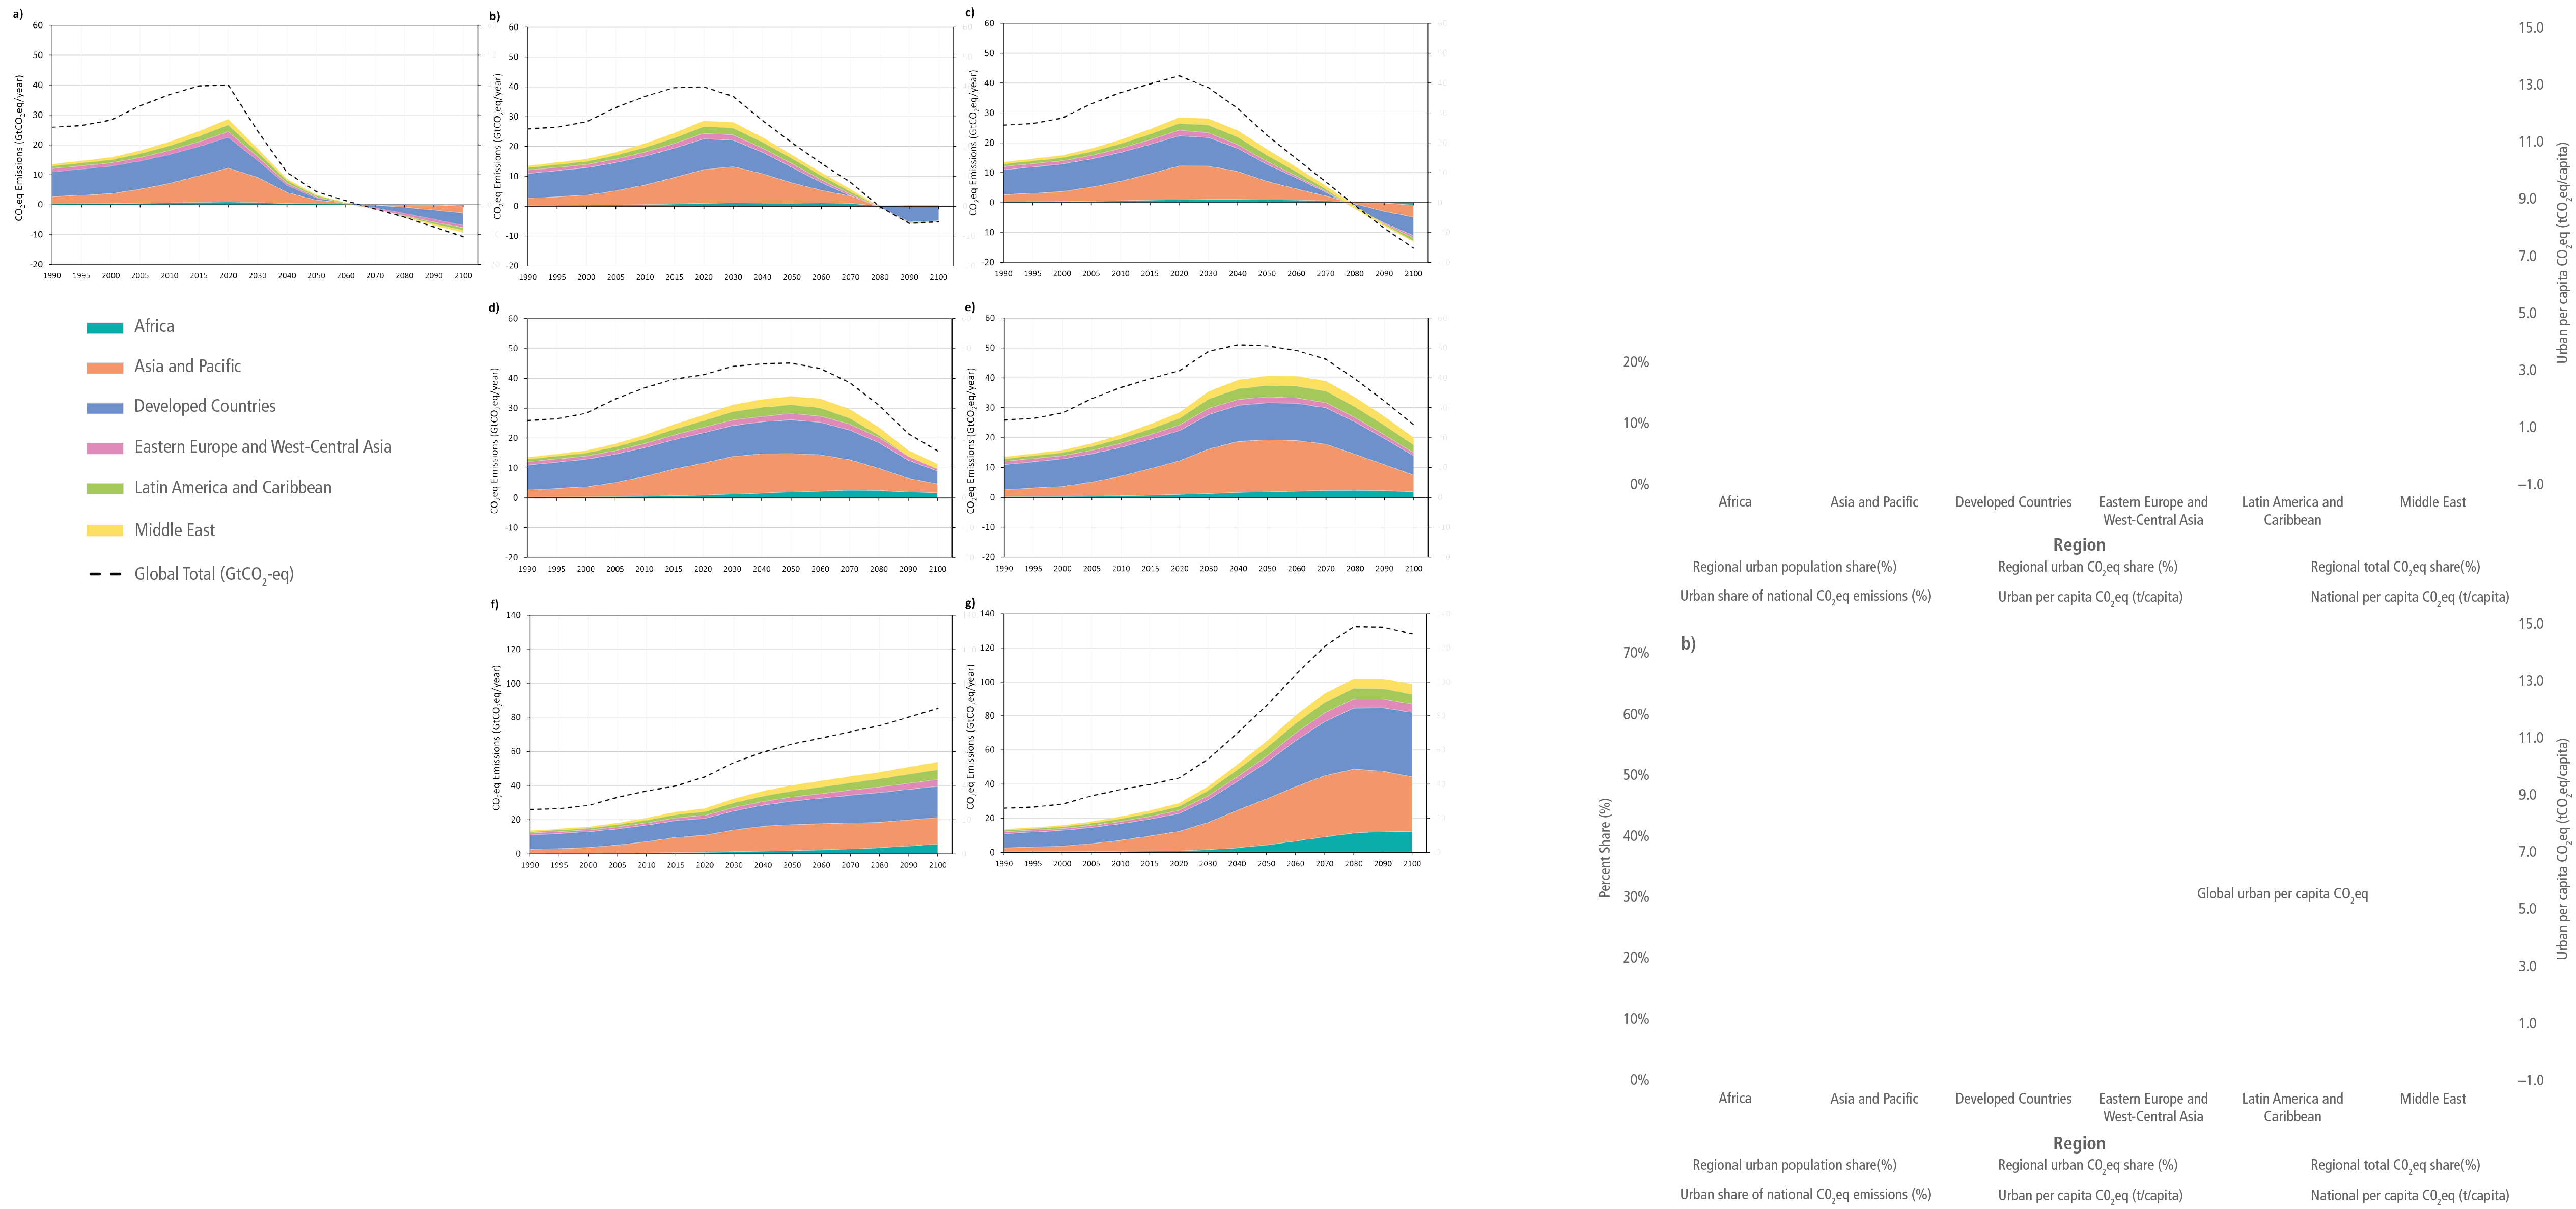
Figure caption
Figure 8.13: Carbon dioxide equivalent (CO2-eq) emissions from global urban areas in seven SSP-RCP variations spanning the 1990 to 2100 time period. Urban areas are aggregated to six regional domains based on the AR6 WGIII 6-region aggregation. Global total CO2-eq emissions (CO2 and CH4 (methane)) are also shown as marked by the dashed line. Future urban emissions in the context of SSP-RCP-Shared Policy Assumption (SPA) variations correspond to (a) SSP1-RCP1.9-SPA1, (b) SSP1-RCP2.6-SPA1, (c) SSP4-RCP3.4-SPA4, (d) SSP2-RCP4.5-SPA2, (e) SSP4-RCP6.0-SPA4, (f) SSP3-RCP7.0-SPA0 and (g) SSP5-RCP8.5 based on the marker scenario implementations.6 The first three scenarios (a–c) with more stringent reduction pathways represent contexts where urban per capita emissions decline rapidly against various increases in urban population and are oriented to reach net-zero emissions within this century at different radiative forcing levels. SSP1 scenarios (a, b) represent contexts where urbanisation takes place rapidly while providing resource efficiency based on compact urban form (Jiang and O’Neill 2017), with high levels of electrification (van Vuuren et al. 2017b; Rogelj et al. 2018). The scenario context of SSP1-RCP1.9 represents a pathway in which there can be a transformative shift towards sustainability. Note that the scale of panels (f) and (g) is different from the other panels.7 See Table 8.2 detailing the SSP-RCPs. Source: adapted from Gurney et al. (2022).8