Figure 8.14
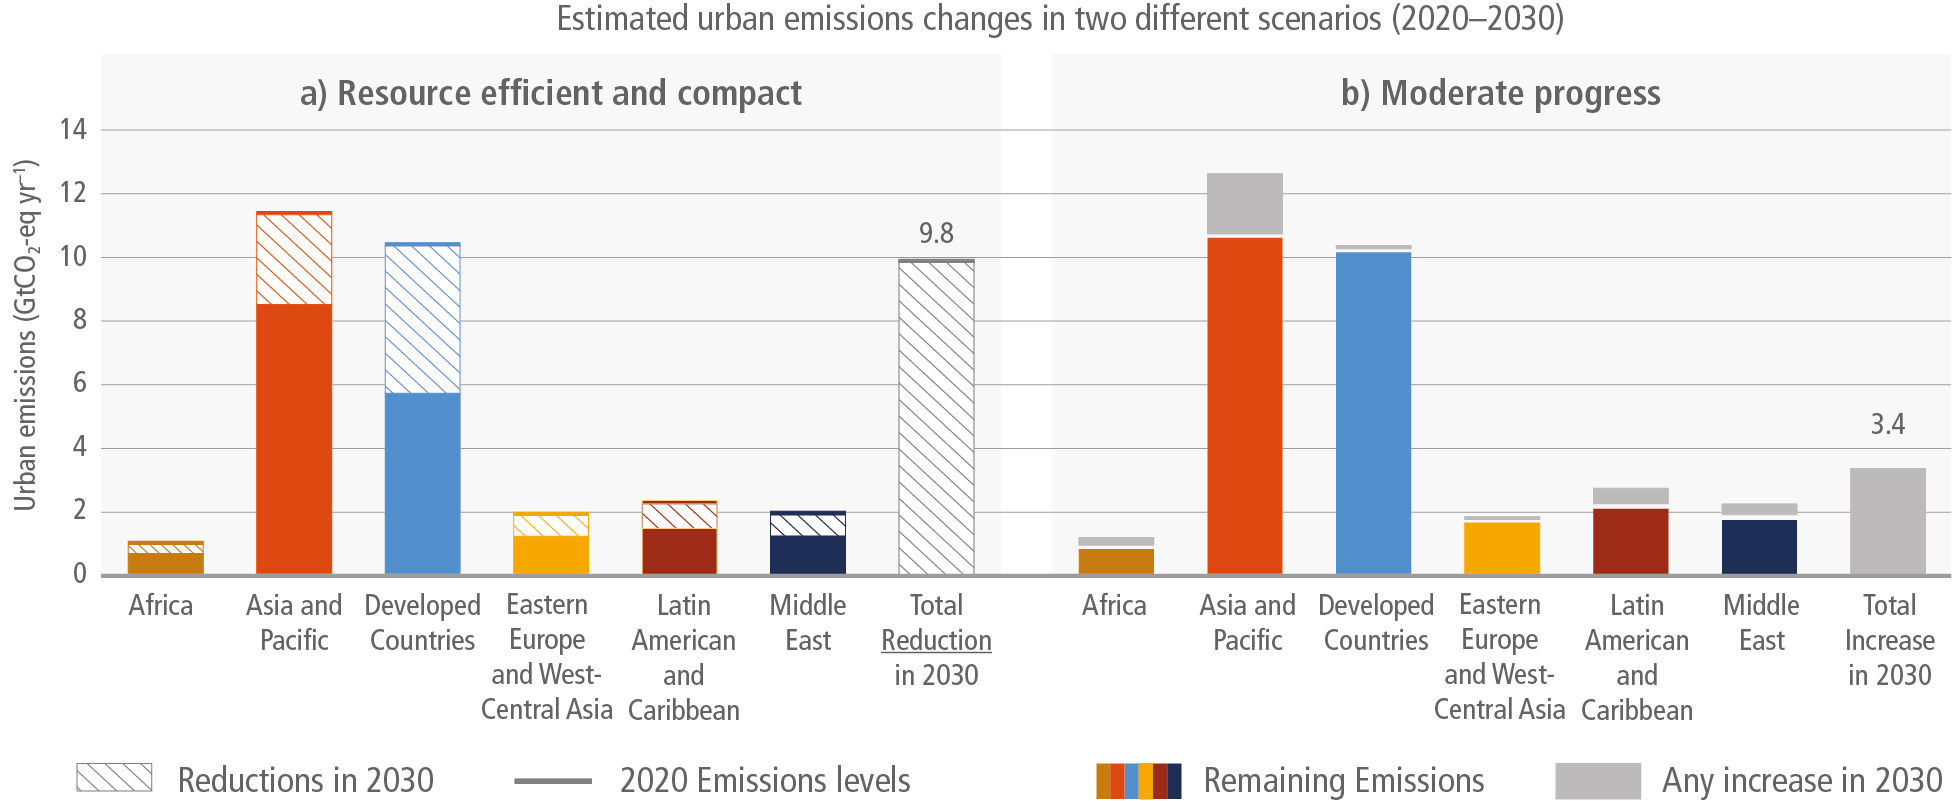
Figure caption
Figure 8.14: Comparison of urban emissions under different urbanisation scenarios (GtCO2-eq yr–1) for the AR6 WGIII 6-region aggregation. The panels represent the estimated urban emissions change in two different scenarios for the time period 2020–2030. Panel (a) represents resource efficient and compact urbanisation while panel (b) represents urbanisation with moderate progress. The two scenarios are consistent with estimated urban emissions under the SSP1-RCP1.9-SPA1 and SSP2-RCP4.5-SPA2 scenarios, respectively (Figure 8.13). In both panels, urban emissions estimates for the year 2020 are marked by the lines for each region. In the resource efficient and compact scenario, various reductions in urban emissions that take place by 2030 are represented by the dashed areas within the bars. The remaining solid shaded areas represent the remaining urban emissions in 2030 for each region on the path towards net-zero emissions. The total reductions in urban emissions worldwide that are given by the last dashed grey bar in panel (a) is estimated to be 9.8 GtCO2-eq yr–1 between 2020 and 2030 in this scenario. In the scenario with moderate progress, there are no regions with reductions in urban emissions. Above the white lines that represent urban emissions in 2020, the grey shaded areas are the estimated increases for each region so that the total urban emissions would increase by 3.4 GtCO2-eq yr–1 from 2020 levels in 2030 under this scenario. The values are based on urban scenario analyses as given in Gurney et al. (2021, 2022). Source: synthesised based on data from Gurney et al. (2022).9