Figure 8.21
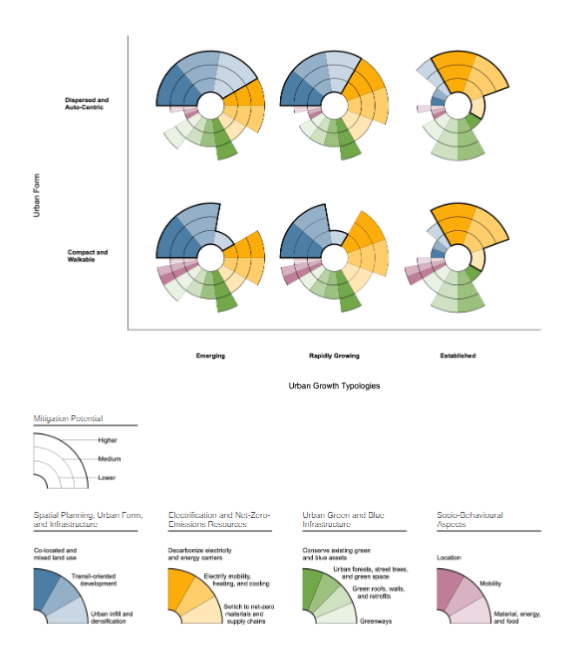
Figure caption
Figure 8.21: Priorities and potentials for packages of urban mitigation strategies across typologies of urban growth (Figure 8.20) and urban form (Figure 8.16). The horizontal axis represents urban growth typologies based on emerging, rapidly growing, and established urban areas. The vertical axis shows the continuum of urban form, from compact and walkable, to dispersed and auto-centric. Urban areas can first locate their relative positioning in this space according to their predominant style of urban growth and urban form. The urban mitigation options are bundled across four broad sectors of mitigation strategies: (i) spatial planning, urban form, and infrastructure (blue); (ii) electrification and net-zero-emissions resources (yellow); (iii) urban green and blue infrastructure (green); and (iv) socio-behavioural aspects (purple). The concentric circles indicate lower, medium, and higher mitigation potential considering the context of the urban area. For each city type (circular graphic) the illustrative urban mitigation strategy that is considered to provide the greatest cascading effects across mitigation opportunities is represented by a section that is larger relative to others; those strategy sections outlined in black are ‘entry points’ for sequencing of strategies. Within each of the larger strategy sections (i.e., spatial planning, urban green and blue infrastructure, etc.), the size of the sub-strategy sections are equal and do not suggest any priority or sequencing. The relative sizes of the strategies and extent of mitigation potential are illustrative and based on the authors’ best understanding and assessment of the literature.