Back to chapter figures
Figure 8.22
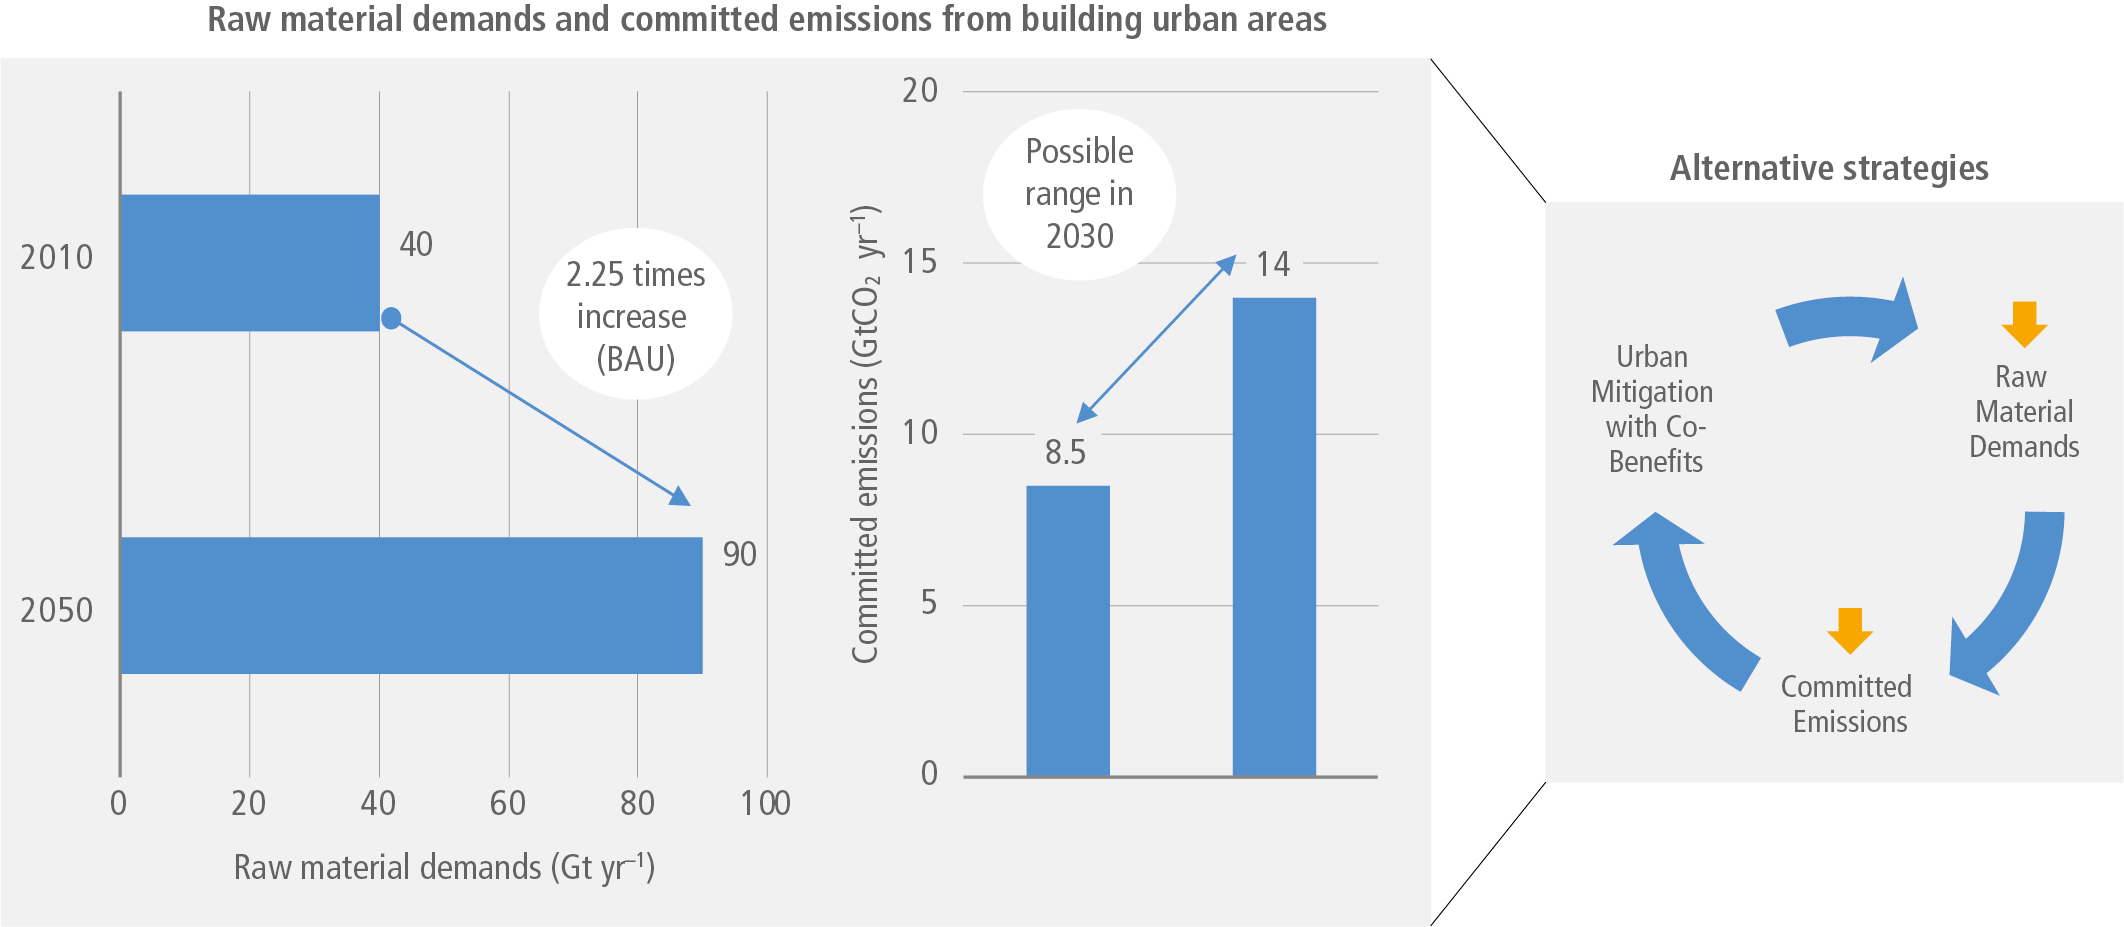
Figure caption
Figure 8.22: Raw material demands and committed emissions from building urban areas. The horizontal bars represent the projected increase in raw material demands in the year 2050. The vertical bars represent the possible range of committed CO2 emissions in 2030. The importance of alternative solutions to reduce raw material demands and committed emissions while increasing co-benefits is represented by the circular process on the right-hand side. Ranges for committed emissions from new urban infrastructure are based on Erickson and Tempest (2015) SEI WP 11. Source: drawn using data from Erickson and Tempest (2015) and Swilling et al. (2018).