Figure 8.5
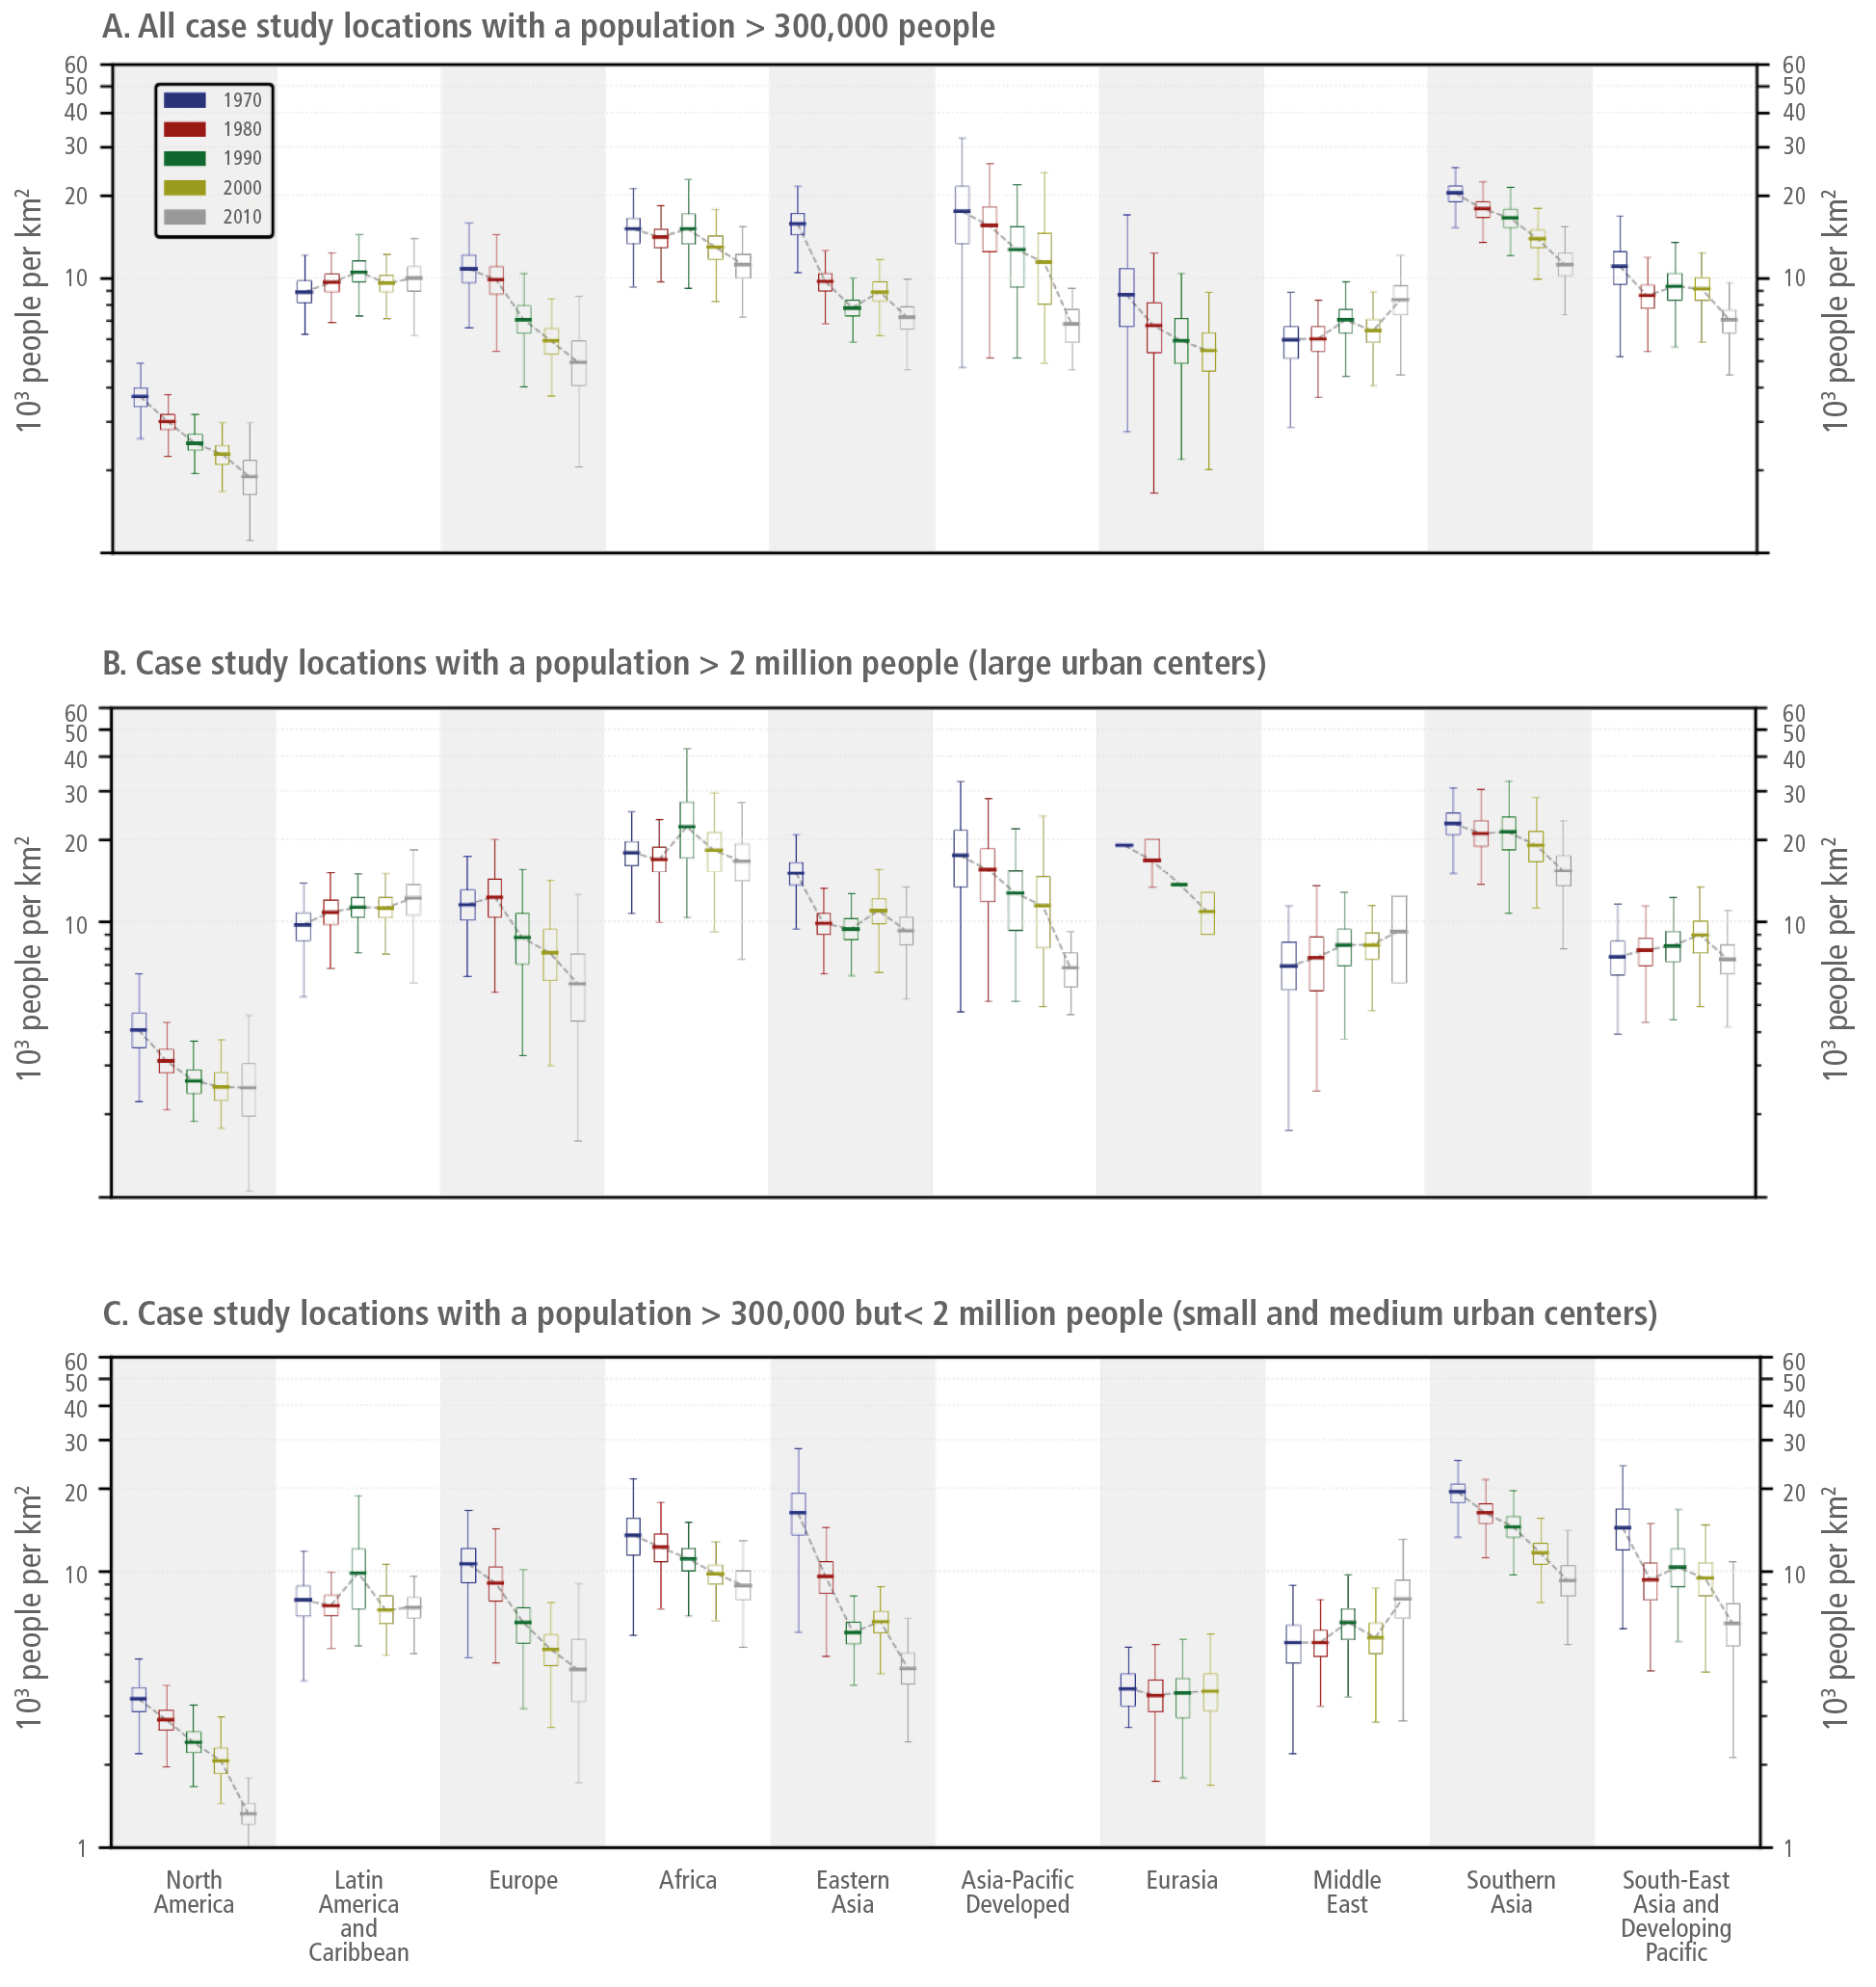
Figure caption
Figure 8.5 :Urban population density by decade (1970–2010) grouped by the AR6 WGIII 10-region aggregation. Panel (a) displays the results from all case study locations with a population >300,000. Panels (b) and (c) show results grouped by city size: (b) cities with a population >2 million (large urban centres), and (c) those with a population >300,000 but <2 million (small and medium urban centres). Box plots show the median, first and third quartiles, and lower and upper mild outlier thresholds of bootstrapped average urban population densities at the turn of each decade. The estimates are shown on a logarithmic scale. The data shows an overall trend of declining urban population densities among all but one region in the last four decades, at varying rates – although the Latin America and Caribbean region indicates relatively constant urban population density over time. The Middle East region is the only region to present with an increase in urban population density across all city sizes. Source: adapted from Güneralp et al. (2020).