Back to chapter figures
Figure 8.6
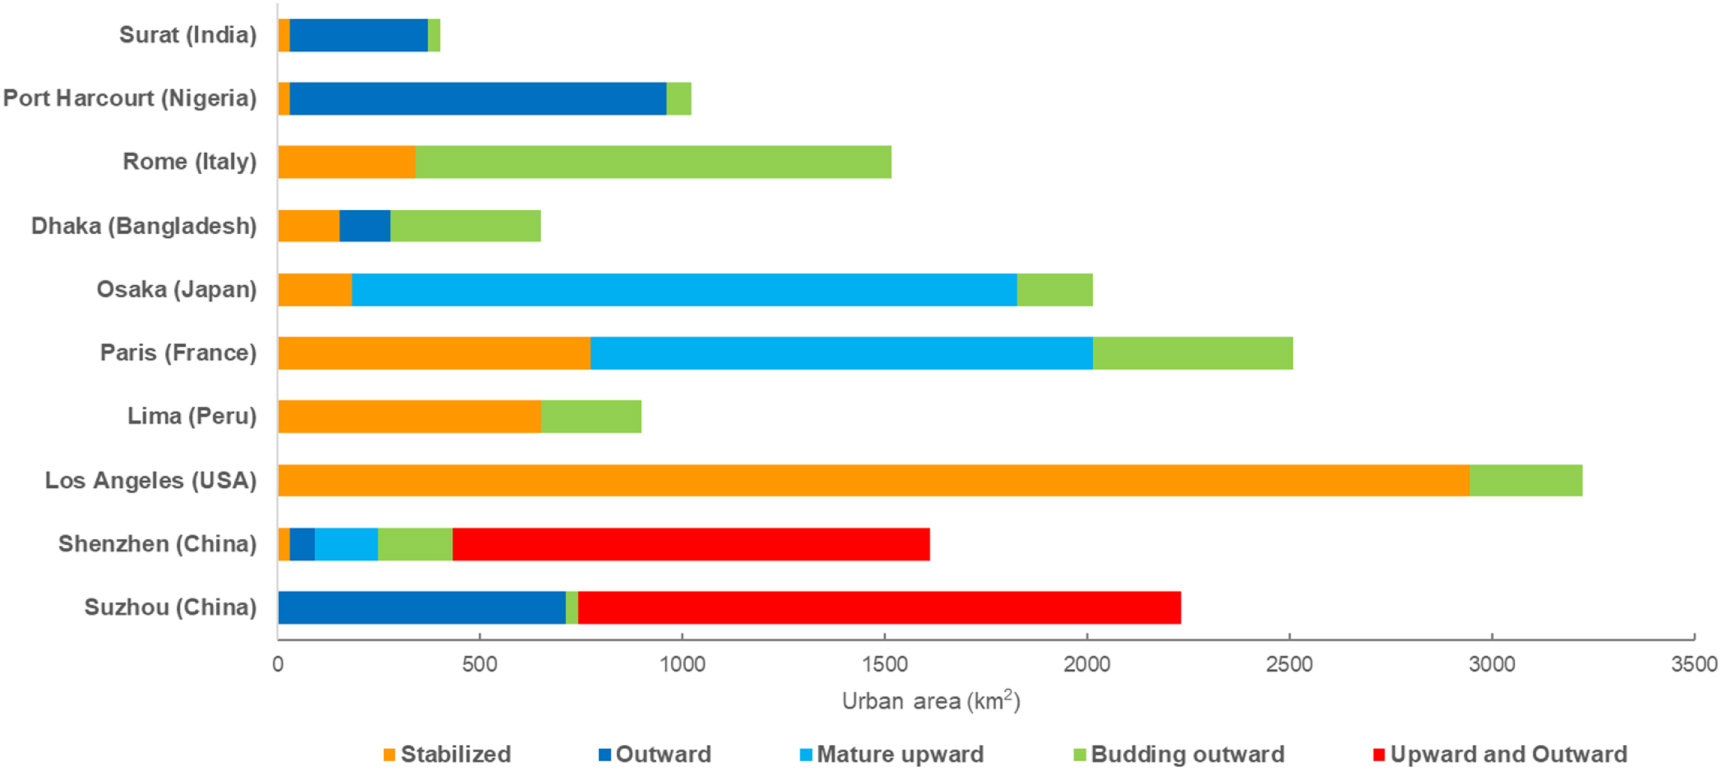
Figure caption
Figure 8.6: (a) Distribution of growth typologies across 10 cities, and (b) sample of 64 cities by region with different patterns of urban growth. The empirical data is based on the Global Human Settlement Layer and backscatter power ratio for different patterns of urban growth across the sample of cities. In (b), the blue arrows indicate outward urban growth. Other urban patterns indicate stabilised (orange), mature upward (light blue), budding outward (green), and upward and outward (red). Note that with few exceptions, each city is comprised of multiple typologies of urban growth. Source: Mahtta et al. (2019).