Back to chapter figures
Figure 8.8
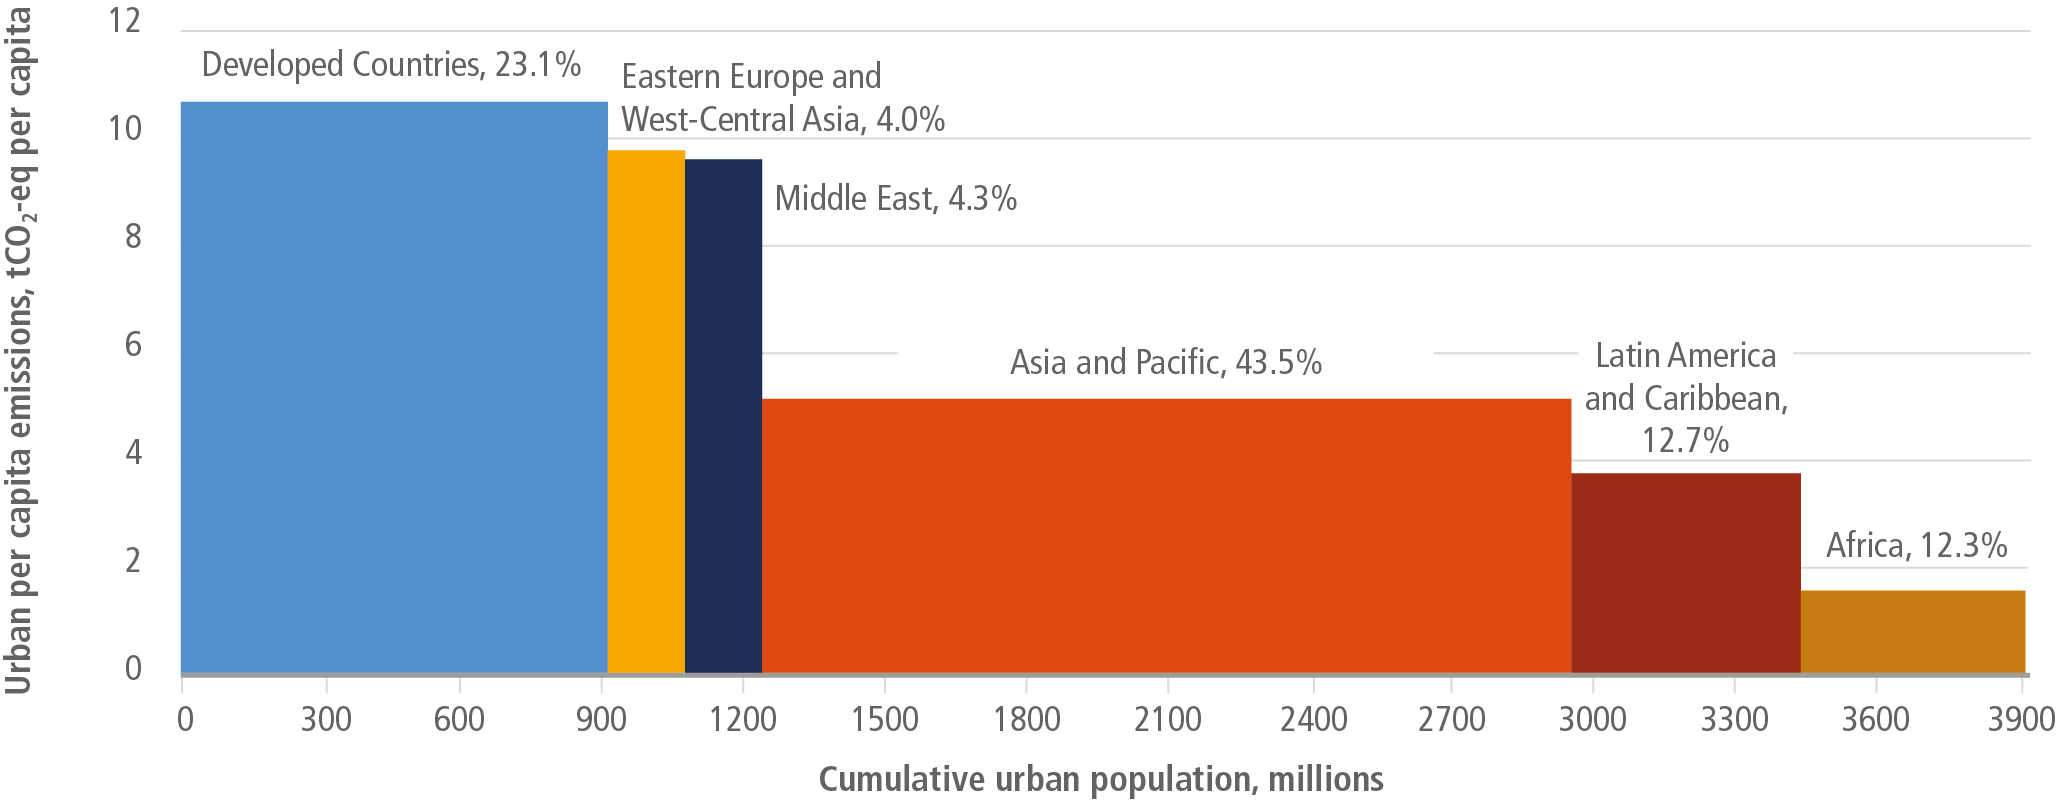
Figure caption
Figure 8.8: 2015 average urban greenhouse gas emissions per capita, considering carbon dioxide (CO2) and methane (CH4) emissions from a consumption-based perspective, alongside urban population, for regions represented in the AR6 WGIII 6-region aggregation. The average urban per capita emissions are given by the height of the bars while the width represents the urban population for a given region, based on 2015 values for both axes. Provided within the bars are the percentage shares of the urban population by region as a share of the total urban population. Source: synthesised based on data from UN DESA (2019) and Gurney et al. (2022).