Figure 8.9
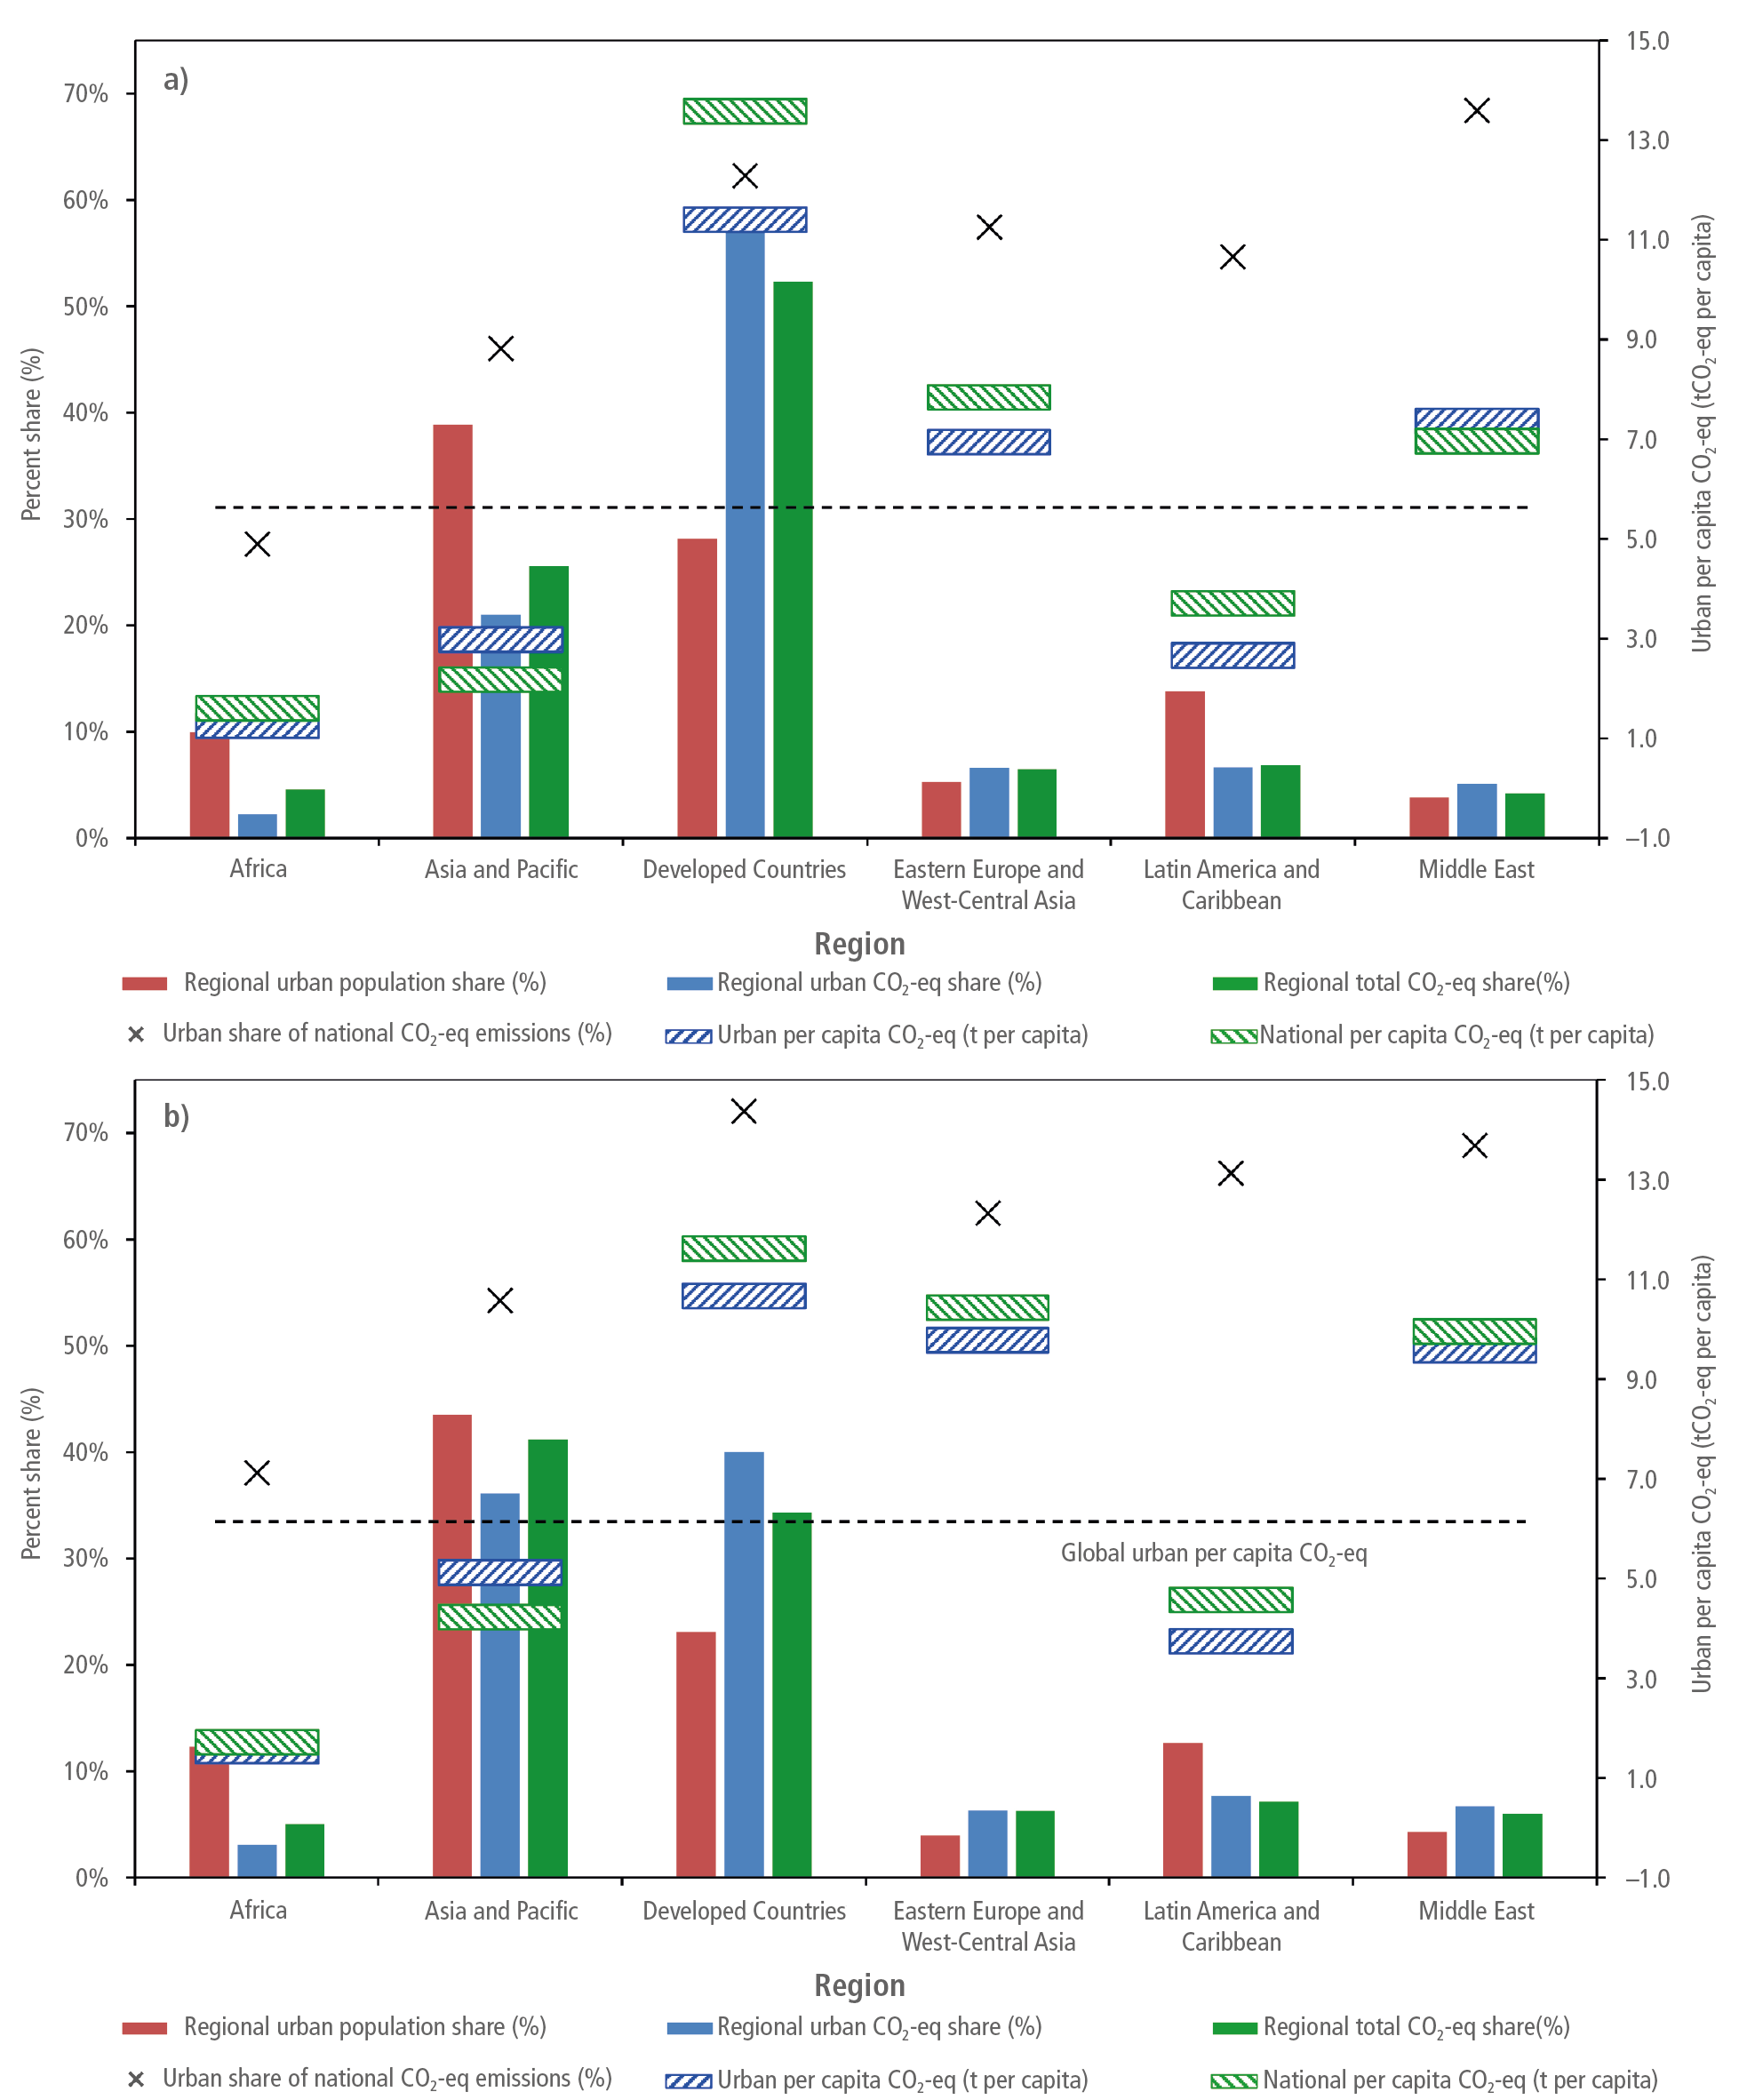
Figure caption
Figure 8.9: Changes in six metrics associated with urban and national-scale carbon dioxide (CO2) and methane (CH4) emissions represented in the AR6 WGIII 6-region aggregation, with (a) 2000 and (b) 2015. The trends in Luqman et al. (2021) were combined with the work of Moran et al. (2018) to estimate the regional urban CO2-eq share of global urban emissions, the urban share of national CO2-eq emissions, and the urban per capita CO2-eq emissions by region. This estimate is derived from consumption-based accounting that includes both direct emissions from within urban areas and indirect emissions from outside urban areas related to the production of electricity, goods, and services consumed in cities. It incorporates all CO2 and CH4 emissions except aviation, shipping and biogenic sources (i.e., land-use change, forestry, and agriculture). The dashed grey line represents the global average urban per capita CO2-eq emissions. The regional urban population share, regional CO2-eq share in total emissions, and national per capita CO2-eq emissions by region are given for comparison. Source: adapted from Gurney et al. (2022).5