Back to chapter figures
Figure 9.17
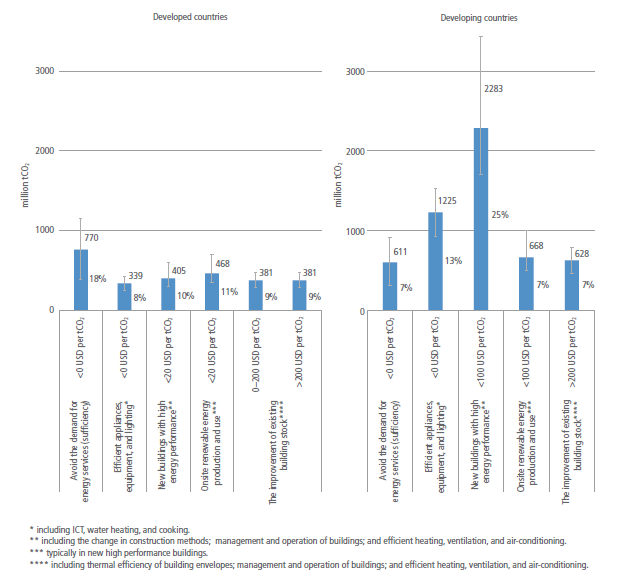
Figure caption
Figure 9.17 | Indicative breakdown of GHG emission reduction potential of the buildings sector in developed and developing countries into measure and costs in 2050, in absolute figures with uncertainty ranges and as a share of their baseline emissions. Notes: (i) The baseline refers to the WEO Current Policy Scenario (International Energy Agency 2019c). It may differ from other chapters. (ii) The figure merged the results of Eurasia into those of Developed Countries.