Figure: SPM Box Figure 1
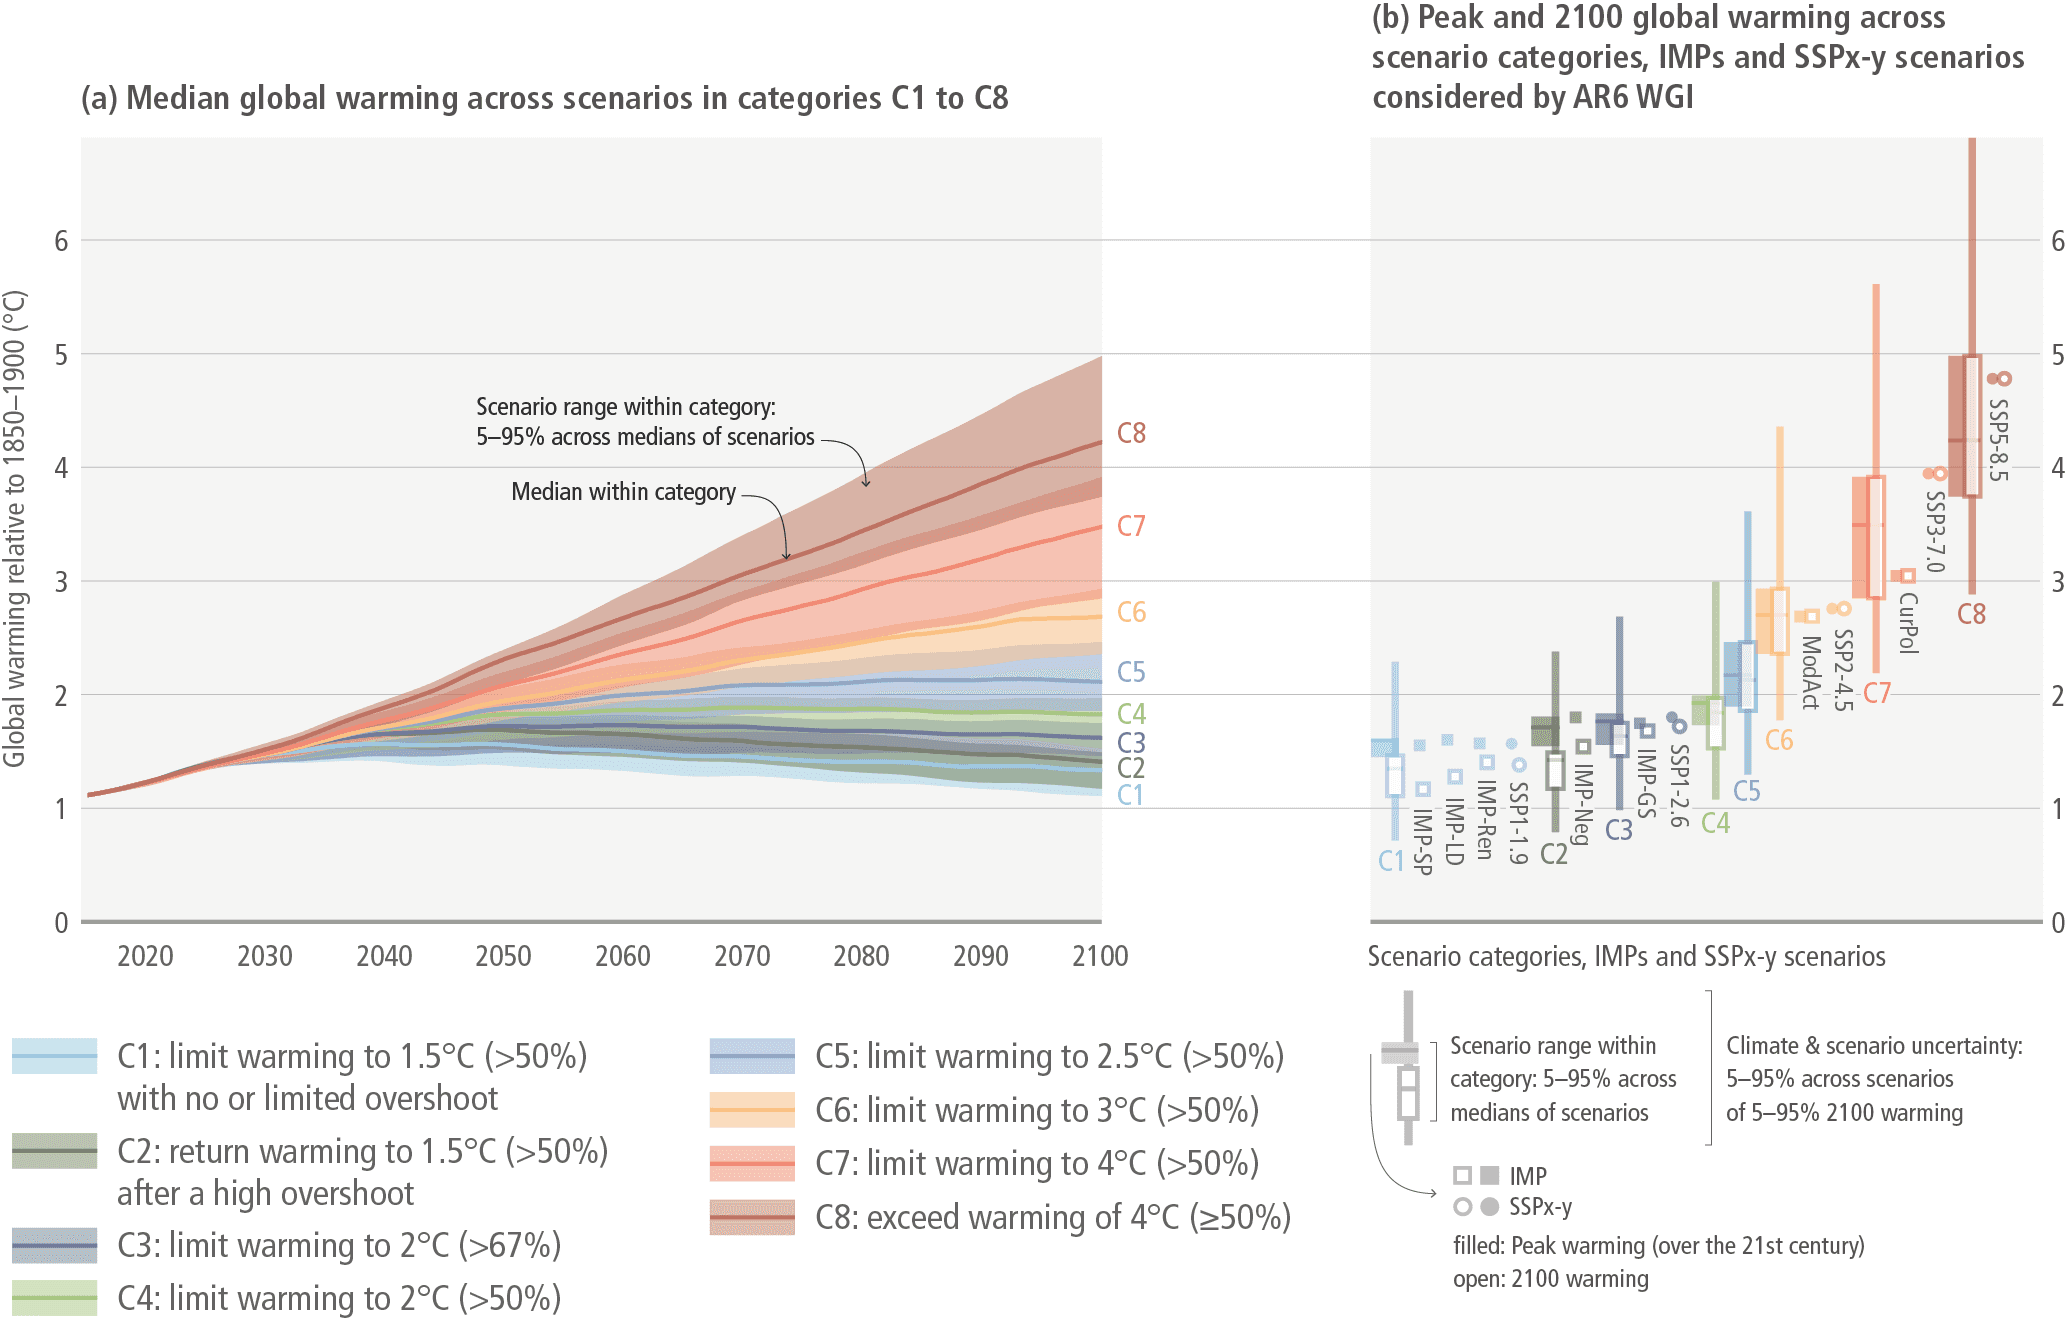
Figure SPM Box Figure 1: Figure Box SPM.1 Projected global mean warming of the ensemble of modelled scenarios included in the climate categories C1-C8 and IMPs (based on emulators calibrated to the WGI assessment), as well as five illustrative scenarios (SSPx-y) as considered by AR6 WG I. The left panel shows the p5-p95 range of projected median warming across global modelled pathways within a category, with the category medians (line). The right panel shows the peak and 2100 emulated temperature outcomes for the categories C1 to C8 and for IMPs, and the five illustrative scenarios (SSPx-y) as considered by AR6 WG I. The boxes show the p5-p95 range within each scenario category as in panel-a. The combined p5-p95 range across scenarios and the climate uncertainty for each category C1- C8 is also shown for 2100 warming (thin vertical lines). {Table SPM.1, Figure 3.11, WGI Figure SPM.8}
