Back to chapter figures
Box TS.1, Figure 1
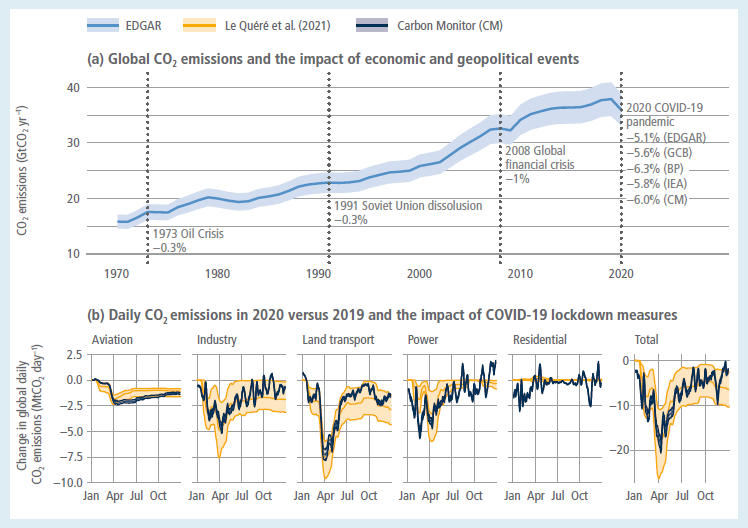
Figure caption
Box TS.1, Figure 1 | Global carbon emissions in 2020 and the impact of COVID-19. Panel (a) depicts carbon emissions from fossil fuel and industry over the past five decades. The single-year declines in emissions following major economic and geopolitical events are shown, as well as the decline recorded in five different datasets for emissions in 2020 compared to 2019. Panel (b) depicts the perturbation of daily carbon emissions in 2020 compared to 2019, showing the impact of COVID-19 lockdown policies. {Figure 2.6}