Box TS.6, Figure 1
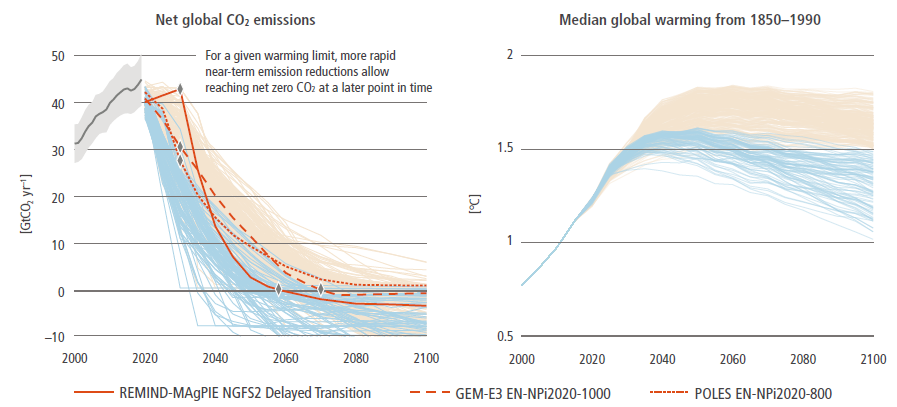
Figure caption
Box TS.6, Figure 1 | CO2 Emissions (panel (a)) and temperature change (panel (b)) of three alternative pathways limiting warming to 2°C (>67%) and reaching net zero CO2 emissions at different points in time. Limiting warming to a specific level can be consistent with a range of dates when net zero CO2 emissions need to be achieved. This difference in the date of net zero CO2 emissions reflects the different emissions profiles that are possible while staying within a specific carbon budget and the associated warming limit. Shifting the year of net zero to a later point in time (>2050), however, requires more rapid and deeper near-term emissions reductions (in 2030 and 2040) if warming is to be limited to the same level. Funnels show pathways limiting warming to 1.5°C (>50%) with no or limited overshoot (light blue) and limiting warming to 2°C (>67%) (beige).