Figure TS.10
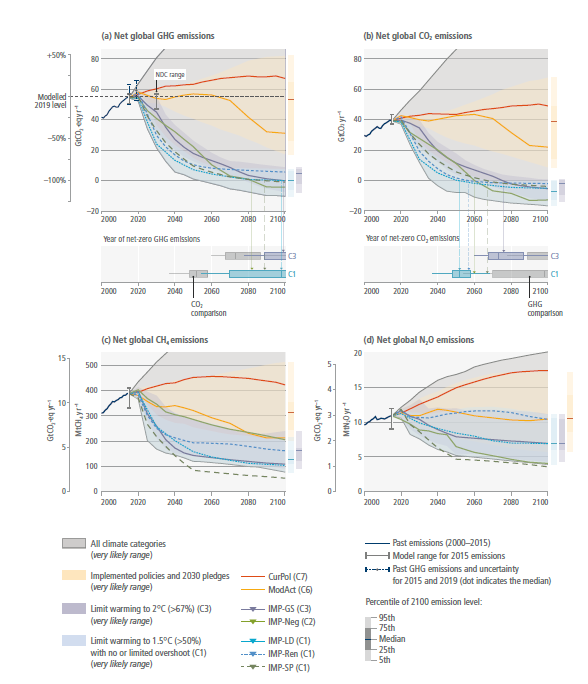
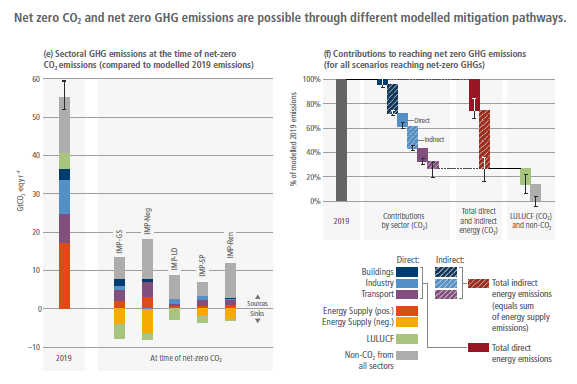
Figure caption
Figure TS.10 | Mitigation pathways that limit warming to 1.5°C, or 2°C, involve deep, rapid and sustained emissions reductions. Net zero CO2 and net zero GHG emissions are possible through different mitigation portfolios. Panels (a) and (b) show the development of global GHG and CO2 emissions in modelled global pathways (upper sub-panels) and the associated timing of when GHG and CO2 emissions reach net zero (lower sub-panels). Panels (c) and (d) show the development of global CH4 and N2O emissions, respectively. Coloured ranges denote the 5th to 95th percentile across pathways. The red ranges depict emissions pathways assuming policies that were implemented by the end of 2020 and pathways assuming implementation of NDCs (announced prior to COP26). Ranges of modelled pathways that limit warming to 1.5°C (>50%) with no or limited overshoot are shown in light blue (category C1) and pathways that limit warming to 2°C (>67%) are shown in light purple (category C3). The grey range comprises all assessed pathways (C1–C8) from the 5th percentile of the lowest warming category (C1) to the 95th percentile of the highest warming category (C8). The modelled pathway ranges are compared to the emissions from two pathways illustrative of high emissions (CurPol and ModAct) and five IMPs: IMP-LD, IMP-Ren, IMP-SP, IMP-Neg and IMP-GS. Emissions are harmonised to the same 2015 base year. The vertical error bars in 2015 show the 5–95th percentile uncertainty range of the non-harmonised emissions across the pathways, and the uncertainty range, and median value, in emission estimates for 2015 and 2019. The vertical error bars in 2030 (panel a) depict the assessed range of the NDCs, as announced prior to COP26.17 Panel (e) shows the sectoral contributions of CO2 and non-CO2 emissions sources and sinks at the time when net zero CO2 emissions are reached in the IMPs. Positive and negative emissions for different IMPs are compared to the GHG emissions from the year 2019. Energy supply (neg.) includes BECCS and DACCS. DACCS features in only two of the five IMPs (IMP-REN and IMP-GS) and contributes <1% and 64%, respectively, to the net negative emissions in Energy Supply (neg.). Panel (f) shows the contribution of different sectors and sources to the emissions reductions from a 2019 baseline for reaching net zero GHG emissions. Bars denote the median emissions reductions for all pathways that reach net zero GHG emissions. The whiskers indicate the p5–p95 range. The contributions of the service sectors (transport, buildings, industry) are split into direct (demand-side) as well as indirect (supply-side) CO2 emissions reductions. Direct emissions represent demand-side emissions due to the fuel use in the respective demand sector. Indirect emissions represent upstream emissions due to industrial processes and energy conversion, transmission and distribution. In addition, the contributions from the LULUCF sector and reductions from non-CO2 emissions sources (green and grey bars) are displayed. {3.3, 3.4}