Figure TS.15
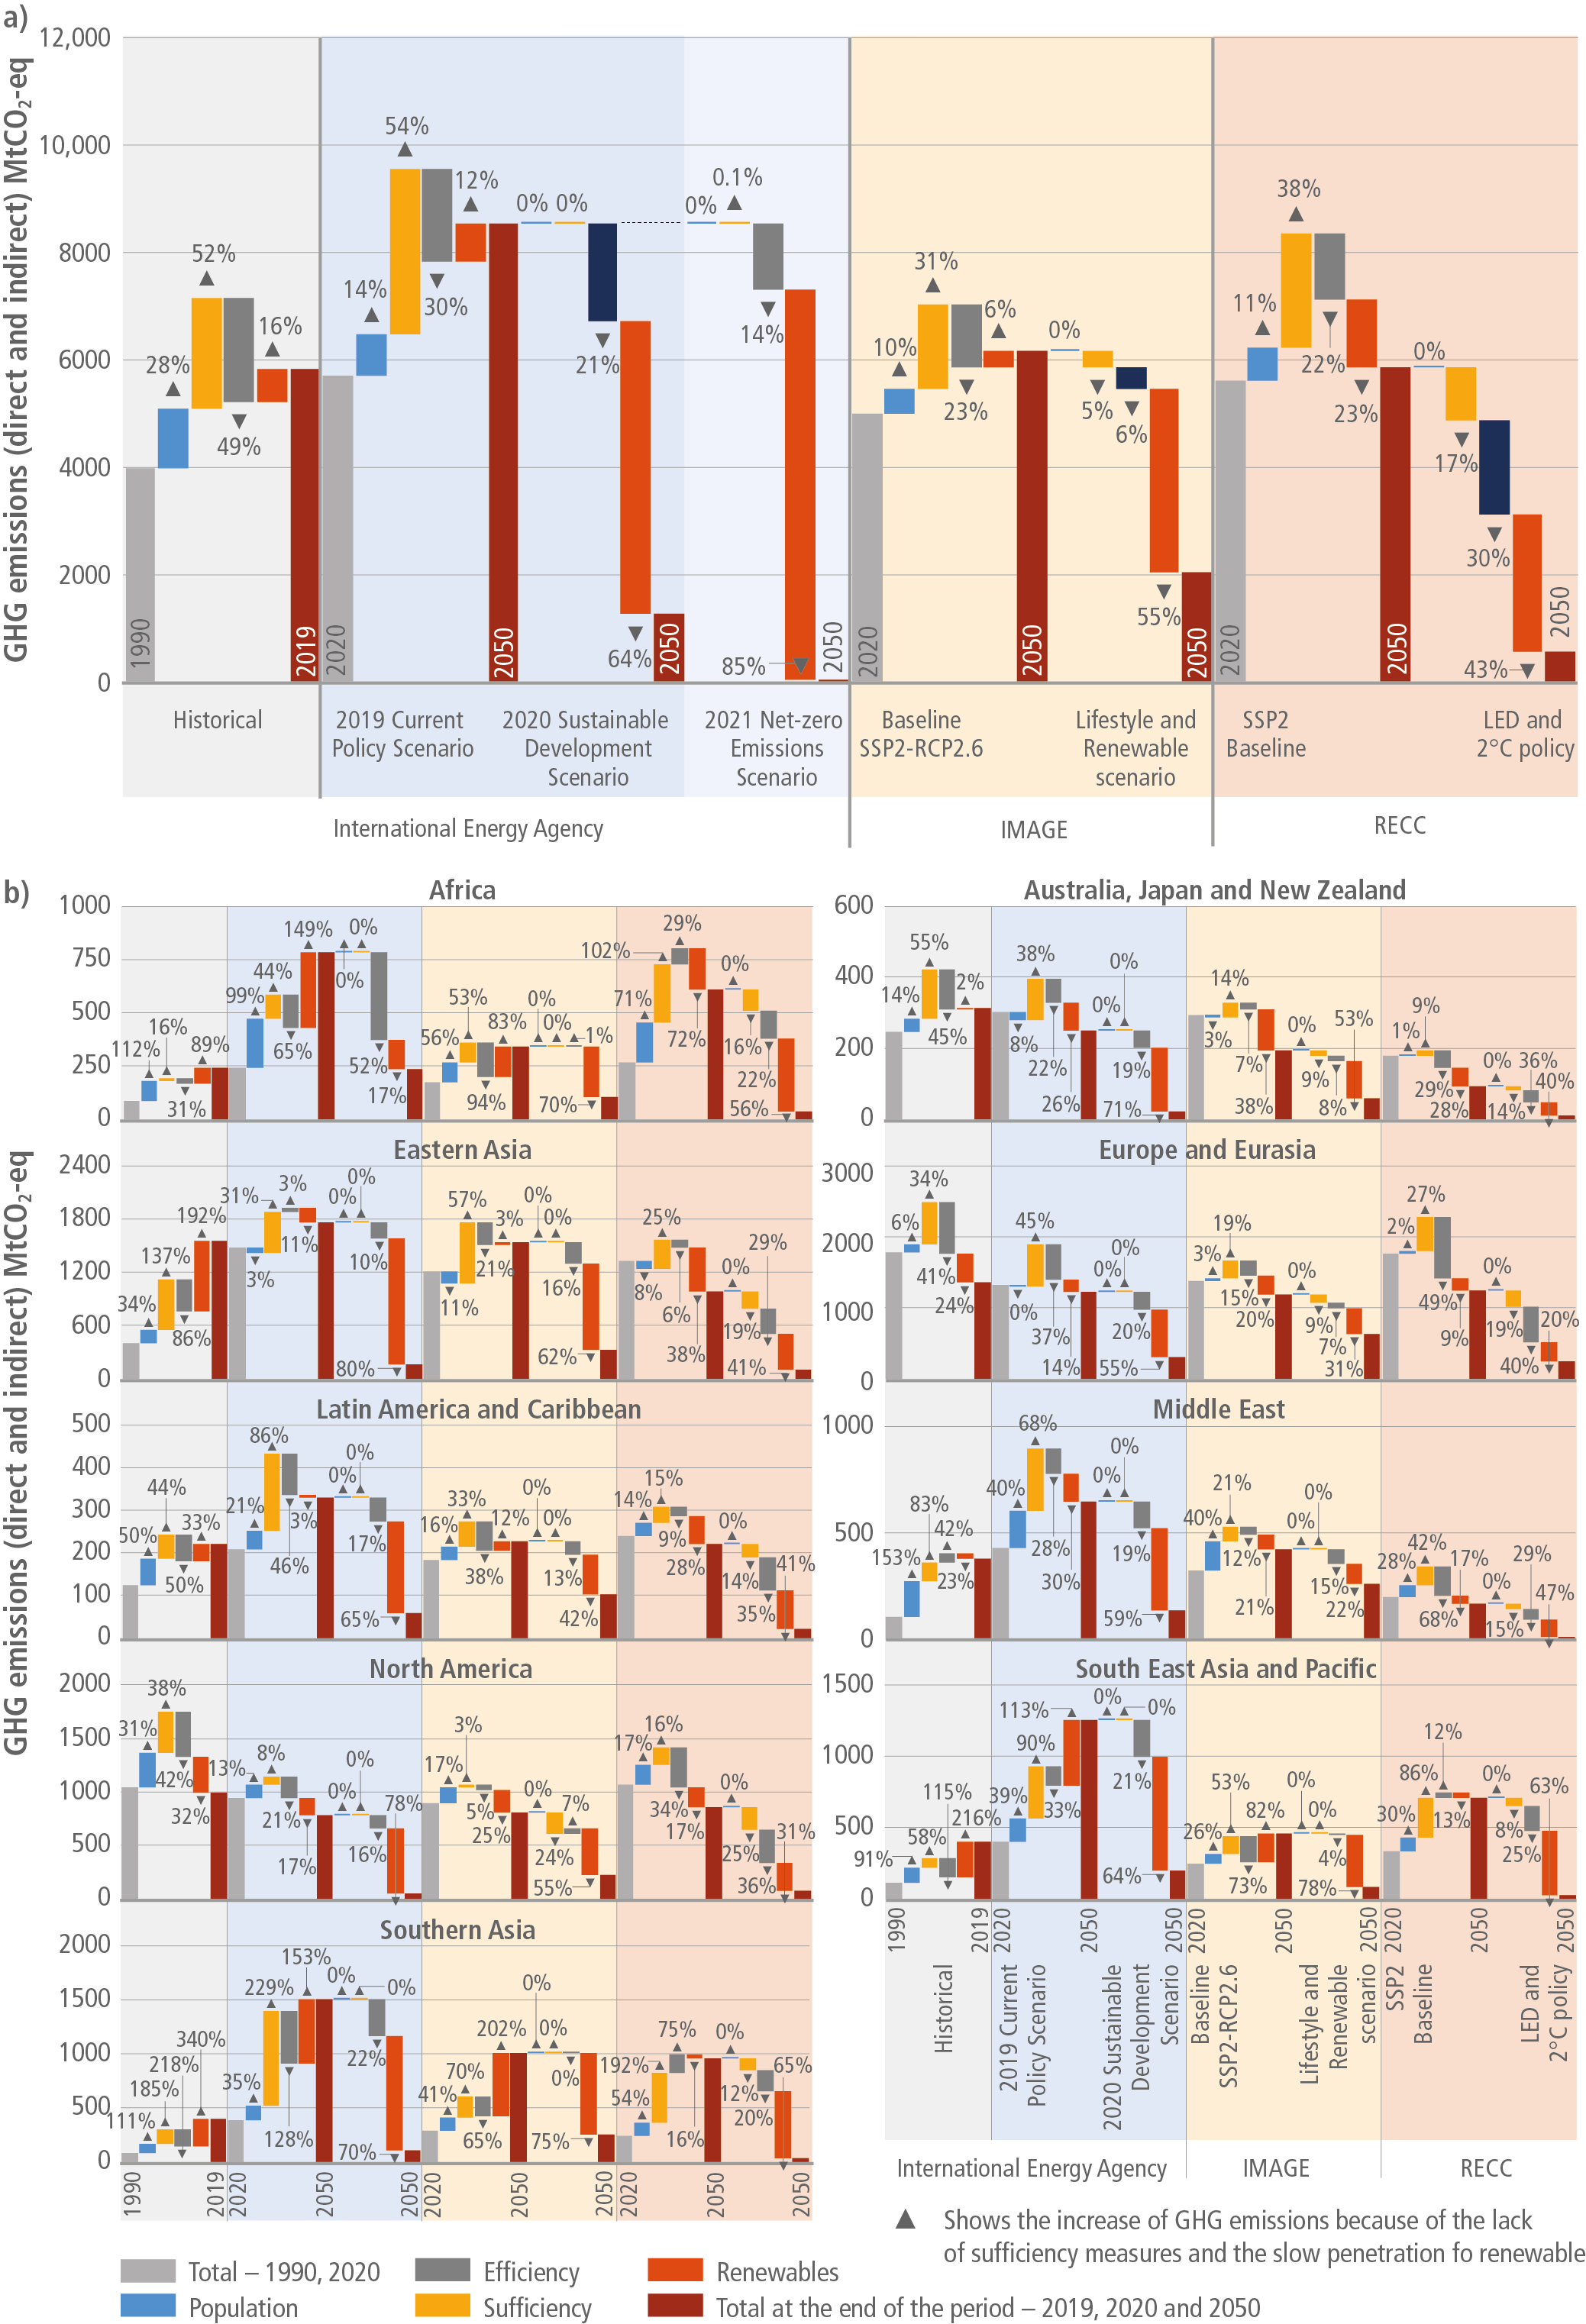
Figure caption
Figure TS.15 | Decompositions of changes in historical residential energy emissions 1990–2019, changes in emissions projected by baseline scenarios for 2020–2050, and differences between scenarios in 2050 using scenarios from three models: IEA, IMAGE, and RECC.15 (continued): Decompositions of changes in historical residential energy emissions 1990–2019, changes in emissions projected by baseline scenarios for 2020–2050, and differences between scenarios in 2050 using scenarios from three models: IEA, IMAGE, and RECC. RECC-LED data for (a) global, and (b) for nine world regions, include only space heating and cooling and water heating in residential buildings. Emissions are decomposed using the equation, which shows changes in driver variables of population, sufficiency (floor area per capita), efficiency (final energy per floor area), and renewables (GHG emissions per final energy). ‘Renewables’ is a summary term describing changes in GHG intensity of energy supply. Emission projections to 2050, and differences between scenarios in 2050, demonstrate mitigation potentials from the dimensions of the SER framework realised in each model scenario. In most regions, historical improvements in efficiency have been approximately matched by growth in floor area per capita. Implementing sufficiency measures that limit growth in floor area per capita, particularly in developed regions, reduces the dependence of climate mitigation on technological solutions. {Figure 9.5, Box 9.2}