Figure TS.2
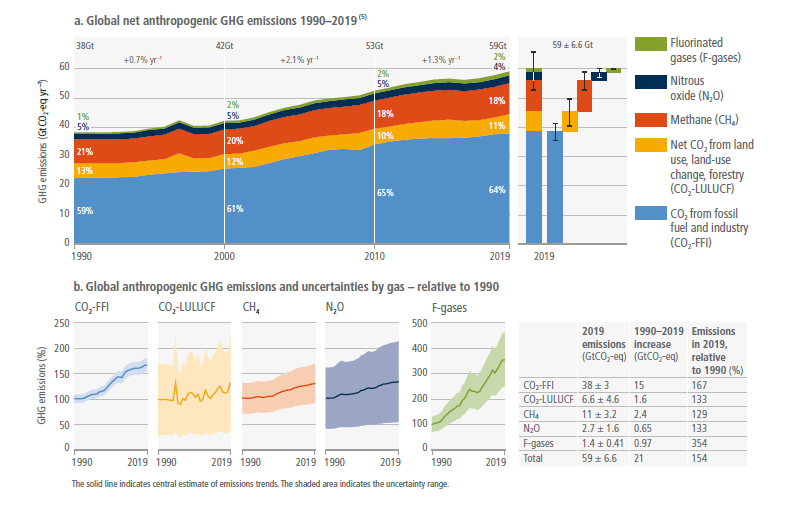
Figure caption
Figure TS.2 | Global net anthropogenic GHG emissions (GtCO2-eq yr–1) 1990–2019. Global net anthropogenic GHG emissions include CO2 from fossil fuel combustion and industrial processes (CO2-FFI); net CO2 from land use, land-use change and forestry (CO2-LULUCF)5; methane (CH4); nitrous oxide (N2O); and fluorinated gases (HFCs, PFCs, SF6, NF3).6 Panel a shows aggregate annual global net anthropogenic GHG emissions by groups of gases from 1990 to 2019 reported in GtCO2-eq converted based on global warming potentials with a 100-year time horizon (GWP100-AR6) from the IPCC Sixth Assessment Report Working Group I (Chapter 7). The fraction of global emissions for each gas is shown for 1990, 2000, 2010 and 2019; as well as the aggregate average annual growth rate between these decades. At the right side of Panel a, GHG emissions in 2019 are broken down into individual components with the associated uncertainties (90% confidence interval) indicated by the error bars: CO2-FFI ±8%; CO2-LULUCF ±70%; CH4 ±30%; N2O ±60%; F-gases ±30%; GHG ±11%. Uncertainties in GHG emissions are assessed in Supplementary Material 2.2. The single-year peak of emissions in 1997 was due to higher CO2-LULUCF emissions from a forest and peat fire event in South East Asia. Panel b shows global anthropogenic CO2-FFI, net CO2-LULUCF, CH4, N2O and F-gas emissions individually for the period 1990–2019, normalised relative to 100 in 1990. Note the different scale for the included F-gas emissions compared to other gases, highlighting its rapid growth from a low base. Shaded areas indicate the uncertainty range. Uncertainty ranges as shown here are specific for individual groups of greenhouse gases and cannot be compared. The table shows the central estimate for: absolute emissions in 2019; the absolute change in emissions between 1990 and 2019; and emissions in 2019 expressed as a percentage of 1990 emissions. {2.2, Figure 2.5, Supplementary Material 2.2, Figure TS.2}