Figure TS.23
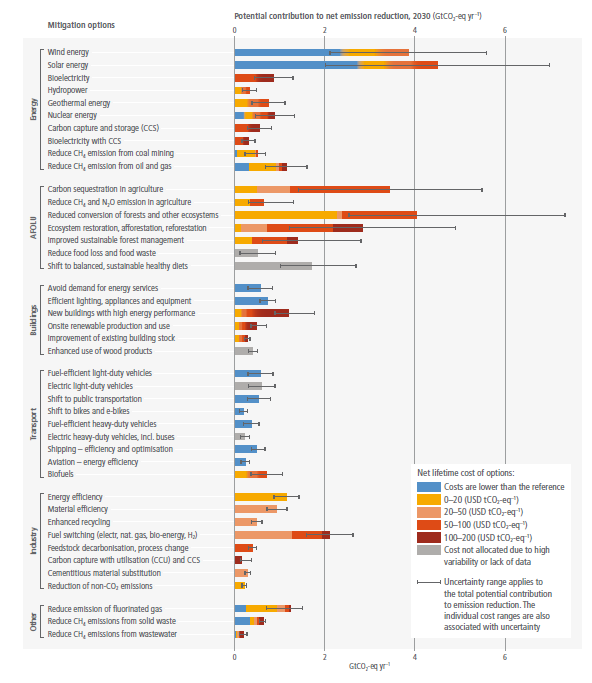
Figure caption
Figure TS.23 | Overview of emission mitigation options and their cost and potential for the year 2030. The mitigation potential of each option is the quantity of net greenhouse gas emission reductions that can be achieved by a given mitigation option relative to specified emission baselines that reflects what would be considered current policies in the period 2015–2019. Mitigation options may overlap or interact and cannot simply be summed together. The potential for each option is broken down into cost categories (see legend). Only monetary costs and revenues are considered. If costs are less than zero, lifetime monetary revenues are higher than lifetime monetary costs. For wind energy, for example, negative cost indicates that the cost is lower than that of fossil-based electricity production. The error bars refer to the total potential for each option. The breakdown into cost categories is subject to uncertainty. Where a smooth colour transition is shown, the breakdown of the potential into cost categories is not well researched, and the colours indicate only into which cost category the potential can predominantly be found in the literature. {Figure SPM.8, 6.4, Table 7.3, Supplementary Material Table 9.SM.2, Supplementary Material Table 9.SM.3, 10.6, 11.4, Figure 11.13, 12.2, Supplementary Material 12.SM.1.2.3}