Figure TS.25
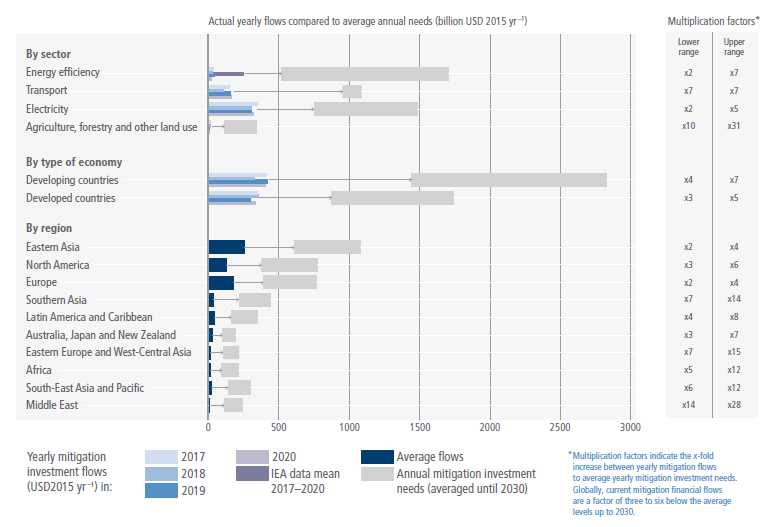
Figure caption
Figure TS.25 | Breakdown of recent average (downstream) mitigation investments and model-based investment requirements for 2020–2030 (USD billion) in scenarios that likely limit warming to 2°C or lower. Mitigation investment flows and model-based investment requirements by sector / segment (energy efficiency in buildings and industry, transport including efficiency, electricity generation, transmission and distribution including electrification, and agriculture, forestry and other land use), by type of economy, and by region (see Annex II Part I Section 1: By region is based on intermediate level (R10) classification scheme. By type of economy is based on intermediate level (R10) classification scheme, which considers ‘North America’, ‘Europe’, and ’Australia, Japan and New Zealand’ as developed countries, and the other seven regions as developing countries). Breakdown by sector / segment may differ slightly from sectoral analysis in other contexts due to the availability of investment needs data. The granularity of the models assessed in Chapter 3, and other studies, do not allow for a robust assessment of the specific investment needs of LDCs or SIDSs. Investment requirements in developing countries might be underestimated due to missing data points as well as underestimated technology costs. In modelled pathways, regional investments are projected to occur when and where they are cost cost-effective to limit global warming. The model quantifications help to identify high-priority areas for cost-effective investments, but do not provide any indication on who would finance the regional investments. Investment requirements and flows covering downstream / mitigation technology deployment only. Data includes investments with a direct mitigation effect, and in the case of electricity, additional transmission and distribution investments. See section 15.4.2 Quantitative assessment of financing needs for detailed data on investment requirements. Data on mitigation investment flows are based on a single series of reports (Climate Policy Initiative, CPI) which assembles data from multiple sources. Investment flows for energy efficiency are adjusted based on data from the International Energy Agency (IEA). Data on mitigation investments do not include technical assistance (i.e., policy and national budget support or capacity building), other non-technology deployment financing. Adaptation only flows are also excluded. Data on mitigation investment requirements for electricity are based on emission pathways C1, C2 and C3 (Table SPM.1). For electricity investment requirements, the upper end refers to the mean of C1 pathways and the lower end to the mean of C3 pathways. Data points for energy efficiency, transport and AFOLU cannot always be linked to C1–C3 scenarios. Data do not include needs for adaptation or general infrastructure investment or investment related to meeting the SDGs other than mitigation, which may be at least partially required to facilitate mitigation. The multiplication factors show the ratio of average annual model-based mitigation investment requirements (2020–2030) and most recent annual mitigation investments (averaged for 2017–2020). The lower and upper multiplication factors refer to the lower and upper ends of the range of investment needs.
Given the multiple sources and lack of harmonised methodologies, the data can only be indicative of the size and pattern of investment gaps. The gap between most recent flows and required investments is only a single indicator. A more comprehensive (and qualitative) assessment is required in order to understand the magnitude of the challenge of scaling up investment in sectors and regions. The analysis also does not consider the effects of misaligned flows. {15.3, 15.4, 15.5, Table 15.2, Table 15.3, Table 15.4}