Figure TS.31
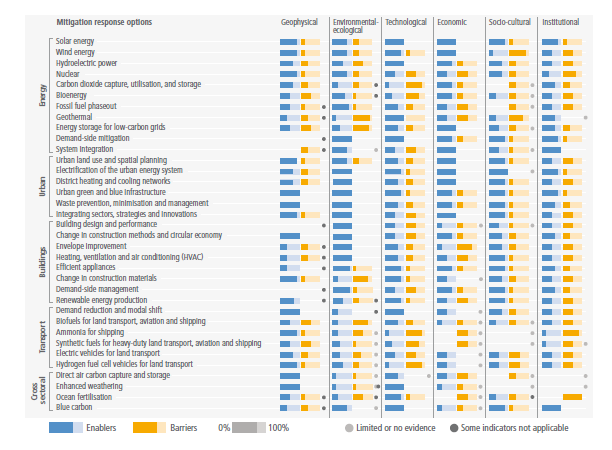
Figure caption
Figure TS.31 | Geophysical, environmental-ecological, technological, economic, socio-cultural and institutional factors can enable or act as barriers to the deployment of response options. Chapter-level assessment for selected mitigation options. Overlaps may exist in the mitigation options assessed and presented by sector and system, and feasibility might differ depending on the demarcation of that option in each sector. Chapters 6, 8, 9, 10, and 12 assess mitigation response options across six feasibility dimensions: geophysical, environmental-ecological, technological, economic, socio-cultural and institutional. AFOLU (Chapter 7) and industry (Chapter 11) are not included because of the heterogeneity of options in these sectors. For each dimension, a set of feasibility indicators was identified. Examples of indicators include impacts on land use, air pollution, economic costs, technology scalability, public acceptance and political acceptance (see Box TS.15, and Annex II.IV.11 for a detailed explanation). An indicator could refer to a barrier or an enabler to implementation, or could refer to both a barrier or an enabler, depending on the context, speed, and scale of implementation. Dark blue bars indicate the extent of enablers to deployment within each dimension. This is shown relative to the maximum number of possible enablers, as indicated by the light blue shading. Dark orange bars indicate the extent of barriers to deployment within each dimension. This is shown relative to the maximum number of possible barriers, as indicated by light orange shading. A light grey dot indicates that there is limited or no evidence to assess the option. A dark grey dot indicates that one of the feasibility indicators within that dimension is not relevant for the deployment of the option. The relevant sections in the underlying chapters include references to the literature on which the assessment is based and indicate whether the feasibility of an option varies depending on context (e.g., region), scale (e.g., small, medium or full scale), speed (e.g., implementation in 2030 versus 2050) and warming level (e.g., 1.5°C versus 2°C). {6.4, 8.5, 9.10, 10.8, 12.3, Annex II.IV.11}