Figure TS.32
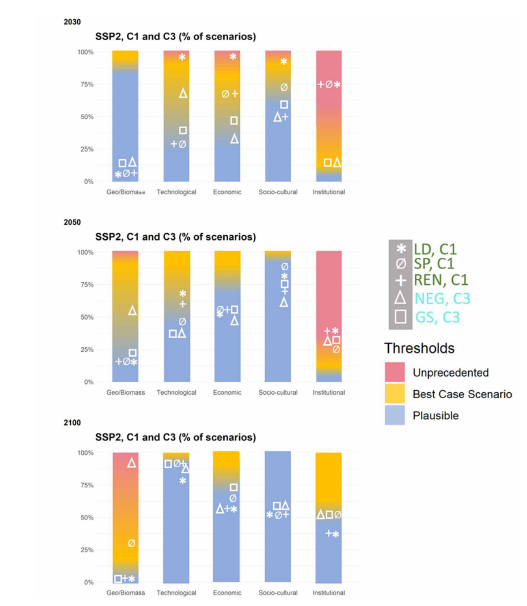
Figure caption
Figure TS.32 | The feasibility of mitigation scenarios. Figure TS.32 shows the proportion of scenarios in the AR6 scenarios database – falling within the warming level classifications C1 and C3 (C1: below 1.5°C (>50%), no or limited overshoot; C3: below 2°C (>67%)) – that exceed threshold values in 2030, 2050 and 2100 for five dimensions of feasibility (Boxes TS.5 and TS.15). The feasibility dimensions shown are: geophysical, technological, economic, socio-cultural and institutional. The thresholds shown are: (i) plausible – range of values based on past historical trends or other peer reviewed assessments; (ii) best-case scenario – range of values assuming major political support or technological breakthrough; (iii) unprecedented – values going beyond those observed or reported in peer-reviewed assessments. Overlayed are the Illustrative Mitigation Pathways consistent with SSP2 (LD, SP, Ren: C1 category; Neg, GS: C3 category). The positioning of the illustrative pathways is simply indicative of the general trade-offs over time and across the feasibility dimensions, it is not determined mathematically. (Box TS.5) {3.8}