Figure TS.4
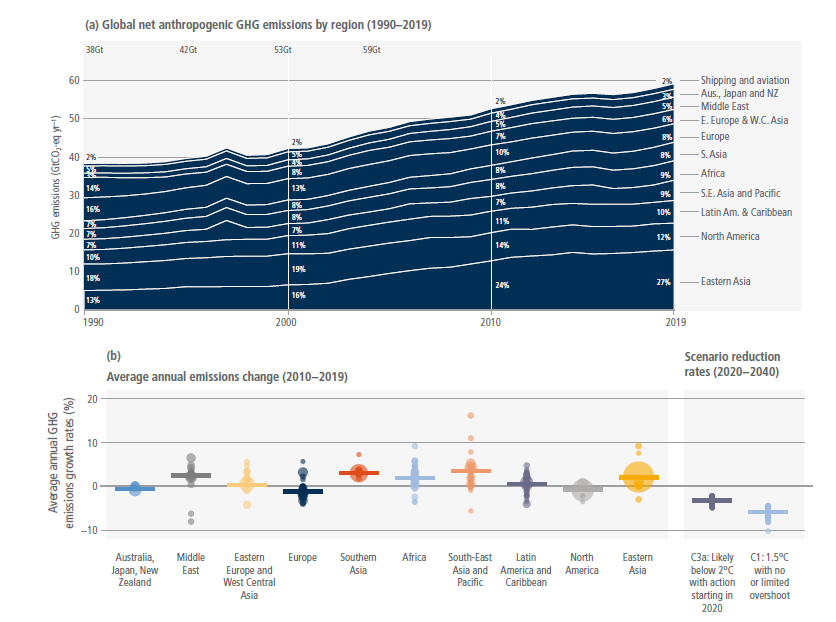
Figure caption
Figure TS.4 | Emissions have grown in most regions, although some countries have achieved sustained emission reductions in line with 2°C scenarios. Figure TS.4 (continued): Emissions have grown in most regions, although some countries have achieved sustained emission reductions in line with 2°C scenarios. Change in regional GHG emissions and rates of change compatible with warming targets. Panel (a): Regional GHG emission trends (in GtCO2-eq yr –1 (GWP100; AR6) for the time period 1990–2019. Panel (b): Historical GHG emissions change by region (2010–2019). Circles depict countries, scaled by total emissions in 2019, short horizontal lines depict the average change by region. Also shown are global rates of reduction over the period 2020–2040 in scenarios assessed in AR6 that limit global warming to 1.5°C and 2°C with different probabilities. The 5–95th percentile range of emissions changes for scenarios below 1.5°C with no or limited overshoot (scenario category C1) and scenarios below 2°C (>67%) with immediate action (scenario category C3a) are shown as a shaded area with a horizontal line at the mean value. Panel b excludes CO2 LULUCF due to a lack of consistent historical national data, and International Shipping and Aviation, which cannot be allocated to regions. Global rates of reduction in scenarios are shown for illustrative purposes only and do not suggest rates of reduction at the regional or national level. {Figures 2.9 and 2.11}