Figure TS.5
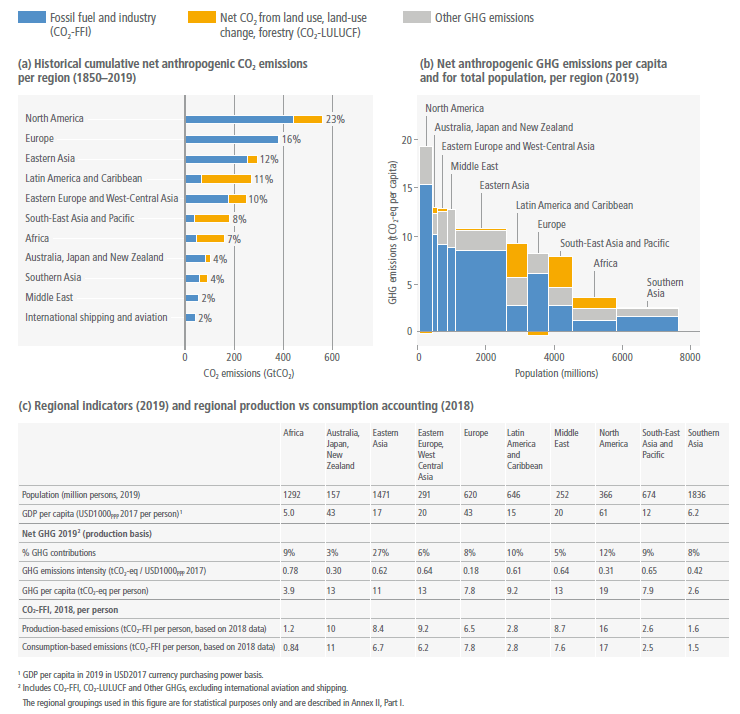
Figure caption
Figure TS.5 | Global emissions are distributed unevenly, both in the present day and cumulatively since 1850. Panel (a) shows the distribution of regional GHG emissions in tonnes CO2-eq per capita by region in 2019. GHG emissions are categorised into: CO2 fossil fuel and industry (CO2-FFI); CO2 land use, land-use change and forestry (CO2-LULUCF); and other GHG emissions (CH4, nitrous oxide, F-gas, expressed in CO2-eq using GWP100). The height of each rectangle shows per-capita emissions, the width shows the population of the region, so that the area of the rectangles refers to the total emissions for each regional. Percentages refer to overall GHG contributions to total global emissions in 2019. Emissions from international aviation and shipping are not included. Panel (b) shows the share of historical net CO2 emissions per region from 1850 to 2019. This includes CO2-FFI and CO2-LULUCF (GtCO2). Other GHG emissions are not included. Emissions from international aviation and shipping are included. Panel (c) shows population, GDP per person, emission indicators by region in 2019 for percentage GHG contributions, total GHG per person, and total GHG emissions intensity, together with production-based and consumption-based CO2-FFI data, which is assessed in this report up to 2018. Consumption-based emissions are emissions released to the atmosphere in order to generate the goods and services consumed by a certain entity (e.g., region). Emissions from international aviation and shipping are not included. {1.3, Figure 1.2a, 2.2, Figure 2.10}