Figure TS.9
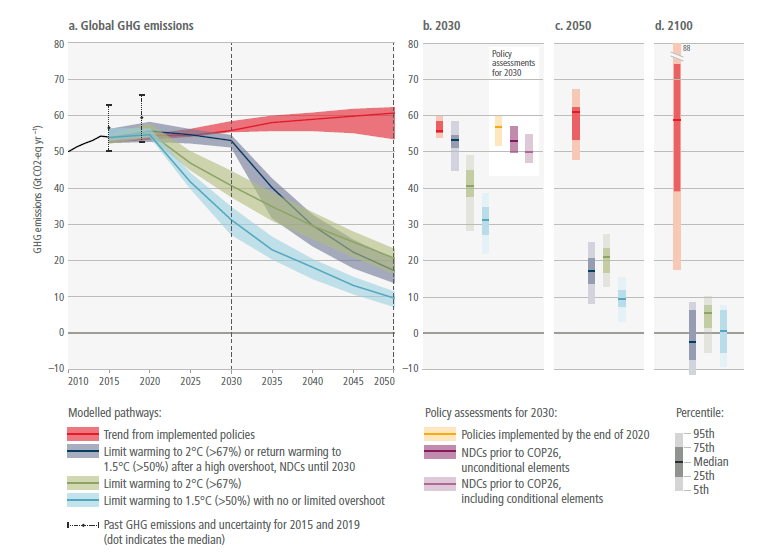
Figure caption
Figure TS.9 | Aggregate greenhouse gas (GHG) emissions of global mitigation pathways (coloured funnels and bars) and projected emission outcomes from current policies and emissions implied by unconditional and conditional elements of NDCs, based on updates available by 11 October 2021 (grey bars). Shaded areas show GHG emission medians and 25–75th percentiles over 2020–2050 for four types of pathways in the AR6 scenario database: (i) pathways with near-term emissions developments in line with current policies and extended with comparable ambition levels beyond 2030; (ii) pathways likely to limit warming to 2°C with near-term emissions developments reflecting 2030 emissions implied by current NDCs followed by accelerated emissions reductions; (iii) pathways likely to limit warming to 2°C based on immediate actions from 2020 onwards; (iv) pathways that limit warming to 1.5°C with no or limited overshoot. Right-hand panels show two snapshots of the 2030 and 2050 emission ranges of the pathways in detail (median, 25–75th and 5–95th percentiles). The 2030 snapshot includes the projected emissions from the implementation of the NDCs as assessed in Section 4.2 (Table 4.1; median and full range). Historic GHG emissions trends as used in model studies are shown for 2010–2015. GHG emissions are in CO2-equivalent using GWP100 values from AR6. {3.5, Table 4.1, Cross-Chapter Box 4 in Chapter 4}