Figure 2.1
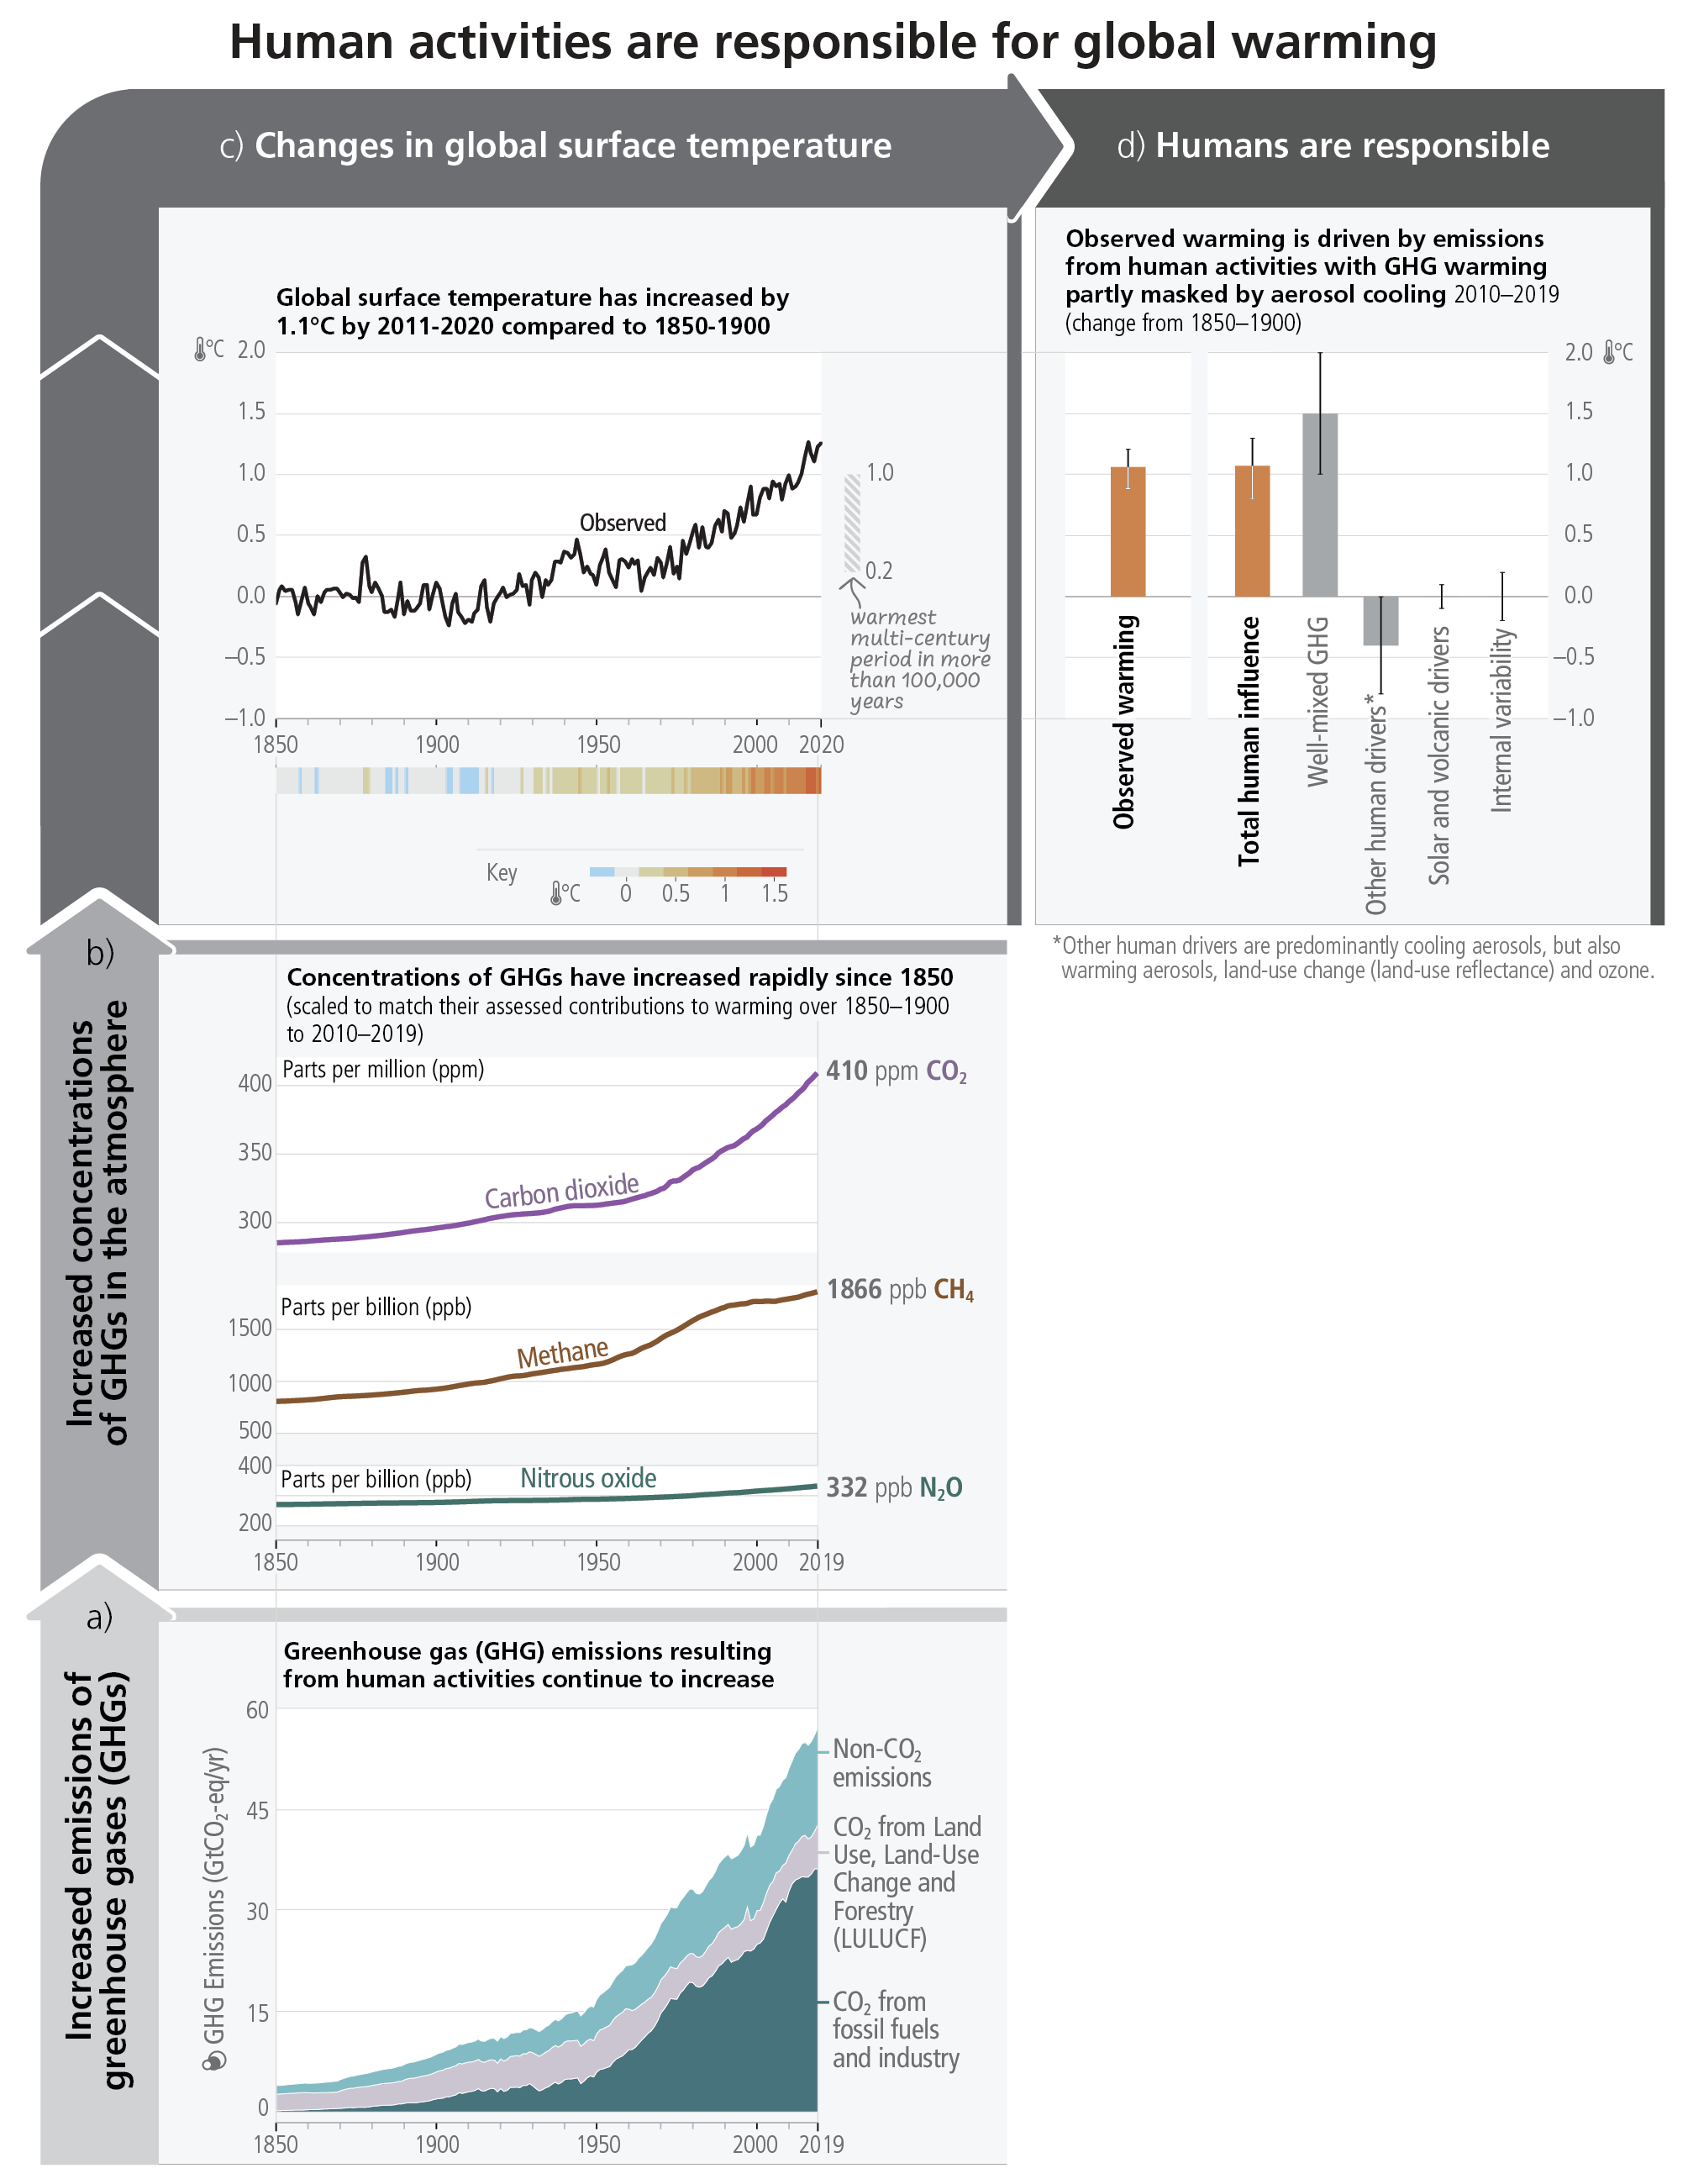
Figure caption
Figure 2.1: The causal chain from emissions to resulting warming of the climate system. Emissions of GHG have increased rapidly over recent decades (panel (a)). Global net anthropogenic GHG emissions include CO2 from fossil fuel combustion and industrial processes (CO2-FFI) (dark green); net CO2 from land use, land-use change and forestry (CO2- LULUCF) (green); CH4; N2O; and fluorinated gases (HFCs, PFCs, SF6, NF3) (light blue). These emissions have led to increases in the atmospheric concentrations of several GHGs including the three major well-mixed GHGs CO2, CH4 and N2O (panel (b), annual values). To indicate their relative importance each subpanel’s vertical extent for CO2, CH4 and N2O is scaled to match the assessed individual direct effect (and, in the case of CH4 indirect effect via atmospheric chemistry impacts on tropospheric ozone) of historical emissions on temperature change from 1850–1900 to 2010–2019. This estimate arises from an assessment of effective radiative forcing and climate sensitivity. The global surface temperature (shown as annual anomalies from a 1850–1900 baseline) has increased by around 1.1°C since 1850–1900 (panel (c)). The vertical bar on the right shows the estimated temperature (very likely range) during the warmest multicentury period in at least the last 100,000 years, which occurred around 6500 years ago during the current interglacial period (Holocene). Prior to that, the next most recent warm period was about 125,000 years ago, when the assessed multicentury temperature range [0.5°C–1.5℃] overlaps the observations of the most recent decade. These past warm periods were caused by slow (multi-millennial) orbital variations. Formal detection and attribution studies synthesise information from climate models and observations and show that the best estimate is that all the warming observed between 1850– 1900 and 2010–2019 is caused by humans (panel (d)). The panel shows temperature change attributed to: total human influence; its decomposition into changes in GHG concentrations and other human drivers (aerosols, ozone and land-use change (land-use reflectance)); solar and volcanic drivers; and internal climate variability. Whiskers show likely ranges. {WGI SPM A.2.2, WGI Figure SPM.1, WGI Figure SPM.2, WGI TS2.2, WGI 2.1; WGIII Figure SPM.1, WGIII A.III.II.2.5.1}