Figure 2.3
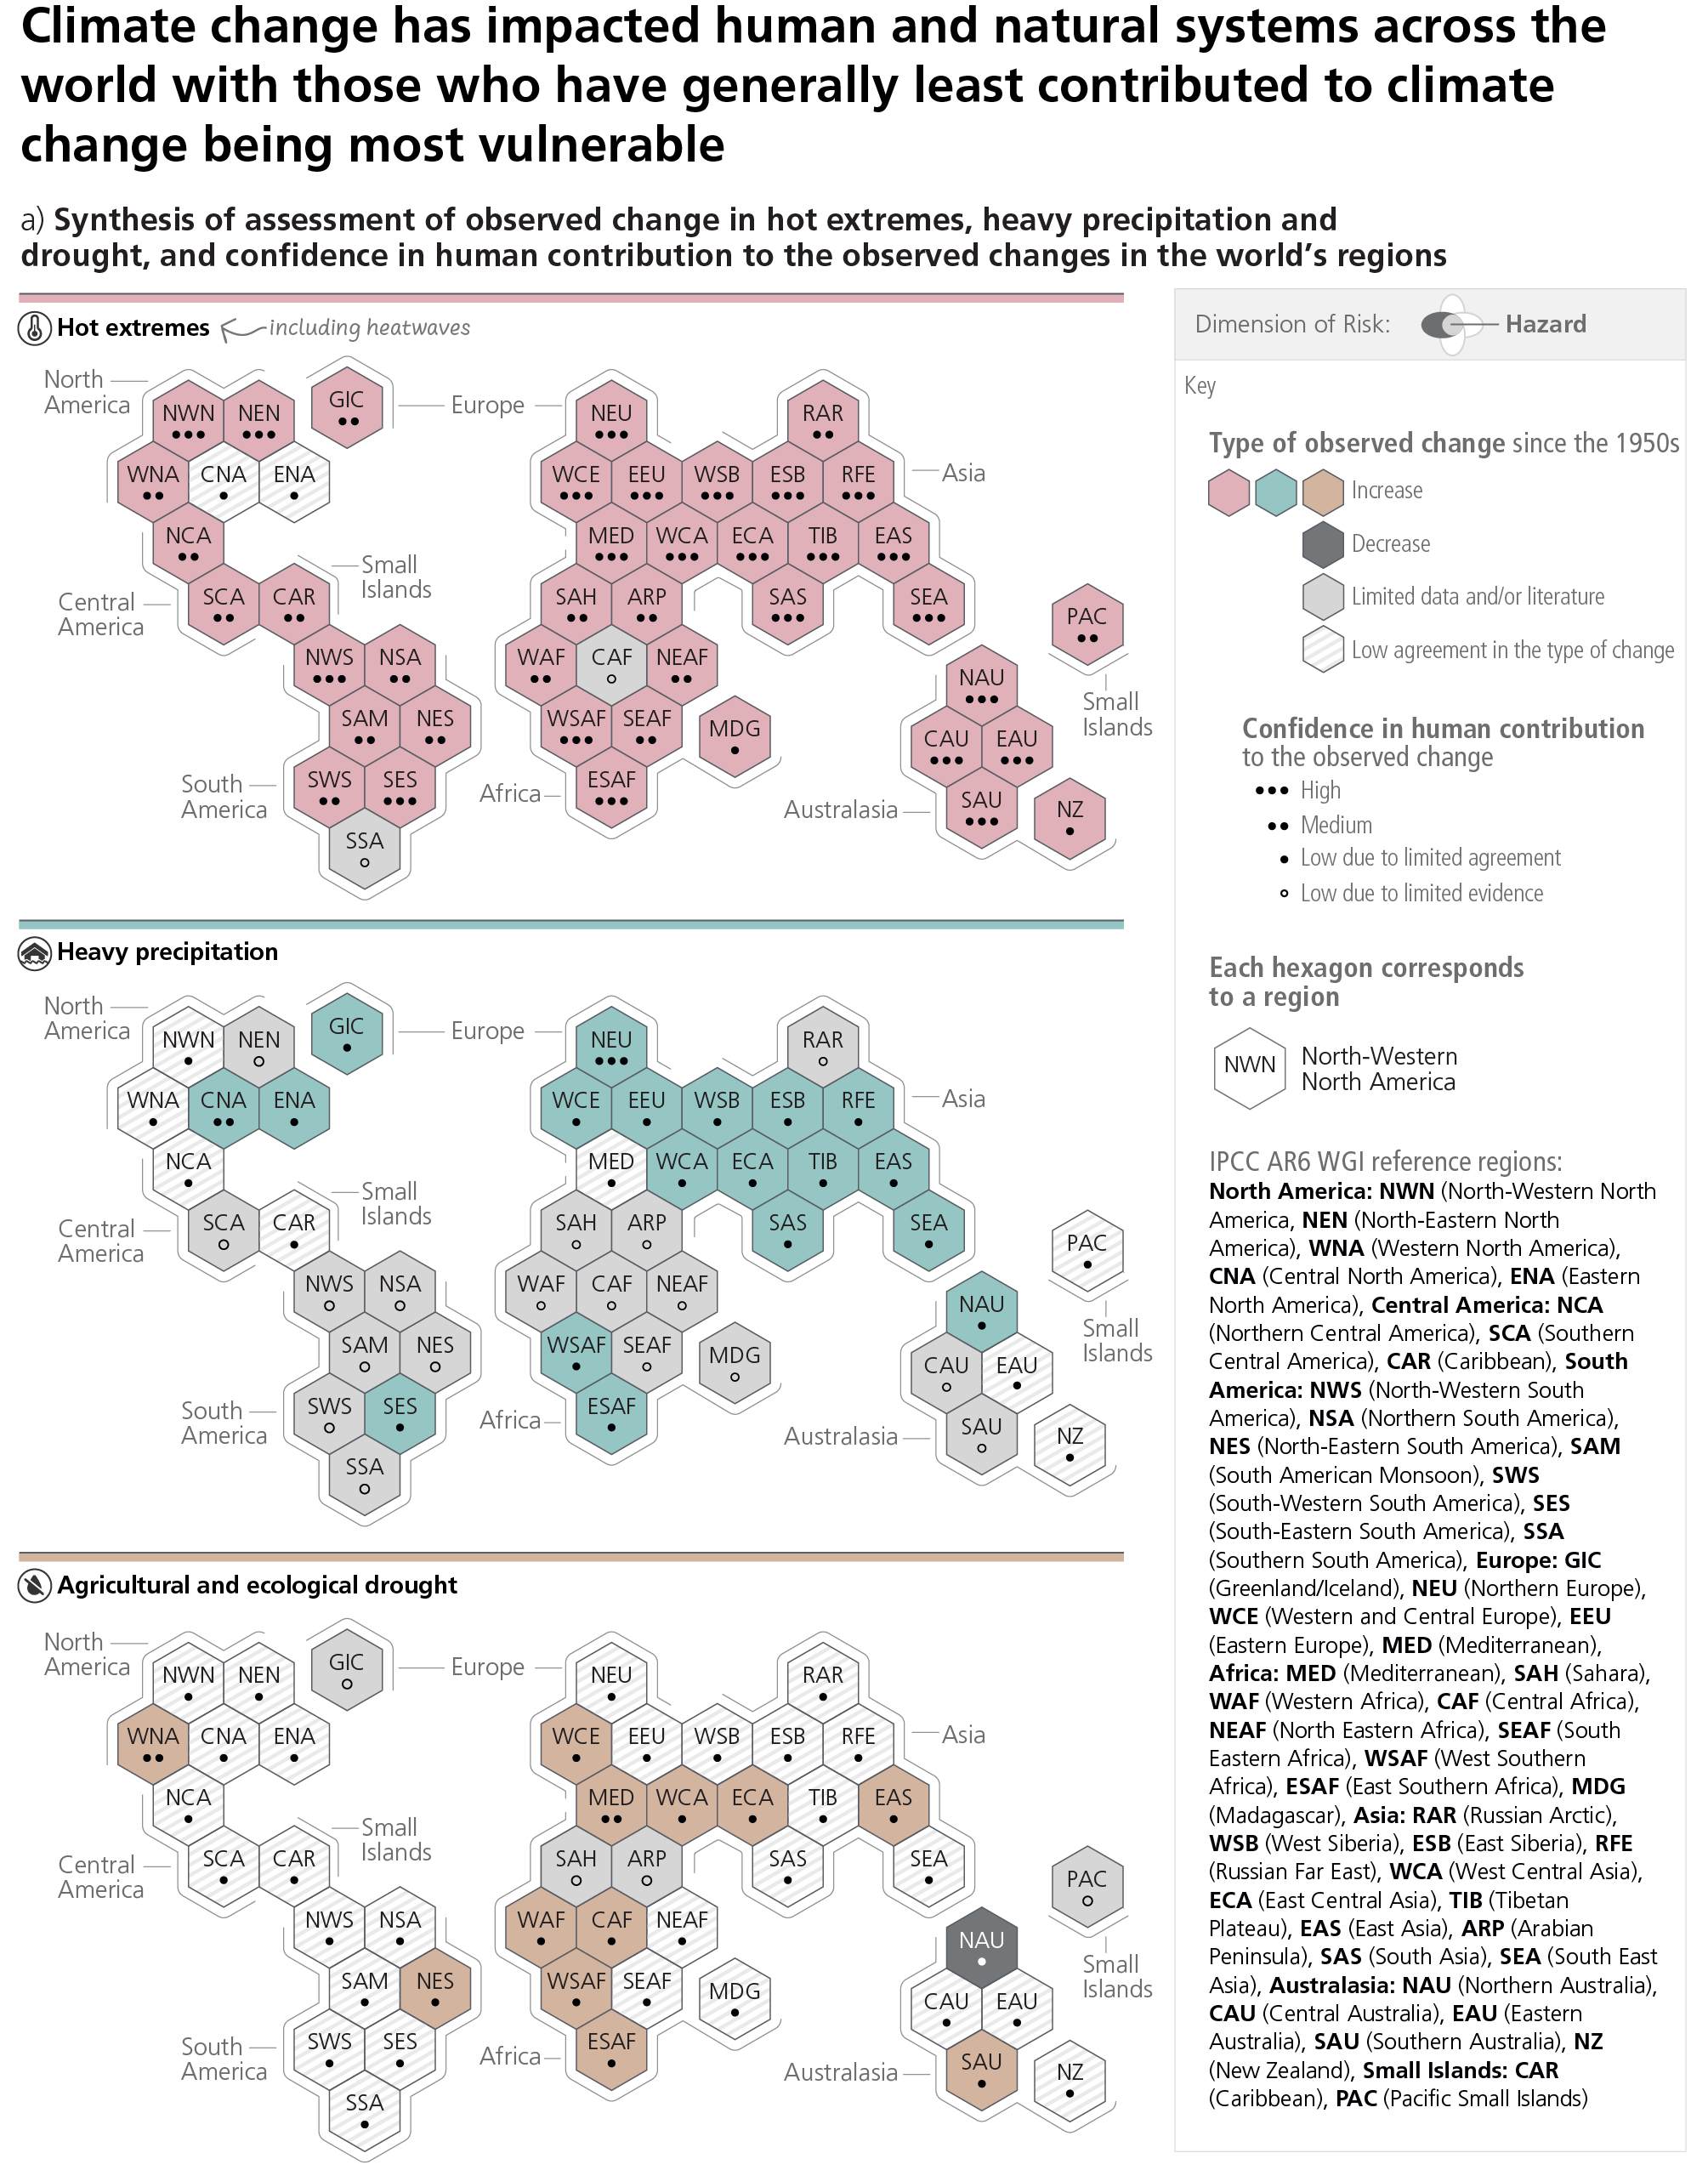
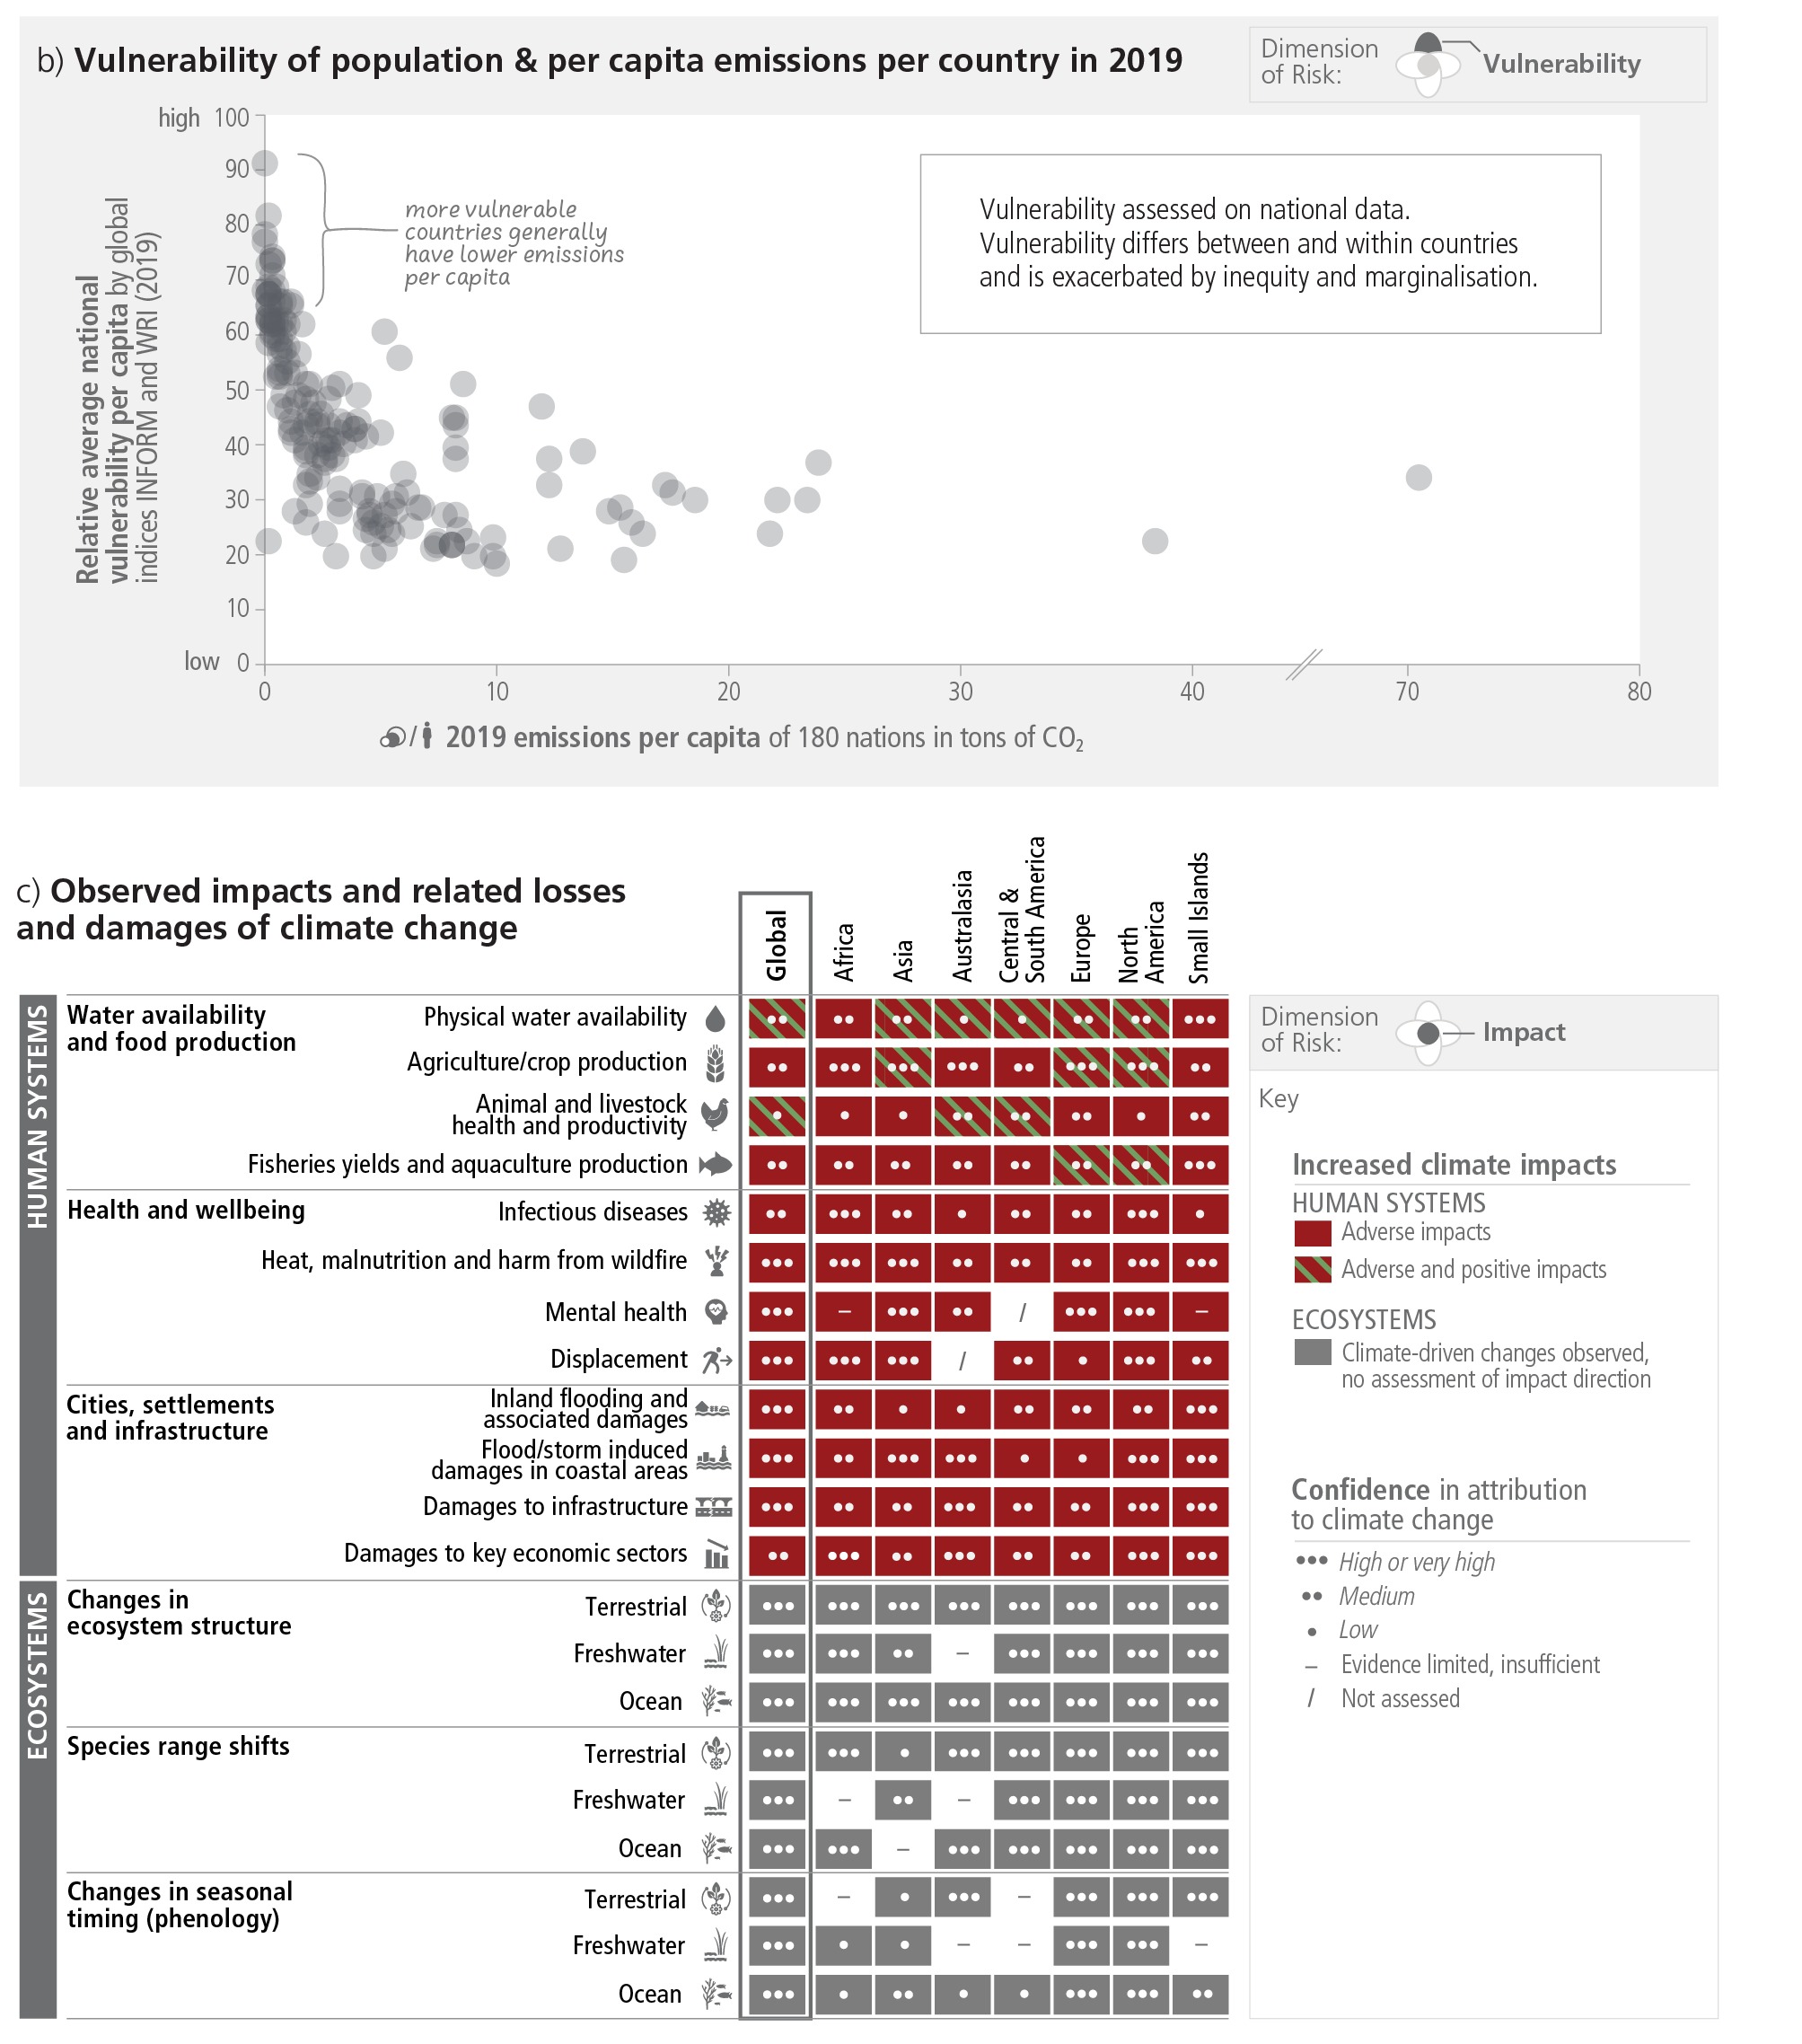
Figure caption
Figure 2.3: Both vulnerability to current climate extremes and historical contribution to climate change are highly heterogeneous with many of those who have least contributed to climate change to date being most vulnerable to its impacts. Panel (a) The IPCC AR6 WGI inhabited regions are displayed as hexagons with identical size in their approximate geographical location (see legend for regional acronyms). All assessments are made for each region as a whole and for the 1950s to the present. Assessments made on different time scales or more local spatial scales might differ from what is shown in the figure. The colours in each panel represent the four outcomes of the assessment on observed changes. Striped hexagons (white and light-grey) are used where there is low agreement in the type of change for the region as a whole, and grey hexagons are used when there is limited data and/or literature that prevents an assessment of the region as a whole. Other colours indicate at least medium confidence in the observed change. The confidence level for the human influence on these observed changes is based on assessing trend detection and attribution and event attribution literature, and it is indicated by the number of dots: three dots for high confidence, two dots for medium confidence and one dot for low confidence (single, filled dot: limited agreement; single, empty dot: limited evidence). For hot extremes, the evidence is mostly drawn from changes in metrics based on daily maximum temperatures; regional studies using other indices (heatwave duration, frequency and intensity) are used in addition. For heavy precipitation, the evidence is mostly drawn from changes in indices based on one-day or five-day precipitation amounts using global and regional studies. Agricultural and ecological droughts are assessed based on observed and simulated changes in total column soil moisture, complemented by evidence on changes in surface soil moisture, water balance (precipitation minus evapotranspiration) and indices driven by precipitation and atmospheric evaporative demand. Panel (b) shows the average level of vulnerability amongst a country’s population against 2019 CO2-FFI emissions per- capita per country for the 180 countries for which both sets of metrics are available. Vulnerability information is based on two global indicator systems, namely INFORM and World Risk Index. Countries with a relatively low average vulnerability often have groups with high vulnerability within their population and vice versa. The underlying data includes, for example, information on poverty, inequality, health care infrastructure or insurance coverage. Panel (c) Observed impacts on ecosystems and human systems attributed to climate change at global and regional scales. Global assessments focus on large studies, multi-species, meta-analyses and large reviews. Regional assessments consider evidence on impacts across an entire region and do not focus on any country in particular. For human systems, the direction of impacts is assessed and both adverse and positive impacts have been observed e.g., adverse impacts in one area or food item may occur with positive impacts in another area or food item (for more details and methodology see WGII SMTS.1). Physical water availability includes balance of water available from various sources including ground water, water quality and demand for water. Global mental health and displacement assessments reflect only assessed regions. Confidence levels reflect the assessment of attribution of the observed impact to climate change. {WGI Figure SPM.3, Table TS.5, Interactive Atlas; WGII Figure SPM.2, WGII SMTS.1, WGII 8.3.1, Figure 8.5; WGIII 2.2.3}