Figure 2.5
Back to all figures
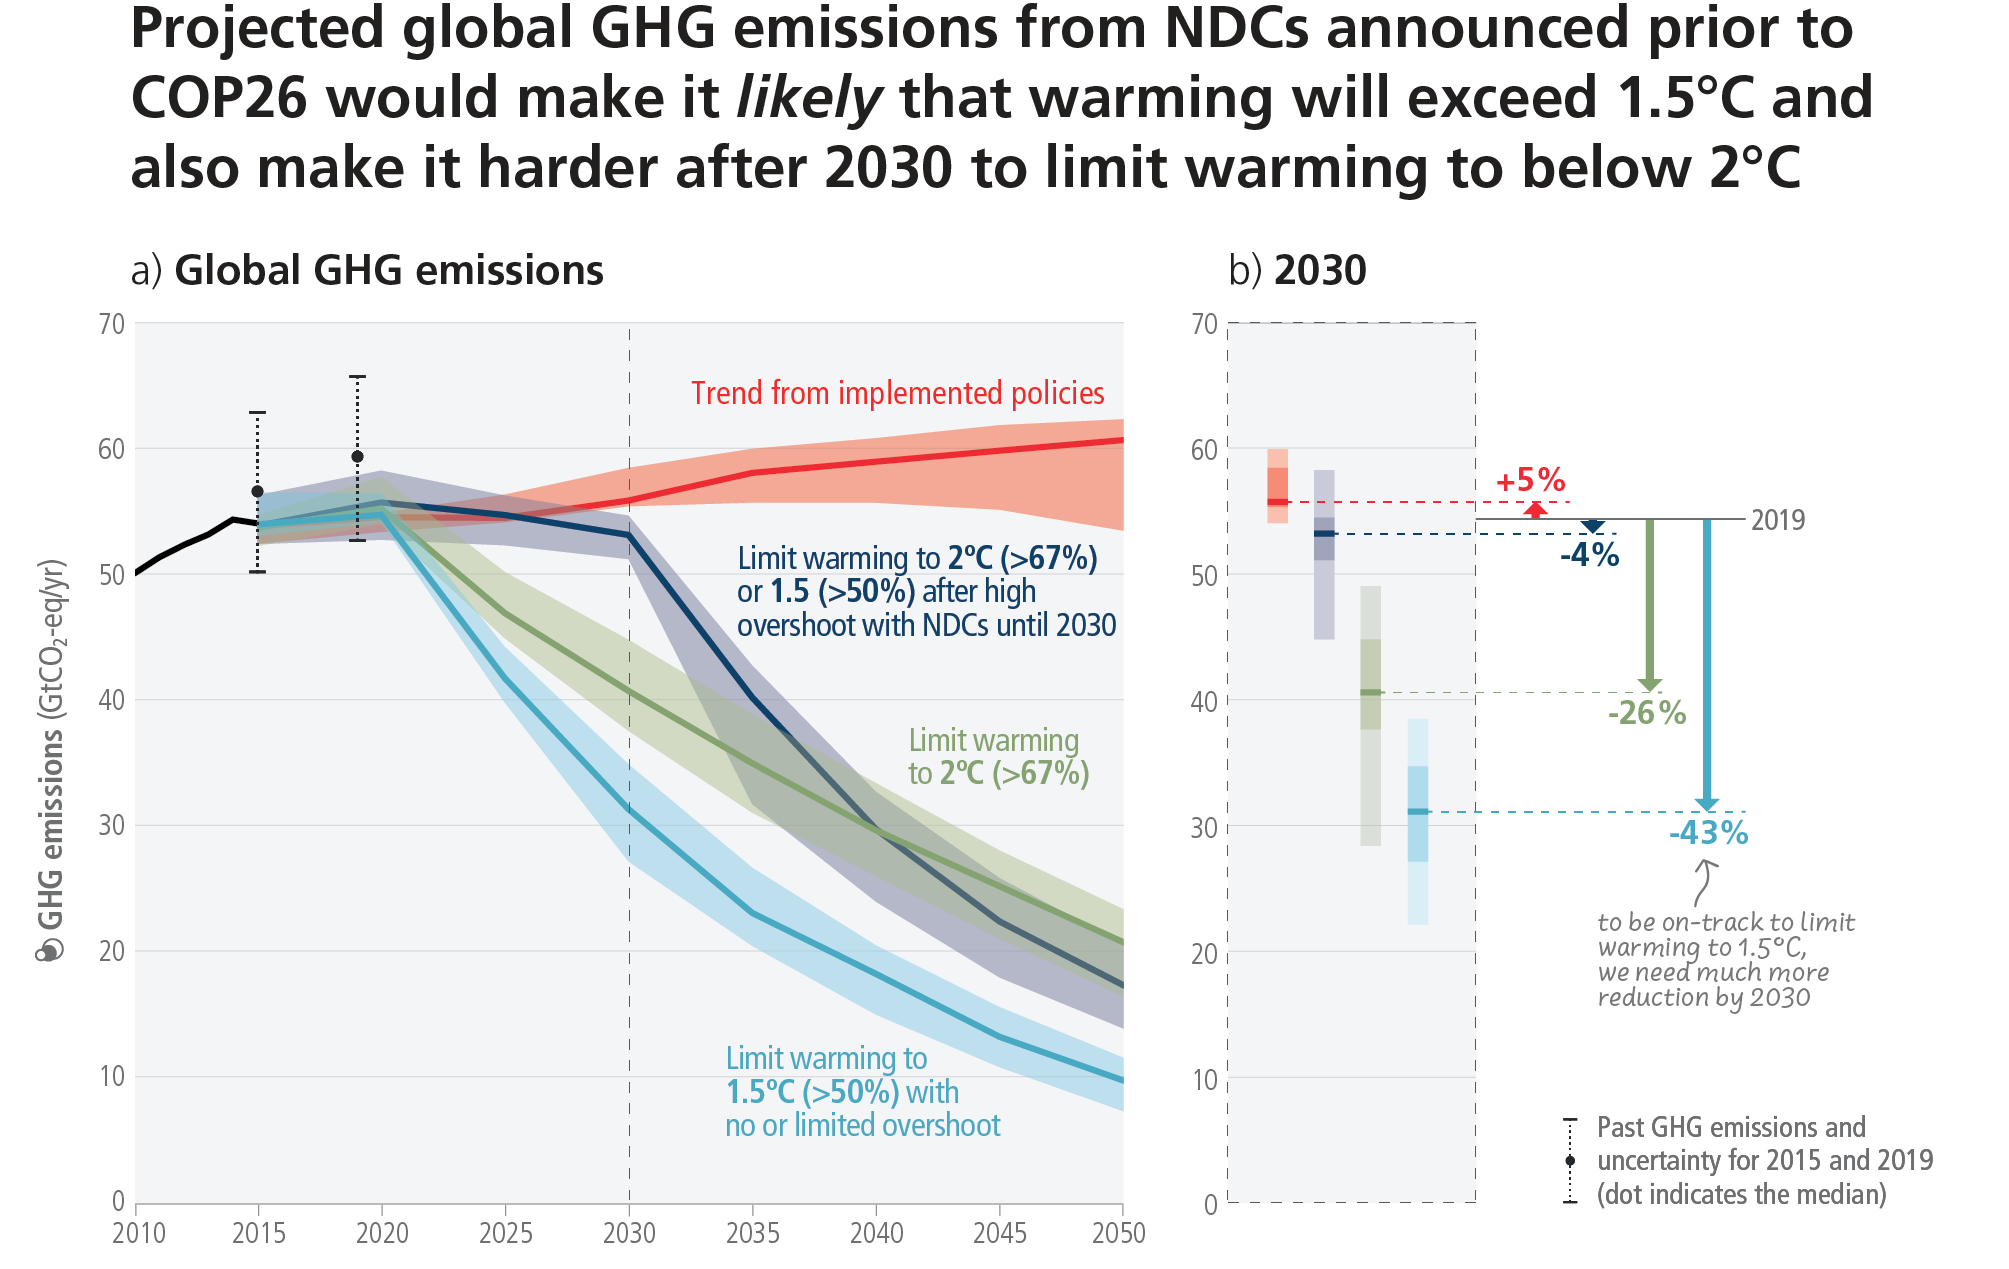
Figure caption
Figure 2.5 Global GHG emissions of modelled pathways (funnels in Panel a), and projected emission outcomes from near-term policy assessments for 2030 (Panel b). Panel a shows global GHG emissions over 2015–2050 for four types of assessed modelled global pathways:
- Trend from implemented policies: Pathways with projected near-term GHG emissions in line with policies implemented until the end of 2020 and extended with comparable ambition levels beyond 2030 (29 scenarios across categories C5–C7, WGIII Table SPM.2);
- Limit to 2°C (>67%) or return warming to 1.5°C (>50%) after a high overshoot, NDCs until 2030: Pathways with GHG emissions until 2030 associated with the implementation of NDCs announced prior to COP26, followed by accelerated emissions reductions likely to limit warming to 2°C (C3b, WGIII Table SPM.2) or to return warming to 1.5°C with a probability of 50% or greater after high overshoot (subset of 42 scenarios from C2, WGIII Table SPM.2).
- Limit to 2°C (>67%) with immediate action: Pathways that limit warming to 2°C (>67%) with immediate action after 2020 (C3a, WGIII Table SPM.2).
- Limit to 1.5°C (>50%) with no or limited overshoot: Pathways limiting warming to 1.5°C with no or limited overshoot (C1, WGIII Table SPM.2 C1).