Figure 3.2
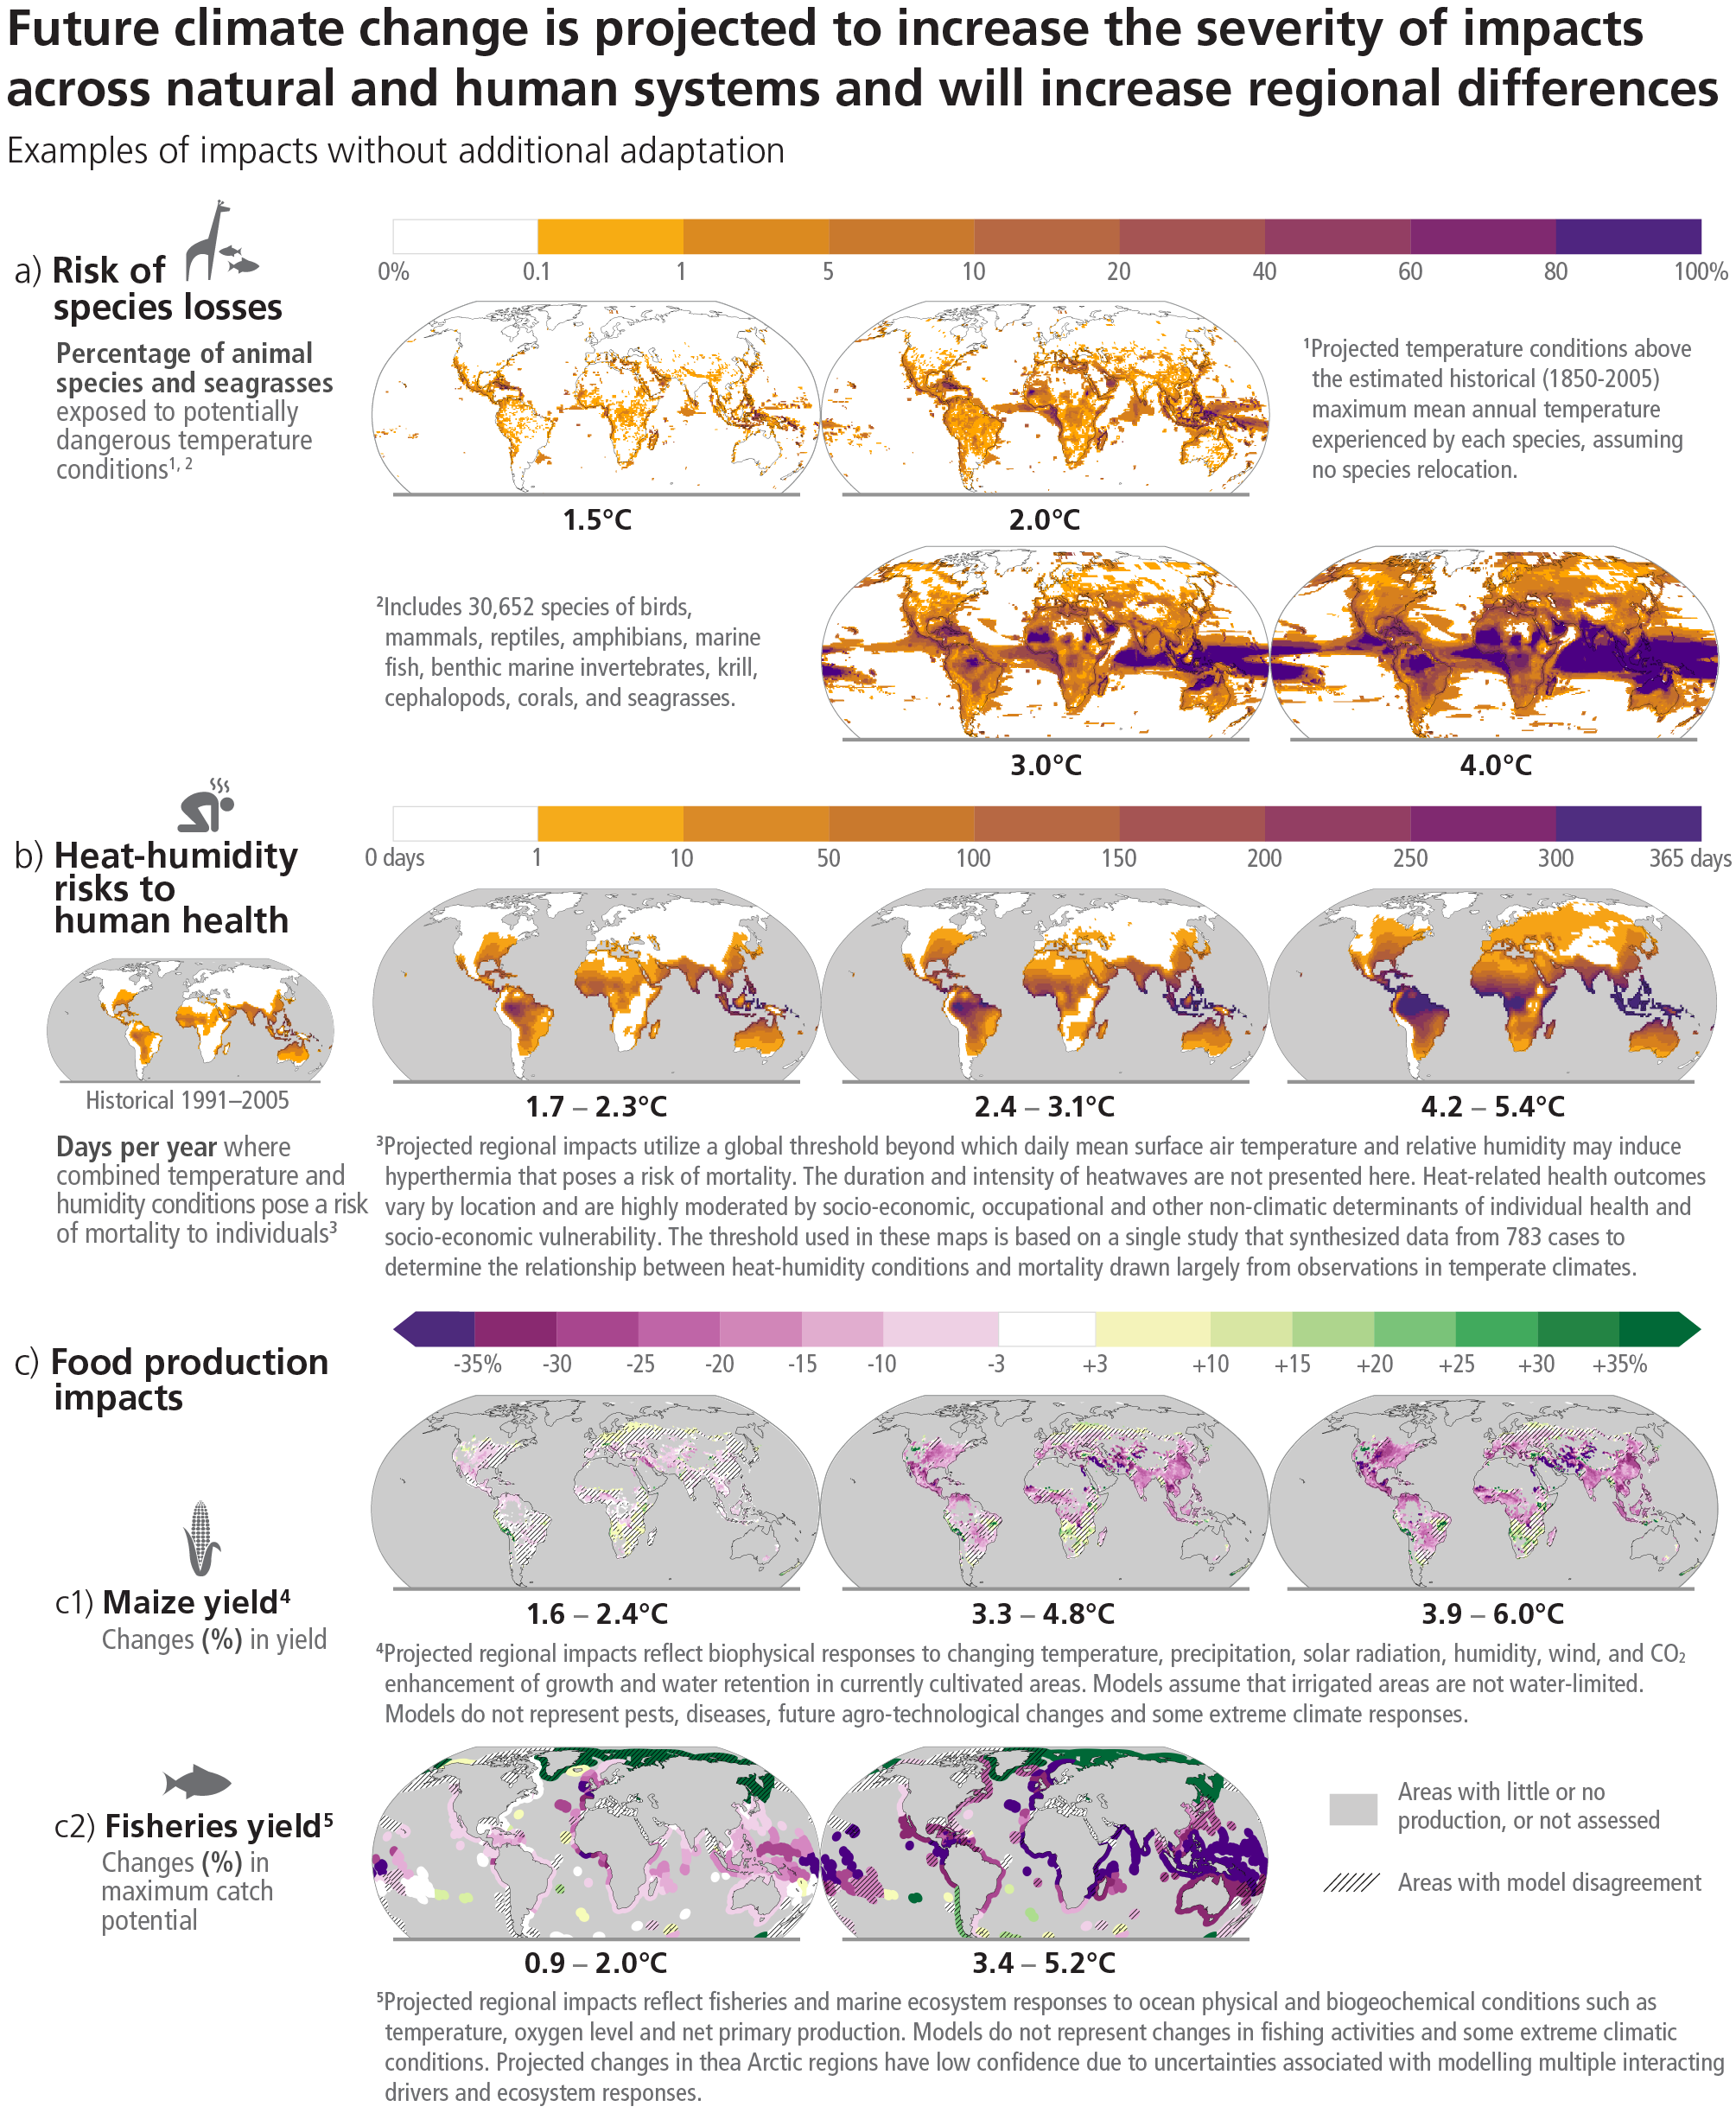
Figure caption
Figure 3.2: Projected risks and impacts of climate change on natural and human systems at different global warming levels (GWLs) relative to 1850–1900 levels. Projected risks and impacts shown on the maps are based on outputs from different subsets of Earth system models that were used to project each impact indicator without additional adaptation. WGII provides further assessment of the impacts on human and natural systems using these projections and additional lines of evidence. (a) Risks of species losses as indicated by the percentage of assessed species exposed to potentially dangerous temperature conditions, as defined by conditions beyond the estimated historical (1850-2005) maximum mean annual temperature experienced by each species, at GWLs of 1.5°C, 2°C, 3°C and 4°C. Underpinning projections of temperature are from 21 Earth system models and do not consider extreme events impacting ecosystems such as the Arctic. (b) Risk to human health as indicated by the days per year of population exposure to hypothermic conditions that pose a risk of mortality from surface air temperature and humidity conditions for historical period (1991- 2005) and at GWLs of 1.7°C–2.3°C (mean = 1.9°C; 13 climate models), 2.4°C–3.1°C (2.7°C; 16 climate models) and 4.2°C–5.4°C (4.7°C; 15 climate models). Interquartile ranges of WGLs by 2081-2100 under RCP2.6, RCP4.5 and RCP8.5. The presented index is consistent with common features found in many indices included within WGI and WGII assessments. (c) Impacts on food production: (c1) Changes in maize yield at projected GWLs of 1.6°C–2.4o C (2.0°C), 3.3°C–4.8o C (4.1°C) and 3.9°C–6.0o C (4.9°C). Median yield changes from an ensemble of 12 crop models, each driven by bias-adjusted outputs from 5 Earth system models from the Agricultural Model Intercomparison and Improvement Project (AgMIP) and the Inter-Sectoral Impact Model Intercomparison Project (ISIMIP). Maps depict 2080–2099 compared to 1986–2005 for current growing regions (>10 ha), with the corresponding range of future global warming levels shown under SSP1-2.6, SSP3-7.0 and SSP5-8.5, respectively. Hatching indicates areas where <70% of the climatecrop model combinations agree on the sign of impact. (c2) Changes in maximum fisheries catch potential by 2081–2099 relative to 1986–2005 at projected GWLs of 0.9°C–2.0°C (1.5°C) and 3.4°C–5.2°C (4.3°C). GWLs by 2081–2100 under RCP2.6 and RCP8.5. Hatching indicates where the two climate-fisheries models disagree in the direction of change. Large relative changes in low yielding regions may correspond to small absolute changes. Biodiversity and fisheries in Antarctica were not analysed due to data limitations. Food security is also affected by crop and fishery failures not presented here {WGII Fig. TS.5, WGII Fig TS.9, WGII Annex I: Global to Regional Atlas Figure AI.15, Figure AI.22, Figure AI.23, Figure AI.29; WGII 7.3.1.2, 7.2.4.1, SROCC Figure SPM.3} (3.1.2, Cross-Section Box.2)