Figure 3.3
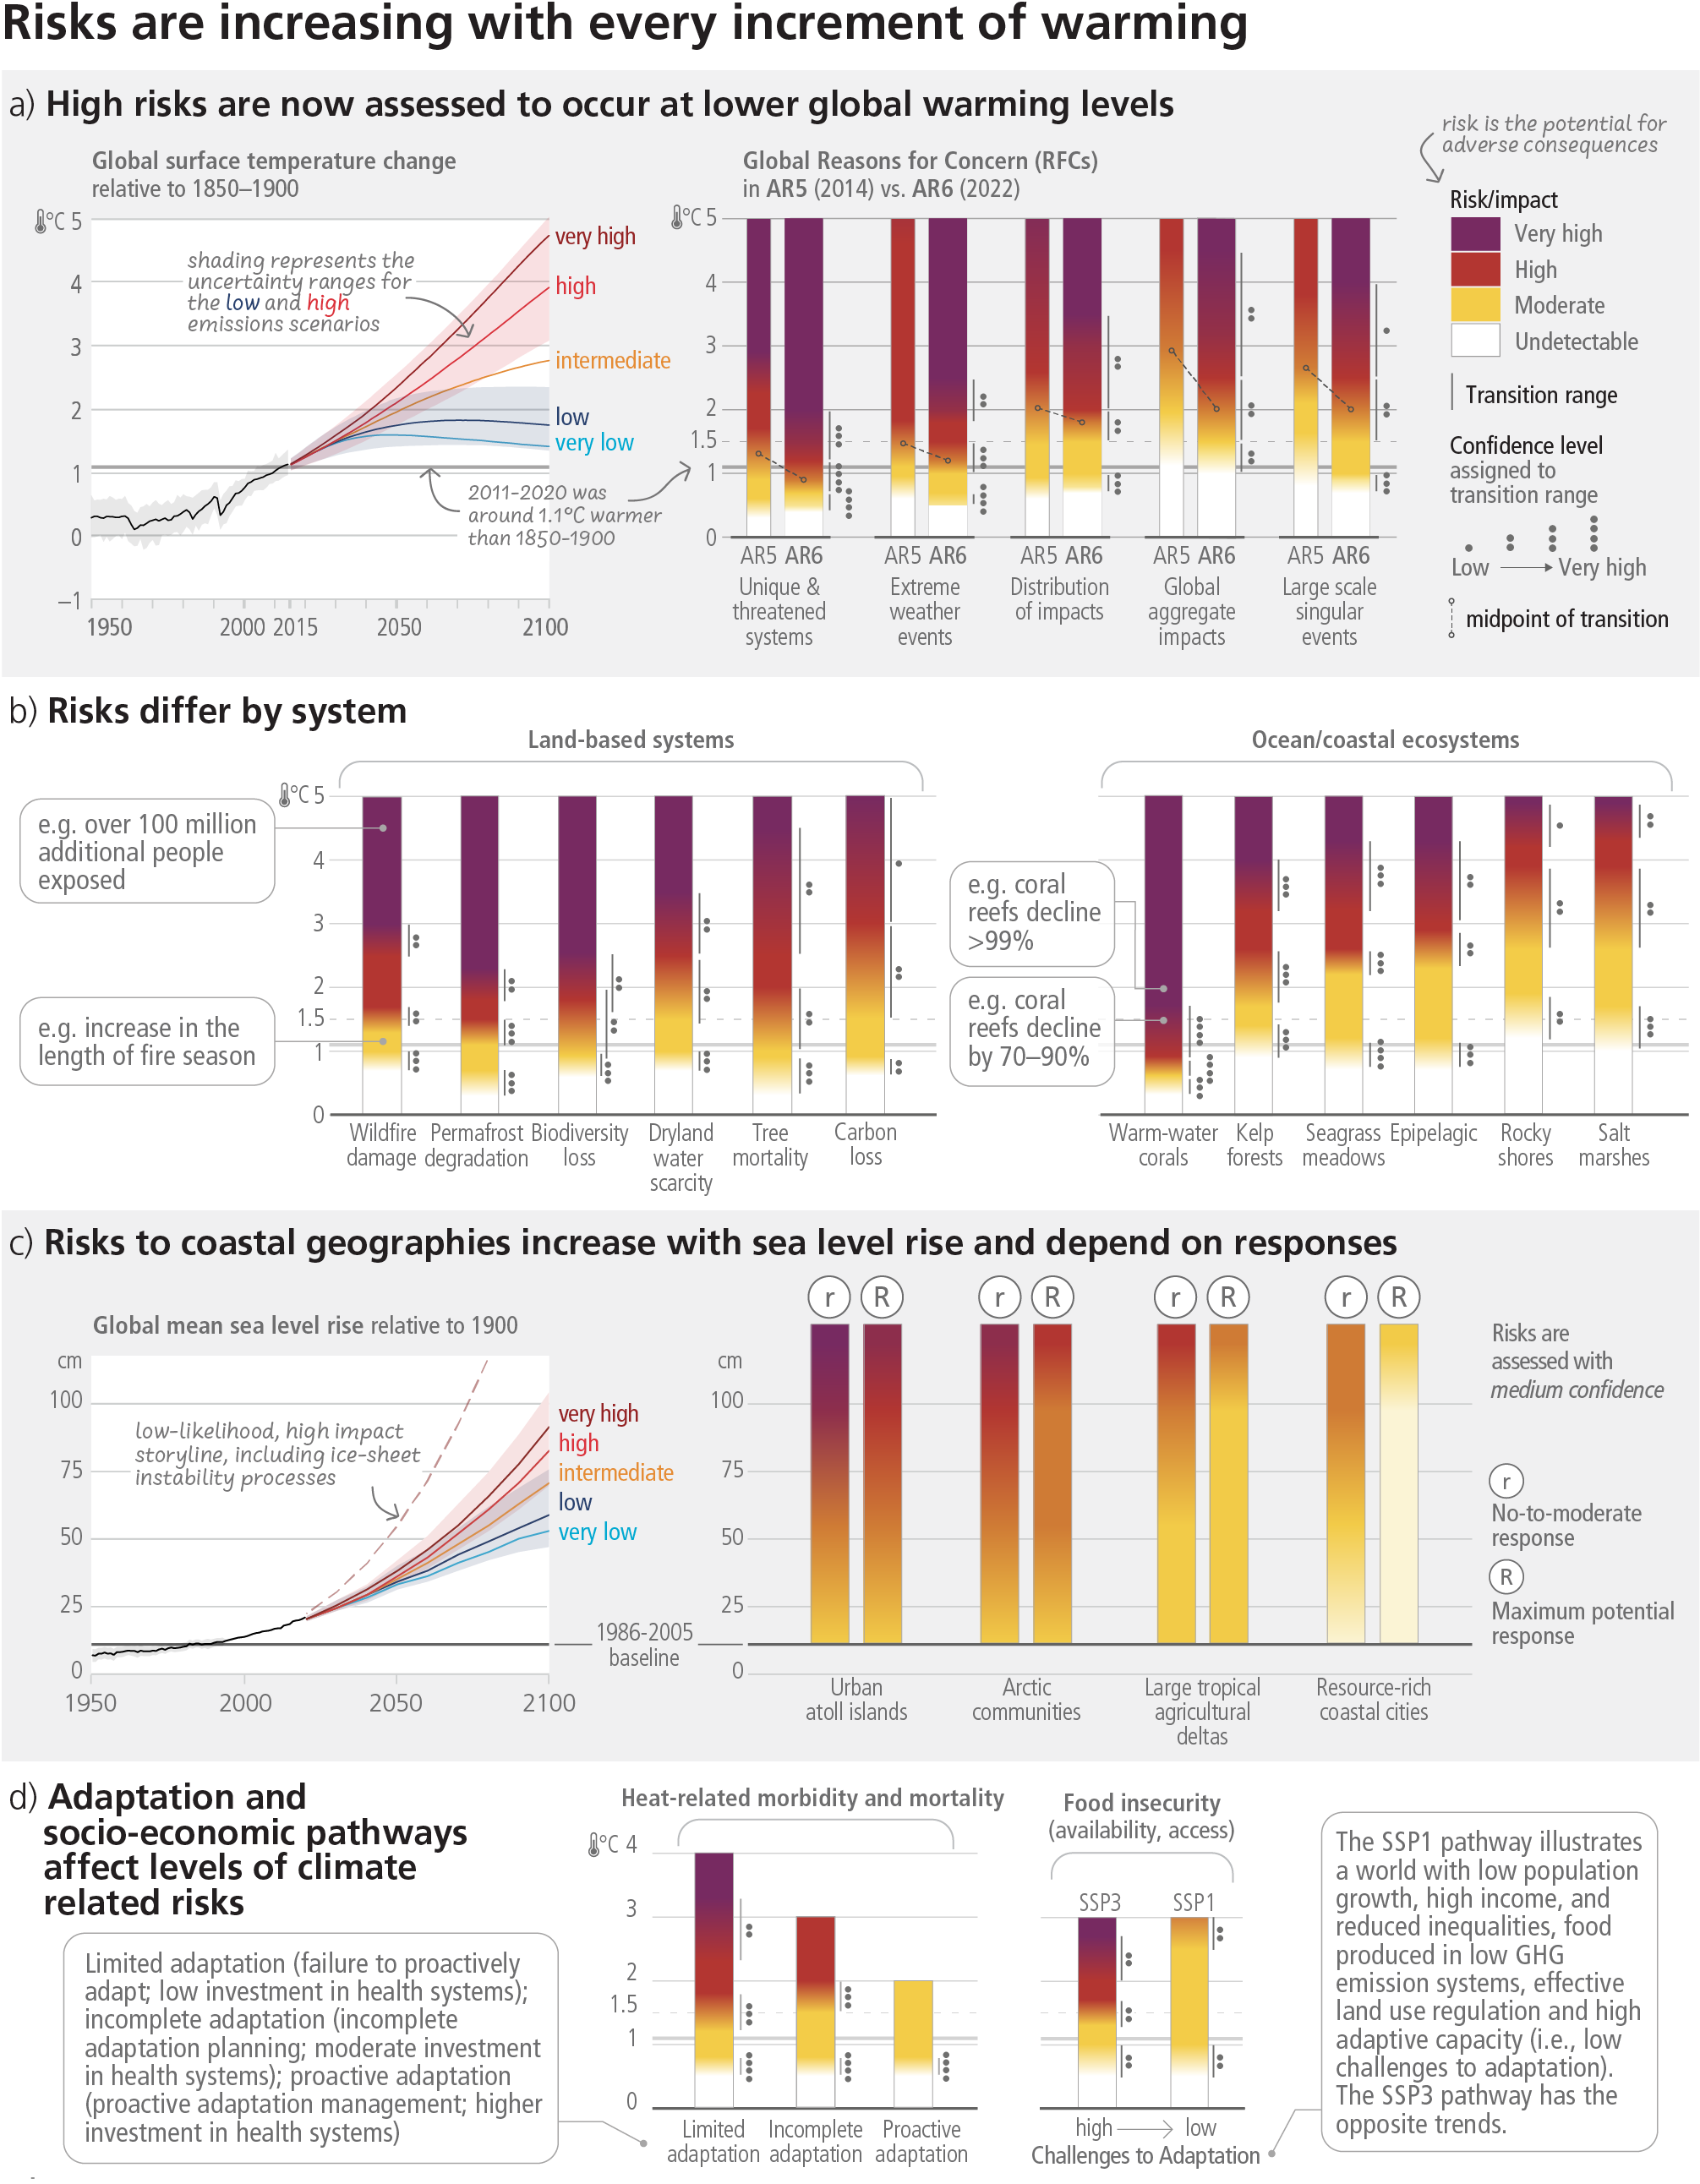
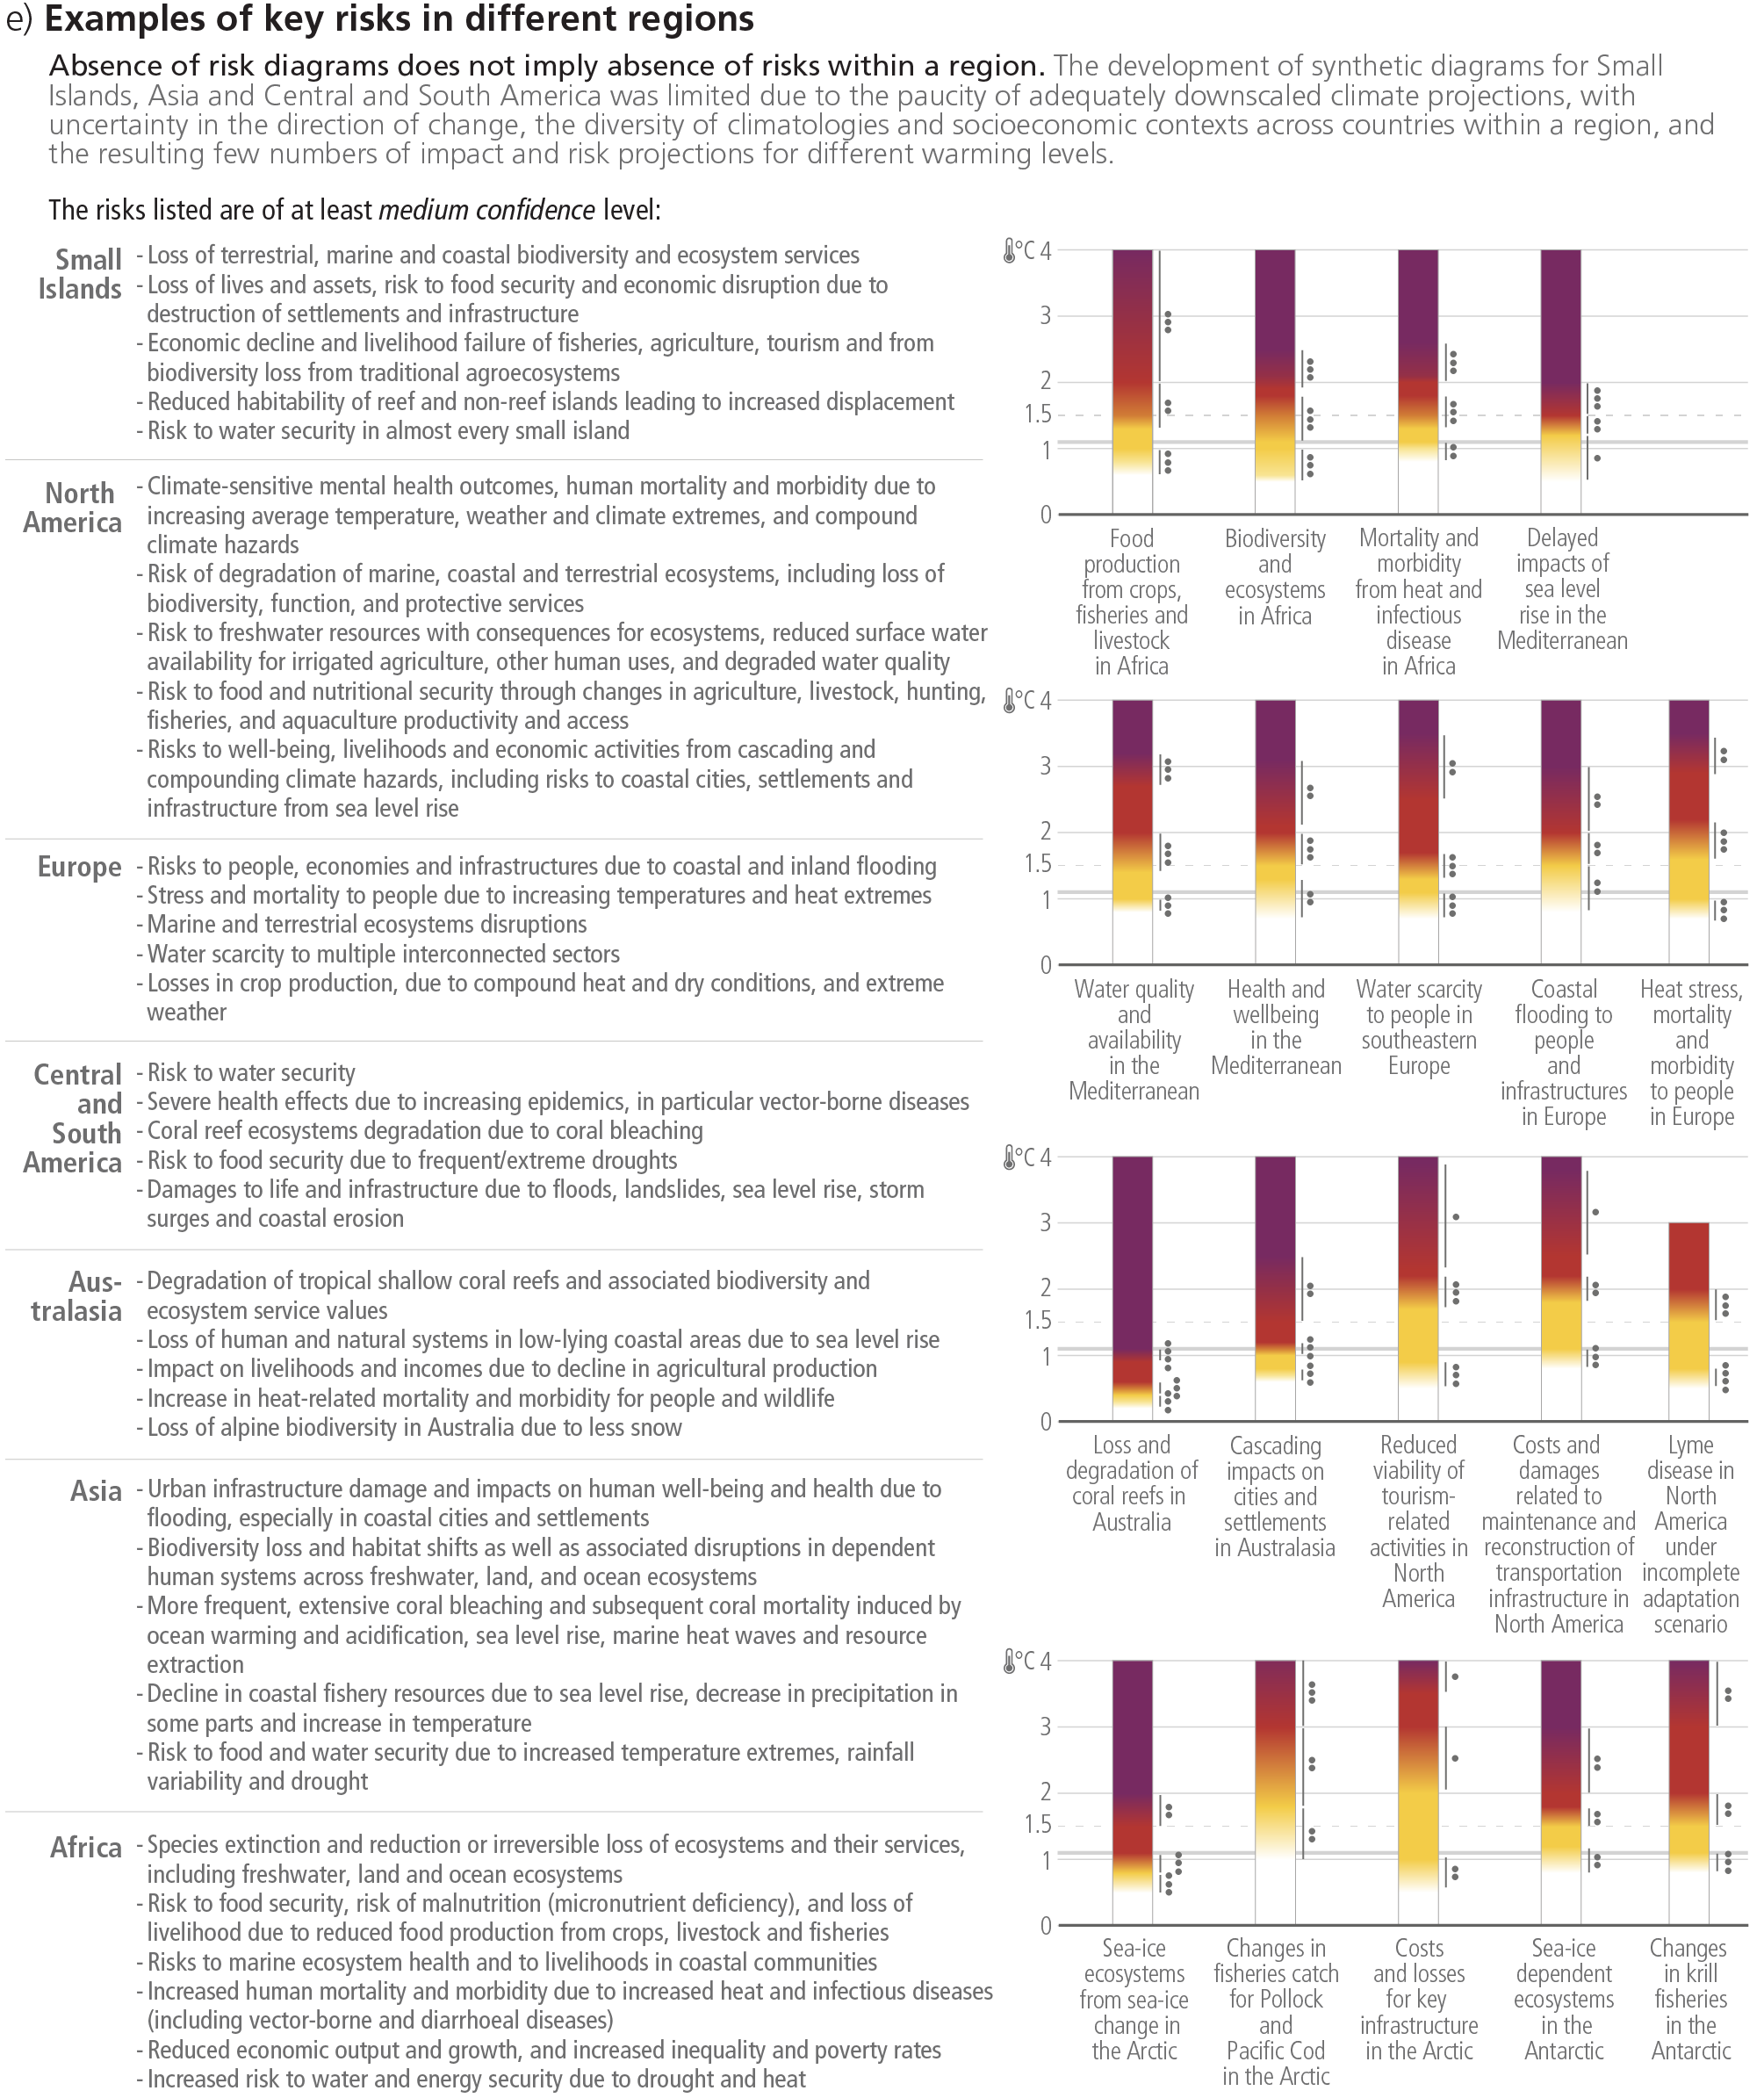
Figure caption
Figure 3.3: Synthetic risk diagrams of global and sectoral assessments and examples of regional key risks. The burning embers result from a literature based expert elicitation. Panel (a): Left - Global surface temperature changes in °C relative to 1850–1900. These changes were obtained by combining CMIP6 model simulations with observational constraints based on past simulated warming, as well as an updated assessment of equilibrium climate sensitivity. Very likely ranges are shown for the low and high GHG emissions scenarios (SSP1-2.6 and SSP3-7.0); Right - Global Reasons for Concern, comparing AR6 (thick embers) and AR5 (thin embers) assessments. Diagrams are shown for each RFC, assuming low to no adaptation (i.e., adaptation is fragmented, localised and comprises incremental adjustments to existing practices). However, the transition to a very high risk level has an emphasis on irreversibility and adaptation limits. The horizontal line denotes the present global warming of 1.1°C which is used to separate the observed, past impacts below the line from the future projected risks above it. Lines connect the midpoints of the transition from moderate to high risk across AR5 and AR6. Panel (b): Risks for land-based systems and ocean/coastal ecosystems. Diagrams shown for each risk assume low to no adaptation. Text bubbles indicate examples of impacts at a given warming level. Panel (c): Left - Global mean sea level change in centimetres, relative to 1900. The historical changes (black) are observed by tide gauges before 1992 and altimeters afterwards. The future changes to 2100 (coloured lines and shading) are assessed consistently with observational constraints based on emulation of CMIP, ice-sheet, and glacier models, and likely ranges are shown for SSP1-2.6 and SSP3-7.0. Right - Assessment of the combined risk of coastal flooding, erosion and salinization for four illustrative coastal geographies in 2100, due to changing mean and extreme sea levels, under two response scenarios, with respect to the SROCC baseline period (1986–2005) and indicating the IPCC AR6 baseline period (1995–2014). The assessment does not account for changes in extreme sea level beyond those directly induced by mean sea level rise; risk levels could increase if other changes in extreme sea levels were considered (e.g., due to changes in cyclone intensity). “No-to-moderate response” describes efforts as of today (i.e., no further significant action or new types of actions). “Maximum potential response” represents a combination of responses implemented to their full extent and thus significant additional efforts compared to today, assuming minimal financial, social and political barriers. The assessment criteria include exposure and vulnerability (density of assets, level of degradation of terrestrial and marine buffer ecosystems), coastal hazards (flooding, shoreline erosion, salinization), in-situ responses (hard engineered coastal defences, ecosystem restoration or creation of new natural buffers areas, and subsidence management) and planned relocation. Planned relocation refers to managed retreat or resettlement. Forced displacement is not considered in this assessment. The term response is used here instead of adaptation because some responses, such as retreat, may or may not be considered to be adaptation. Panel (d): Left - Heat-sensitive human health outcomes under three scenarios of adaptation effectiveness. The diagrams are truncated at the nearest whole ºC within the range of temperature change in 2100 under three SSP scenarios. Right - Risks associated with food security due to climate change and patterns of socio-economic development. Risks to food security include availability and access to food, including population at risk of hunger, food price increases and increases in disability adjusted life years attributable to childhood underweight. Risks are assessed for two contrasted socio-economic pathways (SSP1 and SSP3) excluding the effects of targeted mitigation and adaptation policies. Panel (e): Examples of regional key risks. Risks identified are of at least medium confidence level. Key risks are identified based on the magnitude of adverse consequences (pervasiveness of the consequences, degree of change, irreversibility of consequences, potential for impact thresholds or tipping points, potential for cascading effects beyond system boundaries); likelihood of adverse consequences; temporal characteristics of the risk; and ability to respond to the risk, e.g., by adaptation. {WGI Figure SPM.8; WGII SPM B.3.3, WGII Figure SPM.3, WGII SM 16.6, WGII SM 16.7.4; SRCCL Figure SPM.2; SROCC Figure SPM.3d; SROCC SPM.5a; SROCC 4SM; SRCCL 7.3.1; SRCCL 7SM} (CSB.2)