Figure 3.4
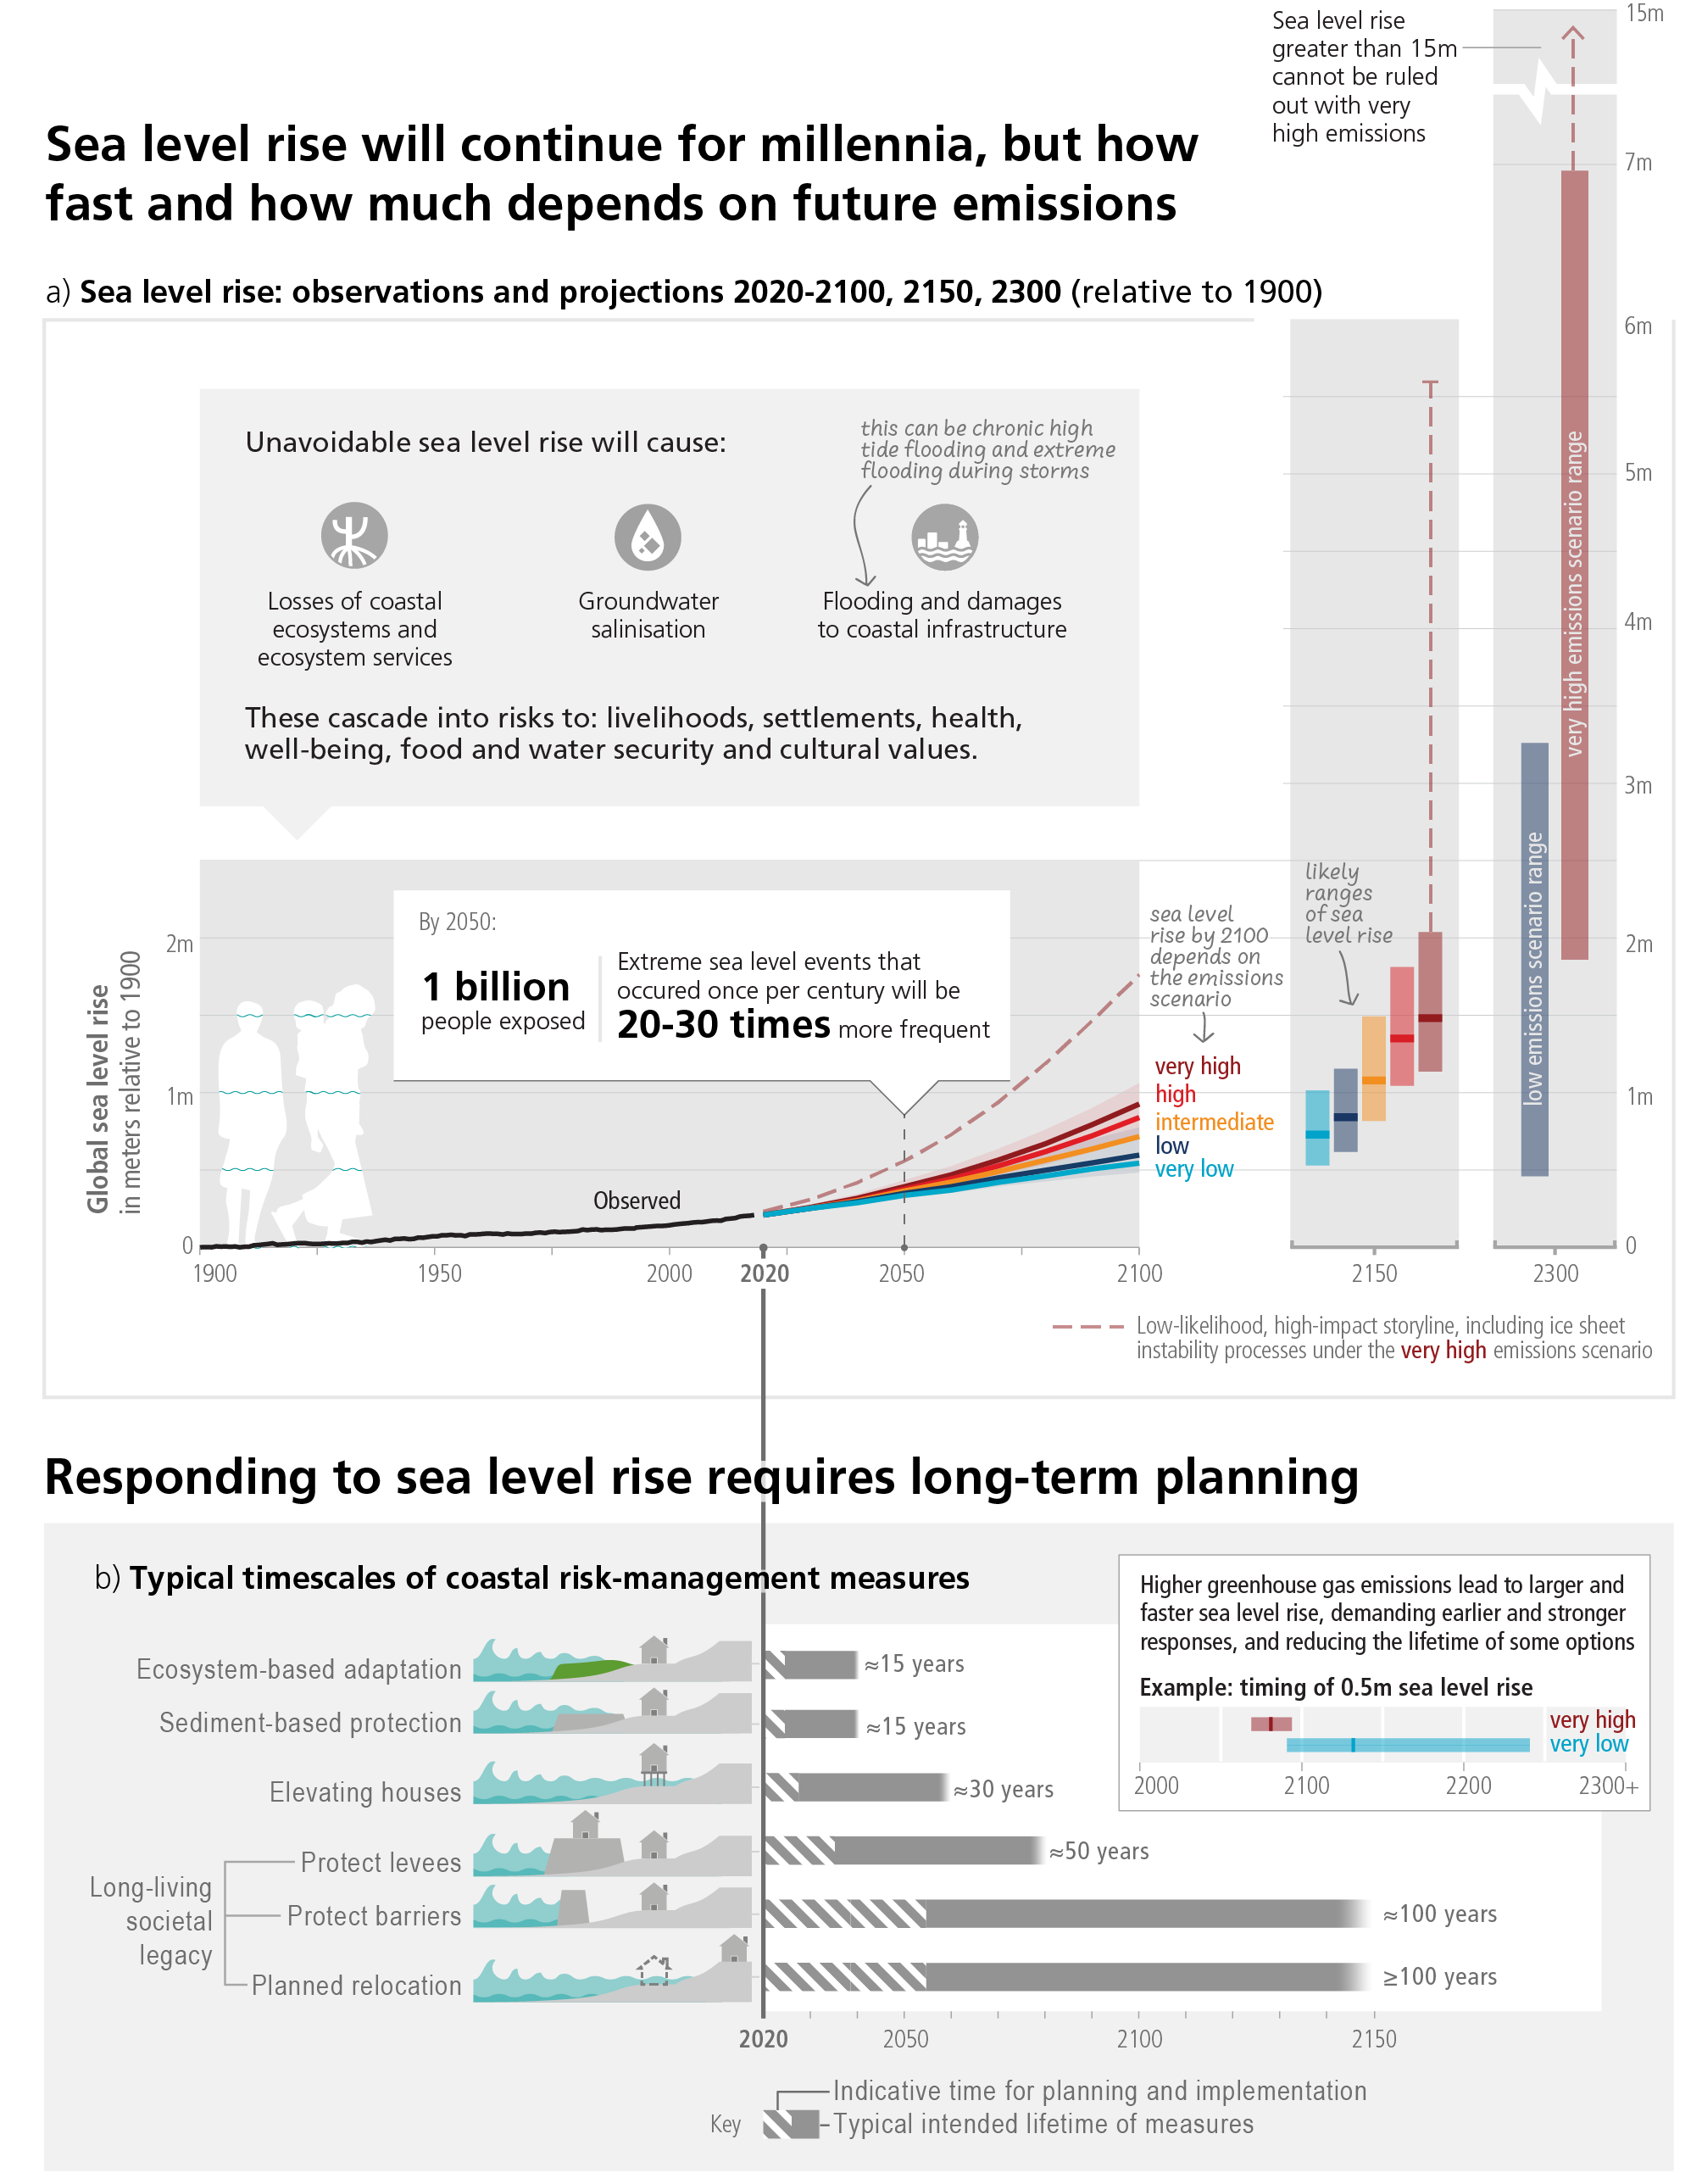
Figure caption
Figure 3.4: Observed and projected global mean sea level change and its impacts, and time scales of coastal risk management. Panel (a): Global mean sea level change in metres relative to 1900. The historical changes (black) are observed by tide gauges before 1992 and altimeters afterwards. The future changes to 2100 and for 2150 (coloured lines and shading) are assessed consistently with observational constraints based on emulation of CMIP, ice-sheet, and glacier models, and median values and likely ranges are shown for the considered scenarios. Relative to 1995–2014, the likely global mean sea level rise by 2050 is between 0.15–0.23 m in the very low GHG emissions scenario (SSP1-1.9) and 0.20– 0.29 m in the very high GHG emissions scenario (SSP5-8.5); by 2100 between 0.28–0.55 m under SSP1-1.9 and 0.63– 1.01 m under SSP5-8.5; and by 2150 between 0.37–0.86 m under SSP1-1.9 and 0.98–1.88 m under SSP5-8.5 (medium confidence). Changes relative to 1900 are calculated by adding 0.158 m (observed global mean sea level rise from 1900 to 1995–2014) to simulated changes relative to 1995–2014. The future changes to 2300 (bars) are based on literature assessment, representing the 17th–83rd percentile range for SSP1-2.6 (0.3–3.1 m) and SSP5-8.5 (1.7–6.8 m). Red dashed lines: Low-likelihood, high-impact storyline, including ice sheet instability processes. These indicate the potential impact of deeply uncertain processes, and show the 83rd percentile of SSP5-8.5 projections that include low-likelihood, highimpact processes that cannot be ruled out; because of low confidence in projections of these processes, this is not part of a likely range. IPCC AR6 global and regional sea level projections are hosted at https://sealevel.nasa.gov/ipcc-ar6-sealevel-projection-tool. The low-lying coastal zone is currently home to around 896 million people (nearly 11% of the 2020 global population), projected to reach more than one billion by 2050 across all five SSPs. Panel (b): Typical time scales for the planning, implementation (dashed bars) and operational lifetime of current coastal risk-management measures (blue bars). Higher rates of sea level rise demand earlier and stronger responses and reduce the lifetime of measures (inset). As the scale and pace of sea level rise accelerates beyond 2050, long-term adjustments may in some locations be beyond the limits of current adaptation options and for some small islands and low-lying coasts could be an existential risk. {WGI SPM B.5, C.2.5, Figure SPM.8, 9.6; WGII SPM B.4.5, B.5.2, C.2.8, D.3.3, TS.D.7, Cross-Chapter Box SLR} (CSB.2)