Figure 3.5
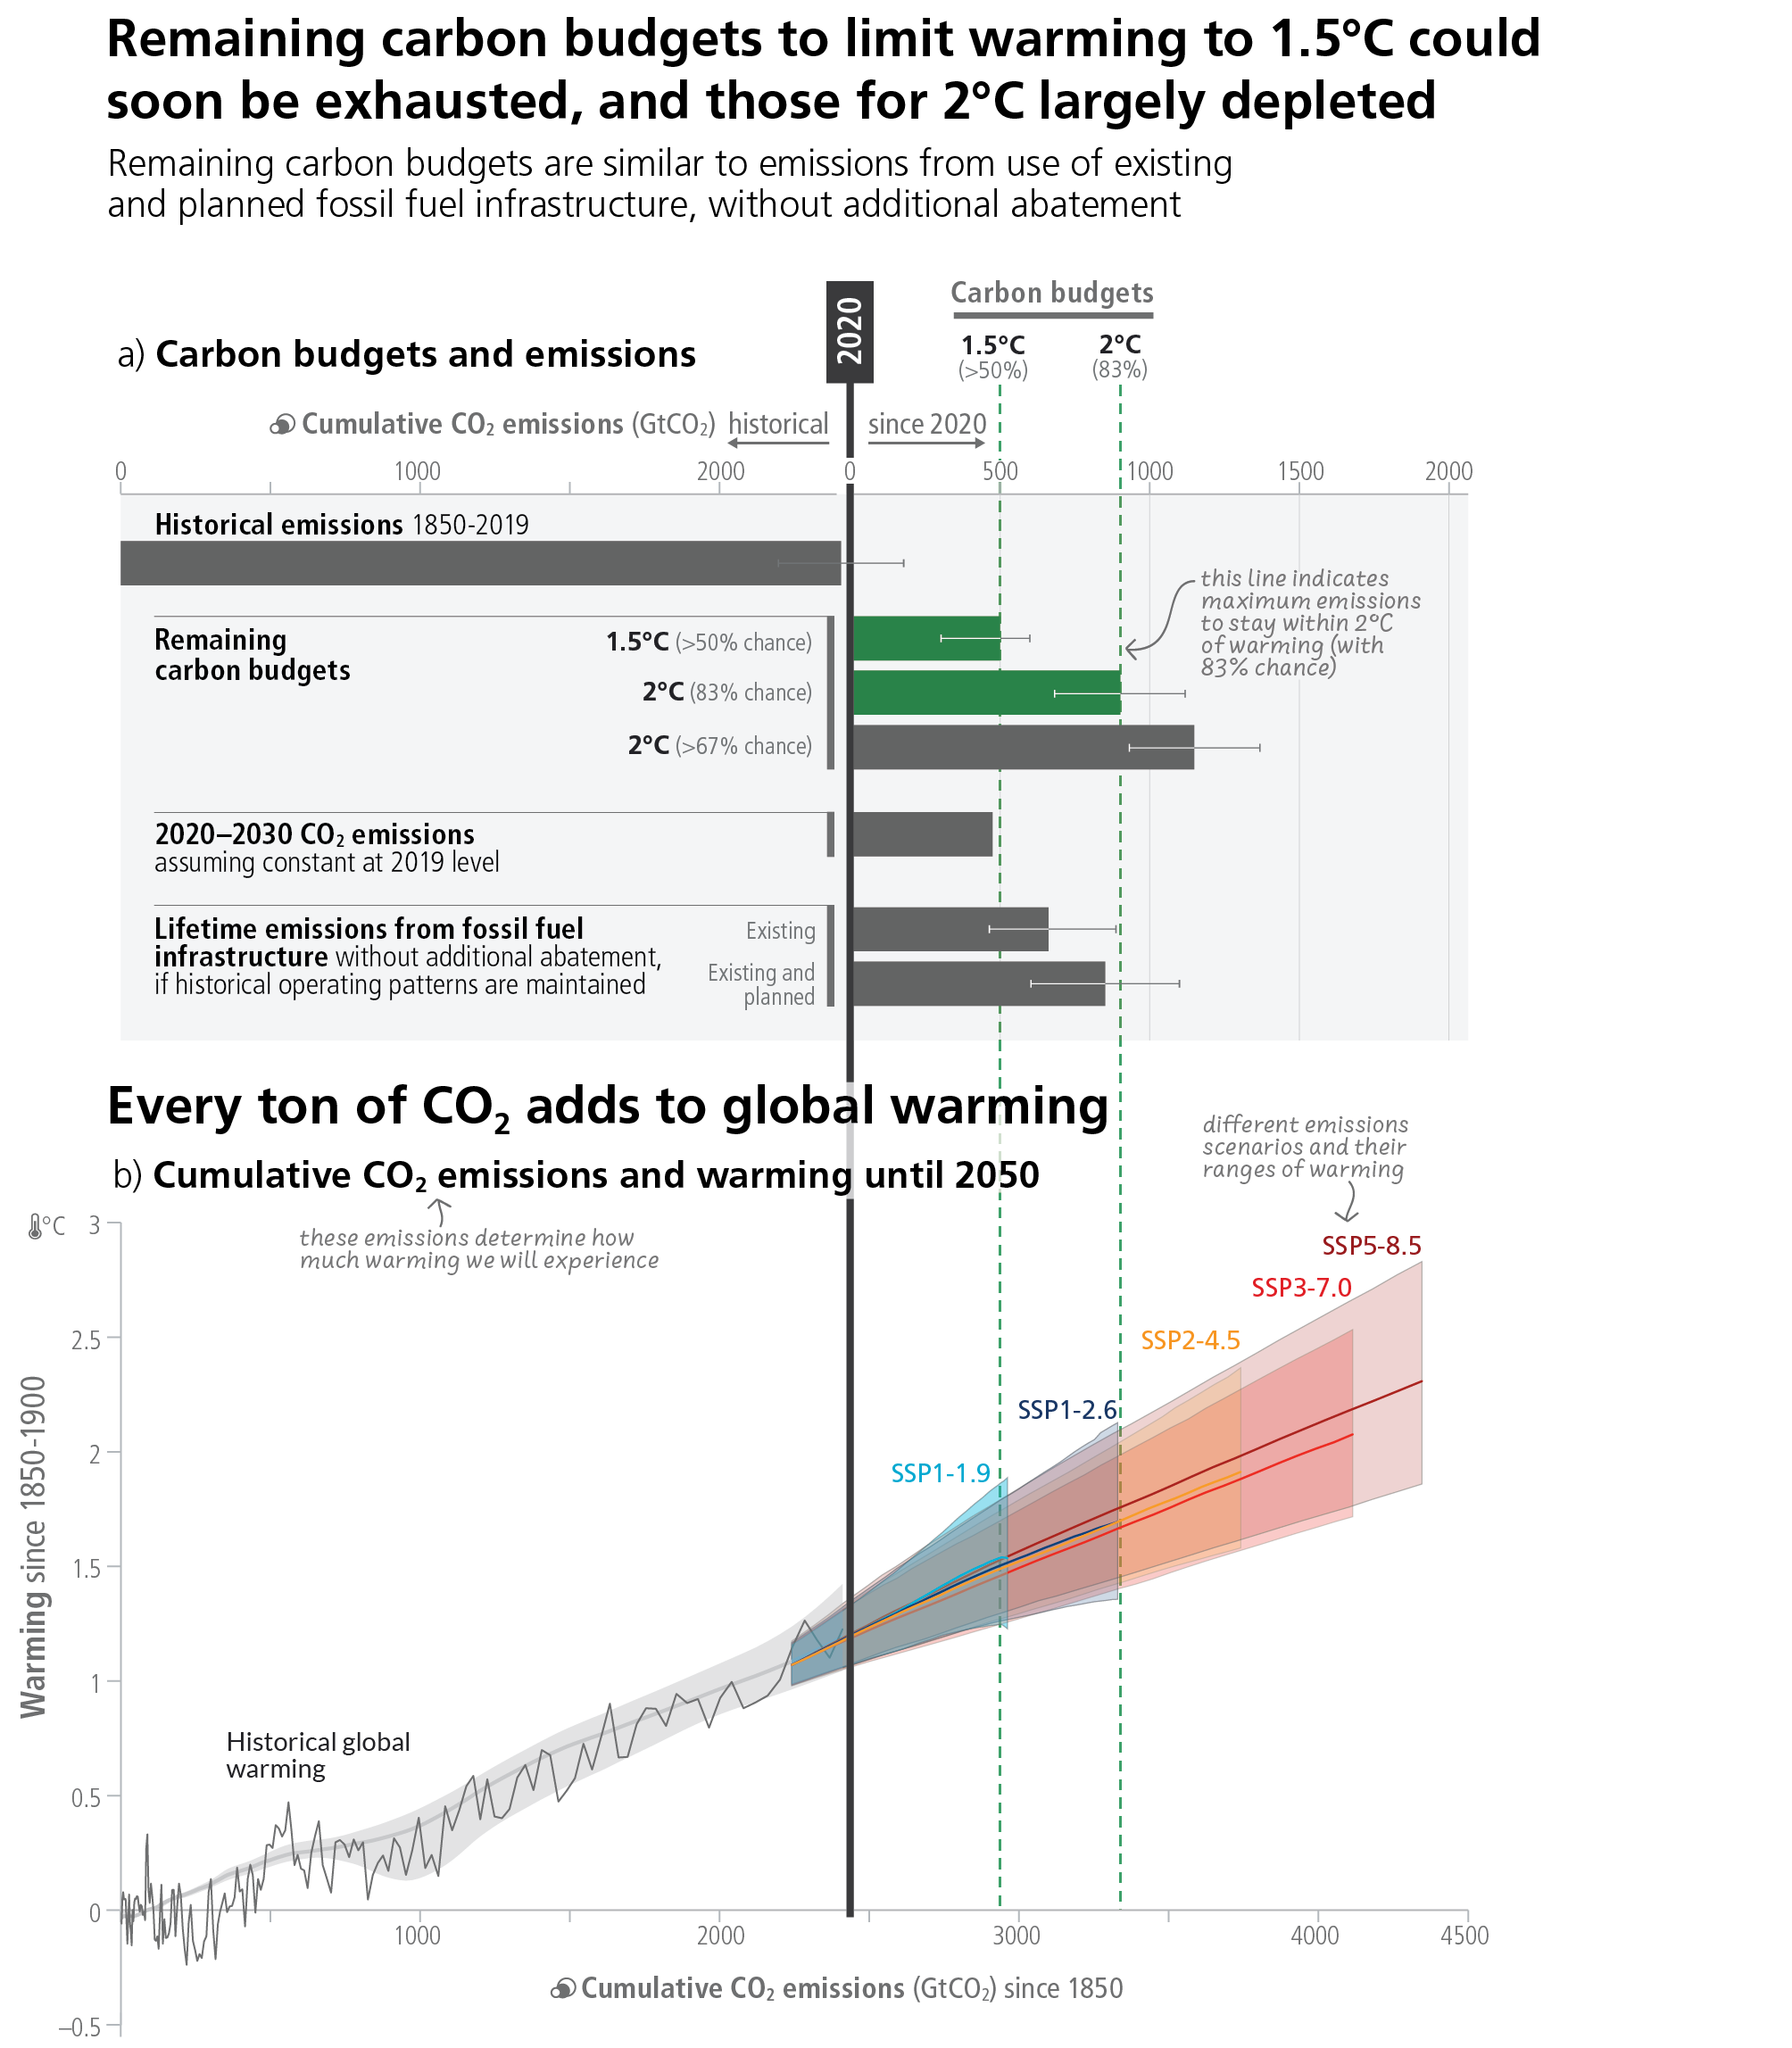
Figure caption
Figure 3.5: Cumulative past, projected, and committed emissions, and associated global temperature changes. Panel (a) Assessed remaining carbon budgets to limit warming more likely than not to 1.5°C, below 2°C with a 83% and 67% likelihood, compared to cumulative emissions corresponding to constant 2019 emissions until 2030, existing and planned fossil fuel infrastructures (in GtCO2). For remaining carbon budgets, thin lines indicate the uncertainty due to the contribution of non-CO2 warming. For lifetime emissions from fossil fuel infrastructure, thin lines indicate the assessed sensitivity range. Panel (b) Relationship between cumulative CO2 emissions and the increase in global surface temperature. Historical data (thin black line) shows historical CO2 emissions versus observed global surface temperature increase relative to the period 1850–1900. The grey range with its central line shows a corresponding estimate of the human-caused share of historical warming. Coloured areas show the assessed very likely range of global surface temperature projections, and thick coloured central lines show the median estimate as a function of cumulative CO2 emissions for the selected scenarios SSP1-1.9, SSP1-2.6, SSP2-4.5, SSP3-7.0, and SSP5-8.5. Projections until 2050 use the cumulative CO2 emissions of each respective scenario, and the projected global warming includes the contribution from all anthropogenic forcers. {WGI SPM D.1, WGI Figure SPM.10, WGI Table SPM.2; WGIII SPM B.1, WGIII SPM B.7, WGIII 2.7; SR1.5 SPM C.1.3}