Figure 4.5
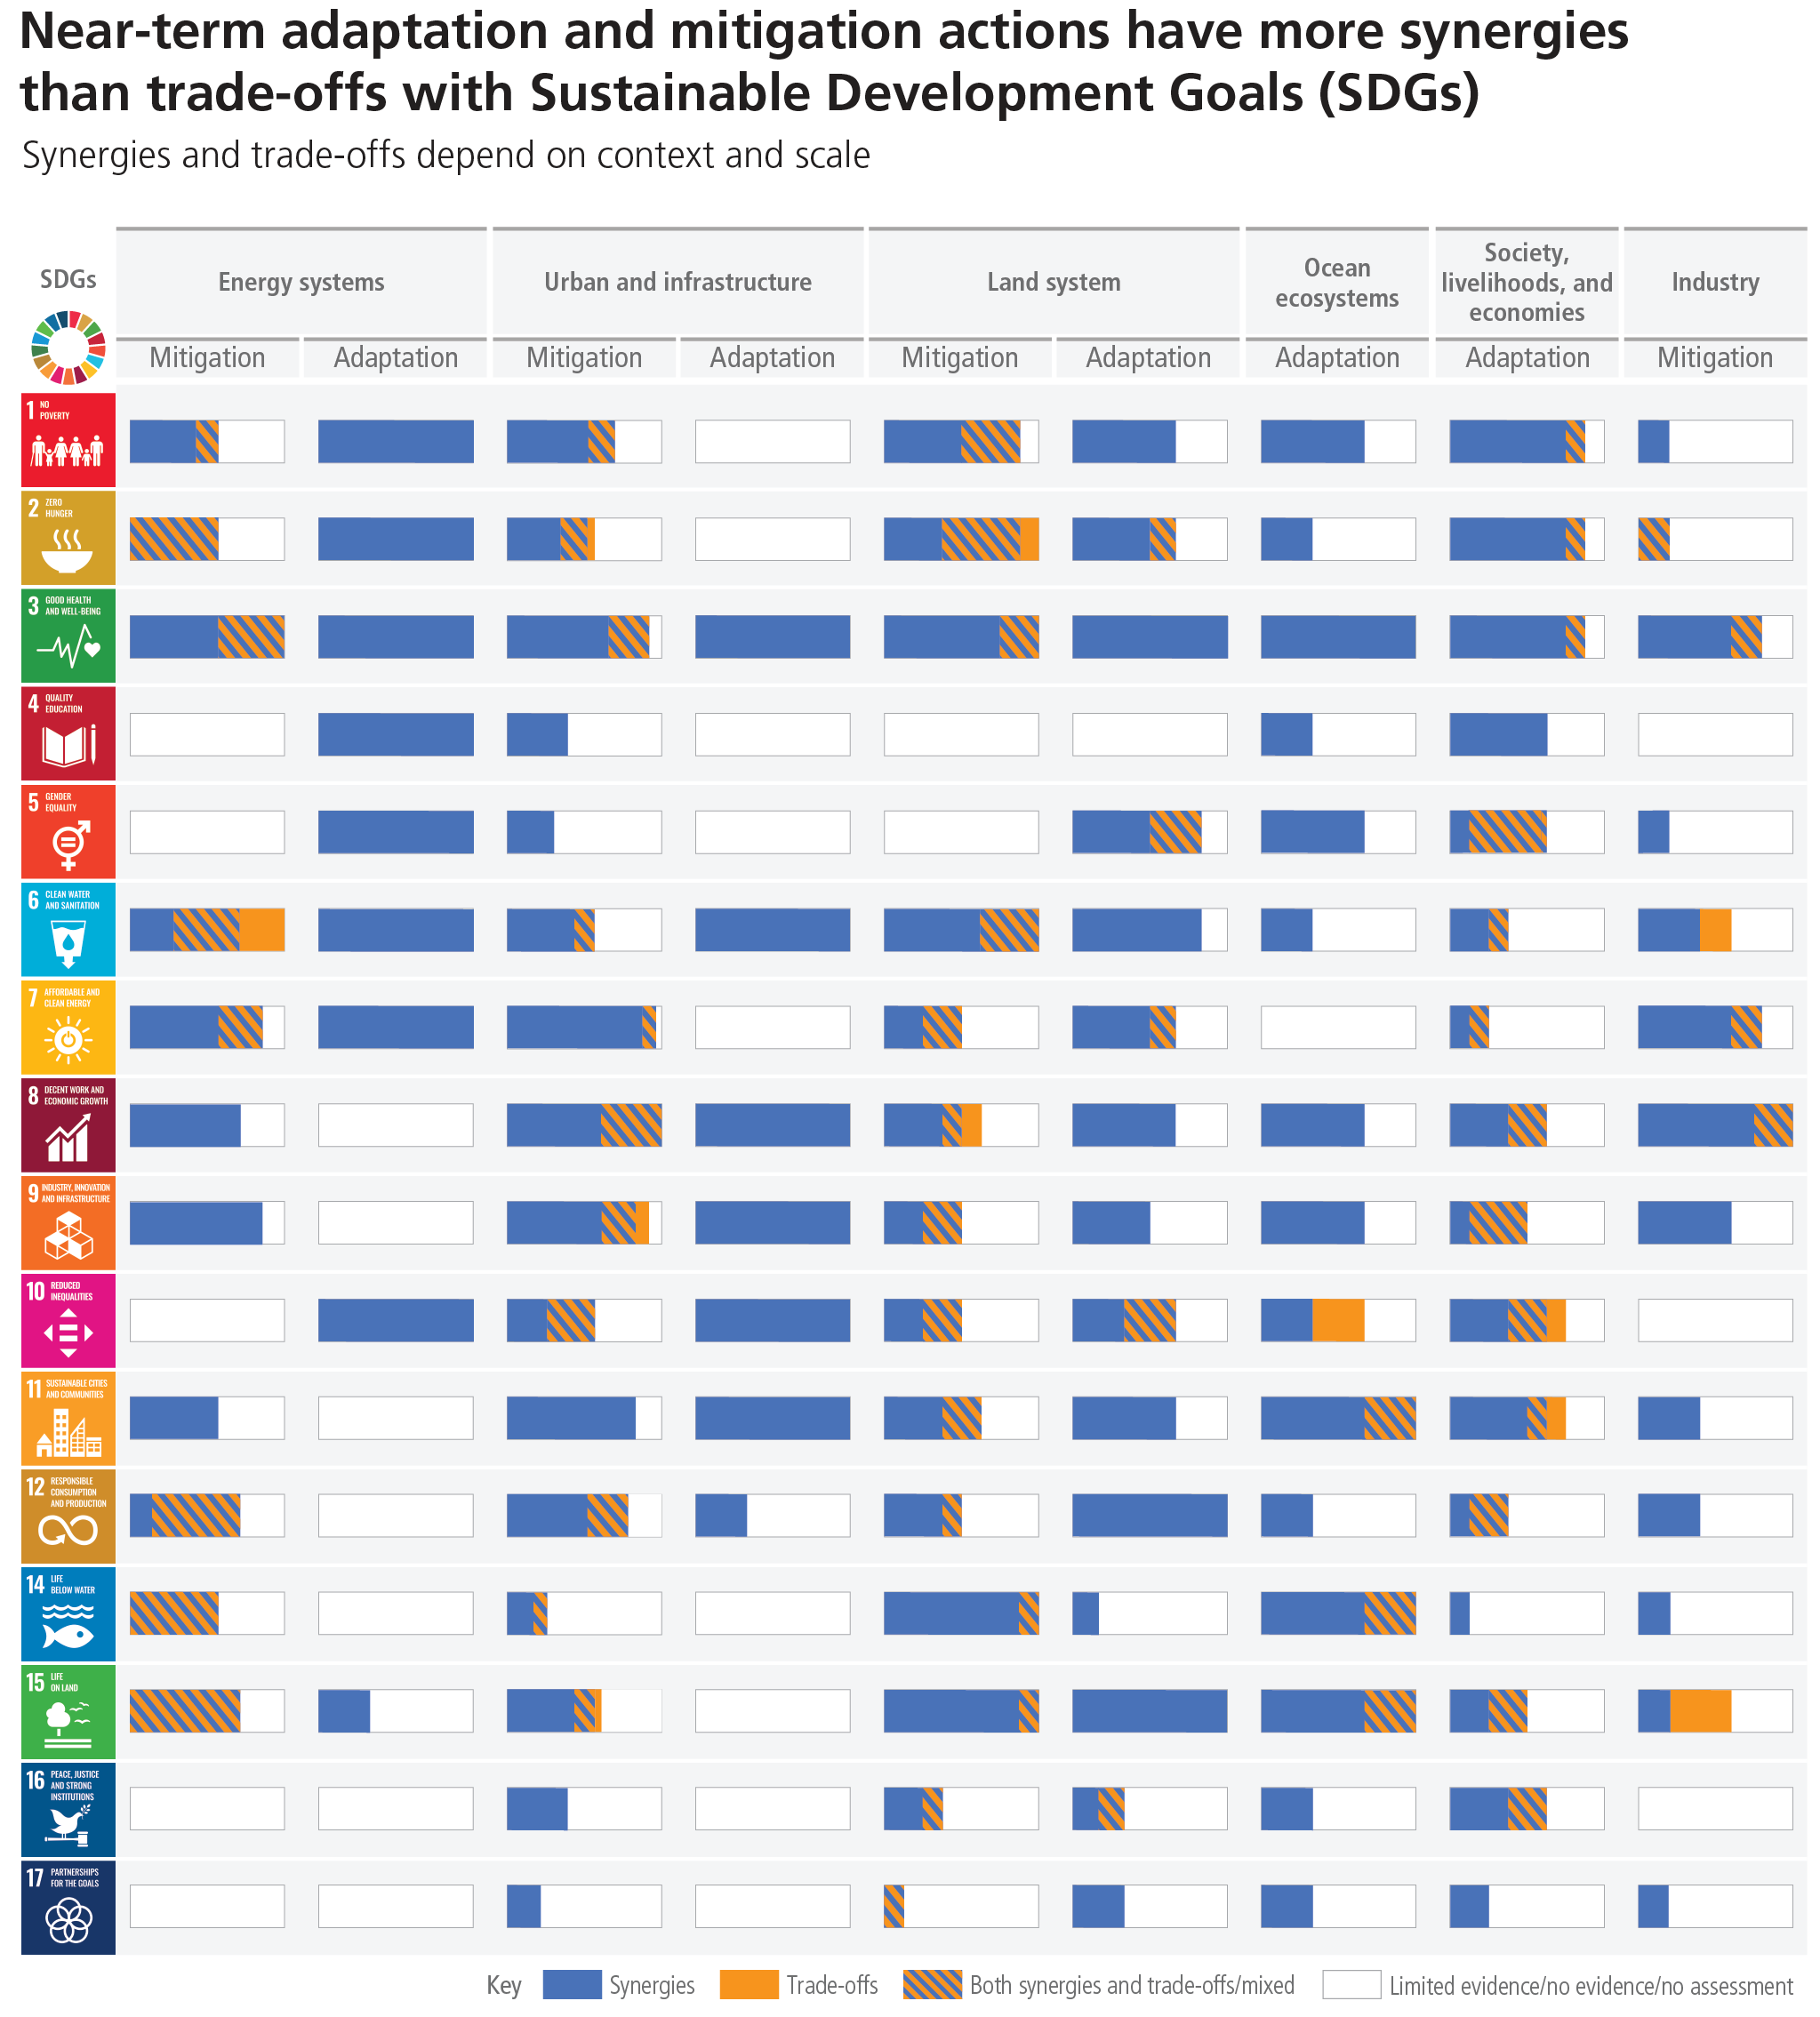
Figure caption
Figure 4.5: Potential synergies and trade-offs between the portfolio of climate change mitigation and adaptation options and the Sustainable Development Goals (SDGs). This figure presents a high-level summary of potential synergies and trade-offs assessed in WGII Figure SPM.4b and WGIII Figure SPM.8, based on the qualitative and quantitative assessment of each individual mitigation or option. The SDGs serve as an analytical framework for the assessment of different sustainable development dimensions, which extend beyond the time frame of 2030 SDG targets. Synergies and trade-offs across all individual options within a sector/system are aggregated into sector/system potentials for the whole mitigation or adaptation portfolio. The length of each bar represents the total number of mitigation or adaptation options under each system/sector. The number of adaptation and mitigation options vary across system/sector, and have been normalised to 100% so that bars are comparable across mitigation, adaptation, system/sector, and SDGs. Positive links shown in WGII Figure SPM 4b and WGIII Figure SPM 8 are counted and aggregated to generate the percentage share of synergies, represented here by the blue proportion within the bars. Negative links shown in WGII Figure SPM 4b and WGIII Figure SPM 8 are counted and aggregated to generate the percentage share of trade-offs and is represented by orange proportion within the bars. ‘Both synergies and trade-offs’ shown in WGII Figure SPM 4b WGIII Figure SPM 8 are counted and aggregated to generate the percentage share of ‘both synergies and trade-off’, represented by the striped proportion within the bars. The ‘white’ proportion within the bar indicates limited evidence/ no evidence/ not assessed. Energy systems comprise all mitigation options listed in WGIII Figure SPM.8 and WGII Figure SPM.4b for adaptation. Urban and infrastructure comprises all mitigation options listed in WGIII Figure SPM.8 under Urban systems, under Buildings and under Transport and adaptation options listed in WGII Figure SPM.4b under Urban and infrastructure systems. Land system comprises mitigation options listed in WGIII Figure SPM.8 under AFOLU and adaptation options listed in WGII Figure SPM.4b under Land and ocean systems: forest-based adaptation, agroforestry, biodiversity management and ecosystem connectivity, improved cropland management, efficient livestock management, water use efficiency and water resource management. Ocean ecosystems comprises adaptation options listed in WGII Figure SPM.4b under Land and ocean systems: coastal defence and hardening, integrated coastal zone management and sustainable aquaculture and fisheries. Society, livelihood and economies comprises adaptation options listed in WGII Figure SPM.4b under Cross-sectoral; Industry comprises all those mitigation options listed in WGIII Figure SPM.8 under Industry. SDG 13 (Climate Action) is not listed because mitigation/ adaptation is being considered in terms of interaction with SDGs and not vice versa (SPM SR1.5 Figure SPM.4 caption). The bars denote the strength of the connection and do not consider the strength of the impact on the SDGs. The synergies and trade-offs differ depending on the context and the scale of implementation. Scale of implementation particularly matters when there is competition for scarce resources. For the sake of uniformity, we are not reporting the confidence levels because there is knowledge gap in adaptation option wise relation with SDGs and their confidence level which is evident from WGII fig SPM 4b. {WGII Figure SPM.4b; WGIII Figure SPM.8}