Figure 4.6
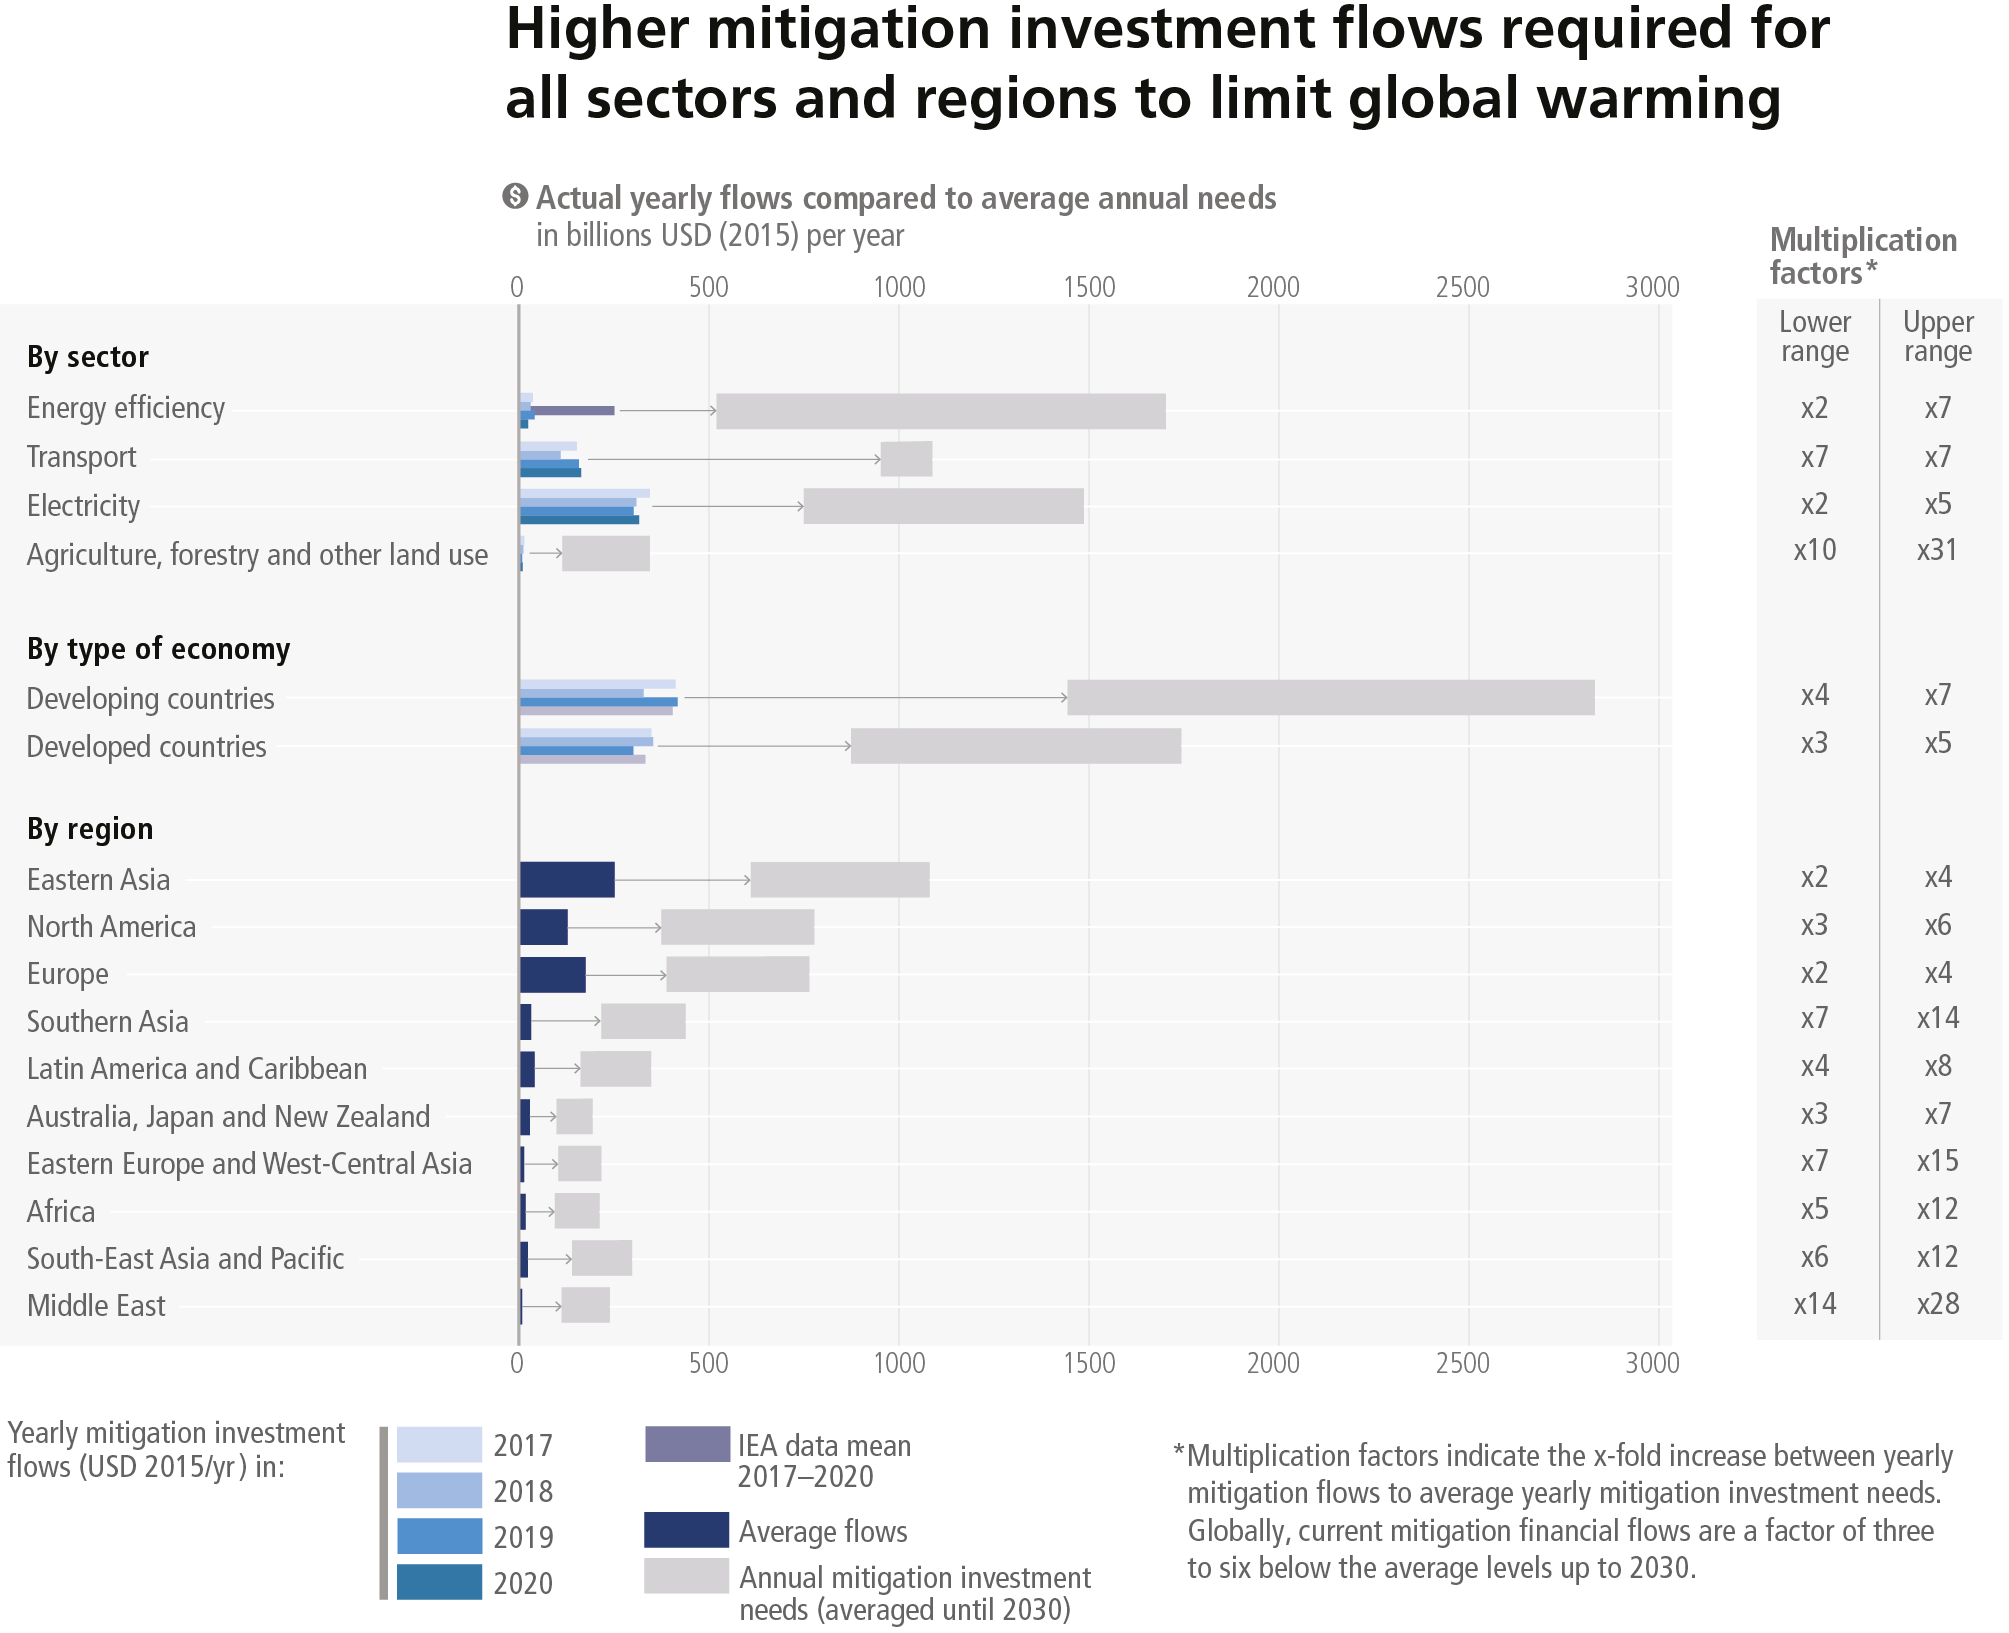
Figure caption
Figure 4.6: Breakdown of average mitigation investment flows and investment needs until 2030 (USD billion). Mitigation investment flows and investment needs by sector (energy efficiency, transport, electricity, and agriculture, forestry and other land use), by type of economy, and by region (see WGIII Annex II Part I Section 1 for the classification schemes for countries and areas). The blue bars display data on mitigation investment flows for four years: 2017, 2018, 2019 and 2020 by sector and by type of economy. For the regional breakdown, the annual average mitigation investment flows for 2017–2019 are shown. The grey bars show the minimum and maximum level of global annual mitigation investment needs in the assessed scenarios. This has been averaged until 2030. The multiplication factors show the ratio of global average early mitigation investment needs (averaged until 2030) and current yearly mitigation flows (averaged for 2017/18–2020). The lower multiplication factor refers to the lower end of the range of investment needs. The upper multiplication factor refers to the upper range of investment needs.
Given the multiple sources and lack of harmonised methodologies, the data can be considered only if indicative of the size and pattern of investment needs. {WGIII Figure TS.25, WGIII Sections 15.3, 15.4, 15.5, Table 15.2, Table 15.3, Table 15.4}