Figure SPM.2

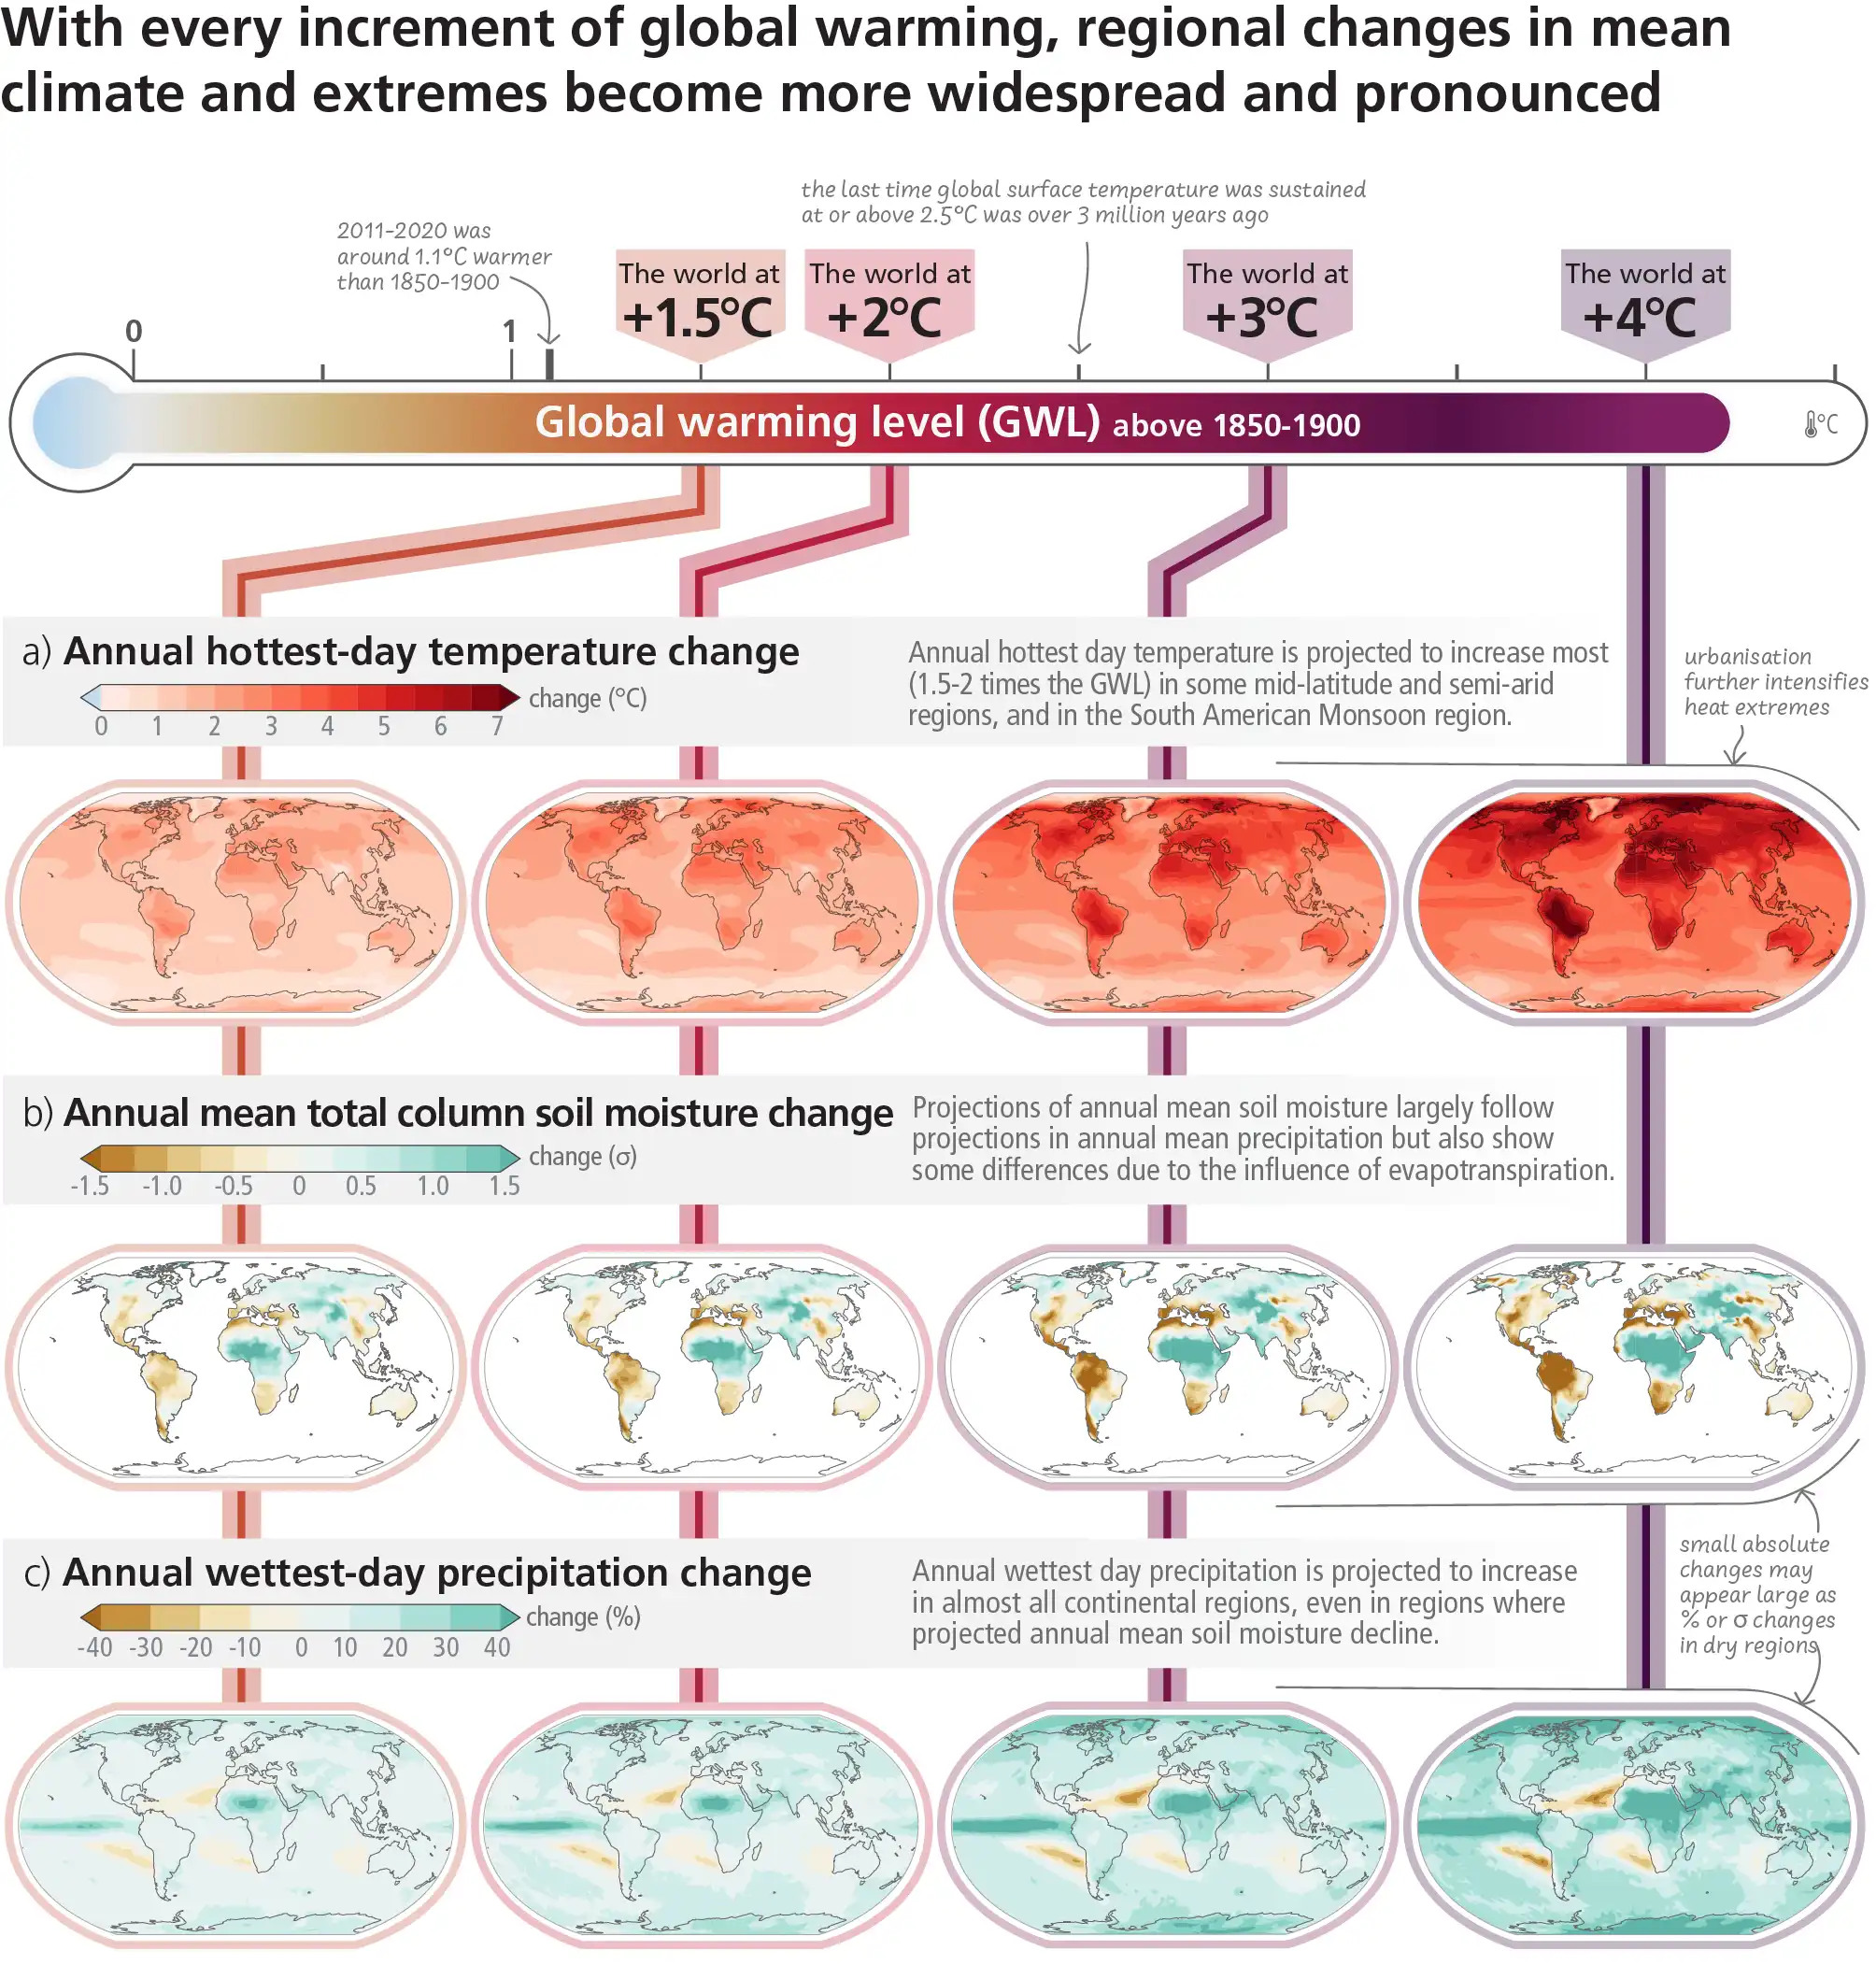
Figure SPM.2: Projected changes of annual maximum daily maximum temperature, annual mean total column soil moisture and annual maximum 1-day precipitation at global warming levels of 1.5°C, 2°C, 3°C, and 4°C relative to 1850–1900. Projected (a) annual maximum daily temperature change (°C), (b) annual mean total column soil moisture (standard deviation), (c) annual maximum 1-day precipitation change (%). The panels show CMIP6 multi-model median changes. In panels (b) and (c), large positive relative changes in dry regions may correspond to small absolute changes. In panel (b), the unit is the standard deviation of interannual variability in soil moisture during 1850–1900. Standard deviation is a widely used metric in characterising drought severity. A projected reduction in mean soil moisture by one standard deviation corresponds to soil moisture conditions typical of droughts that occurred about once every six years during 1850–1900. The WGI Interactive Atlas (https://interactive-atlas.ipcc.ch/ ) can be used to explore additional changes in the climate system across the range of global warming levels presented in this figure. {Figure 3.1, Cross-Section Box.2}