Figure SPM.4

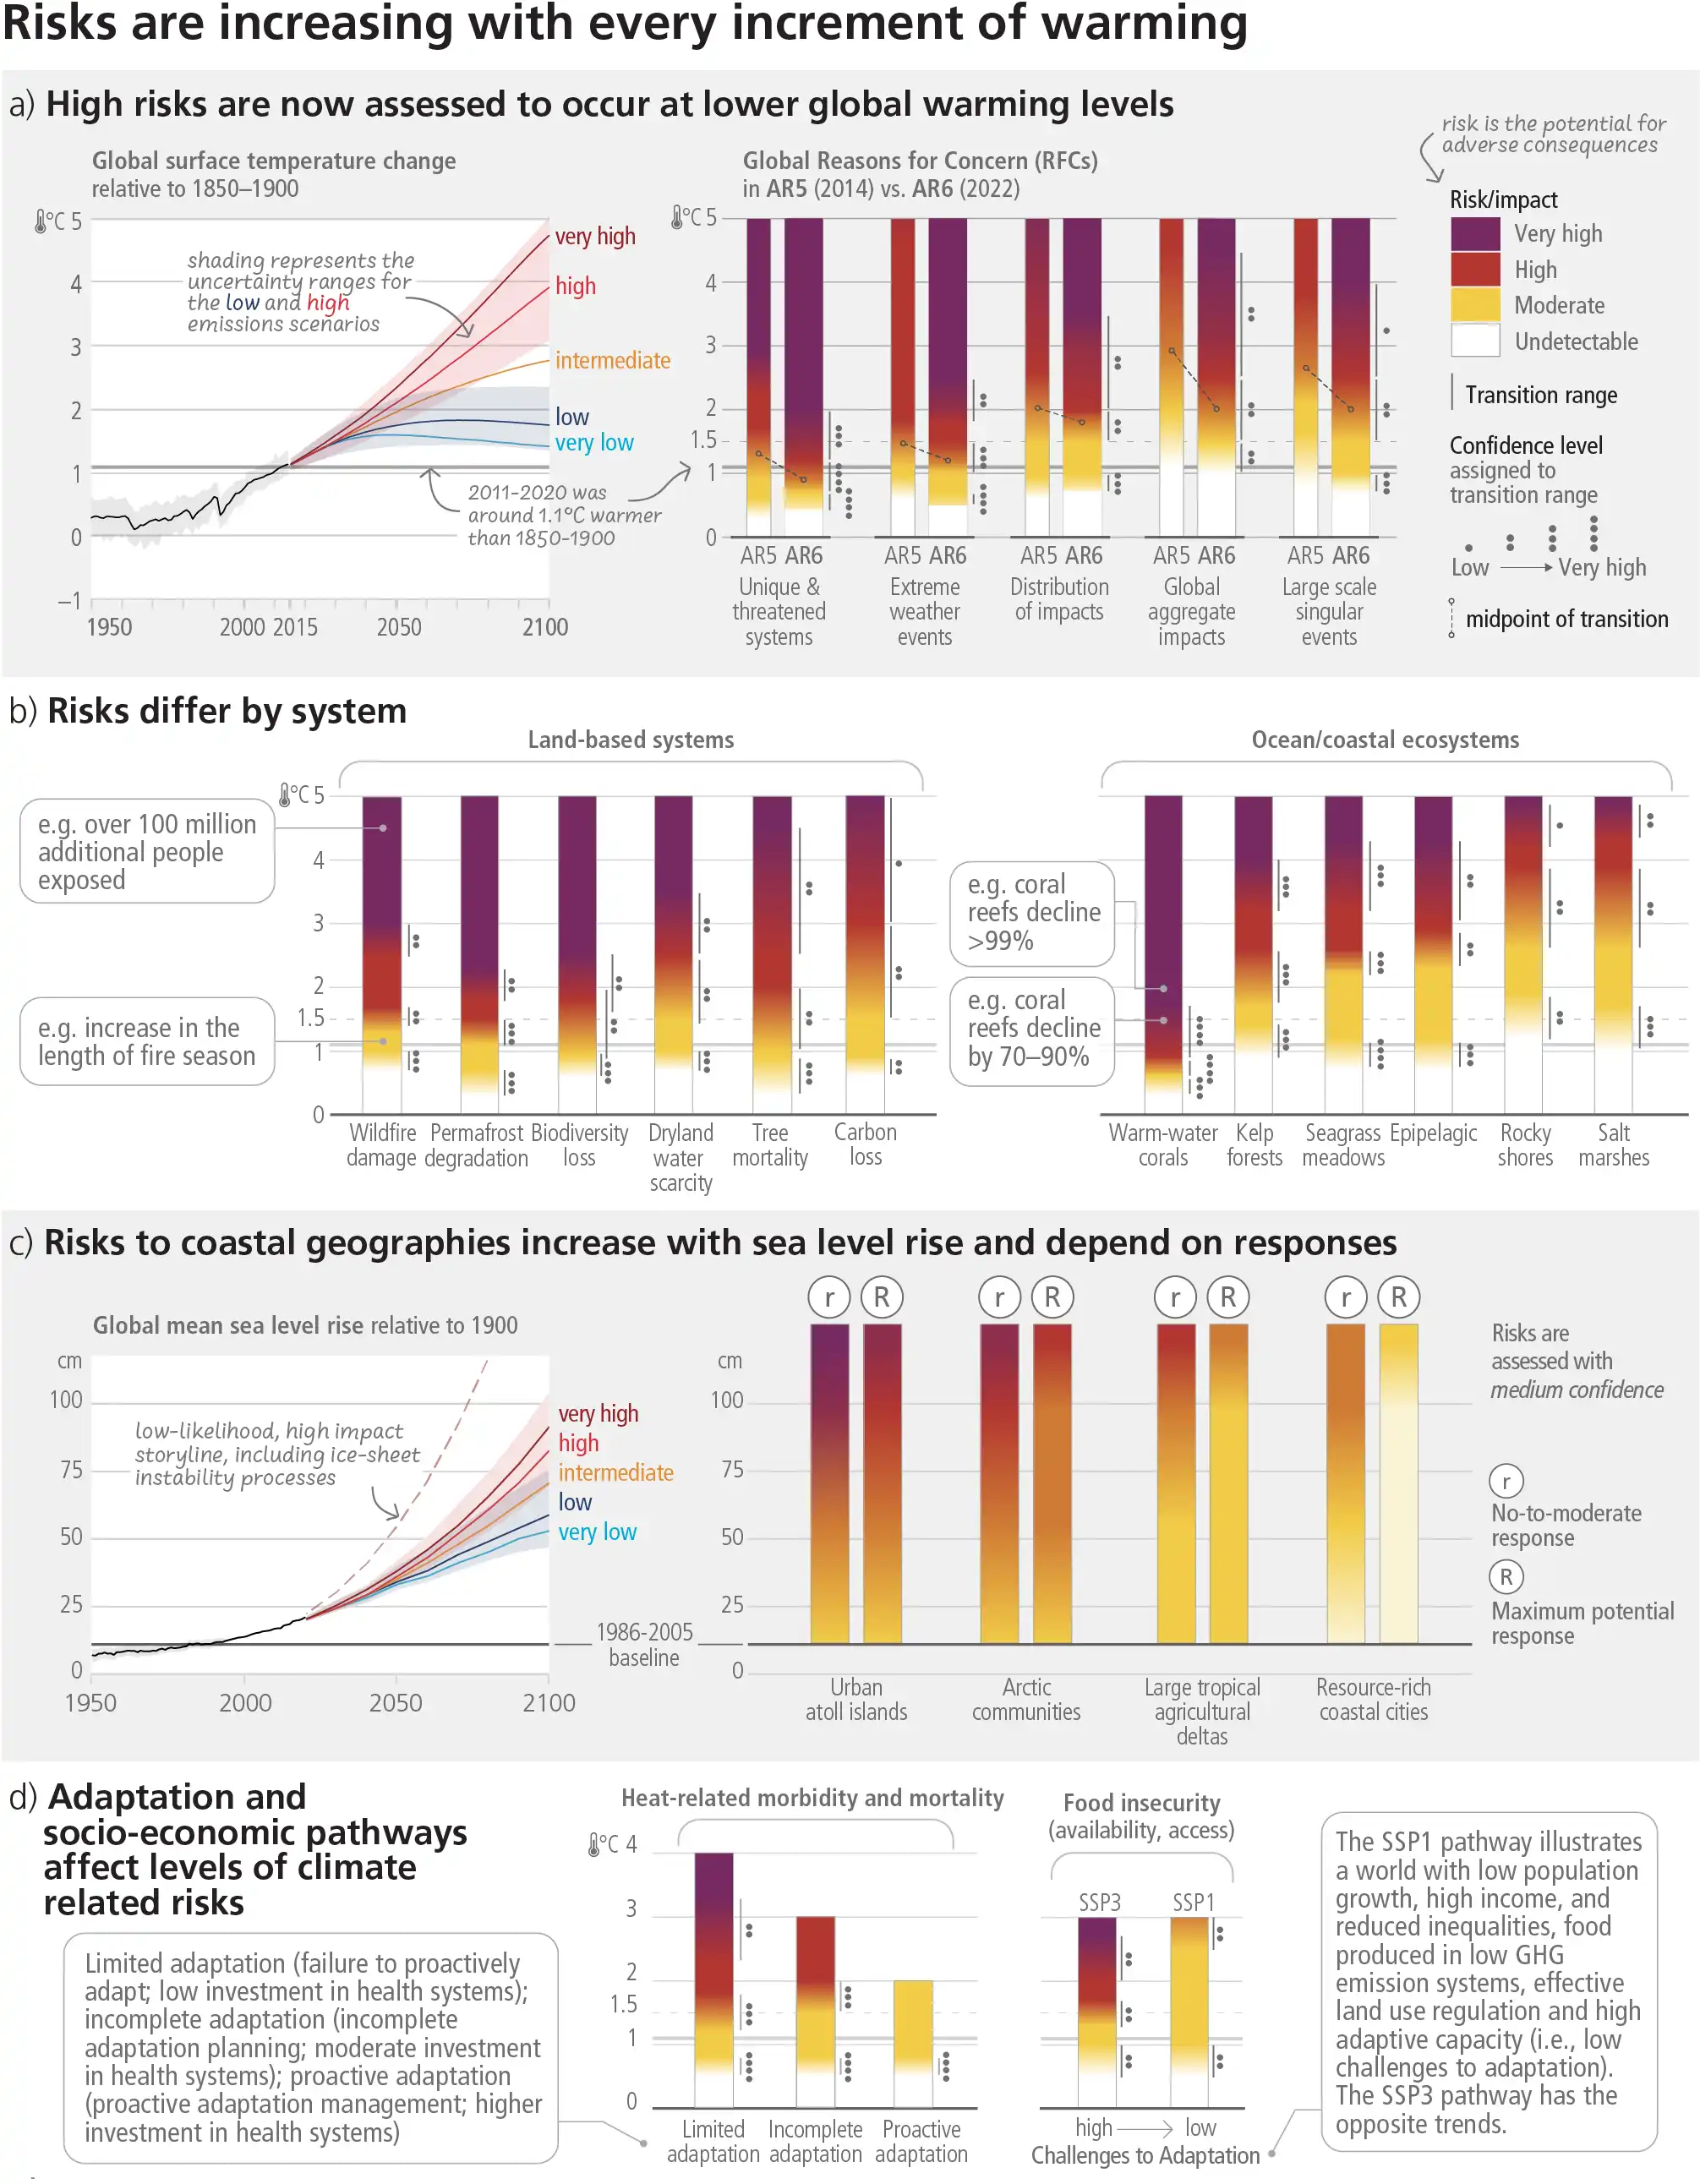
Figure SPM.4: Subset of assessed climate outcomes and associated global and regional climate risks. The burning embers result from a literature based expert elicitation. Panel (a): Left – Global surface temperature changes in °C relative to 1850–1900. These changes were obtained by combining CMIP6 model simulations with observational constraints based on past simulated warming, as well as an updated assessment of equilibrium climate sensitivity. Very likely ranges are shown for the low and high GHG emissions scenarios (SSP1-2.6 and SSP3-7.0) (Cross-Section Box 2); Right – Global Reasons for Concern (RFC), comparing AR6 (thick embers) and AR5 (thin embers) assessments. Risk transitions have generally shifted towards lower temperatures with updated scientific understanding. Diagrams are shown for each RFC, assuming low to no adaptation. Lines connect the midpoints of the transitions from moderate to high risk across AR5 and AR6. Panel (b): Selected global risks for land and ocean ecosystems, illustrating general increase of risk with global warming levels with low to no adaptation. Panel (c): Left - Global mean sea level change in centimetres, relative to 1900. The historical changes (black) are observed by tide gauges before 1992 and altimeters afterwards. The future changes to 2100 (coloured lines and shading) are assessed consistently with observational constraints based on emulation of CMIP, ice-sheet, and glacier models, and likely ranges are shown for SSP1-2.6 and SSP3-7.0. Right - Assessment of the combined risk of coastal flooding, erosion and salinization for four illustrative coastal geographies in 2100, due to changing mean and extreme sea levels, under two response scenarios, with respect to the SROCC baseline period (1986-2005). The assessment does not account for changes in extreme sea level beyond those directly induced by mean sea level rise; risk levels could increase if other changes in extreme sea levels were considered (e.g., due to changes in cyclone intensity). “No-to-moderate response” describes efforts as of today (i.e. no further significant action or new types of actions). “Maximum potential response” represent a combination of responses implemented to their full extent and thus significant additional efforts compared to today, assuming minimal financial, social and political barriers. (In this context, ‘today’ refers to 2019.) The assessment criteria include exposure and vulnerability, coastal hazards, in-situ responses and planned relocation. Planned relocation refers to managed retreat or resettlements. The term response is used here instead of adaptation because some responses, such as retreat, may or may not be considered to be adaptation. Panel (d): Selected risks under different socio-economic pathways, illustrating how development strategies and challenges to adaptation influence risk. Left - Heat-sensitive human health outcomes under three scenarios of adaptation effectiveness. The diagrams are truncated at the nearest whole ºC within the range of temperature change in 2100 under three SSP scenarios. Right - Risks associated with food security due to climate change and patterns of socio-economic development. Risks to food security include availability and access to food, including population at risk of hunger, food price increases and increases in disability adjusted life years attributable to childhood underweight. Risks are assessed for two contrasted socio-economic pathways (SSP1 and SSP3) excluding the effects of targeted mitigation and adaptation policies. {Figure 3.3} (Box SPM.1)