Figure SPM.7

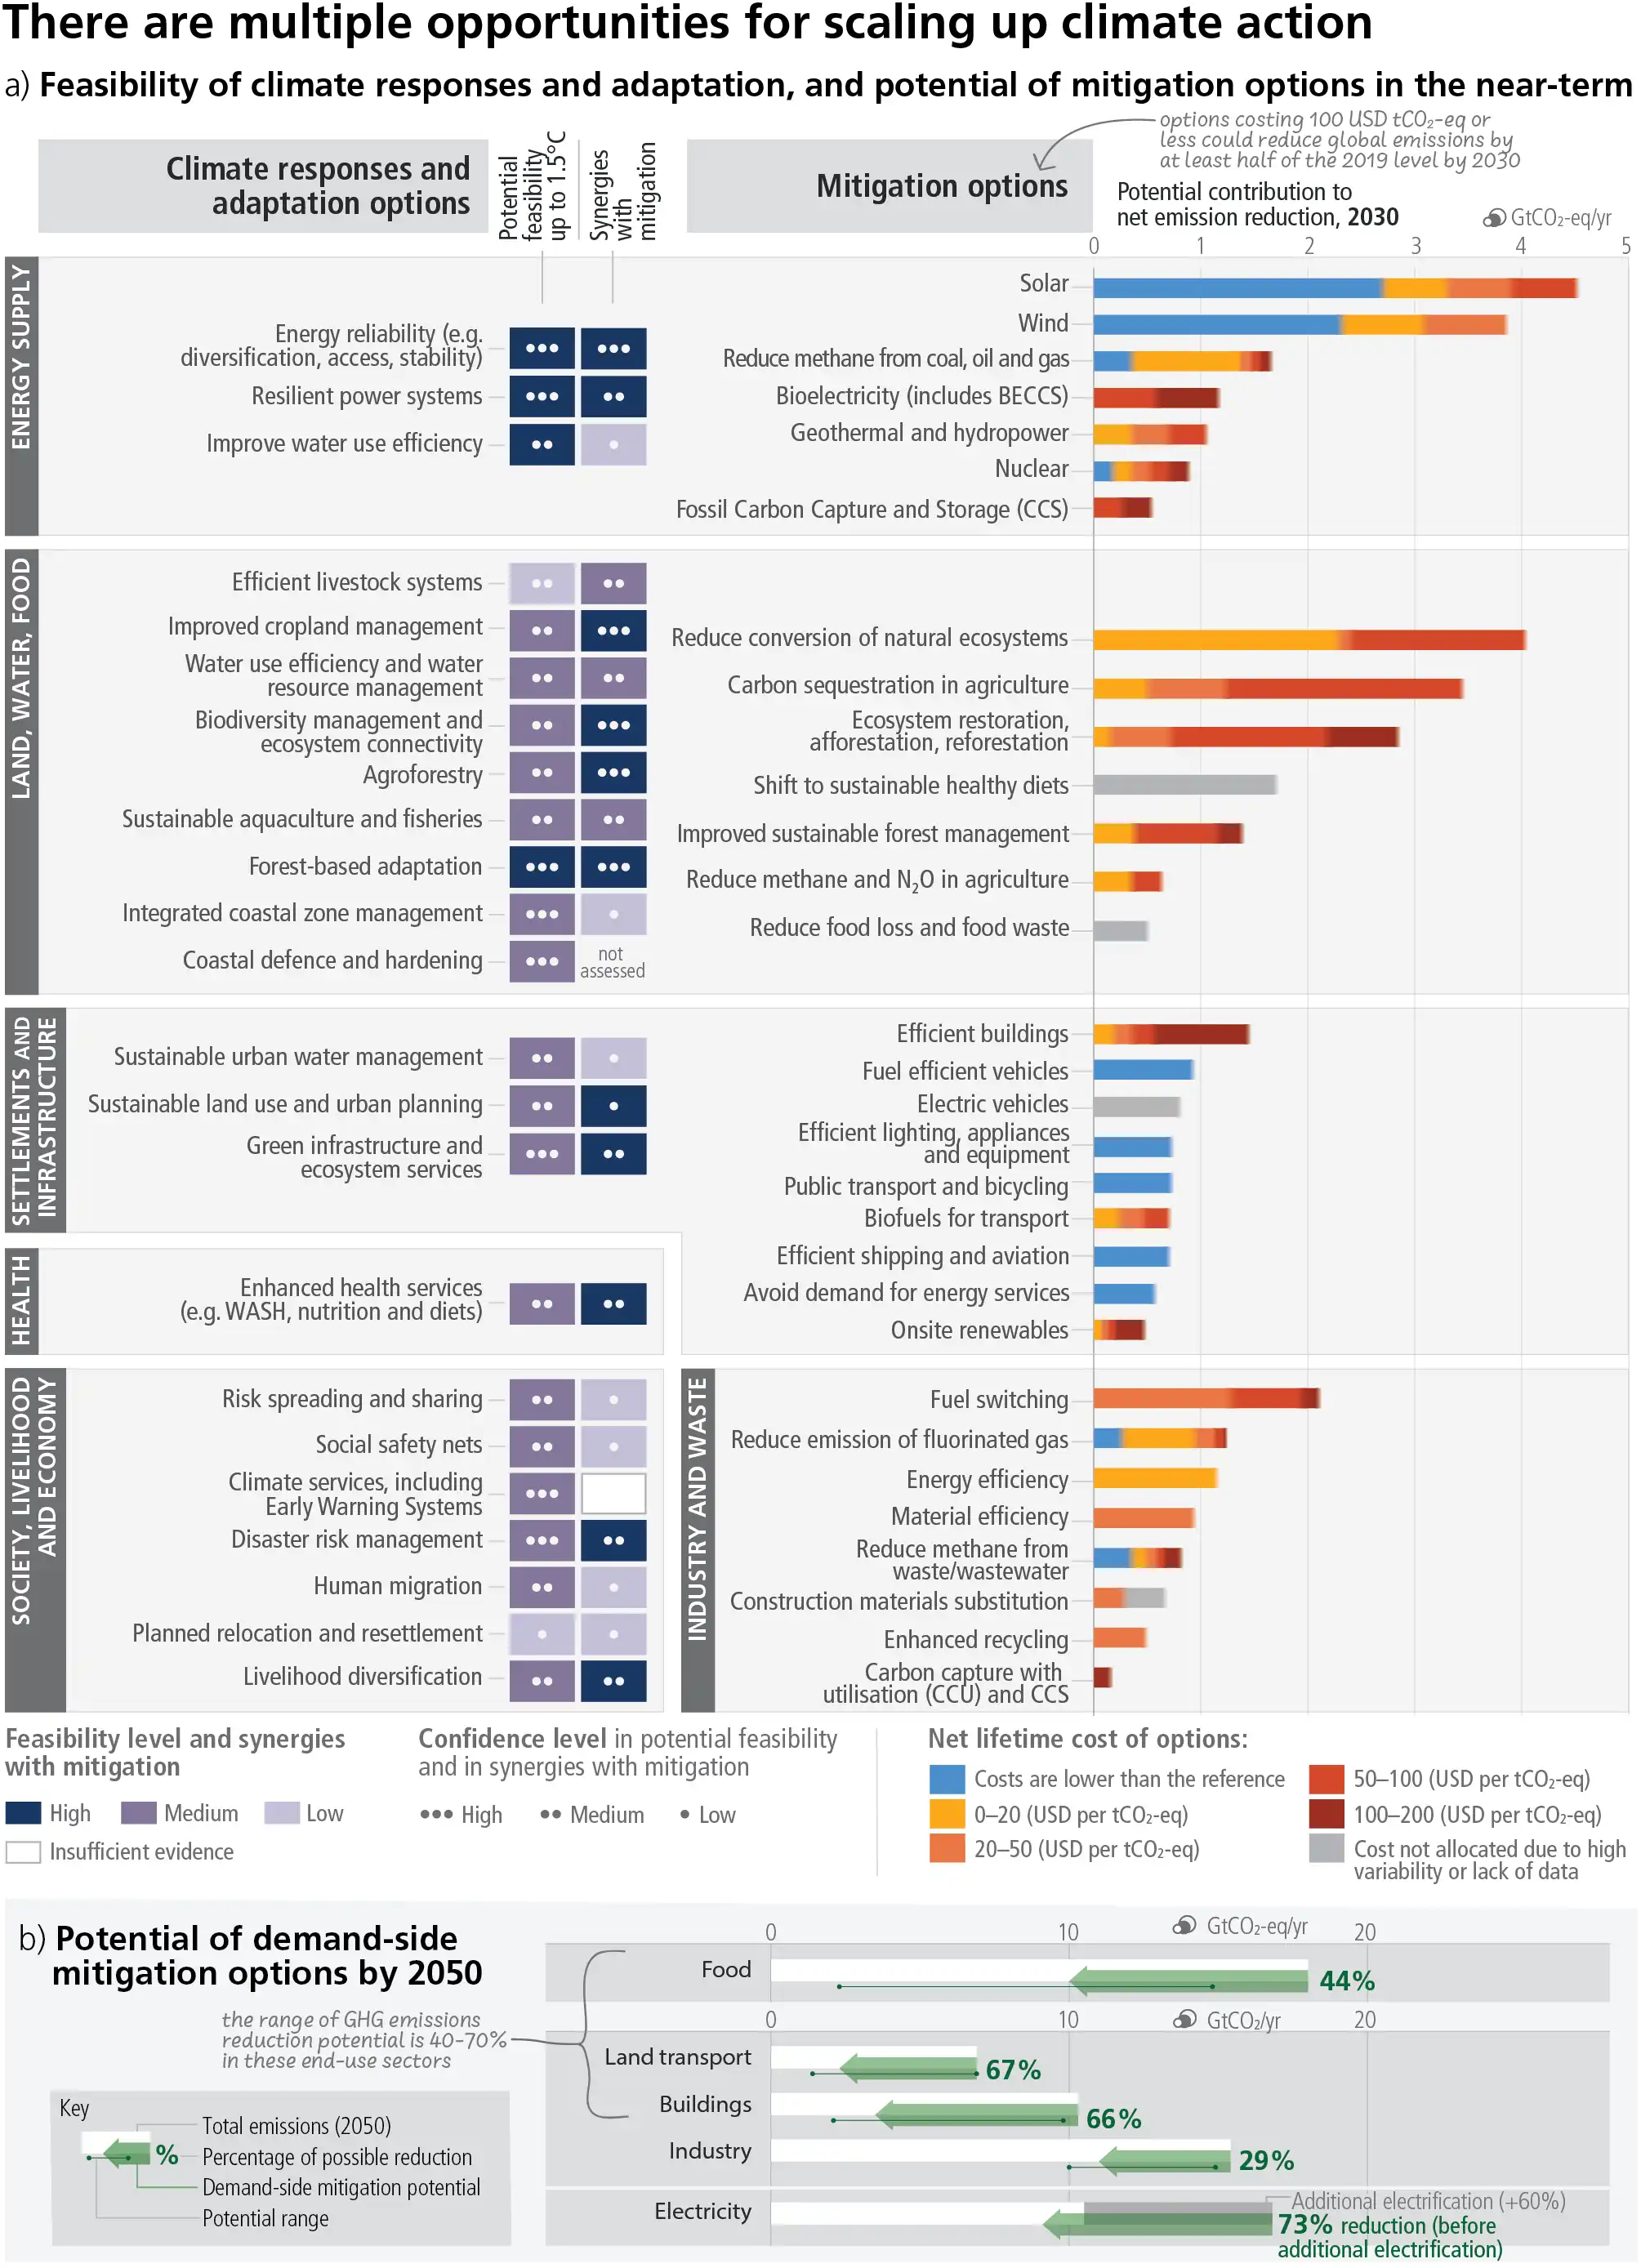
Figure SPM.7: Multiple Opportunities for scaling up climate action. Panel (a) presents selected mitigation and adaptation options across different systems. The left hand side of panel a shows climate responses and adaptation options assessed for their multidimensional feasibility at global scale, in the near term and up to 1.5°C global warming. As literature above 1.5°C is limited, feasibility at higher levels of warming may change, which is currently not possible to assess robustly. The term response is used here in addition to adaptation because some responses, such as migration, relocation and resettlement may or may not be considered to be adaptation. Forest based adaptation includes sustainable forest management, forest conservation and restoration, reforestation and afforestation. WASH refers to water, sanitation and hygiene. Six feasibility dimensions (economic, technological, institutional, social, environmental and geophysical) were used to calculate the potential feasibility of climate responses and adaptation options, along with their synergies with mitigation. For potential feasibility and feasibility dimensions, the figure shows high, medium, or low feasibility. Synergies with mitigation are identified as high, medium, and low. The right hand side of Panel a provides an overview of selected mitigation options and their estimated costs and potentials in 2030. Costs are net lifetime discounted monetary costs of avoided GHG emissions calculated relative to a reference technology. Relative potentials and costs will vary by place, context and time and in the longer term compared to 2030. The potential (horizontal axis) is the net GHG emission reduction (sum of reduced emissions and/or enhanced sinks) broken down into cost categories (coloured bar segments) relative to an emission baseline consisting of current policy (around 2019) reference scenarios from the AR6 scenarios database. The potentials are assessed independently for each option and are not additive. Health system mitigation options are included mostly in settlement and infrastructure (e.g., efficient healthcare buildings) and cannot be identified separately. Fuel switching in industry refers to switching to electricity, hydrogen, bioenergy and natural gas. Gradual colour transitions indicate uncertain breakdown into cost categories due to uncertainty or heavy context dependency. The uncertainty in the total potential is typically 25–50%. Panel (b) displays the indicative potential of demand-side mitigation options for 2050. Potentials are estimated based on approximately 500 bottom-up studies representing all global regions. The baseline (white bar) is provided by the sectoral mean GHG emissions in 2050 of the two scenarios (IEA-STEPS and IP_ModAct) consistent with policies announced by national governments until 2020. The green arrow represents the demand-side emissions reductions potentials. The range in potential is shown by a line connecting dots displaying the highest and the lowest potentials reported in the literature. Food shows demand-side potential of socio-cultural factors and infrastructure use, and changes in land-use patterns enabled by change in food demand. Demand-side measures and new ways of end-use service provision can reduce global GHG emissions in end-use sectors (buildings, land transport, food) by 40–70% by 2050 compared to baseline scenarios, while some regions and socioeconomic groups require additional energy and resources. The last row shows how demand-side mitigation options in other sectors can influence overall electricity demand. The dark grey bar shows the projected increase in electricity demand above the 2050 baseline due to increasing electrification in the other sectors. Based on a bottom-up assessment, this projected increase in electricity demand can be avoided through demand-side mitigation options in the domains of infrastructure use and socio-cultural factors that influence electricity usage in industry, land transport, and buildings (green arrow). {Figure 4.4}