Back chapter figures
Cross-Chapter Box 11.1, Figure 3
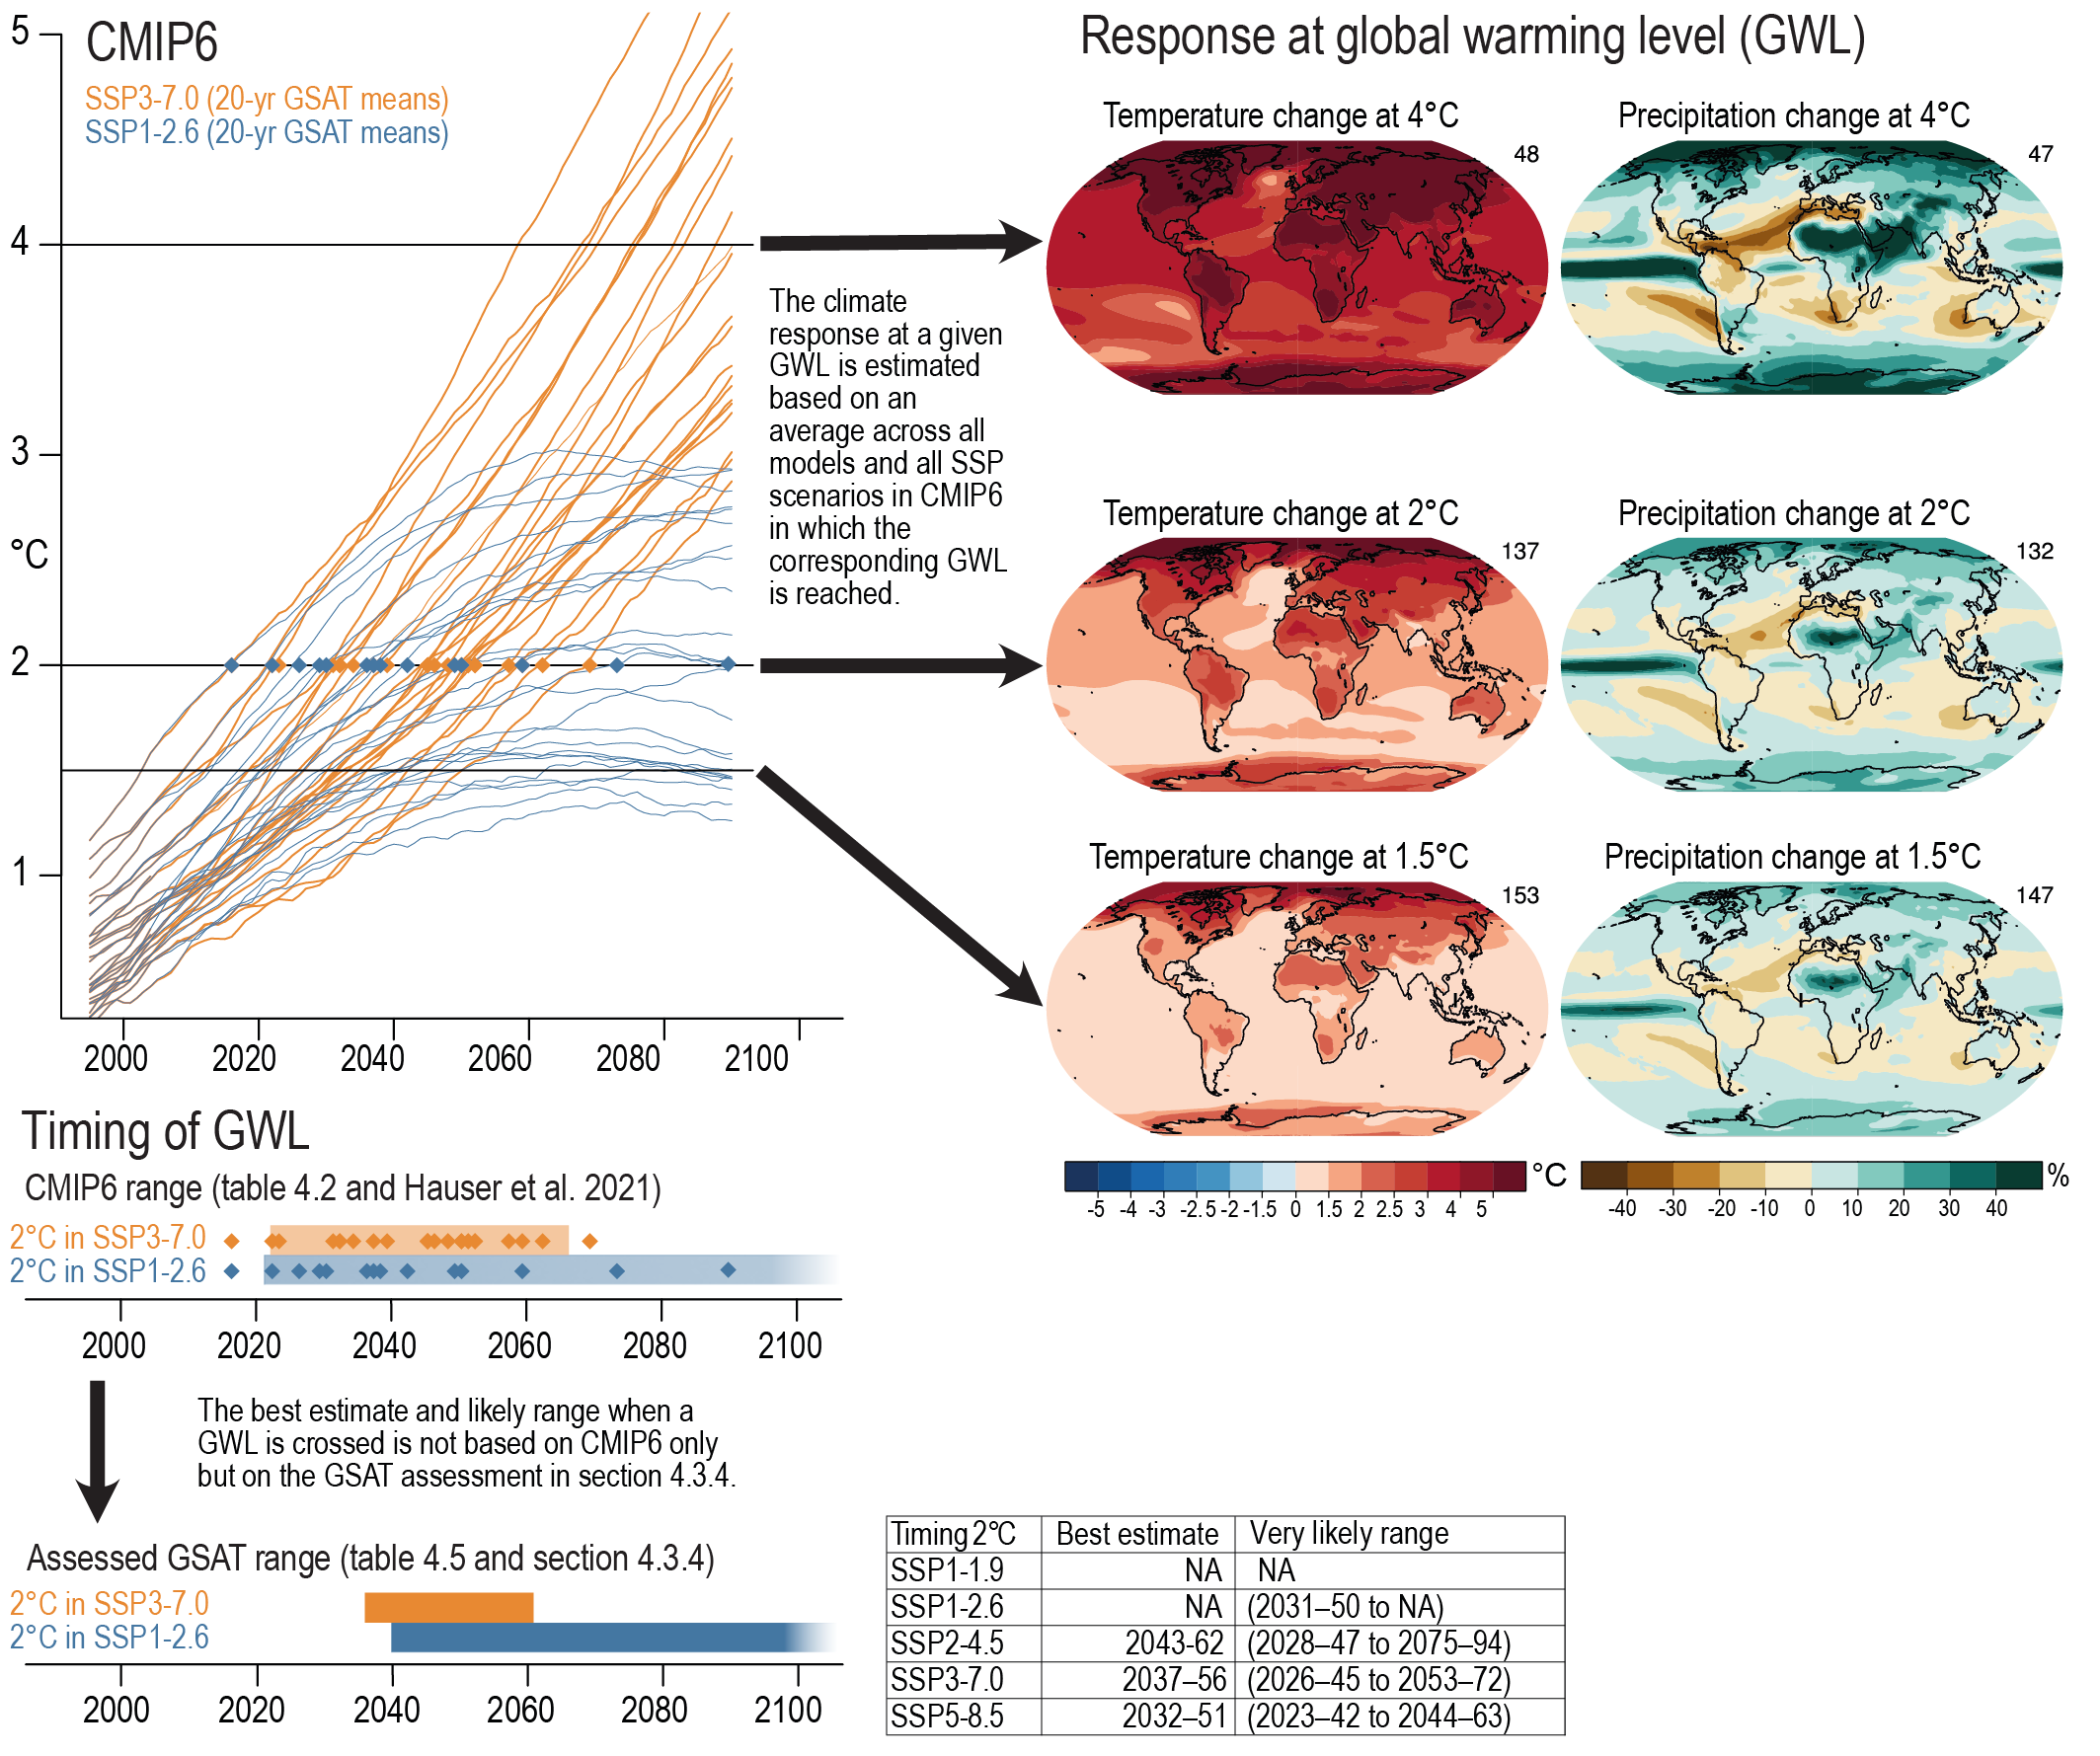
Figure caption
Cross-Chapter Box11.1, Figure 3 | Illustration of the AR6 global warming level (GWL) sampling approach to derive the timing and the response at a given GWL for the case of Coupled Model Intercomparison Project Phase 6 (CMIP6) data. For the mapping of scenarios/time slices into GWLs for CMIP6, please refer to Table 4.2. Respective numbers for the CMIP5 multi-model experiment are provided in Chapter 11 Supplementary Material (11.SM.1). Note that the time frames used to derive the GWL time slices can also include a different number of years (e.g., 30 years for some analyses).