Chapter 11: Weather and Climate Extreme Events in a Changing Climate


This Chapter should be cited as:
Seneviratne, S.I., X. Zhang, M. Adnan, W. Badi, C. Dereczynski, A. Di Luca, S. Ghosh, I. Iskandar, J. Kossin, S. Lewis, F. Otto, I. Pinto, M. Satoh, S.M. Vicente-Serrano, M. Wehner, and B. Zhou, 2021: Weather and Climate Extreme Events in a Changing Climate. In Climate Change 2021: The Physical Science Basis. Contribution of Working Group I to the Sixth Assessment Report of the Intergovernmental Panel on Climate Change[Masson-Delmotte, V., P. Zhai, A. Pirani, S.L. Connors, C. Péan, S. Berger, N. Caud, Y. Chen, L. Goldfarb, M.I. Gomis, M. Huang, K. Leitzell, E. Lonnoy, J.B.R. Matthews, T.K. Maycock, T. Waterfield, O. Yelekçi, R. Yu, and B. Zhou (eds.)]. Cambridge University Press, Cambridge, United Kingdom and New York, NY, USA, pp. 1513–1766, doi: 10.1017/9781009157896.013.
Executive Summary
This chapter assesses changes in weather and climate extremes on regional and global scales, including observed changes and their attribution, as well as projected changes. The extremes considered include temperature extremes, heavy precipitation and pluvial floods, river floods, droughts, storms (including tropical cyclones), as well as compound events (multivariate and concurrent extremes). The assessment focuses on land regions excluding Antarctica. Changes in marine extremes are addressed in Chapter 9 and Cross-Chapter Box 9.1. Assessments of past changes and their drivers are from 1950 onward, unless indicated otherwise. Projections for changes in extremes are presented for different levels of global warming, supplemented with information for the conversion to emissions scenario-based projections (Cross-Chapter Box 11.1 and Table 4.2). Since the IPCC Fifth Assessment Report (AR5), there have been important new developments and knowledge advances on changes in weather and climate extremes, in particular regarding human influence on individual extreme events, on changes in droughts, tropical cyclones, and compound events, and on projections at different global warming levels (1.5°C–4°C). These, together with new evidence at regional scales, provide a stronger basis and more regional information for the AR6 assessment on weather and climate extremes.
It is an established fact that human-induced greenhouse gas emissions have led to an increased frequency and/or intensity of some weather and climate extremes since pre-industrial time, in particular for temperature extremes. Evidence of observed changes in extremes and their attribution to human influence (including greenhouse gas and aerosol emissions and land-use changes) has strengthened since AR5, in particular for extreme precipitation, droughts, tropical cyclones and compound extremes (including dry/hot events and fire weather). Some recent hot extreme events would have been extremely unlikely to occur without human influence on the climate system. {11.2, 11.3, 11.4, 11.6, 11.7, 11.8}
Regional changes in the intensity and frequency of climate extremes generally scale with global warming. New evidence strengthens the conclusion from the IPCC Special Report on Global Warming of 1.5°C (SR1.5) that even relatively small incremental increases in global warming (+0.5°C) cause statistically significant changes in extremes on the global scale and for large regions (high confidence). In particular, this is the case for temperature extremes (very likely ), the intensification of heavy precipitation (high confidence) including that associated with tropical cyclones (medium confidence), and the worsening of droughts in some regions (high confidence). The occurrence of extreme events unprecedented in the observed record will rise with increasing global warming, even at 1.5°C of global warming. Projected percentage changes in frequency are higher for the rarer extreme events (high confidence). {11.1, 11.2, 11.3, 11.4, 11.6, 11.9, Cross-Chapter Box 11.1}
Methods and Data for Extremes
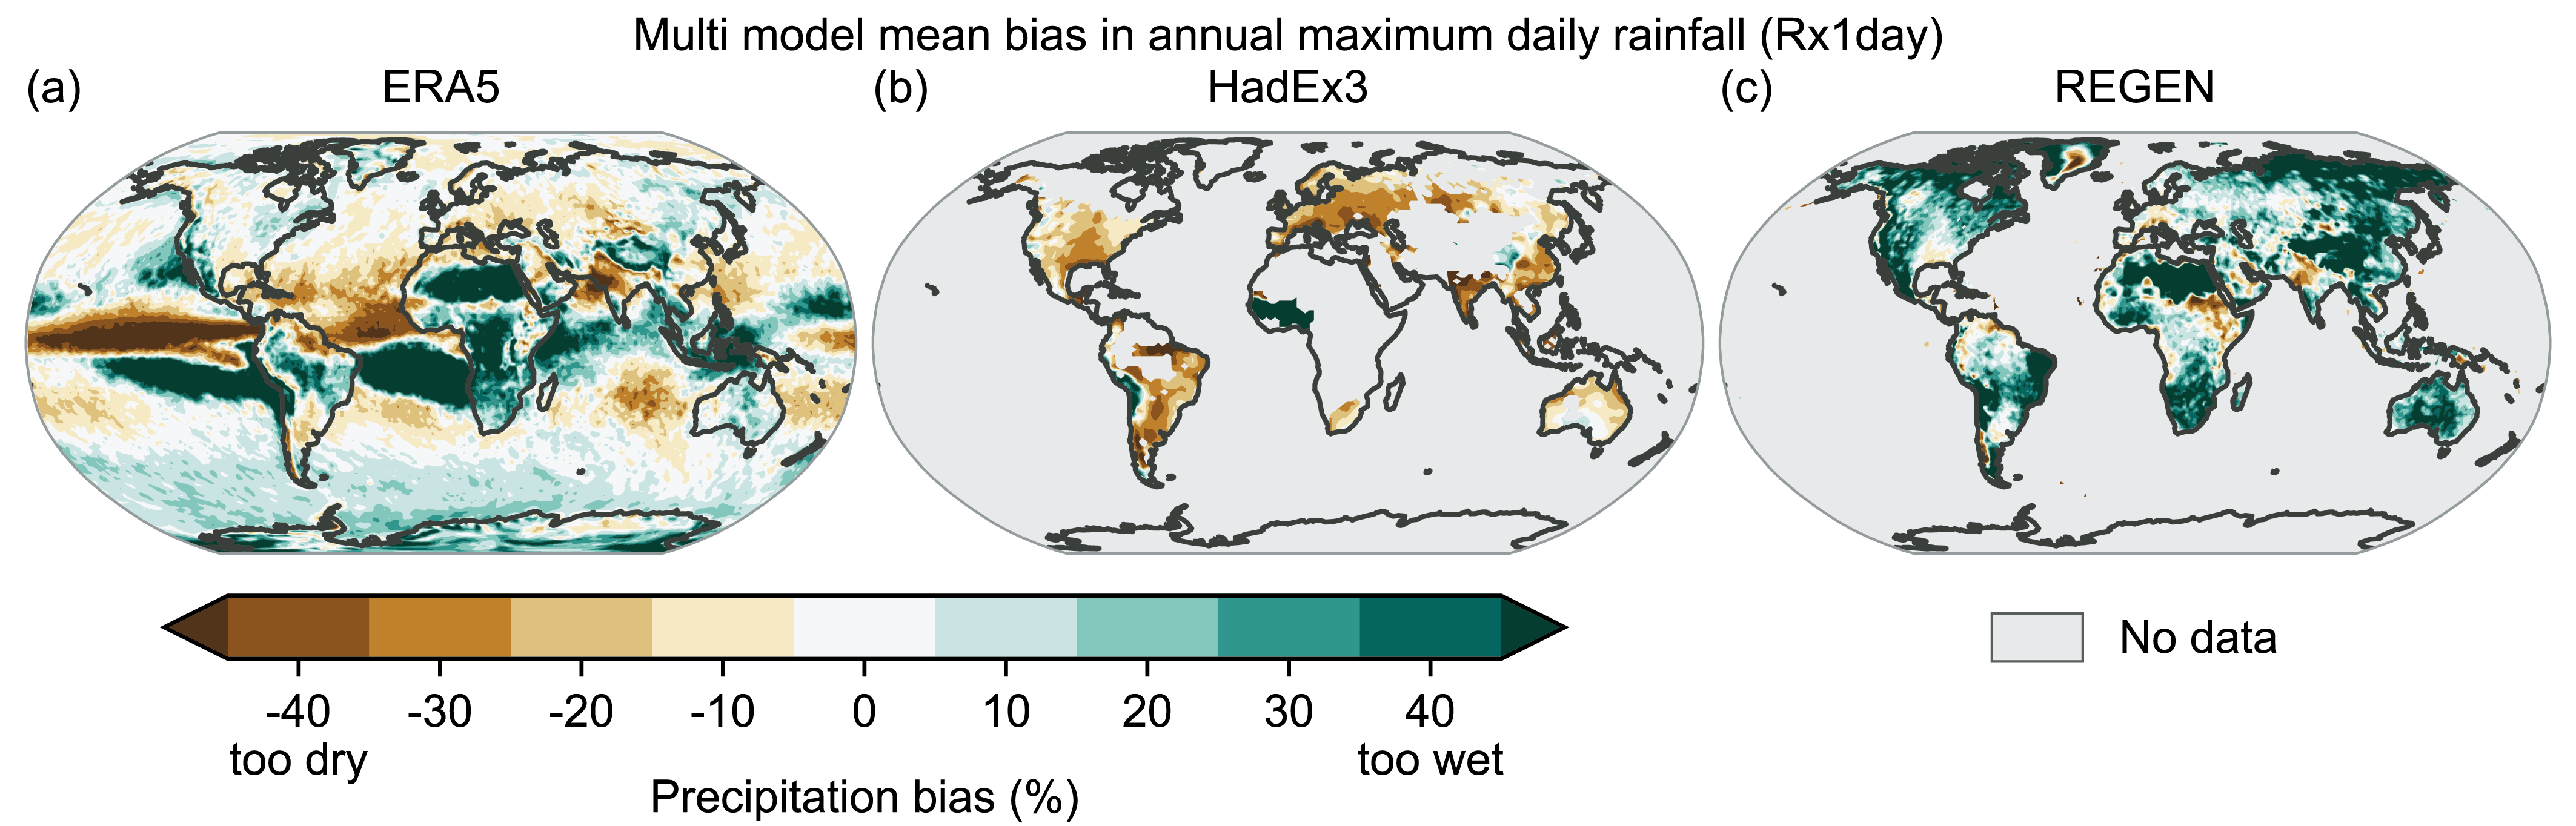
Since AR5, the confidence about past and future changes in weather and climate extremes has increased due to better physical understanding of processes, an increasing proportion of the scientific literature combining different lines of evidence, and improved accessibility to different types of climate models (high confidence). There have been improvements in some observation-based datasets, including reanalysis data (high confidence). Climate models can reproduce the sign (direction) of changes in temperature extremes observed globally and in most regions, although the magnitude of the trends may differ (high confidence). Models are able to capture the large-scale spatial distribution of precipitation extremes over land (high confidence). The intensity and frequency of extreme precipitation simulated by Coupled Model Intercomparison Project Phase 6 (CMIP6) models are similar to those simulated by CMIP5 models (high confidence). Higher horizontal model resolution improves the spatial representation of some extreme events (e.g., heavy precipitation events), in particular in regions with highly varying topography (high confidence). {11.2, 11.3, 11.4}
Temperature Extremes
The frequency and intensity of hot extremes (including heatwaves) have increased, and those of cold extremes have decreased on the global scale since 1950 (virtually certain). This also applies at regional scale, with more than 80% of AR6 regions1showing similar changes assessed to be at leastlikely . In a few regions, limited evidence (data or literature) prevents the reliable estimation of trends. {11.3, 11.9}
Human-induced greenhouse gas forcing is the main driver of the observed changes in hot and cold extremes on the global scale (virtually certain ) and on most continents (very likely ). The effect of enhanced greenhouse gas concentrations on extreme temperatures is moderated or amplified at the regional scale by regional processes such as soil moisture or snow/ice-albedo feedbacks, by regional forcing from land-use and land-cover changes, or aerosol concentrations, and decadal and multi-decadal natural variability. Changes in anthropogenic aerosol concentrations have likely affected trends in hot extremes in some regions. Irrigation and crop expansion have attenuated increases in summer hot extremes in some regions, such as the Midwestern USA (medium confidence). Urbanization has likely exacerbated changes in temperature extremes in cities, in particular for nighttime extremes. {11.1, 11.2, 11.3}
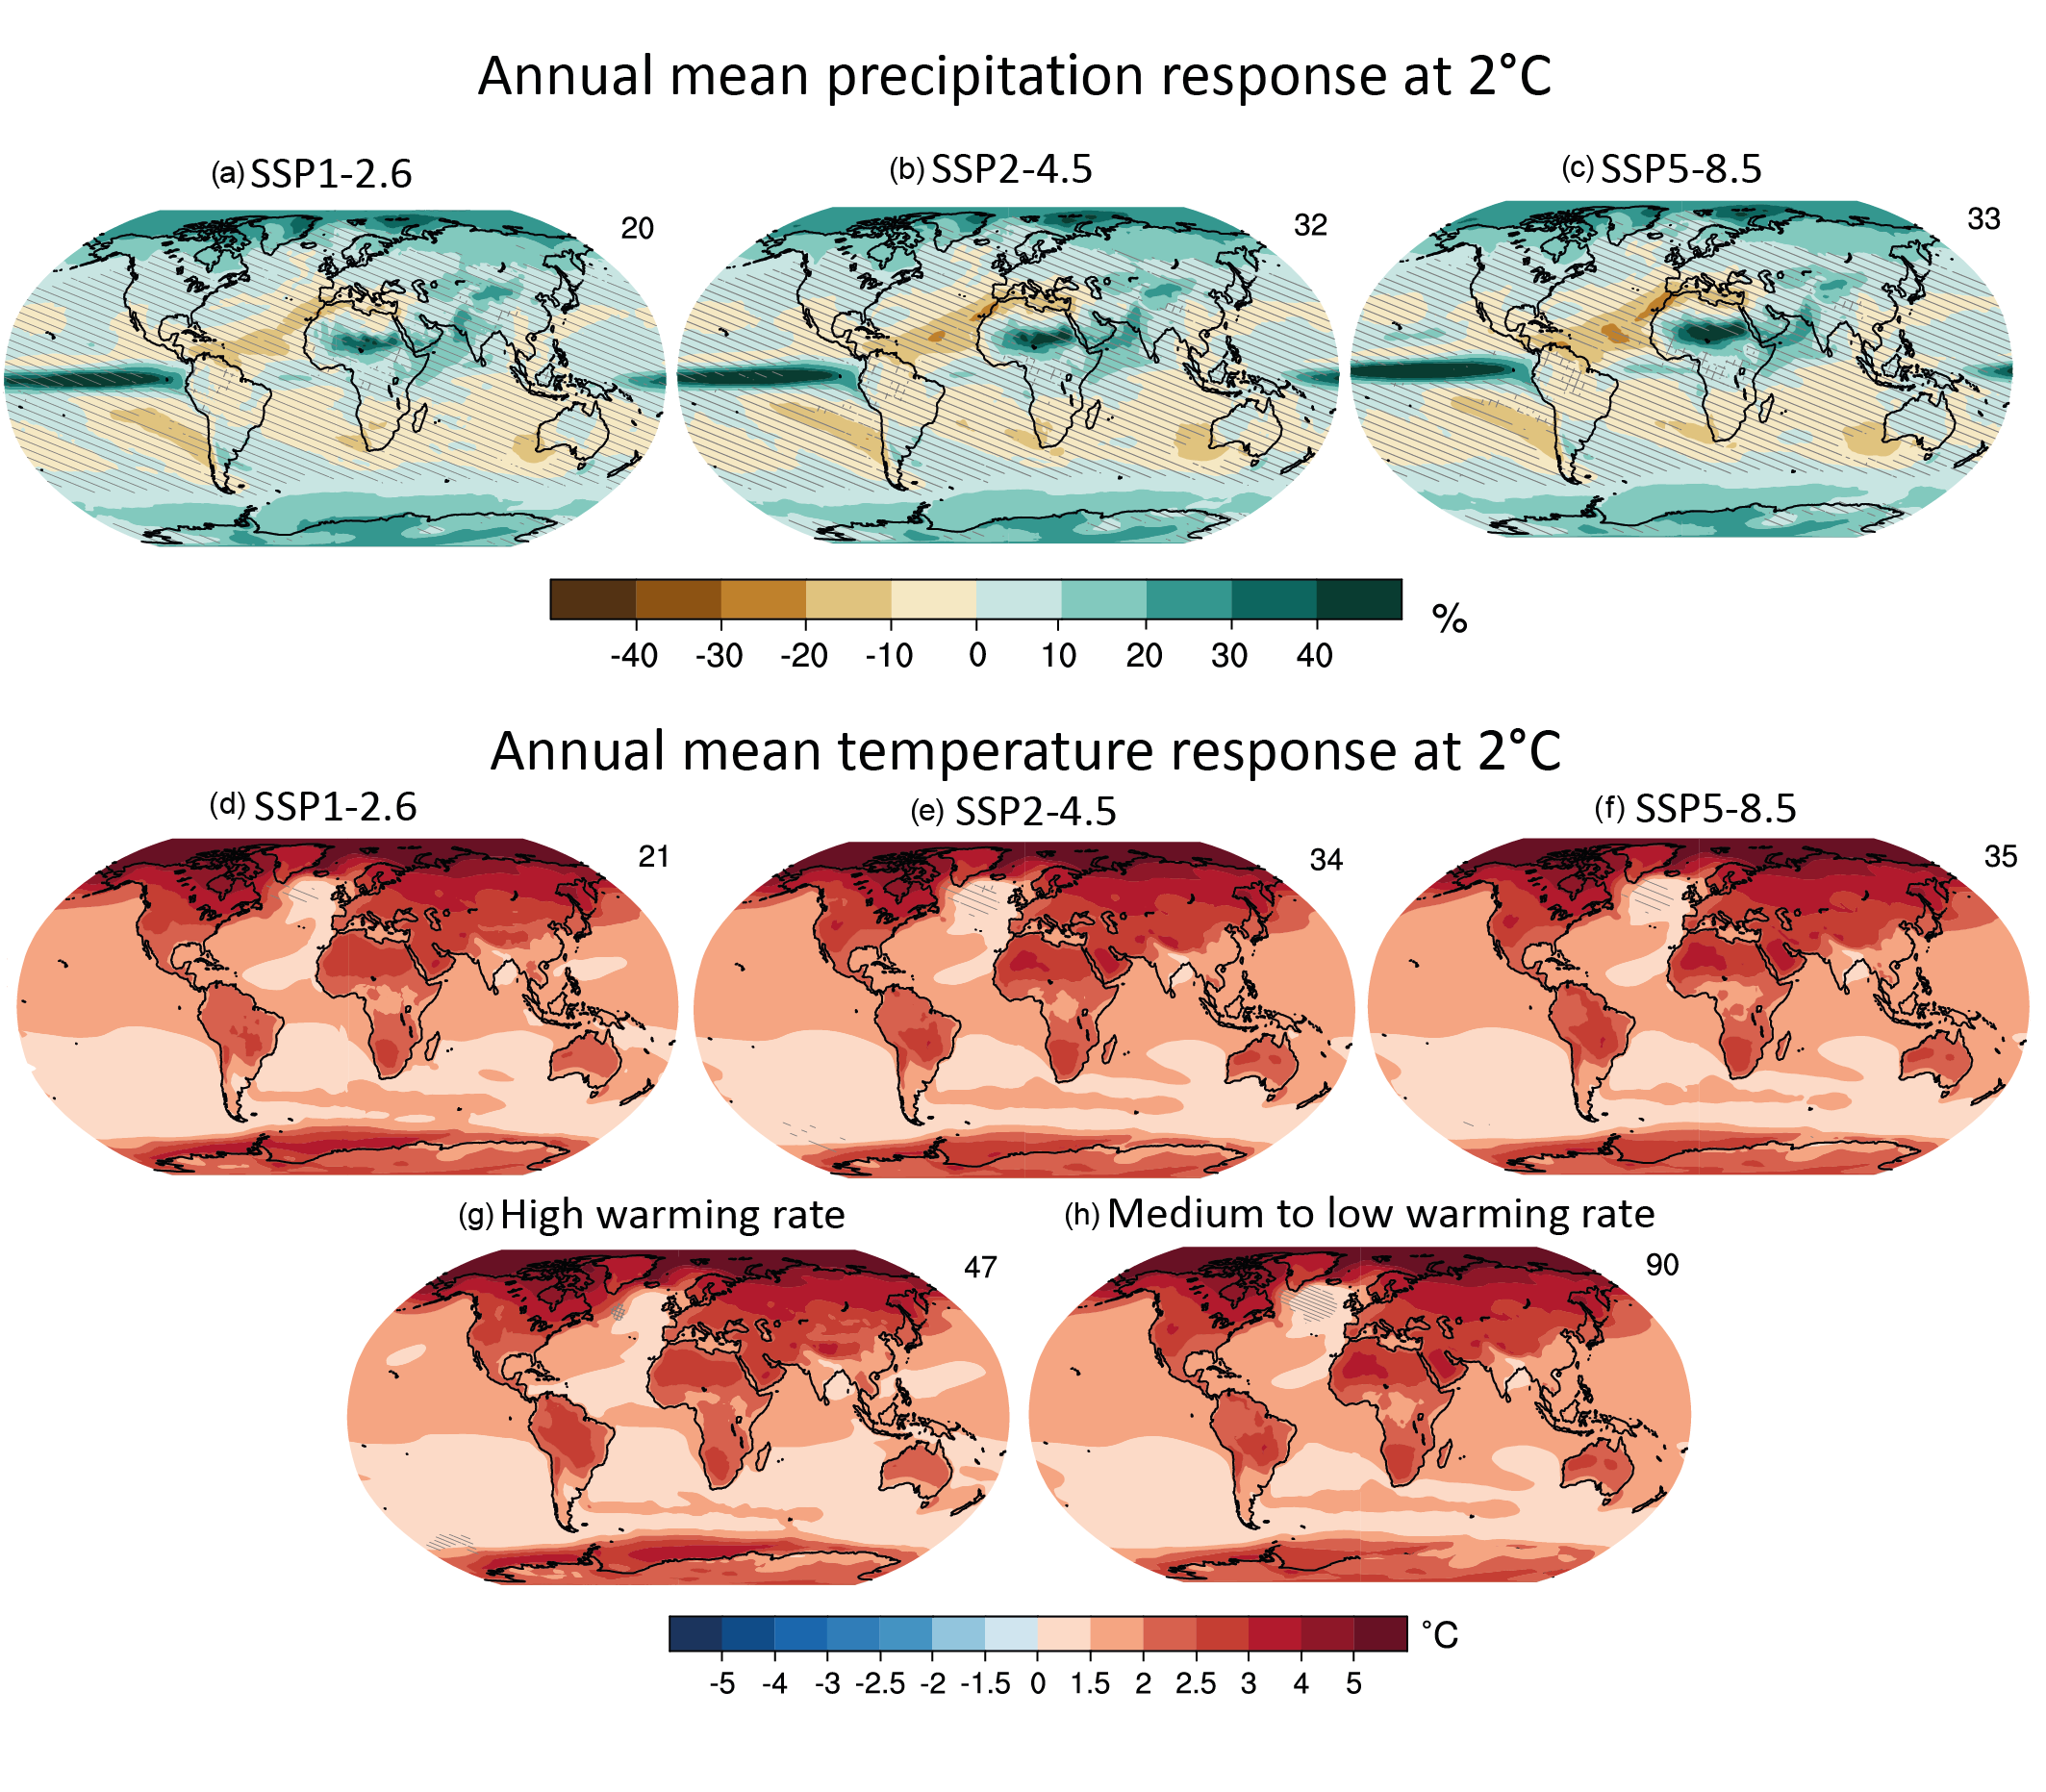
The frequency and intensity of hot extremes will continue to increase and those of cold extremes will continue to decrease, at global and continental scales and in nearly all inhabited regions1 with increasing global warming levels. This will be the case even if global warming is stabilized at 1.5°C. Relative to present-day conditions, changes in the intensity of extremes would be at least double at 2°C, and quadruple at 3°C of global warming, compared to changes at 1.5°C of global warming. The number of hot days and hot nights and the length, frequency, and/or intensity of warm spells or heatwaves will increase over most land areas (virtually certain). In most regions, future changes in the intensity of temperature extremes will very likely be proportional to changes in global warming, and up to two to three times larger (high confidence). The highest increase of temperature of hottest days is projected in some mid-latitude and semi-arid regions and in the South American Monsoon region, at about 1.5 times to twice the rate of global warming (high confidence). The highest increase of temperature of coldest days is projected in Arctic regions, at about three times the rate of global warming (high confidence). The frequency of hot temperature extreme events will very likely increase nonlinearly with increasing global warming, with larger percentage increases for rarer events. {11.2, 11.3, 11.9; Table 11.1; Figure 11.3}
Heavy Precipitation andPluvial Floods
The frequency and intensity of heavy precipitation events have likely increased at the global scale over a majority of land regions with good observational coverage. Heavy precipitation has likely increased on the continental scale over three continents: North America, Europe, and Asia. Regional increases in the frequency and/or intensity of heavy precipitation have been observed with at least medium confidence for nearly half of AR6 regions, including WSAF, ESAF, WSB, SAS, ESB, RFE, WCA, ECA, TIB, EAS, SEA, NAU, NEU, EEU, GIC, WCE, SES, CNA, and ENA. {11.4, 11.9}
Human influence, in particular greenhouse gas emissions, is likely the main driver of the observed global-scale intensification of heavy precipitation over land regions. It is likely that human-induced climate change has contributed to the observed intensification of heavy precipitation at the continental scale in North America, Europe and Asia. Evidence of a human influence on heavy precipitation has emerged in some regions (high confidence). {11.4, 11.9, Table 11.1}
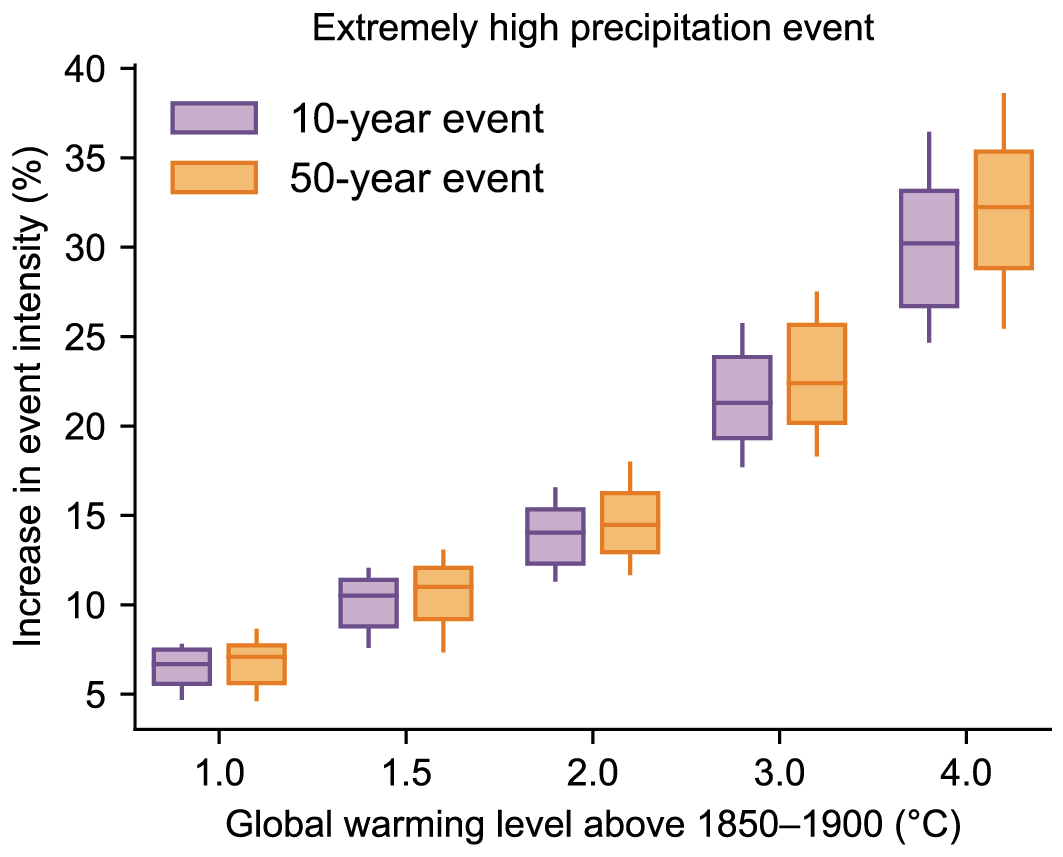
Heavy precipitation will generally become more frequent and more intense with additional global warming. At a global warming level of 4°C relative to the pre-industrial level, very rare (e.g., one in 10 or more years) heavy precipitation events would become more frequent and more intense than in the recent past, on the global scale (virtually certain ) and in all continents and AR6 regions. The increase in frequency and intensity is extremely likely for most continents and very likely for most AR6 regions. At the global scale, the intensification of heavy precipitation will follow the rate of increase in the maximum amount of moisture that the atmosphere can hold as it warms (high confidence), of about 7% per 1°C of global warming. The increase in the frequency of heavy precipitation events will be non-linear with more warming and will be higher for rarer events (high confidence), with a likely doubling and tripling in the frequency of 10-year and 50-year events, respectively, compared to the recent past at 4°C of global warming. Increases in the intensity of extreme precipitation at regional scales will vary, depending on the amount of regional warming, changes in atmospheric circulation and storm dynamics (high confidence). {11.4, Box 11.1}
The projected increase in the intensity of extreme precipitation translates to an increase in the frequency and magnitude of pluvial floods – surface water and flash floods – (high confidence), as pluvial flooding results from precipitation intensity exceeding the capacity of natural and artificial drainagesystems. {11.4}
River Floods
Significant trends in peak streamflow have been observed in some regions over the past decades (high confidence). The seasonality of river floods has changed in cold regions where snow-melt is involved, with an earlier occurrence of peak streamflow (high confidence). {11.5}
Global hydrological models project a larger fraction of land areas to be affected by an increase in river floods than by a decrease in river floods (medium confidence). Regional changes in river floods are more uncertain than changes in pluvial floods because complex hydrological processes and forcings, including land cover change and human water management, are involved. {11.5}
Droughts
Different drought types exist, and they are associated with different impacts and respond differently to increasing greenhouse gas concentrations. Precipitation deficits and changes in evapotranspiration govern net water availability. A lack of sufficient soil moisture, sometimes amplified by increased atmospheric evaporative demand, results in agricultural and ecological drought. Lack of runoff and surface water result in hydrological drought. {11.6}
Human-induced climate change has contributed to increases in agricultural andecological droughts in some regions due to evapotranspiration increases (medium confidence). Increases in evapotranspiration have been driven by increases in atmospheric evaporative demand induced by increased temperature, decreased relative humidity and increased net radiation (high confidence). Trends in precipitation are not a main driver in affecting global-scale trends in drought (medium confidence), but have induced increases in meteorological droughts in a few AR6 regions (NES: high confidence; WAF, CAF, ESAF, SAM, SWS, SSA, SAS: medium confidence). Increasing trends in agricultural and ecological droughts have been observed on all continents (WAF, CAF, WSAF, ESAF, WCA, ECA, EAS, SAU, MED, WCE, WNA, NES: medium confidence), but decreases only in one AR6 region (NAU: medium confidence). Increasing trends in hydrological droughts have been observed in a few AR6 regions (MED: high confidence; WAF, EAS, SAU: medium confidence). Regional-scale attribution shows that human-induced climate change has contributed to increased agricultural and ecological droughts (MED, WNA), and increased hydrological drought (MED) in some regions (medium confidence). {11.6, 11.9}
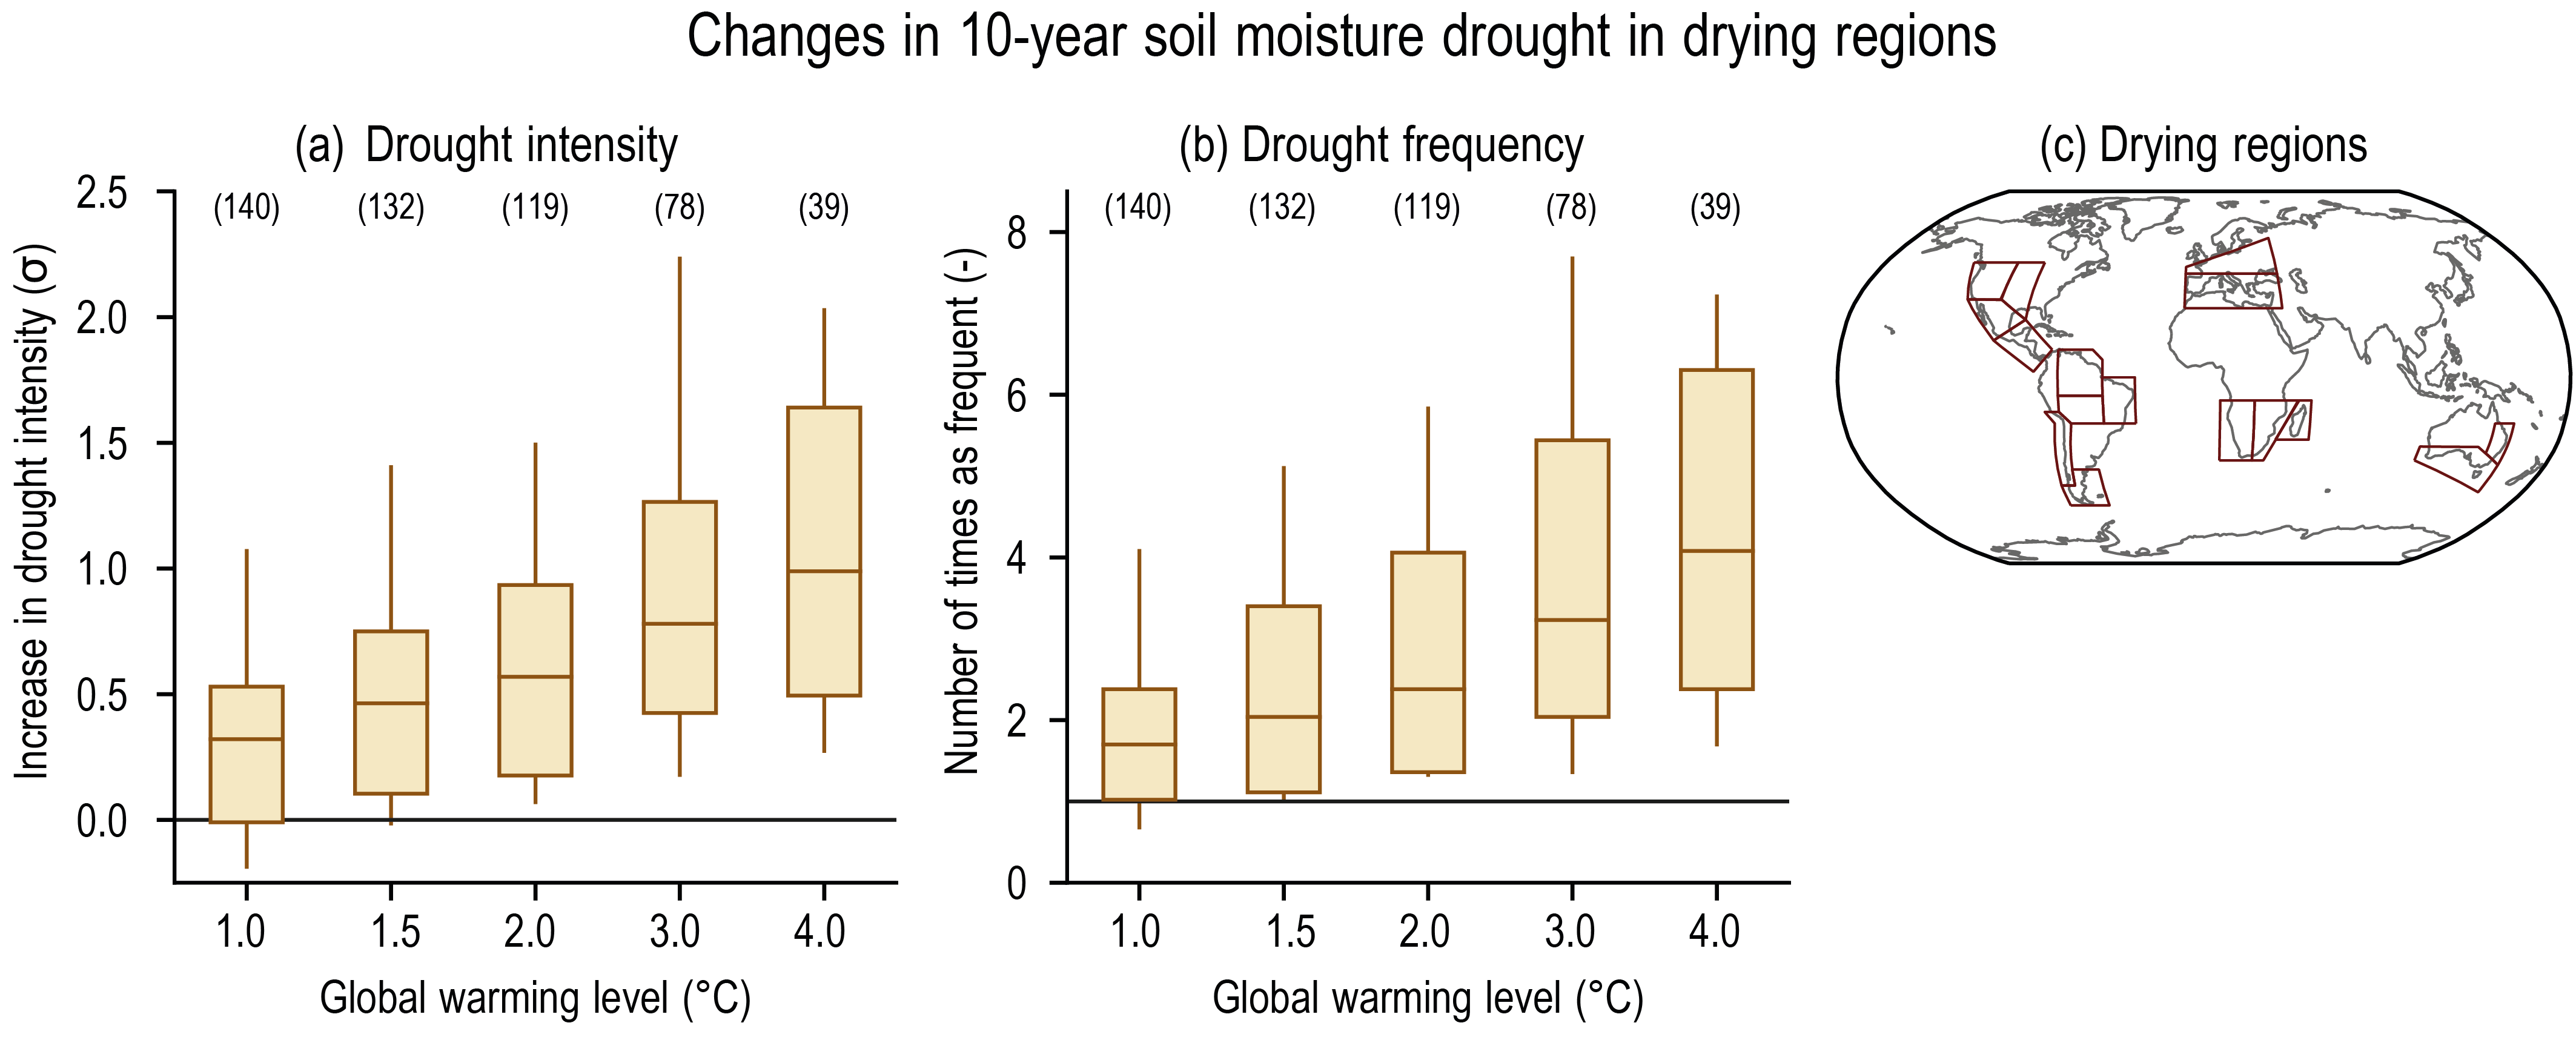
More regions are affected by increases in agricultural and ecological droughts with increasing global warming (high confidence). Several regions will be affected by more severe agricultural and ecological droughts even if global warming is stabilised at 2°C, including MED, WSAF, SAM and SSA (high confidence), and ESAF, MDG, EAU, SAU, SCA, CAR, NSA, NES, SWS, WCE, NCA, WNA and CNA (medium confidence). Some regions are also projected to be affected by more severe agricultural and ecological droughts at 1.5°C (MED, WSAF, ESAF, SAU, NSA, SAM, SSA, CNA, medium confidence). At 4°C of global warming, about 50% of all inhabited AR6 regions would be affected by increases in agricultural and ecological droughts (WCE, MED, CAU, EAU, SAU, WCA, EAS, SCA, CAR, NSA, NES, SAM, SWS, SSA, NCA, CNA, ENA, WNA, WSAF, ESAF, MDG: medium confidence or higher), and only two regions (NEAF, SAS) would experience decreases in agricultural and ecological drought (medium confidence). There is high confidence that the projected increases in agricultural and ecological droughts are strongly affected by evapotranspiration increases associated with enhanced atmospheric evaporative demand. Several regions are projected to be more strongly affected by hydrological droughts with increasing global warming (at 4°C of global warming: NEU, WCE, EEU, MED, SAU, WCA, SCA, NSA, SAM, SWS, SSA, WNA, WSAF, ESAF, MDG: medium confidence or higher). There is low confidence that effects of enhanced atmospheric carbon dioxide (CO2) concentrations on plant water-use efficiency alleviate extreme agricultural and ecological droughts in conditions characterized by limited soil moisture and enhanced atmospheric evaporative demand. There is also low confidence that these effects will substantially reduce global plant transpiration and the severity of hydrological droughts. There is high confidence that the land carbon sink will become less efficient due to soil moisture limitations and associated drought conditions in some regions in higher-emissions scenarios, in particular under global warming levels above 4°C. {11.6, 11.9, Cross-Chapter Box 5.1}
Extreme Storms, Including Tropical Cyclones
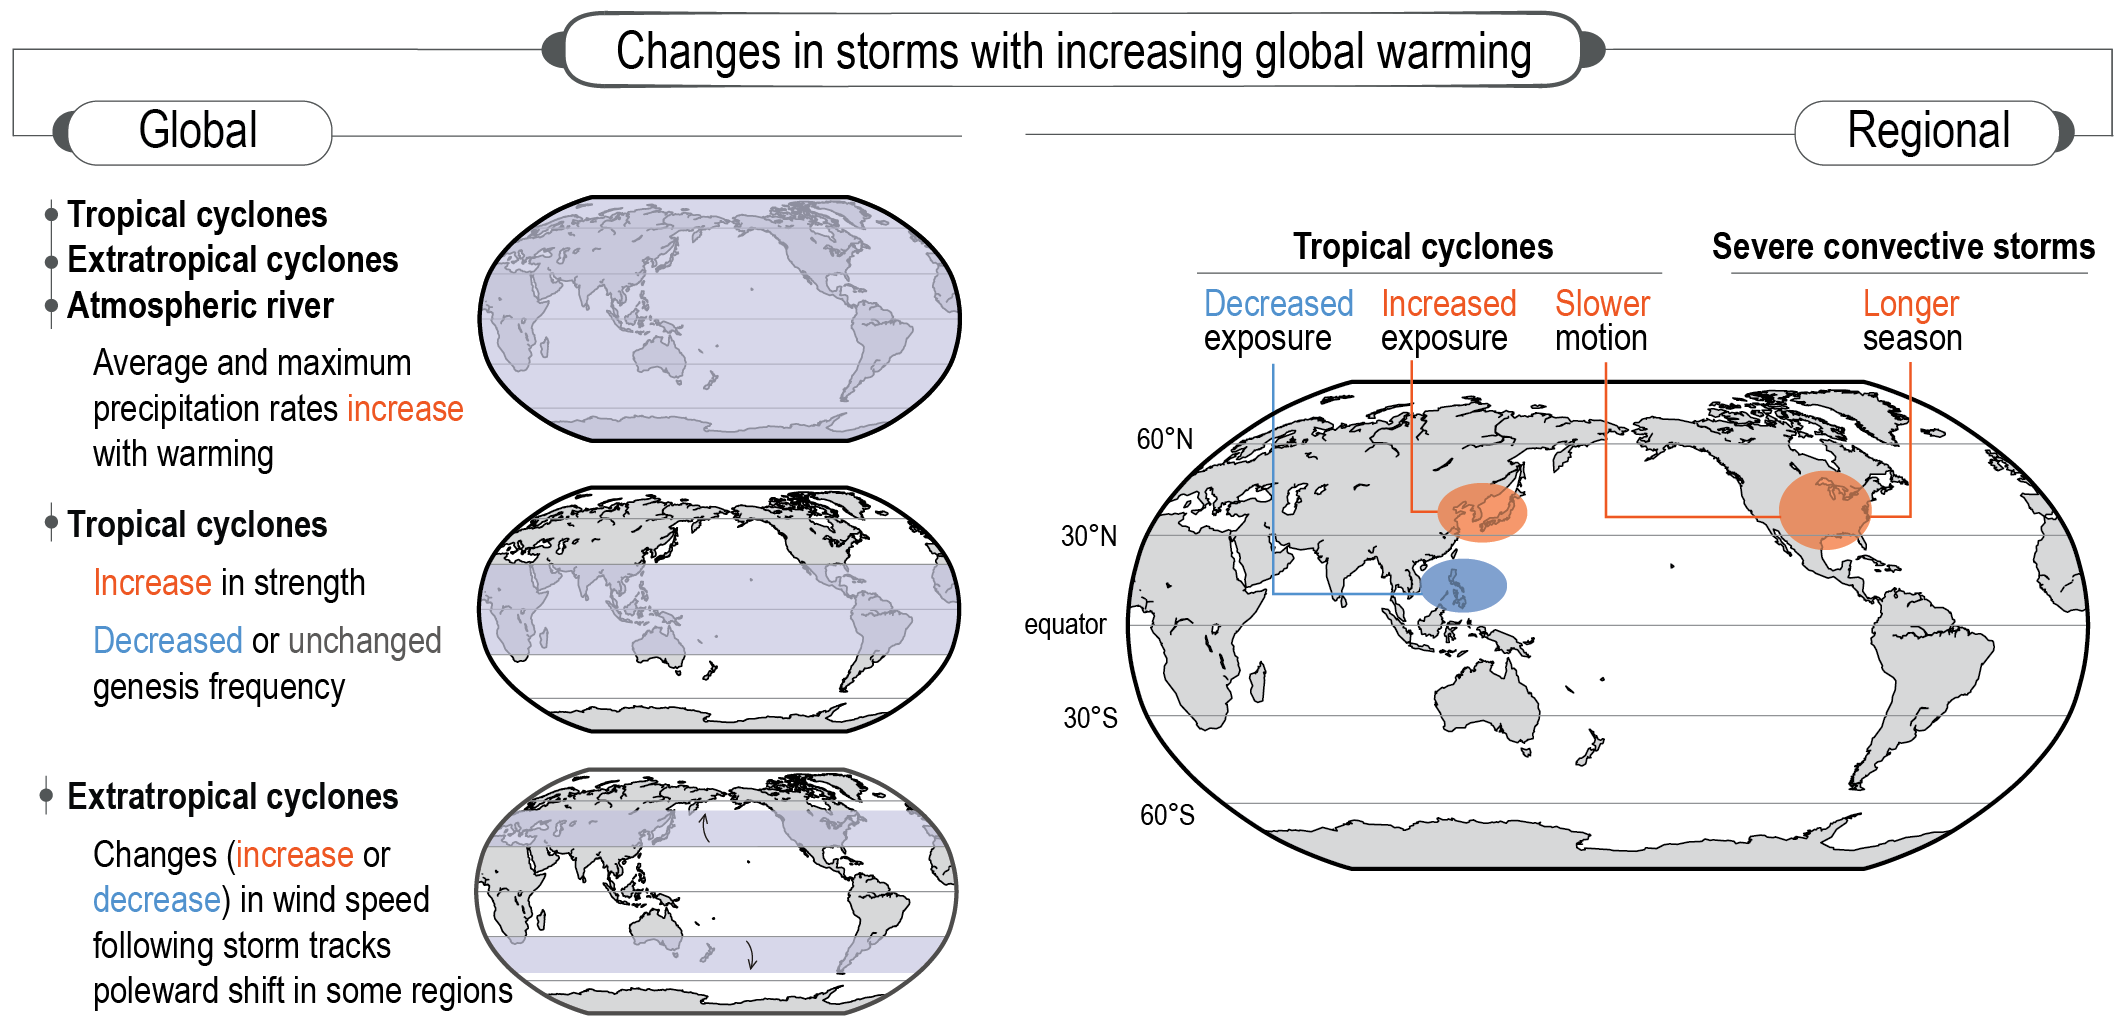
The average and maximum rain rates associated with tropical cyclones (TCs), extratropical cyclones and atmospheric rivers across the globe, and severe convective storms in some regions, increase in a warming world (high confidence) . Available event attribution studies of observed strong TCs provide medium confidence for a human contribution to extreme TC rainfall. Peak TC rain rates increase with local warming at least at the rate of mean water vapour increase over oceans (about 7% per 1°C of warming) and in some cases exceeding this rate due to increased low-level moisture convergence caused by increases in TC wind intensity (medium confidence). {11.7, 11.4, Box 11.1}
It is likely that the global proportion of Category 3–5 tropical cyclone instances2has increased over the past four decades. The average location where TCs reach their peak wind intensity has very likely migrated poleward in the western North Pacific Ocean since the 1940s, and TC translation speed has likely slowed over the conterminous USA since 1900. Evidence of similar trends in other regions is not robust. The global frequency of TC rapid intensification events has likely increased over the past four decades. None of these changes can be explained by natural variability alone (medium confidence).
The proportion of intense TCs, average peak TC wind speeds, and peak wind speeds of the most intense TCs will increase on the global scale with increasing global warming (high confidence). The total global frequency of TC formation will decrease or remain unchanged with increasing global warming (medium confidence). {11.7.1}
There is low confidence in past changes of maximum wind speeds and other measures of dynamical intensity of extratropical cyclones. Future wind speed changes are expected to be small, although poleward shifts in the storm tracks could lead to substantial changes in extreme wind speeds in some regions (medium confidence). There is low confidence in past trends in characteristics of severe convective storms, such as hail and severe winds, beyond an increase in precipitation rates. The frequency of spring severe convective storms is projected to increase in the USA, leading to a lengthening of the severe convective storm season (medium confidence); evidence in other regions is limited. {11.7.2, 11.7.3}.
Compound Events, Including Dry/Hot Events, Fire Weather, Compound Flooding, and Concurrent Extremes
The probability of compound events has likely increased in the past due to human-induced climate change and will likely continue to increase with further global warming. Concurrent heatwaves and droughts have become more frequent, and this trend will continue with higher global warming (high confidence). Fire weather conditions (compound hot, dry and windy events) have become more probable in some regions (medium confidence) and there is high confidence that they will become more frequent in some regions at higher levels of global warming. The probability of compound flooding (storm surge, extreme rainfall and/or river flow) has increased in some locations (medium confidence), and will continue to increase due to sea level rise and increases in heavy precipitation, including changes in precipitation intensity associated with tropical cyclones (high confidence). The land area affected by concurrent extremes has increased (high confidence). Concurrent extreme events at different locations, but possibly affecting similar sectors (e.g., critical crop-producing areas for global food supply) in different regions, will become more frequent with increasing global warming, in particular above 2°C of global warming (high confidence). {11.8, Box 11.2, Box 11.4}.
Low-likelihood, High-impact Events Associated With Climate Extremes
The future occurrence of low-likelihood, high-impact events linked to climate extremes is generally associated with low confidence, but cannot be excluded, especially at global warming levels above 4°C. Compound events, including concurrent extremes, are a factor increasing the probability of low-likelihood, high-impact events (high confidence). With increasing global warming, some compound events with low likelihood in past and current climates will become more frequent, and there is a higher chance of occurrence of historically unprecedented events and surprises (high confidence). However, even extreme events that do not have a particularly low probability in the present climate (at more than 1°C of global warming) can be perceived as surprises because of the pace of global warming (high confidence). {Box 11.2}
11.1 Introduction
11.1.1 Scope of the Chapter
This chapter provides assessments of changes in weather and climate extremes (collectively referred to as extremes) framed in terms of the relevance to the Working Group II (WGII) assessment. It assesses observed changes in extremes, their attribution to causes, and future projections, at three global warming levels: 1.5°C, 2°C, and 4°C. This chapter is also one of the four ‘regional chapters’ of the WGI Report (along with Chapters 10 and 12 and the Atlas). Consequently, while it encompasses assessments of changes in extremes at global and continental scales to provide a large-scale context, it also addresses changes in extremes at regional scales.
Extremes are climatic impact-drivers (Annex VII: Glossary, see Chapter 12 for a comprehensive assessment). The IPCC risk framework (Chapter 1) articulates clearly that the exposure and vulnerability to climatic impact-drivers, such as extremes, modulate the risk of adverse impacts of these drivers, and that adaptation which reduces exposure and vulnerability will increase resilience, resulting in a reduction in impacts. Nonetheless, changes in extremes lead to changes in impacts as a direct consequence of changes in their magnitude and frequency, and also through their influence on exposure and resilience.
The Special Report on Managing the Risks of Extreme Events and Disasters to Advance Climate Change Adaptation (referred as the SREX report, IPCC, 2012) provided a comprehensive assessment on changes in extremes and how exposure and vulnerability to extremes determine the impacts and likelihood of disasters. Chapter 3 of that report (Seneviratne et al., 2012, hereafter also referred to as SREX Chapter 3) assessed physical aspects of extremes, and laid a foundation for the follow-up IPCC assessments. Several chapters of the IPCC Fifth Assessment Report (AR5) (IPCC, 2013) addressed climate extremes with respect to observed changes (Hartmann et al., 2013), model evaluation (Flato et al., 2013), attribution (Bindoff et al., 2013), and projected long-term changes (Collins et al., 2013). Assessments were also provided in the IPCC Special Report on Global Warming of 1.5°C (SR1.5) (IPCC, 2018; Hoegh-Guldberg et al., 2018), on climate change and land (SRCCL; (IPCC, 2019a), and on oceans and the cryosphere (SROCC; IPCC, 2019b). These assessments are the starting point for the present assessment.
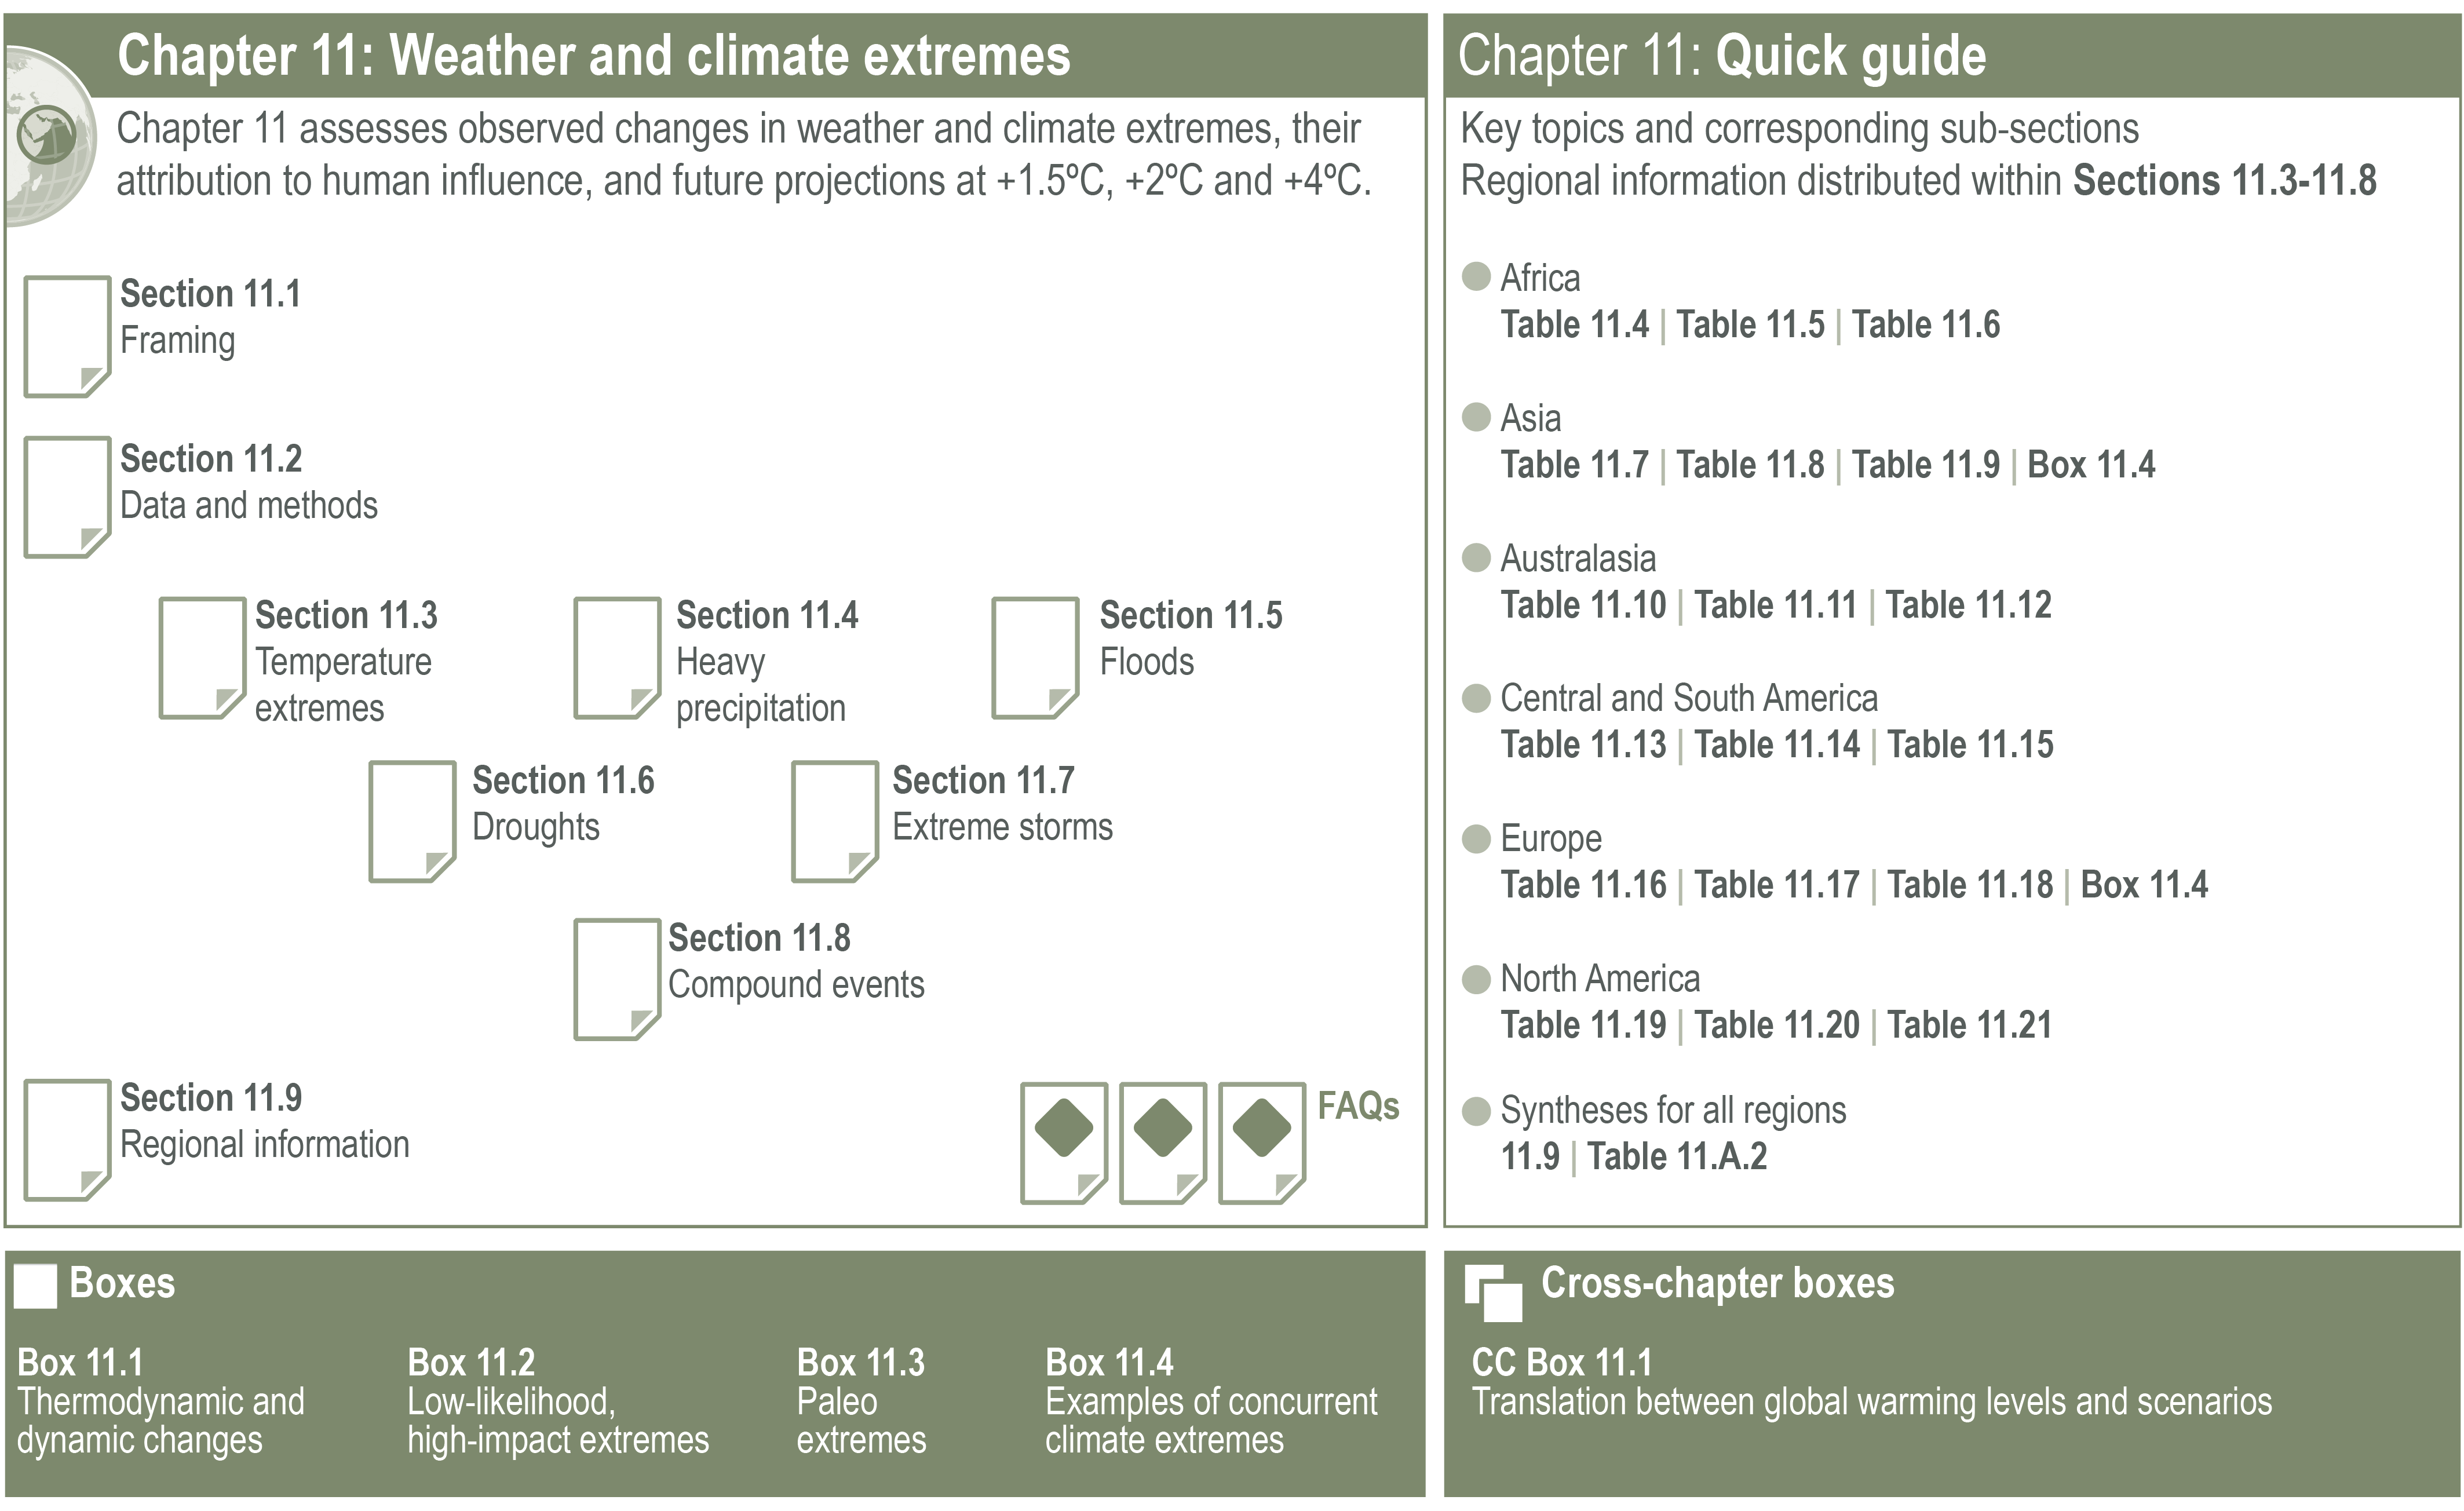
This chapter is structured as follows (Figure 11.1): This section (11.1) provides the general framing and introduction to the chapter, highlighting key aspects that underlie the confidence and uncertainty in the assessment of changes in extremes, and introducing some main elements of the chapter. To provide readers with a quick overview of past and future changes in extremes, a synthesis of global-scale assessments for different types of extremes is included at the end of this section (Tables 11.1 and 11.2). Section 11.2 introduces methodological aspects of research on climate extremes. Sections 11.3 to 11.7 assess past changes and their attribution to causes, and projected future changes in extremes, for different types of extremes, including temperature extremes, heavy precipitation and pluvial floods, river floods, droughts, and storms, in separate sections. Section 11.8 addresses compound events. Section 11.9 summarizes regional assessments of changes in temperature extremes, in precipitation extremes and in droughts by continents in tables. The chapter also includes several boxes and FAQs on more specific topics.
 Figure 11.1 | Visual guide to Chapter 11.
 11.1.2 What Are Extreme Events and How are Their Changes Studied?
Building on the SREX report and AR5, this Report defines an extreme weather event as ‘an event that is rare at a particular place and time of year’, and an extreme climate event as ‘a pattern of extreme weather that persists for some time, such as a season’ (see Glossary). The definitions of ‘rare’ are wide ranging, depending on applications. Some studies consider an event as an extreme if it is unprecedented; other studies consider events that occur several times a year as moderate extreme events. Rarity of an event with a fixed magnitude also changes under human-induced climate change, making events that are unprecedented so far rather probable under present conditions, but unique in the observational record – and thus often considered as ‘surprises’ (see Box 11.2).
Various approaches are used to define extremes. These are generally based on the determination of relative (e.g., 90th percentile) or absolute (e.g., 35°C for a hot day) thresholds above which conditions are considered extremes. Changes in extremes can be examined from two perspectives, either focusing on changes in frequency of given extremes, or on changes in their intensity. These considerations in the definition of extremes are further addressed in Section 11.2.1.
11.1.3 Types of Extremes Assessed in this Chapter
The types of extremes assessed in this chapter include temperature extremes, heavy precipitation and pluvial floods, river floods, droughts, and storms. The drought assessment addresses meteorological droughts, agricultural and ecological droughts, and hydrological droughts (see Glossary). The storms assessment addresses tropical cyclones, extratropical cyclones, and severe convective storms. This chapter also assesses changes in compound events – that is, multivariate or concurrent extreme events – because of their relevance to impacts as well as the emergence of new literature on the subject. Most of the considered extremes were also assessed in SREX and AR5. Compound events were not assessed in depth in past IPCC reports (SREX Chapter 3; Section 11.8 of this Report). Marine-related extremes such as marine heatwaves and extreme sea level, are assessed in Section 9.6.4 and Box 9.2 of this Report.
Extremes and related phenomena are of various spatial and temporal scales. Tornadoes have a spatial scale as small as less than 100 metres and a temporal scale as short as a few minutes. In contrast, a drought can last for multiple years, affecting vast regions. The level of complexity of the involved processes differs from one type of extreme to another, affecting our capability to detect, attribute and project changes in weather and climate extremes. Temperature and precipitation extremes studied in the literature are often based on extremes derived from daily values. Studies of events on longer time scales for temperature or precipitation, or on sub-daily extremes, are scarcer, which generally limits the assessment for such events. Nevertheless, extremes on time scales different from daily are assessed for temperature extremes and heavy precipitation, when possible (Sections 11.3 and 11.4). Droughts and tropical cyclones are treated as phenomena in general in the assessment, not limited by their extreme forms, because these phenomena are relevant to impacts (Sections 11.6 and 11.7). Both precipitation and wind extremes associated with storms are considered.
Multiple concomitant extremes can lead to stronger impacts than those resulting from the same extremes had they happened in isolation. For this reason, the occurrence of multiple extremes that are multivariate and/or concurrent and/or happening in succession, also called ‘compound events’ (SREX Chapter 3), are assessed in this chapter based on emerging literature on this topic (Section 11.8). Box 11.2 also provides an assessment on low-likelihood, high-impact scenarios associated with extremes.
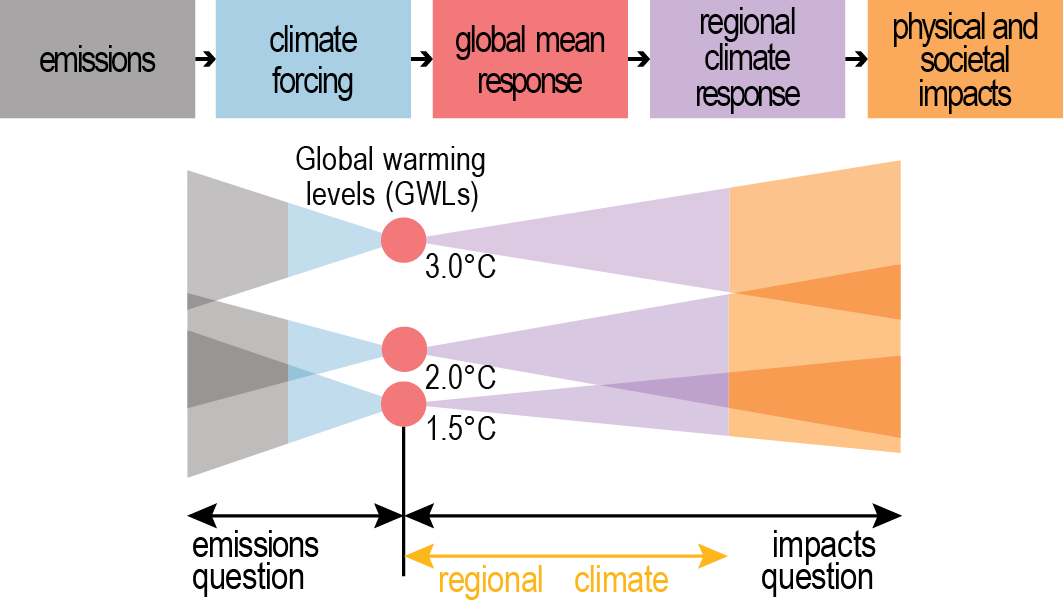
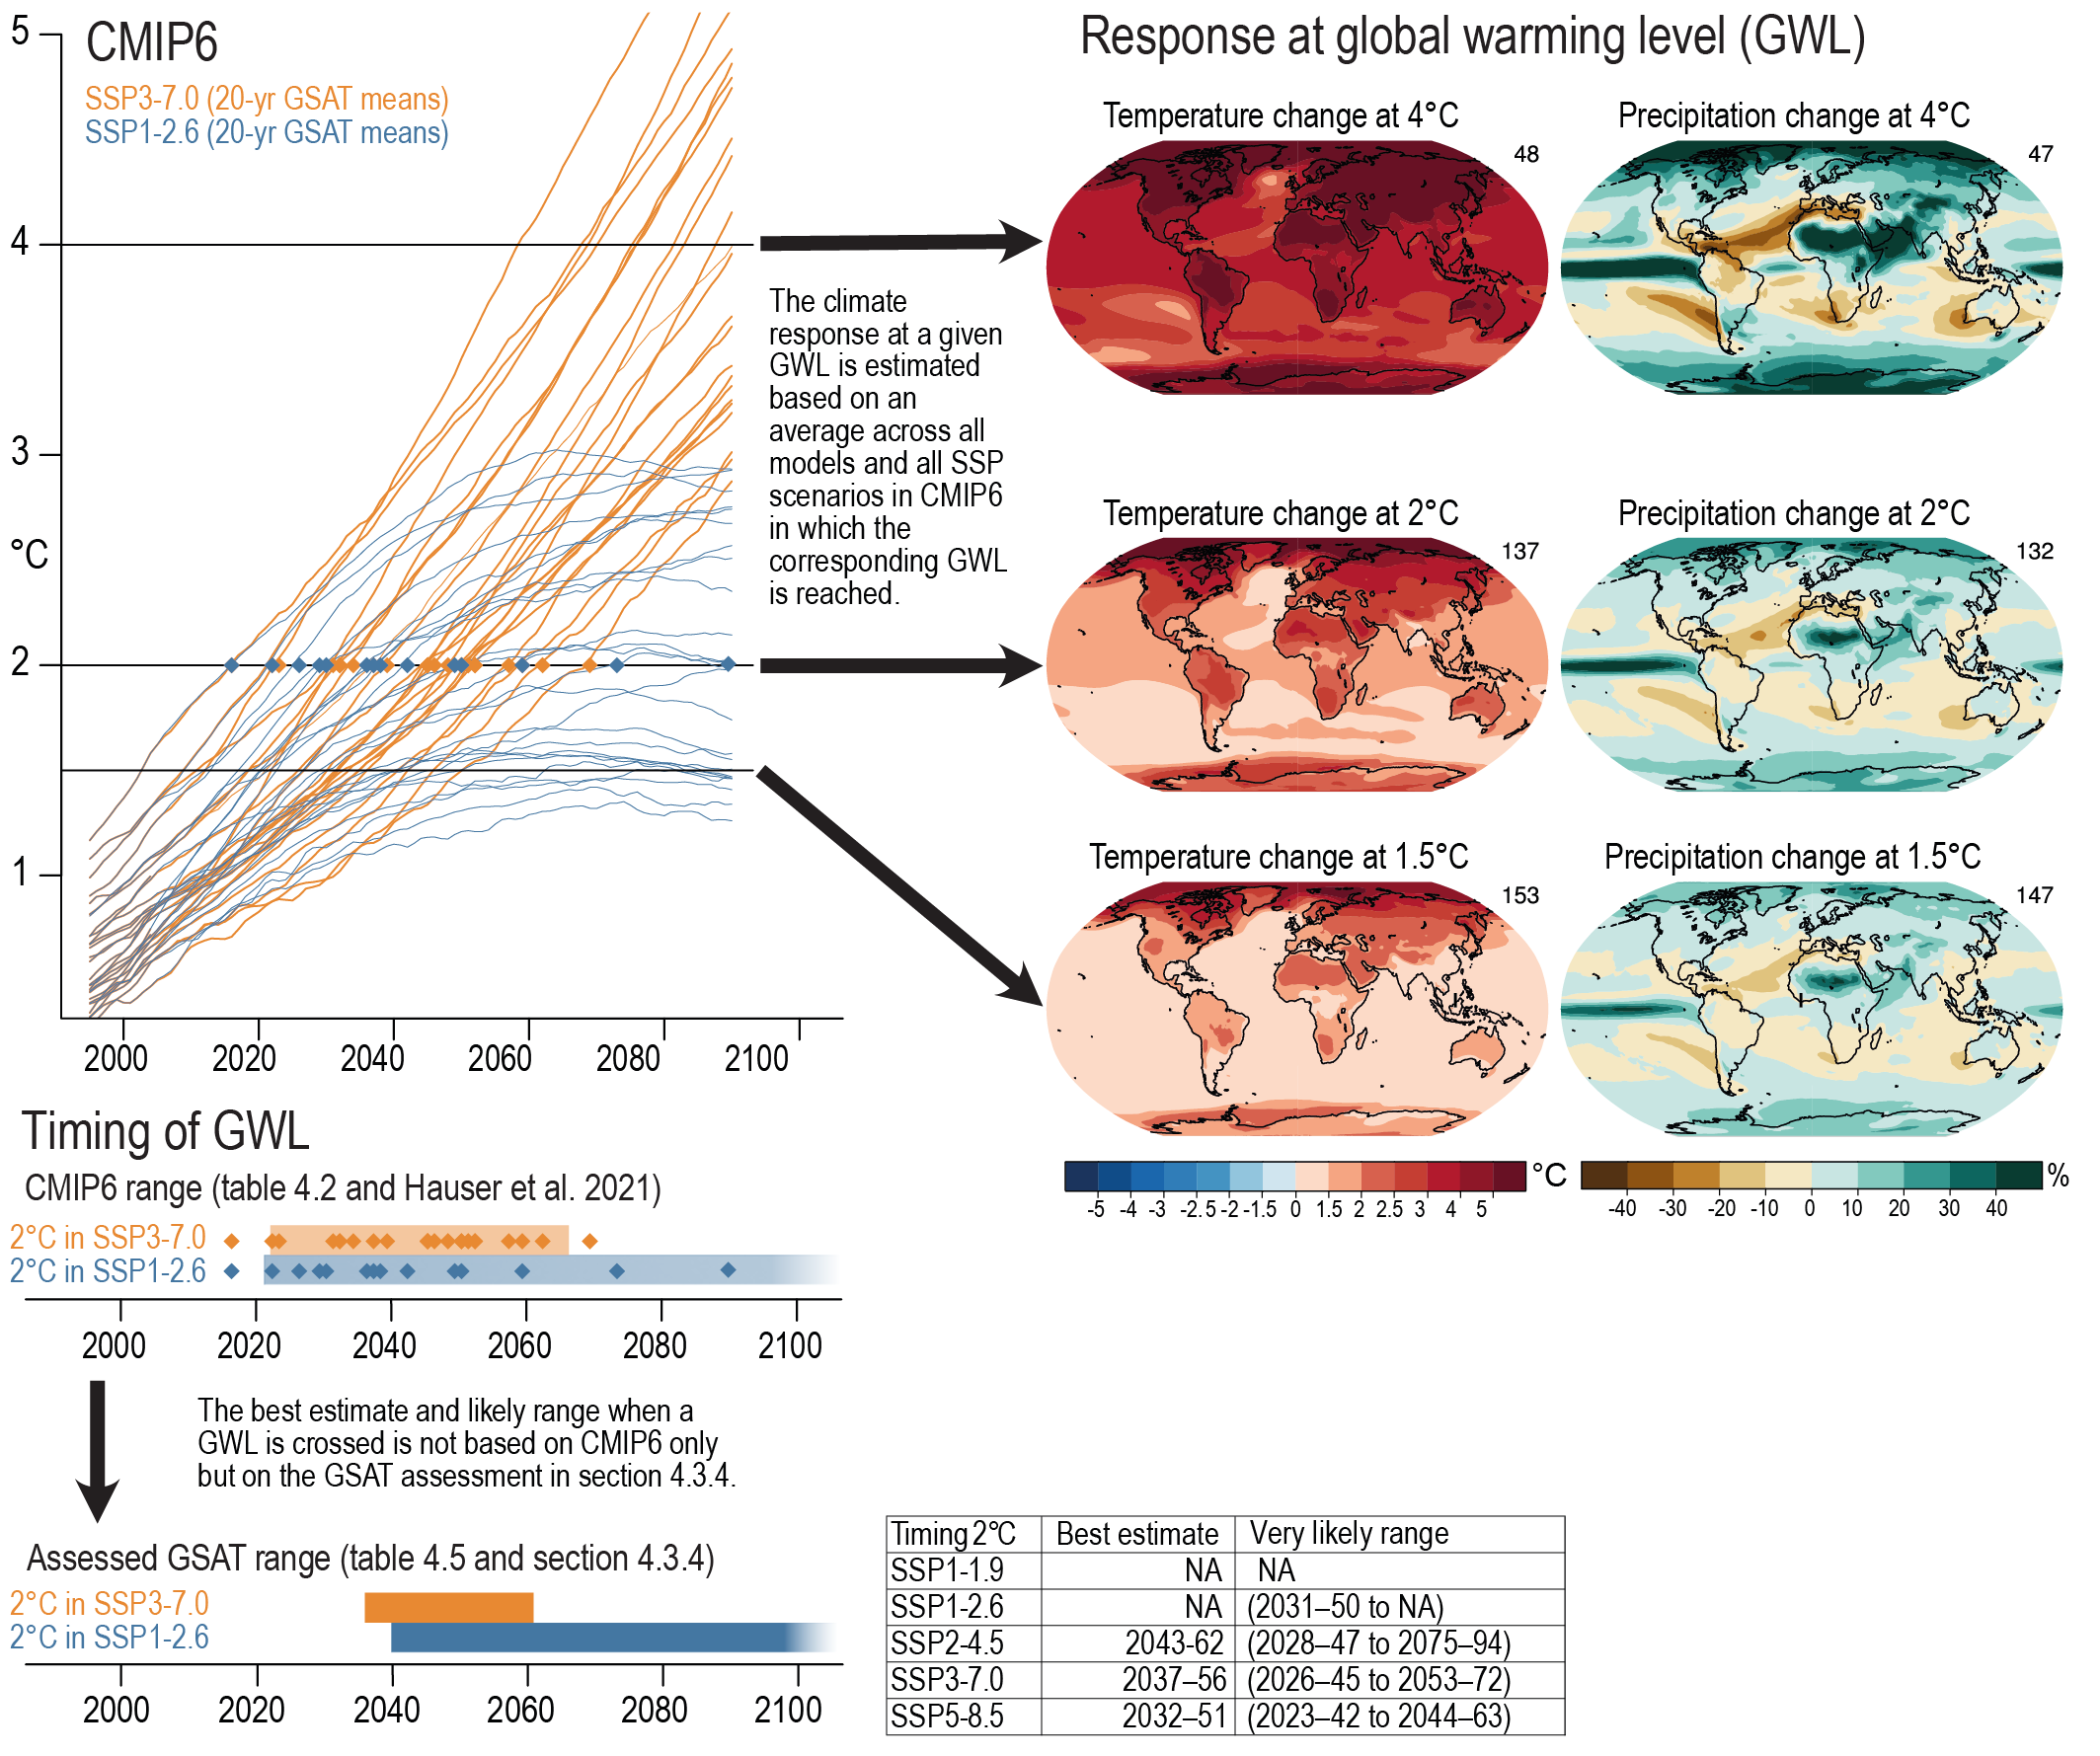
The assessment of projected future changes in extremes is presented as function of different global warming levels (Section 11.2.4 and Cross-Chapter Box 11.1). This provides traceability and comparison to the SR1.5 assessment (Hoegh-Guldberg et al., 2018, hereafter referred to as SR1.5 Chapter 3). Also, this is useful for decision makers as actionable information, as much of the mitigation policy discussion and adaptation planning can be tied to the level of global warming. For example, regional changes in extremes, and thus their impacts, can be linked to global mitigation efforts. There is also the advantage of separating uncertainty in future projections due to regional responses as a function of global warming levels from other factors such as differences in global climate sensitivity and emissions scenarios (Cross-Chapter Box 11.1). Information is also provided on the translation between information provided at global warming levels and for single emissions scenarios (Cross-Chapter Box 11.1). This facilitates easier comparison with the AR5 assessment and with some analyses provided in other chapters as function of emissions scenarios.
A global-scale synthesis of this chapter’s assessments is provided in Section 11.1.7. In particular, Tables 11.1 and 11.2 provide a synthesis for observed and attributed changes, and projected changes in extremes, respectively, at different global warming levels (1.5°C, 2°C, and 4°C). Tables on regional-scale assessments for changes in temperature extremes, heavy precipitation and droughts, are provided in Section 11.9.
11.1.4 Effects of Greenhouse Gas and Other External Forcings on Extremes
The SREX, AR5, and SR1.5 assessed that there is evidence from observations that some extremes have changed since the mid-20th century, that some of the changes are a result of anthropogenic influences, and that some observed changes are projected to continue into the future. Additionally, other changes are projected to emerge from natural climate variability under enhanced global warming (SREX Chapter 3; AR5 Chapter 10).
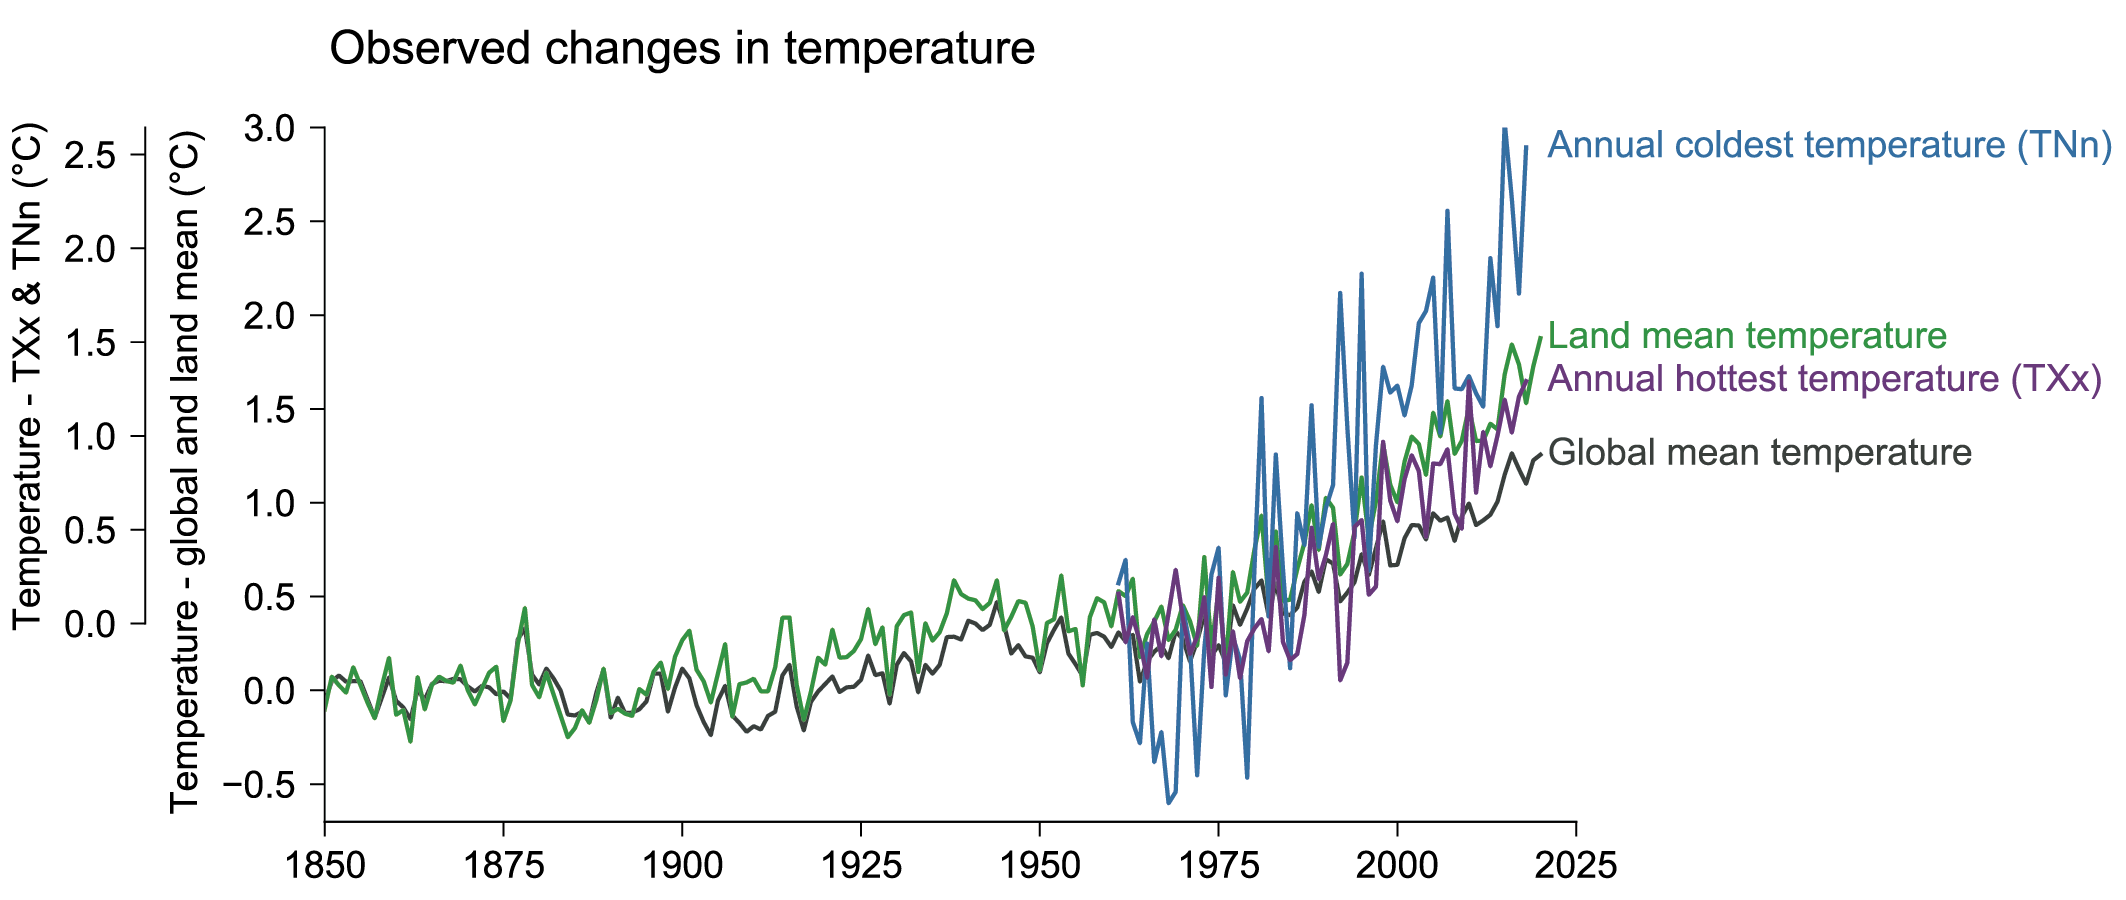
At the global scale, and also at the regional scale to some extent, many of the changes in extremes are a direct consequence of enhanced radiative forcing, and the associated global warming and/or resultant increase in the water-holding capacity of the atmosphere, as well as changes in vertical stability and meridional temperature gradients that affect climate dynamics (see Box 11.1). Widespread observed and projected increases in the intensity and frequency of hot extremes, together with decreases in the intensity and frequency of cold extremes, are consistent with global and regional warming (Section 11.3 and Figure 11.2). Extreme temperatures on land tend to increase more than the global mean temperature (Figure 11.2), due in large part to the land–sea warming contrast, and additionally to regional feedbacks in some regions (Section 11.1.6). Increases in the intensity of temperature extremes scale robustly, and in general linearly, with global warming across different geographical regions in projections up to 2100, with minimal dependence on emissions scenarios (Section 11.2.4, Figure 11.3,and Cross-Chapter Box 11.1; Seneviratne et al., 2016; Wartenburger et al., 2017; Kharin et al., 2018). The frequency of hot temperature extremes (see Figure 11.6), the number of heatwave days and the length of heatwave seasons in various regions also scale well, but nonlinearly (because of threshold effects, Section 11.2.1), with global mean temperatures (Wartenburger et al., 2017; Y. Sun et al., 2018a).
 Figure 11.2 | Time series of observed temperature anomalies for global average annual mean temperature (black), land average annual mean temperature (green), land average annual hottest daily maximum temperature (TXx, purple), and land average annual coldest daily minimum temperature (TNn, blue). Global and land mean temperature anomalies are relative to their 1850–1900 means and are based on the multi-product mean annual time series assessed in Section 2.3.1.1.3 (see text for references). TXx and TNn anomalies are relative to their respective 1961–1990 means and are based on the HadEX3 dataset (Dunn et al., 2020) using values for grid boxes with at least 90% temporal completeness over 1961–2018. Further details on data sources and processing are available in the chapter data table (Table 11.SM.9).
 Changes in annual maximum one-day precipitation (Rx1day) are proportional to mean global surface temperature changes, at about 7% increase per 1°C of warming, that is, following the Clausius–Clapeyron relation (Box 11.1), both in observations (Westra et al., 2013) and in future projections (Kharin et al., 2013) at the global scale. Extreme short-duration precipitation in North America also scales with global surface temperature (Prein et al., 2016b; C. Li et al., 2019a). At the local and regional scales, changes in extremes are also strongly modulated and controlled by regional forcings and feedback mechanisms (Section 11.1.6), whereby some regional forcings, for example, associated with changes in land cover and land use or aerosol emissions, can have non-local or some (non-homogeneous) global-scale effects. In general, there is high confidence in changes in extremes due to global-scale thermodynamic processes (i.e., global warming, mean moistening of the air) as the processes are well understood, while the confidence in those related to dynamic processes or regional and local forcing, including regional and local thermodynamic processes, is much lower due to multiple factors (see the following subsection and Box 11.1).
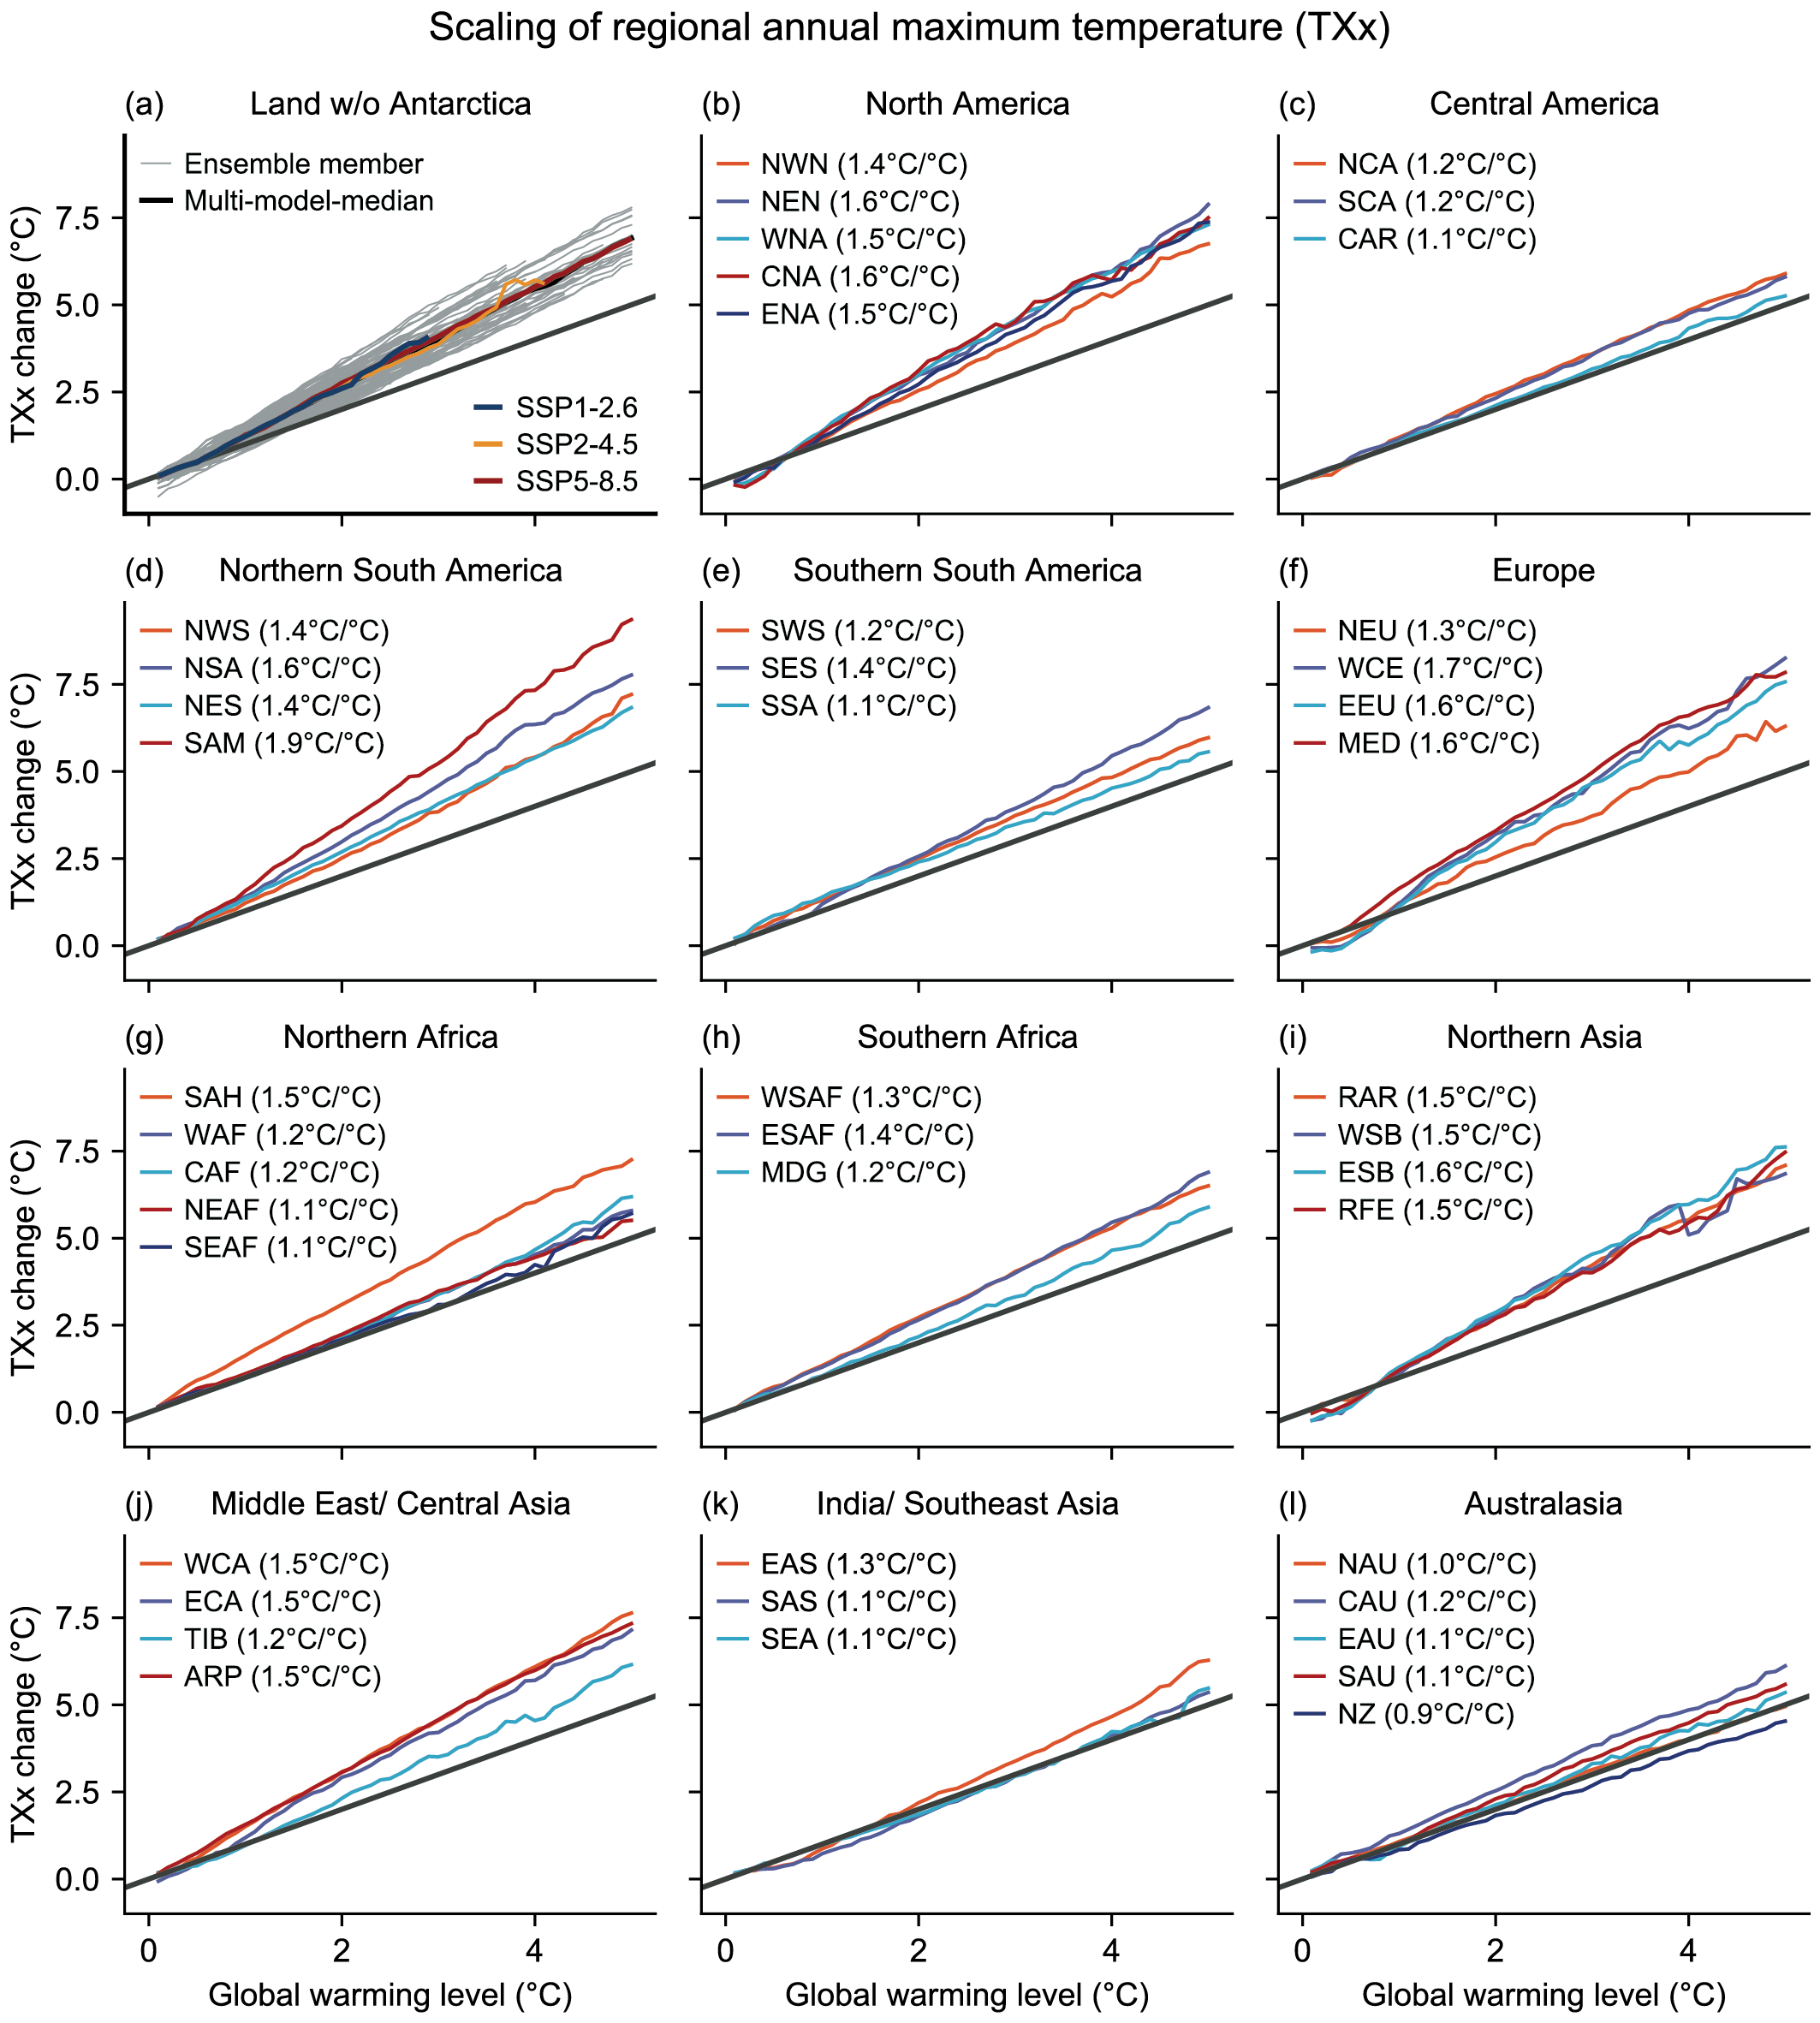 Figure 11.3 | Regional mean changes in annual hottest daily maximum temperature (TXx) for AR6 land regions and the global land area (except Antarctica), against changes in global mean surface air temperature (GSAT) as simulated by Coupled Model Intercomparison Project Phase 6 (CMIP6) models under different Shared Socio-economic Pathway (SSP) forcing scenarios, SSP1-1.9, SSP1-2.6, SSP2-4.5, SSP3-7. 0, and SSP5-8.5. Changes in TXx and GSAT are relative to the 1850–1900 baseline, and changes in GSAT are expressed as global warminglevel. (a) Individual models from the CMIP6 ensemble (grey), the multi-model median under three selected SSPs (colours), and the multi-modelmedian (black); (b) to (l) Multi-model median for the pooled data for individual AR6 regions. Numbers in parentheses indicate the linear scaling between regional TXx and GSAT. The black line indicates the 1:1 reference scaling between TXx and GSAT. See Atlas.1.3.2 for the definition of regions. Changes in TXx are also displayed in the Interactive Atlas. For details on the methods, see Supplementary Material 11.SM.2.
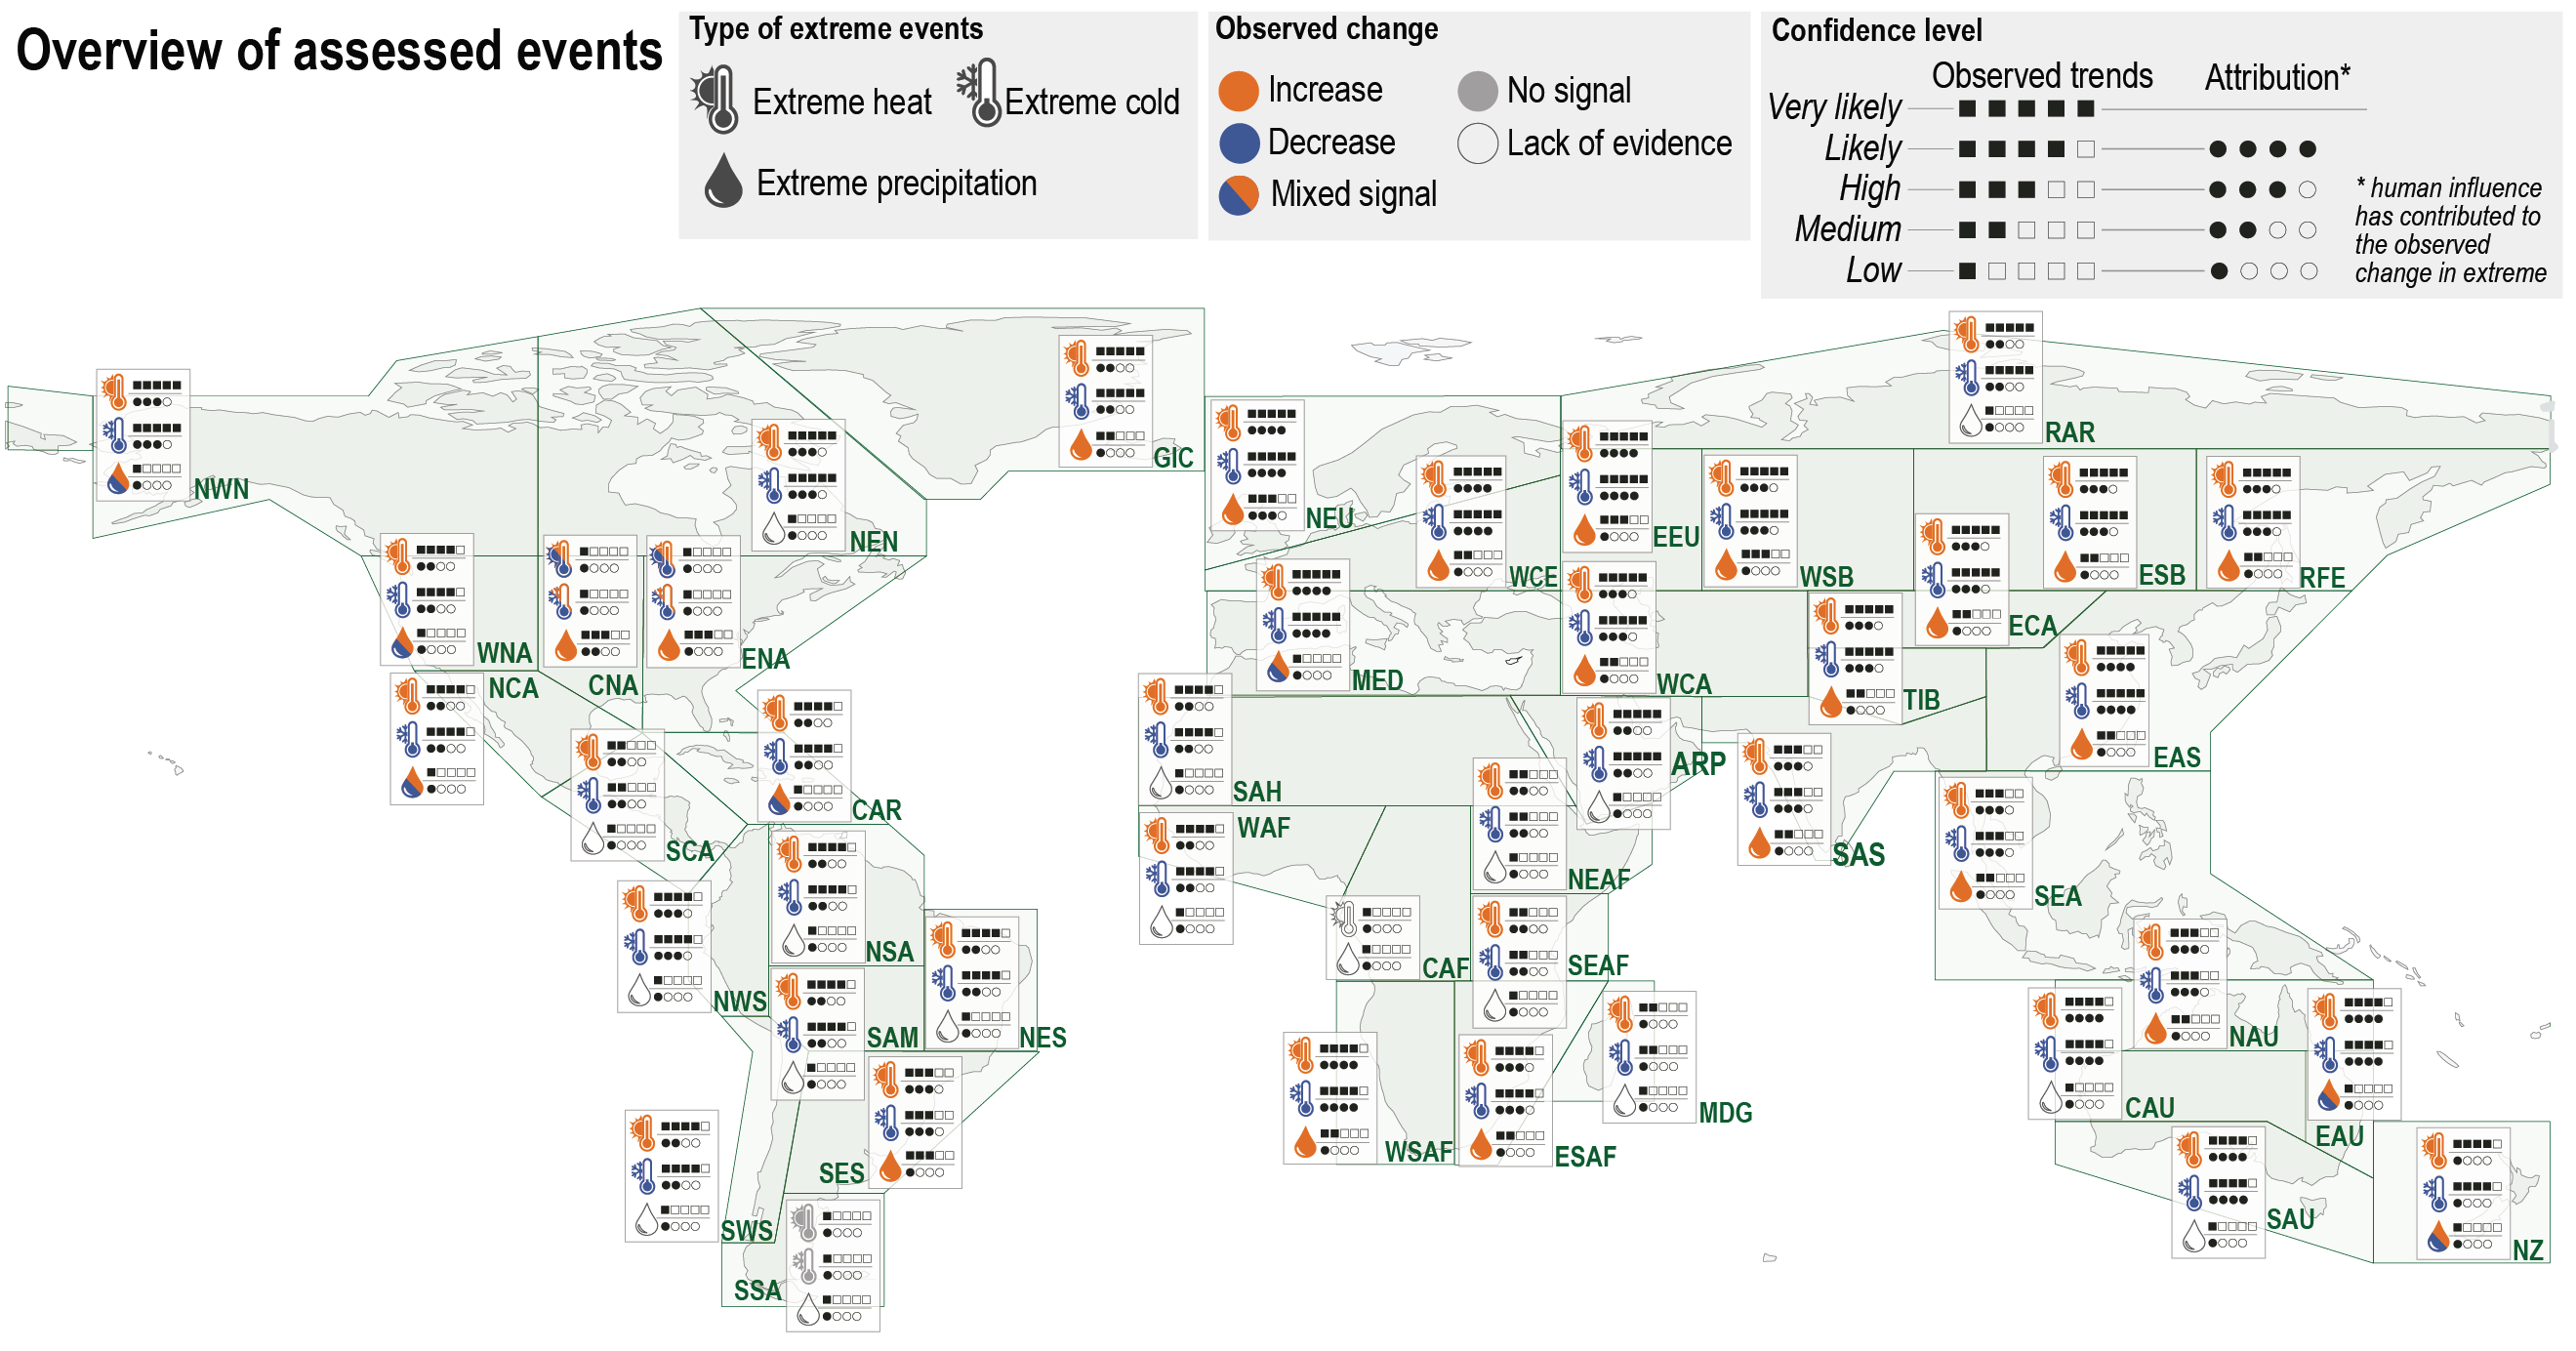
 Since AR5, the attribution of extreme weather events, or the investigation of changes in the frequency and/or magnitude of individual and local- and regional-scale extreme weather events due to various drivers (Section 11.2.3 and Cross-Working Group Box 1.1) has provided evidence that greenhouse gases and other external forcings have affected individual extreme weather events. The events that have been studied are geographically uneven. For example, extreme rainfall events in the UK (Schaller et al., 2016; Vautard et al., 2016; Otto et al., 2018b) or heatwaves in Australia (King et al., 2014; Perkins-Kirkpatrick et al., 2016; Lewis et al., 2017b) have spurred more studies than other events. Many highly impactful extreme weather events have not been studied in the event attribution framework. Studies in the developing world are also generally lacking. This is due to various reasons (Section 11.2) including lack of observational data, lack of reliable climate models and other problems (Otto et al., 2020). While the events that have been studied are not representative of all extreme events that occurred, and results from these studies may also be subject to selection bias, the large number of event attribution studies provide evidence that changes in the properties of these local and individual events are in line with expected consequences of human influence on the climate and can be attributed to external drivers (Section 11.9). Figure 11.4 summarizes assessments of observed changes in temperature extremes, in heavy precipitation and in droughts, and their attribution in a map form.
 Figure 11.4 | Overview of observed changes for cold, hot, and wet extremes and their potential human contribution. Shown are the direction of change and the confidence in: 1) the observed changes in cold and hot as well as wet extremes across the world; and 2) whether human-induced climate change contributed to causing these changes (attribution). In each region changes in extremes are indicated by colour (orange – increase in the type of extreme; blue – decrease; both colours – changes of opposing direction within the region, with the signal depending on the exact event definition; grey – there are no changes observed; and no fill – the data/evidence is too sparse to make an assessment). The squares and dots next to the symbol indicate the level of confidence for observing the trend and the human contribution, respectively. The more black dots/squares, the higher the level of confidence. The information on this figure is based on regional assessment of the literature on observed trends, detection and attribution and event attribution in Section 11.9.
 Box 11.1 | Thermodynamic and Dynamic Changes in Extremes Across Scales
Changes in weather and climate extremes are determined by local exchanges in heat, moisture, and other related quantities (thermodynamic changes) and those associated with atmospheric and oceanic motions (dynamic changes). While thermodynamic and dynamic processes are interconnected, considering them separately helps to disentangle the roles of different processes contributing to changes in climate extremes (e.g., Shepherd, 2014).
Temperature extremes
An increase in the concentration of greenhouse gases in the atmosphere leads to the warming of tropospheric air and the Earth’s surface. This direct thermodynamic effect leads to warmer temperatures everywhere, with an increase in the frequency and intensity of warm extremes, and a decrease in the frequency and intensity of cold extremes. The initial increase in temperature leads to other thermodynamic responses and feedbacks affecting the atmosphere and the surface. These include an increase in the water vapour content of the atmosphere (water vapour feedback, see Section 7.4.2.2) and a change in the vertical profile of temperature (lapse rate feedback, see Section 7.4.2.2). While the water vapour feedback always amplifies the initial temperature increases (positive feedback), the lapse rate feedback amplifies near-surface temperature increases (positive feedback) in mid- and high latitudes but reduces temperature increases (negative feedback) in tropical regions (Pithan and Mauritsen, 2014).
Thermodynamic responses and feedbacks also occur through surface processes. For instance, observations and model simulations show that temperature increases, including extreme temperatures, are amplified in areas where seasonal snow cover is reduced due to decreases in surface albedo (see Section 11.3.1). In some mid-latitude areas, temperature increases are amplified by the higher atmospheric evaporative demand (Fu and Feng, 2014; Vicente-Serrano et al., 2020a) that results in a drying of soils in some regions (Section 11.6), leading to increased sensible heat fluxes (soil-moisture–temperature feedback, see Sections 11.1.6 and 11.3.1 for more background). Other thermodynamic feedback processes include changes in the water-use efficiency of plants under enhanced atmospheric carbon dioxide (CO2) concentrations that can reduce the overall transpiration, and thus also enhance temperature in projections (Sections 8.2.3.3, 11.1.6, 11.3 and 11.6).
Changes in the spatial distribution of temperatures can also affect temperature extremes by modifying the characteristics of weather patterns (e.g., Suarez-Gutierrez et al., 2020a). For example, a robust thermodynamic effect of polar amplification is a weakened north-south temperature gradient, which amplifies the warming of cold extremes in the Northern Hemisphere mid- and high latitudes because of the reduction of cold air advection (Holmes et al., 2015; Schneider et al., 2015; Gross et al., 2020). Much less robust is the dynamic effect of polar amplification (Section 7.4.4.1) and the reduced low-altitude meridional temperature gradient that has been linked to an increase in the persistence of weather patterns (e.g., heatwaves) and subsequent increases in temperature extremes (Cross-Chapter Box 10.1; Francis and Vavrus, 2012; Coumou et al. , 2015, 2018; Mann et al., 2017).
Precipitation extremes
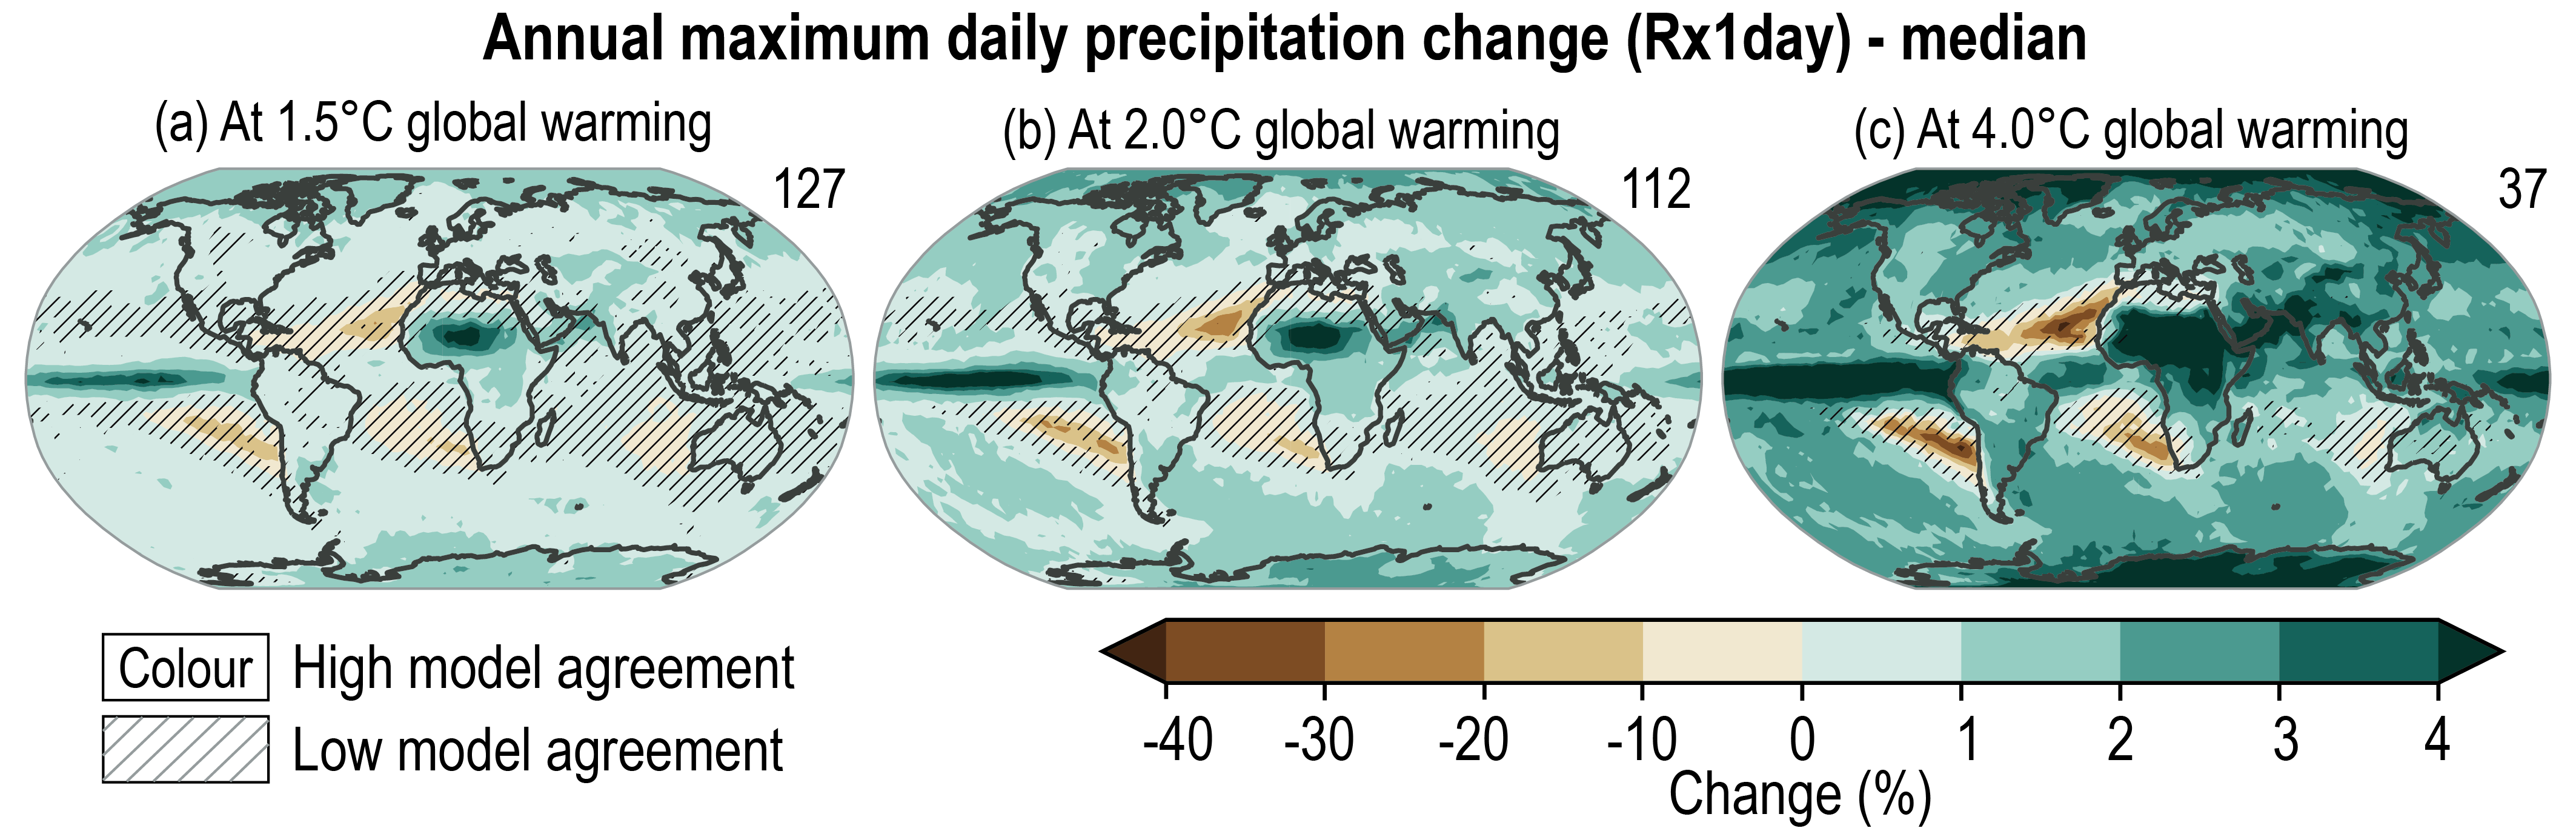
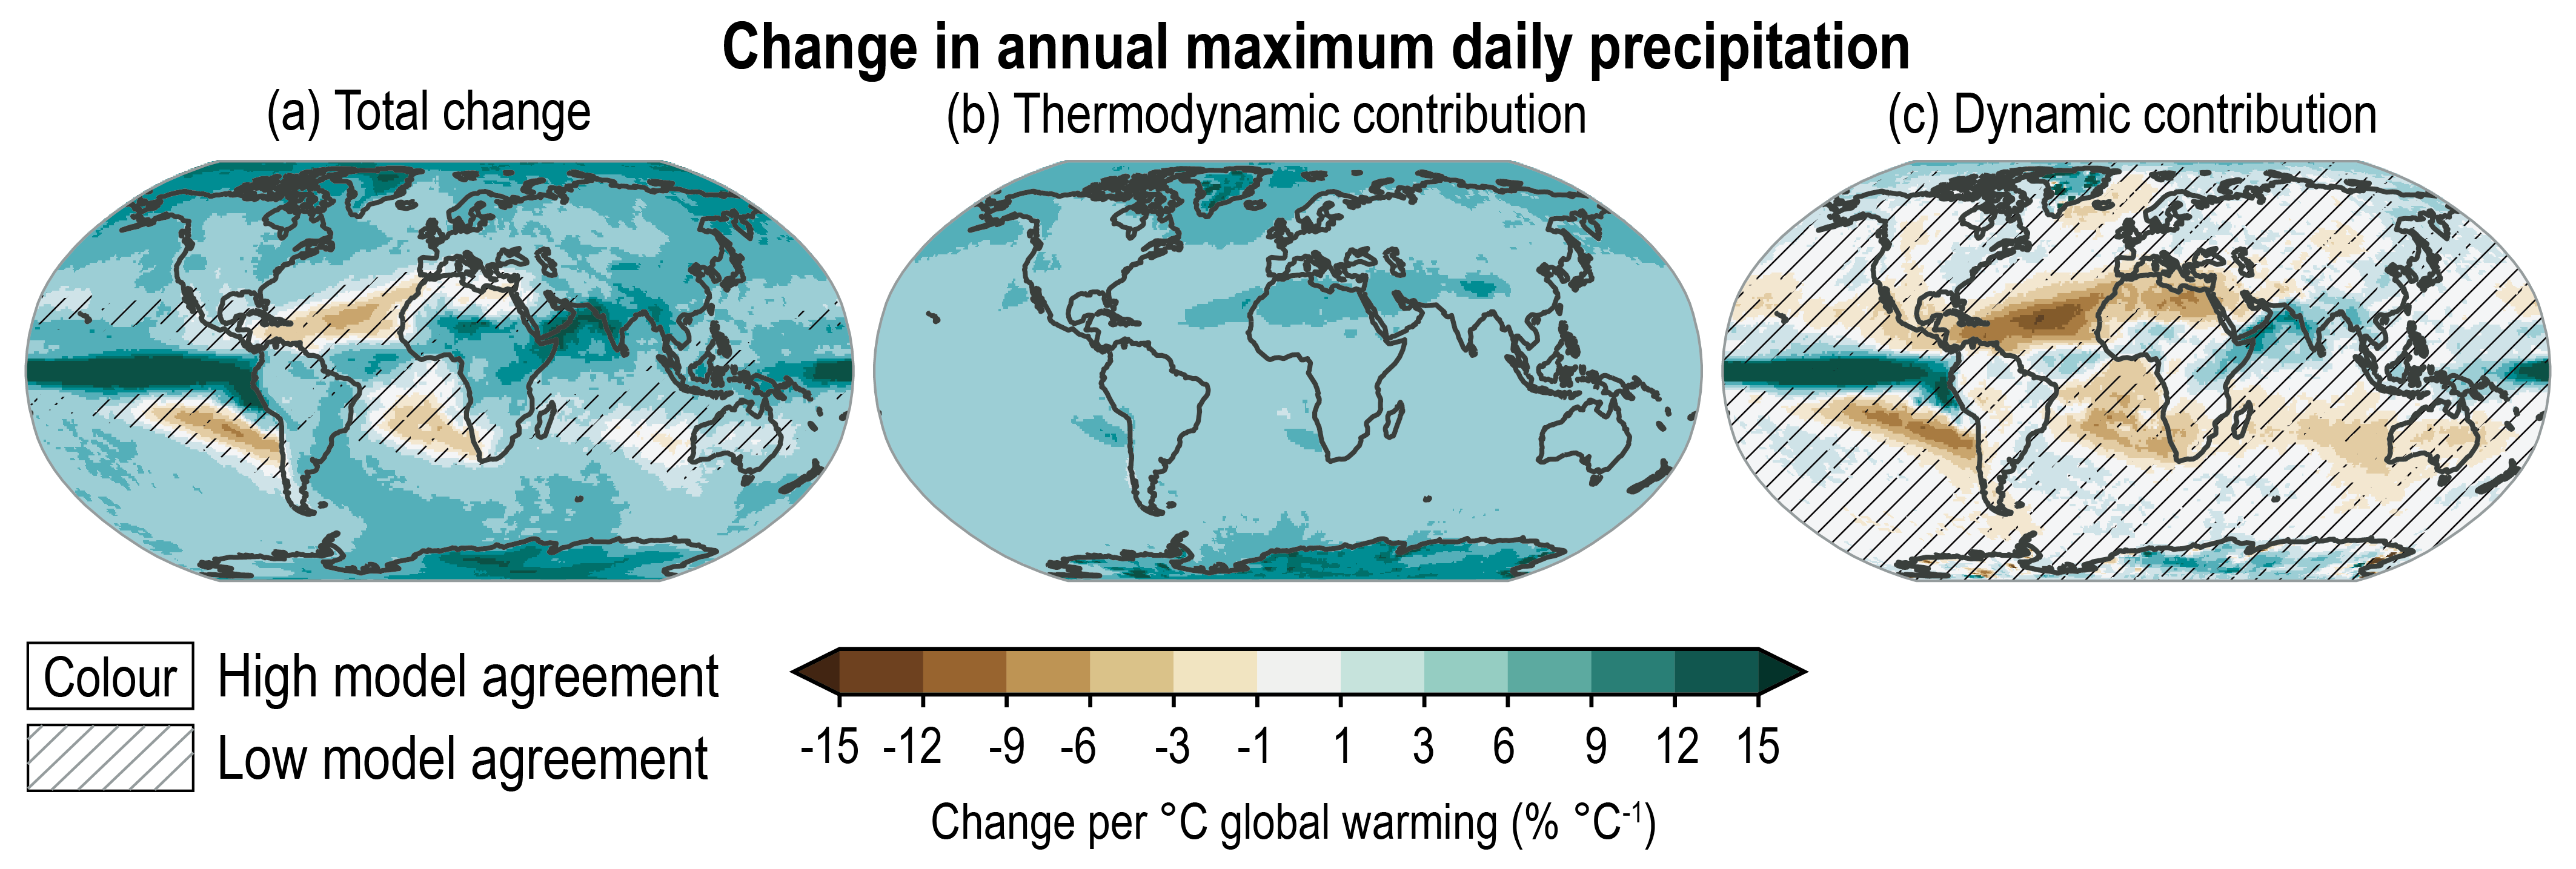
Changes in temperature also control changes in water vapour through increases in evaporation and in the water-holding capacity of the atmosphere (Section 8.2.1). At the global scale, column-integrated water vapour content increases roughly following the Clausius–Clapeyron (C-C) relation, with an increase of approximately 7% per 1°C of global-mean surface warming (Section 8.2.1). Nonetheless, at regional scales, water vapour increases differ from this C-C rate due to several reasons (Section 8.2.2), including a change in weather regimes and limitations in moisture transport from the ocean, which warms more slowly than land (Byrne and O’Gorman, 2018). Observational studies (Fischer and Knutti, 2016; Sun et al., 2021) have shown that the observed rate of increased precipitation extremes is similar to the C-C rate at the global scale. Climate model projections show that the increase in water vapour leads to robust increases in precipitation extremes everywhere, with a magnitude that varies between 4% and 8% per 1°C of surface warming (thermodynamic contribution, Box 11.1, Figure 1b). At regional scales, climate models show that the dynamic contribution (Box 11.1, Figure 1c) can be substantial and strongly modify the projected rate of change of extreme precipitation (Box 11.1, Figure 1a) with large regions in the subtropics showing robust reductions and other areas (e.g., equatorial Pacific) showing robust amplifications (Box 11.1, Figure 1c). However, the dynamic contributions show large differences across models and are more uncertain than thermodynamic contributions (Box 11.1, Figure 1c; Shepherd, 2014; Trenberth et al., 2015; Pfahl et al., 2017).

Box 11.1, Figure 1: Multi-model Coupled Model Intercomparison Project Phase 5 (CMIP5) mean fractional changes (in % per degree of warming). (a) changes in annual maximum precipitation (Rx1day); (b) changes in Rx1day due to the thermodynamic contribution; and (c) changes in Rx1day due to the dynamic contribution estimated as the difference between the total changes and the thermodynamic contribution. Changes were derived from a linear regression for the period 1950–2100. Uncertainty is represented using the simple approach: no overlay indicates regions with high model agreement, where ≥80% of models (n=22) agree on the sign of change; diagonal lines indicate regions with low model agreement, where <80% of models agree on the sign of change. For more information on the simple approach, please refer to the Cross-Chapter Box (Atlas 1. A detailed description of the estimation of dynamic and thermodynamic contributions is given in Pfahl et al. (2017). Figure adapted from Pfahl et al. (2017), originally published inNature Climate Change/Springer Nature. Further details on data sources and processing are available in the chapter data table (Table 11.SM.9).
Dynamic contributions can occur in response to changes in the vertical and horizontal distribution of temperature (thermodynamics) and can affect the frequency and intensity of synoptic and subsynoptic phenomena, including tropical cyclones, extratropical cyclones, fronts, mesoscale-convective systems and thunderstorms. For example, the poleward shift and strengthening of the Southern Hemisphere mid-latitude storm tracks (Section 4.5.1) can modify the frequency or intensity of extreme precipitation. However, the precise way in which dynamic changes will affect precipitation extremes is unclear due to several competing effects (Shaw et al., 2016; Allan et al., 2020).
Box 11.1
Extreme precipitation can also be enhanced by dynamic responses and feedbacks occurring within storms that result from the extra latent heat released from the thermodynamic increases in moisture(Lackmann, 2013; Willisonet al. , 2013; Marcianoet al. , 2015; Nieet al. , 2018; Mizuta and Endo, 2020). The extra latent heat released within storms has been shown to increase precipitation extremes by strengthening convective updrafts and the intensity of the cyclonic circulation (e.g., Molnar et al., 2015; Nie et al., 2018), although weakening effects have also been found in mid-latitude cyclones (e.g., Kirshbaum et al., 2017). Additionally, the increase in latent heat can also suppress convection at larger scales due to atmospheric stabilization (Nie et al., 2018; Tandon et al., 2018; Kendon et al., 2019). As these dynamic effects result from feedback processes within storms where convective processes are crucial, their proper representation might require improving the horizontal/vertical resolution, the formulation of parametrizations, or both, in current climate models (i.e., Kendon et al. , 2014; Westra et al. , 2014; Ban et al. , 2015; Meredith et al. , 2015; Prein et al. , 2015; Nie et al., 2018).
Droughts
Droughts are also affected by thermodynamic and dynamic processes (Sections 8.2.3.3 and 11.6). Thermodynamic processes affect droughts by increasing atmospheric evaporative demand (Martin, 2018; Gebremeskel Haile et al., 2020; Vicente-Serrano et al., 2020a) through changes in air temperature, radiation, wind speed, and relative humidity. Dynamic processes affect droughts through changes in the occurrence, duration and intensity of weather anomalies, which are related to precipitation and the amount of sunlight (Section 11.6). While atmospheric evaporative demand increases with warming, regional changes in aridity are affected by increasing land–ocean warming contrast, vegetation feedbacks and responses to rising CO2 concentrations, and dynamic shifts in the location of the wet and dry parts of the atmospheric circulation in response to climate change, as well as internal variability (Byrne and O’Gorman, 2015; Kumar et al., 2015; Allan et al., 2020).
In summary, both thermodynamic and dynamic processes are involved in the changes of extremes in response to warming. Anthropogenic forcing (e.g., increases in greenhouse gas concentrations) directly affects thermodynamic variables, including overall increases in high temperatures and atmospheric evaporative demand, and regional changes in atmospheric moisture, which intensify heatwaves, droughts and heavy precipitation events when they occur (high confidence). Dynamic processes are often indirect responses to thermodynamic changes, are strongly affected by internal climate variability, and are also less well understood. As such, there is low confidence in how dynamic changes affect the location and magnitude of extreme events in a warming climate.
11.1.5 Effects of Large-scale Circulation on Changes in Extremes
Atmospheric large-scale circulation patterns and associated atmospheric dynamics are important determinants of the regional climate (Chapter 10). As a result, they are also important to the magnitude, frequency, and duration of extremes (Box 11.4). Aspects of changes in large-scale circulation patterns are assessed in Chapters 2, 3, 4 and 8, and representative atmospheric and oceanic modes are described in Annex IV. This subsection provides some general concepts, through a couple of examples, on why the uncertainty in the response of large-scale circulation patterns to external forcing can cascade to uncertainty in the response of extremes to external forcings. Details for specific types of extremes are covered in the relevant subsections. For example, the occurrence of the El Niño–Southern Oscillation (ENSO) influences precipitation regimes in many areas, favouring droughts in some regions and heavy rains in others (Box 11.4). The extent and strength of the Hadley circulation influences regions where tropical and extratropical cyclones occur, with important consequences for the characteristics of extreme precipitation, drought, and winds (Section 11.7). Changes in circulation patterns associated with land–ocean heat contrast, which affect the monsoon circulations (Section 8.4.2.4), lead to heavy precipitation along the coastal regions in East Asia (Freychet et al., 2015). As a result, changes in the spatial and/or temporal variability of the atmospheric circulation in response to warming affect characteristics of weather systems such as tropical cyclones (Sharmila and Walsh, 2018), storm tracks (Shaw et al., 2016), and atmospheric rivers (Section 11.7; Waliser and Guan, 2017). Changes in weather systems come with changes in the frequency and intensity of extreme winds, extreme temperatures, and extreme precipitation, on the backdrop of thermodynamic responses of extremes to warming (Box 11.1). Floods are also affected by large-scale circulation modes, including ENSO, the North Atlantic Oscillation (NAO), the Atlantic Multi-decadal Variability (AMV), and the Pacific Decadal Variability (PDV) (Kundzewicz et al., 2018; Annex IV). Aerosol forcing, through changes in patterns of sea surface temperatures (SSTs), also affects circulation patterns and tropical cyclone activities (Takahashi et al., 2017).
In general, changes in atmospheric large-scale circulation due to external forcing are uncertain, but there are some robust changes (Sections 2.3.1.4 and 8.2.2.2). Among them, there has been avery likely widening of the Hadley circulation since the 1980s and the extratropical jets and cyclone tracks have likely been shifting poleward since the 1980s (Section 2.3.1.4). The poleward expansion affects drought occurrence in some regions (Section 11.6), and results in poleward shifts of tropical cyclones and storm tracks (Sections 11.7.1 and 11.7.2). Although it is very likely that the amplitude of ENSO variability will not robustly change over the 21st century (Section 4.3.3.2), the frequency of extreme ENSO events (Box 11.4), defined by precipitation threshold, is projected to increase with global warming (Section 6.5 of SROCC). This would have implications for projected changes in extreme events affected by ENSO, including droughts over wide areas (Section 11.6; Box 11.4) and tropical cyclones (Section 11.7.1). A case study is provided for extreme ENSO events in 2015–2016 in Box 11.4 to highlight the influence of ENSO on extremes.
In summary, large-scale atmospheric circulation patterns are important drivers for local and regional extremes. There is overall low confidence about future changes in the magnitude, frequency, and spatial distribution of these patterns, which contributes to uncertainty in projected responses of extremes, especially in the near term.
11.1.6 Effects of Regional-scale Processes and Forcings and Feedbacks on Changes in Extremes
At the local and regional scales, changes in extremes are strongly modulated by local and regional feedbacks (SRCCL, Jia et al., 2019; Seneviratne et al., 2013; Miralles et al., 2014a; Lorenz et al., 2016; Vogel et al., 2017), changes in large-scale circulation patterns (Section 11.1.5), and regional forcings such as changes in land use or aerosol concentrations (Chapters 3 and 7; Findell et al., 2017; Hirsch et al., 2017, 2018; Thiery et al., 2017; Z. Wang et al., 2017b). In some cases, such responses may also include non-local effects (e.g., de Vrese et al., 2016; Persad and Caldeira, 2018; Miralles et al., 2019; Schumacher et al., 2019). Regional-scale forcing and feedbacks often affect temperature distributions asymmetrically, with generally higher effects for the hottest percentiles (Section 11.3).
Land use can affect regional extremes, in particular hot extremes, in several ways (high confidence). This includes effects of land management (e.g., cropland intensification, irrigation, double cropping) as well as of land cover changes (deforestation; Sections 11.3.2 and 11.6). Some of these processes are not well represented (e.g., effects of forest cover on diurnal temperature cycle) or not integrated (e.g., irrigation) in climate models (Sections 11.3.2 and 11.3.3). Overall, the effects of land-use forcing may be particularly relevant in the context of low-emissions scenarios, which include large land-use modifications, for instance those associated with the expansion of biofuels, bioenergy with carbon capture and storage, or re-/afforestation to ensure negative emissions, as well as with the expansion of food production (e.g., SR1.5, Chapter 3; Cross-Chapter Box 5.1 in this Report; van Vuuren et al., 2011; Hirsch et al., 2018). There are also effects on the water cycle through freshwater use (Section 11.6 and Cross-Chapter Box 5.1).
Aerosol forcing also has a strong regional footprint associated with regional emissions, which affects temperature and precipitation extremes (high confidence) (Sections 11.3 and 11.4). From around the 1950s to 1980s, enhanced aerosol loadings led to regional cooling due to decreased global solar radiation (‘global dimming’) which was followed by a phase of ‘global brightening’ due to a reduction in aerosol loadings (Chapters 3 and 7; Wild et al., 2005). King et al. (2016b) show that aerosol-induced cooling delayed the timing of a significant human contribution to record-breaking heat extremes in some regions. However, the decreased aerosol loading since the 1990s has led to an accelerated warming of hot extremes in some regions. Based on Earth system model (ESM) simulations, Dong et al. (2017) suggest that a substantial fraction of the warming of the annual hottest days in Western Europe since the mid-1990s has been due to decreases in aerosol concentrations in the region. Dong et al. (2016b) also identify non-local effects of decreases in aerosol concentrations in Western Europe, which they estimate played a dominant role in the warming of the hottest daytime temperatures in north-east Asia since the mid-1990s, via induced coupled atmosphere–land surface and cloud feedbacks, rather than a direct impact of anthropogenic aerosol changes on cloud condensation nuclei.
In addition to regional forcings, regional feedback mechanisms can also substantially affect extremes (high confidence) (Sections 11.3, 11.4 and 11.6). In particular, soil moisture feedbacks play an important role for extremes in several mid-latitude regions, leading to a marked additional warming of hot extremes compared to mean global warming (Seneviratne et al., 2016; Bathiany et al., 2018; Miralles et al., 2019), which is superimposed on the known land–sea contrast in mean warming (Vogel et al., 2017). Soil moisture–atmosphere feedbacks also affect drought development (Section 11.6). Additionally, effects of land surface conditions on circulation patterns have also been reported (Koster et al., 2016; Sato and Nakamura, 2019). These regional feedbacks are also associated with substantial spread in models (Section 11.3), and contribute to the identified higher spread of regional projections of temperature extremes as a function of global warming, compared with the spread resulting from the differences in projected global warming (global transient climate responses) in climate models (Seneviratne and Hauser, 2020). In addition, there are also feedbacks between soil moisture content and precipitation occurrence, generally characterized by negative spatial feedbacks and positive local feedbacks (Taylor et al., 2012; Guillod et al., 2015). Climate model projections suggest that these feedbacks are relevant for projected changes in heavy precipitation (Seneviratne et al., 2013). However, there is evidence that climate models do not capture the correct sign of the soil moisture–precipitation feedbacks in several regions, in particular spatially, and/or in some cases also temporally (Taylor et al., 2012; Moon et al., 2019). In the Northern Hemisphere high latitudes, the snow- and ice-albedo feedback, along with other factors, is projected to largely amplify temperature increases (e.g., Pithan and Mauritsen, 2014), although the effect on temperature extremes is still unclear. It also remains unclear whether snow-albedo feedbacks in mountainous regions might have an effect on temperature and precipitation extremes (e.g., Gobiet et al., 2014). However, these feedbacks play an important role in projected changes in high-latitude warming (Hall and Qu, 2006), and, in particular, in changes in cold extremes in these regions (Section 11.3).
Finally, extreme events may also regionally amplify one another. For example, this is the case for heatwaves and droughts, with high temperatures and stronger radiative forcing leading to drying tendencies on land due to increased evapotranspiration (Section 11.6), and drier soils then inducing decreased evapotranspiration and higher sensible heat flux and hot temperatures (Box 11.1, Section 11.8; Seneviratne et al., 2013; Miralles et al., 2014a; Vogel et al., 2017; Zscheischler and Seneviratne, 2017; S. Zhou et al., 2019; Kong et al., 2020).
In summary, regional forcings and feedbacks – in particular those associated with land use and aerosol forcings – and soil-moisture–temperature, soil moisture–precipitation, and snow/ice–albedo–temperature feedbacks, play an important role in modulating regional changes in extremes. These can also lead to a higher warming of extreme temperatures compared to mean temperature (high confidence), and possibly cooling in some regions (medium confidence). However, there is only medium confidence in the representation of the associated processes in state-of-the-art ESMs.
11.1.7 Global-scale Synthesis
Tables 11.1 and 11.2 provide a synthesis for observed and attributed changes in extremes, and projected changes in extremes, respectively, at different levels of global warming. This synthesis assessment focuses on the assessed range of observed and projected changes. In this chapter, the assessed likely range in a projection typically corresponds to the 90% range of the multi-model ensemble spread to take into account other sources of uncertainty, unless stated otherwise. Some low-likelihood, high-impact scenarios that can be of high relevance are addressed in Box 11.2.
Building on the assessments from Tables 11.1 and 11.2, Figure 11.5 provides a synthesis on the level of confidence in the attribution and projection of changes in extremes. In the case where the signal in the observations is still relatively weak but the physical processes underlying the changes in extremes in response to human forcing are well understood, confidence in the projections would be higher than in the attribution because of strengthening in the signal with warming. But, when the observed signal is already strong and when observational evidence is consistent with model simulated responses, confidence in the projection may be lower than that in attribution if certain physical processes could be expected to behave differently in a much warmer world and under much higher greenhouse gas forcing, and in particular if such a behaviour is poorly understood.
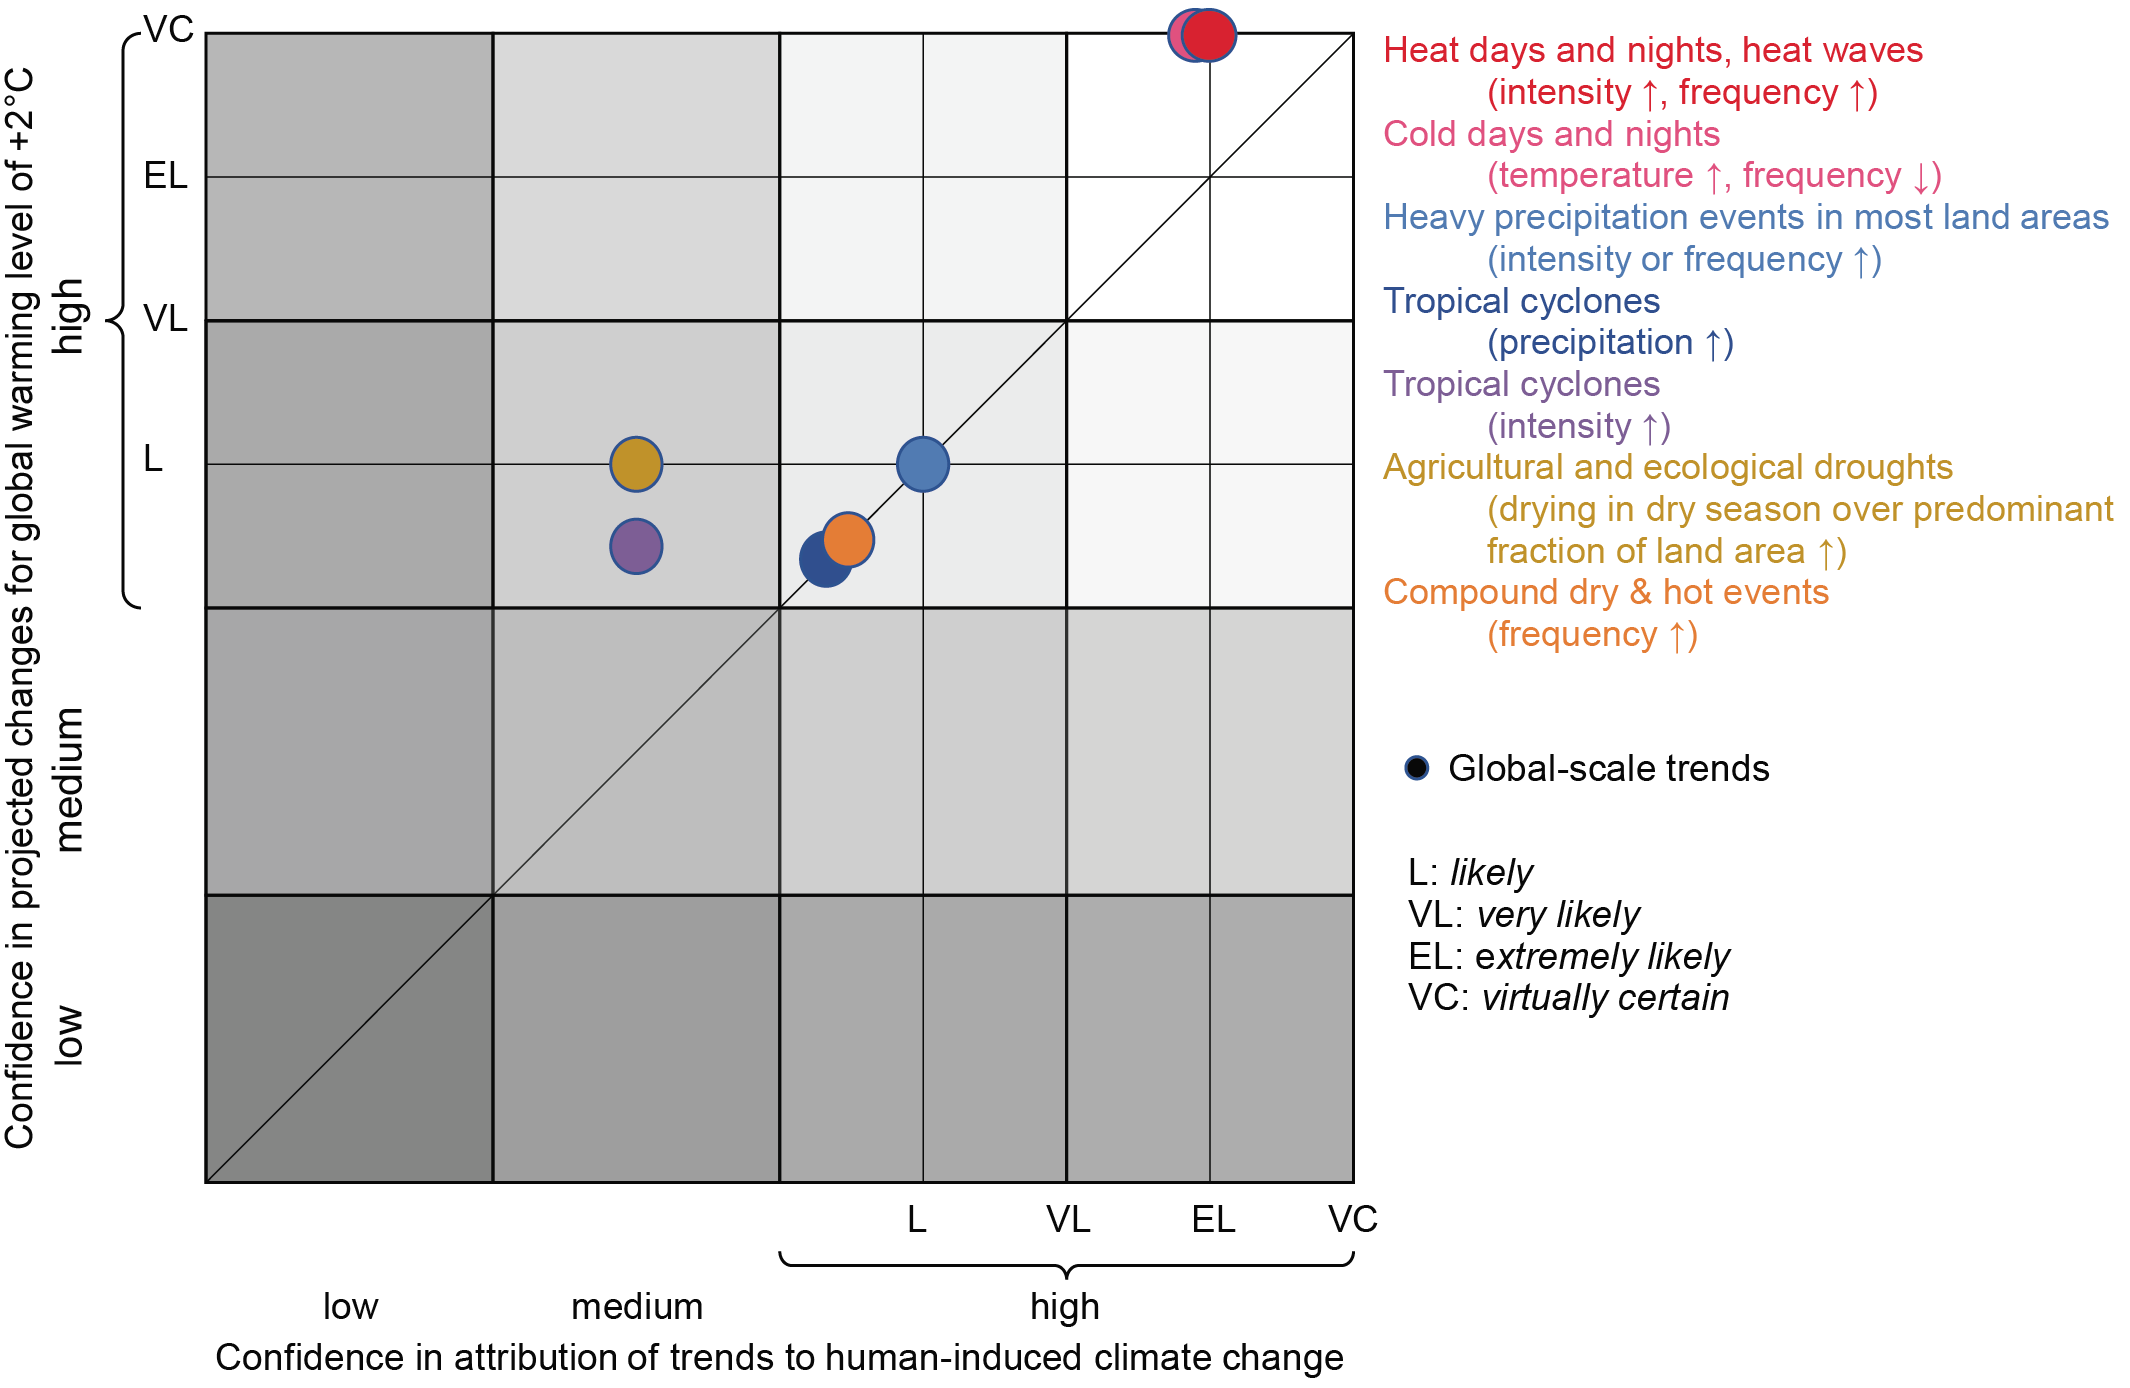 Figure 11.5 | confidence and likelihood of past changes and projected future changes at 2°C of global warming on the global scale. The information in this figure is based on Tables 11.1 and 11.2.
 Further synthesis for regional assessments are provided in Figure 11.4 (event attribution), Figure 11.6 (projected change in hot temperature extremes) and Figure 11.7 (projected changes in precipitation extremes). A synthesis on regional assessments for observed, attributed and projected changes in extremes is provided in Section 11.9 for all AR6 reference regions (see Section 1.4.5 and Figures 1.18 and Atlas.2 for definitions of AR6 regions).
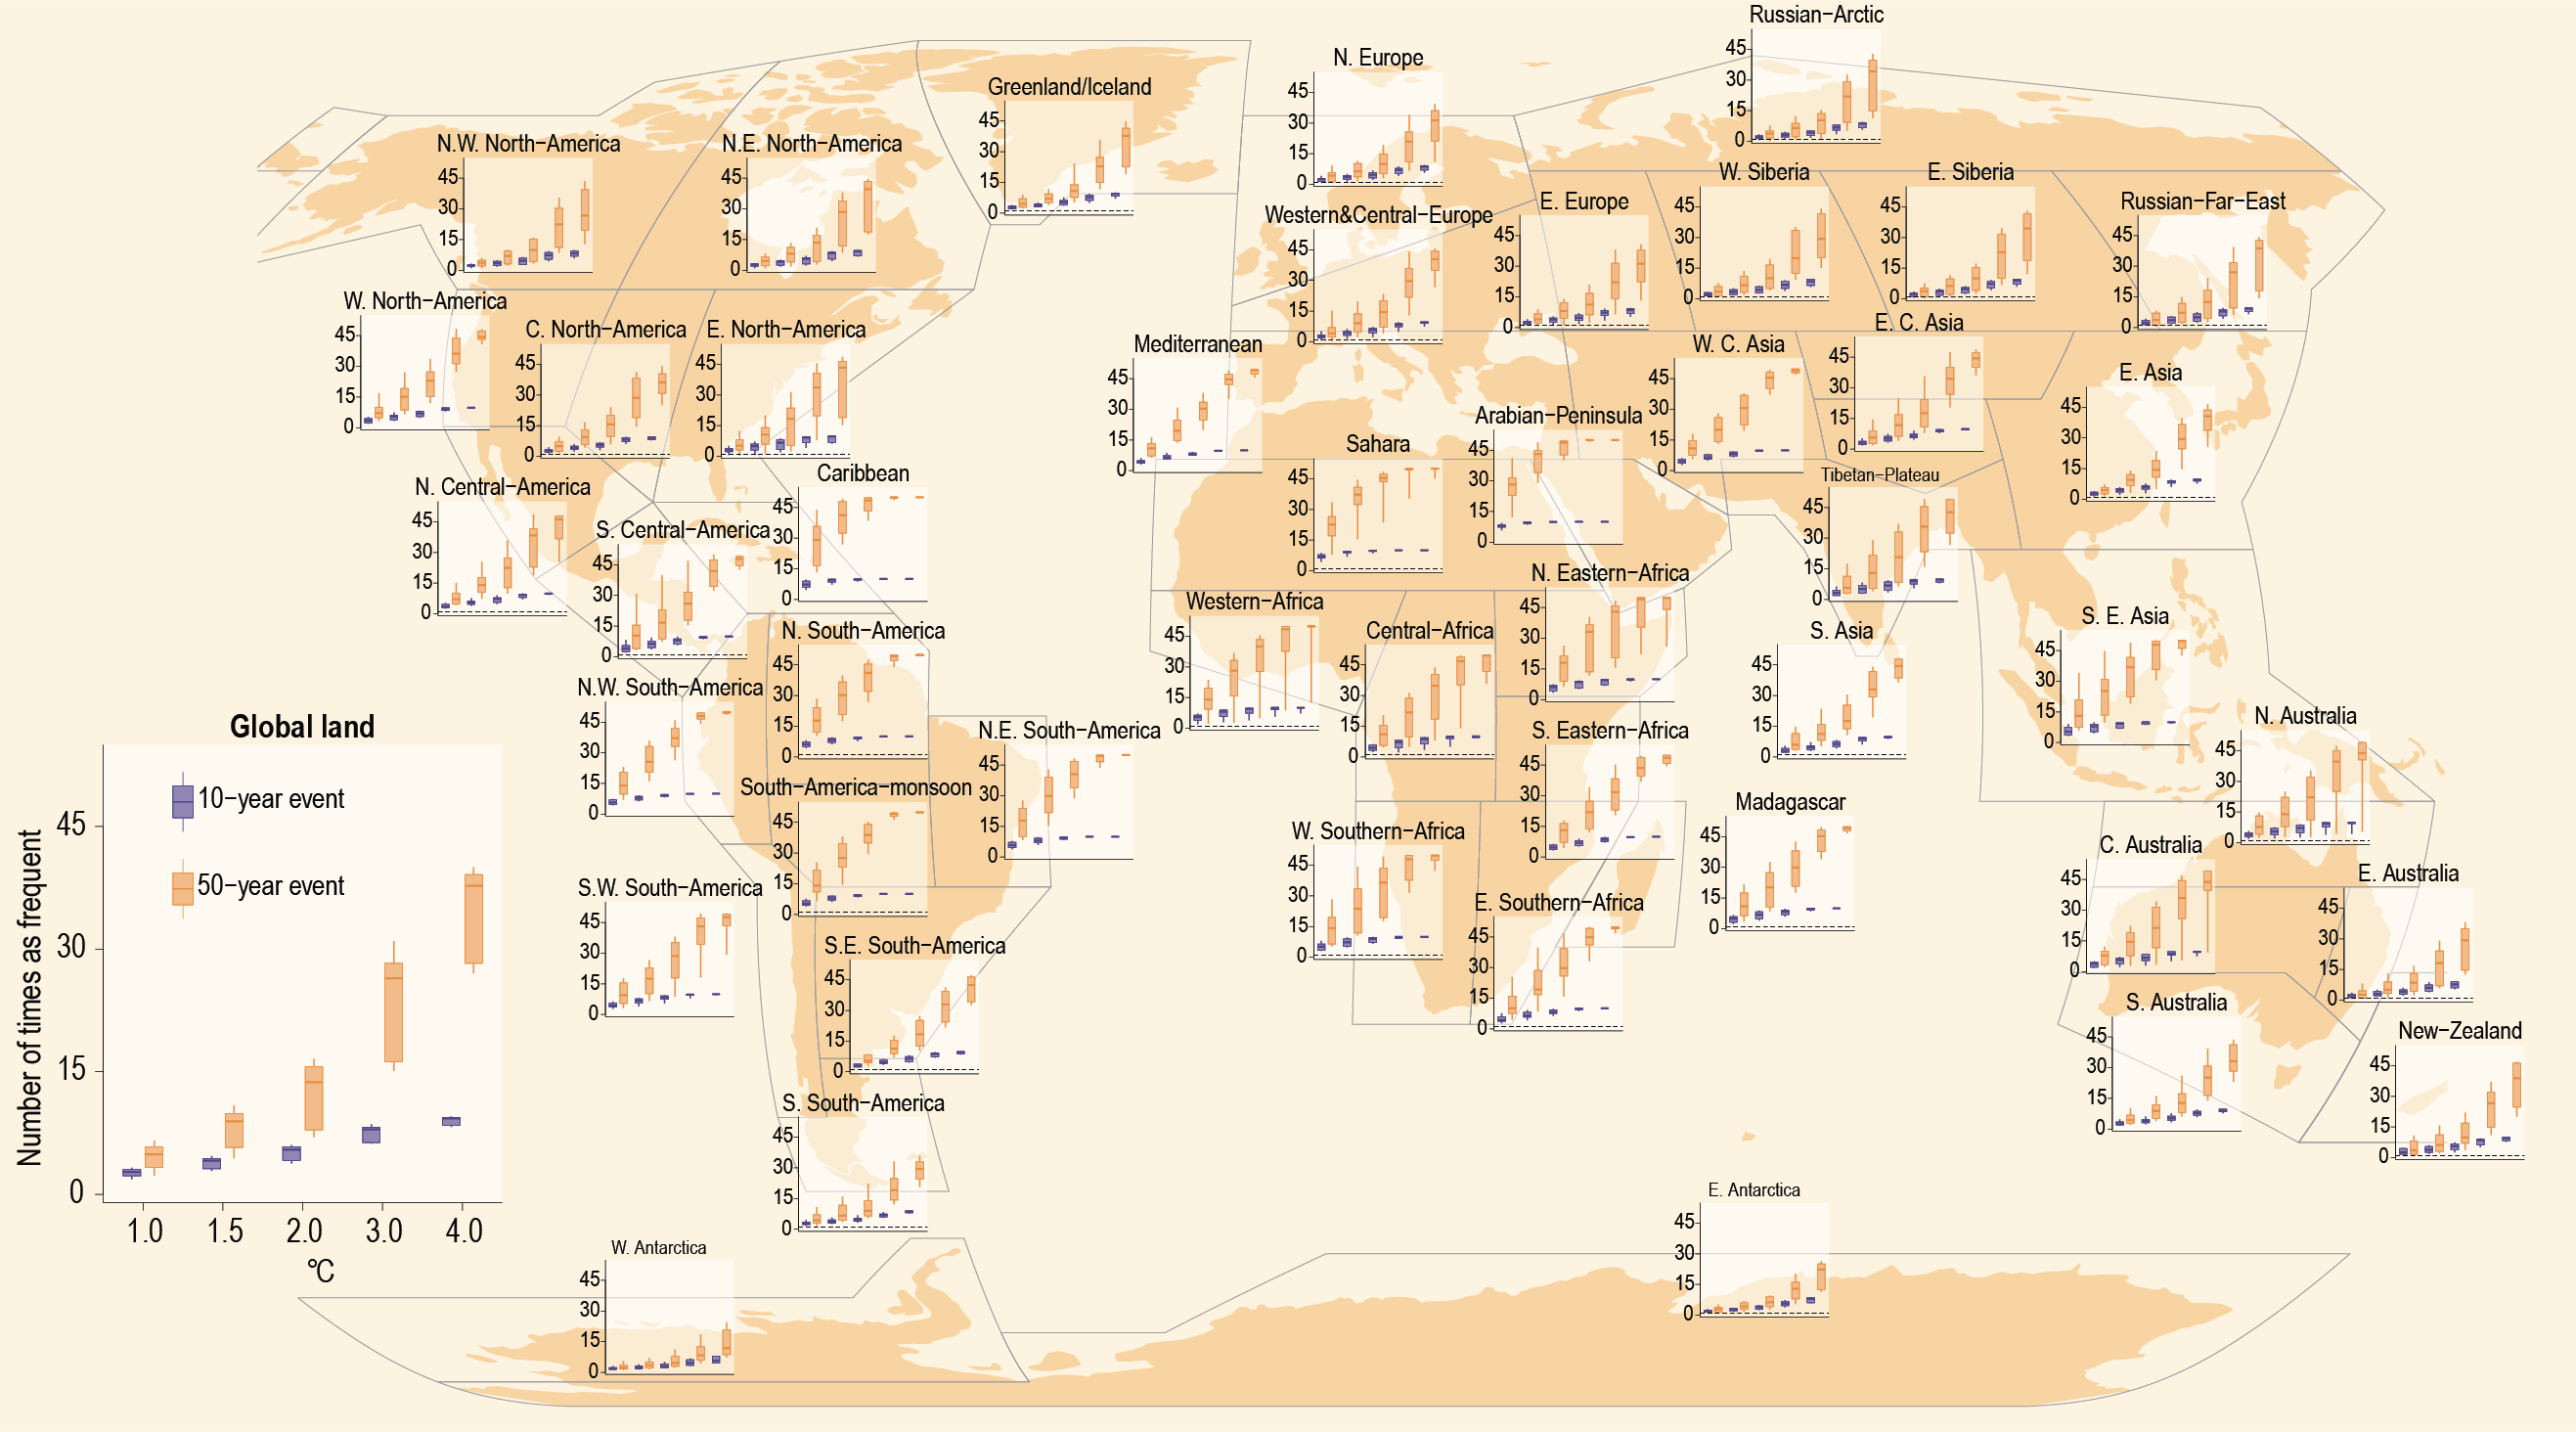
 Figure 11.6 | Projected changes in the frequency of extreme temperature events under 1°C, 1.5°C, 2°C, 3°C, and 4°C global warming levels relative to the 1850–1900 baseline. Extreme temperatures are defined as the maximum daily temperatures that were exceeded on average once during a 10-year period (10-year event, blue) and once during a 50-year period (50-year event, orange) during the 1850–1900 base period. Results are shown for the global land area and the AR6 regions. For each box plot, the horizontal line and the box represent the median and central 66% uncertainty range, respectively, of the frequency changes across the multi-model ensemble, and the ‘whiskers’ extend to the 90% uncertainty range. The dotted line indicates no change in frequency. The results are based on the multi-model ensemble from simulations of global climate models contributing to the Coupled Model Intercomparison Project Phase 6 (CMIP6) under different Shared Socio-economic Pathway forcing scenarios. Adapted from Li et al. (2021). Further details on data sources and processing are available in the chapter data table (Table 11.SM.9).
 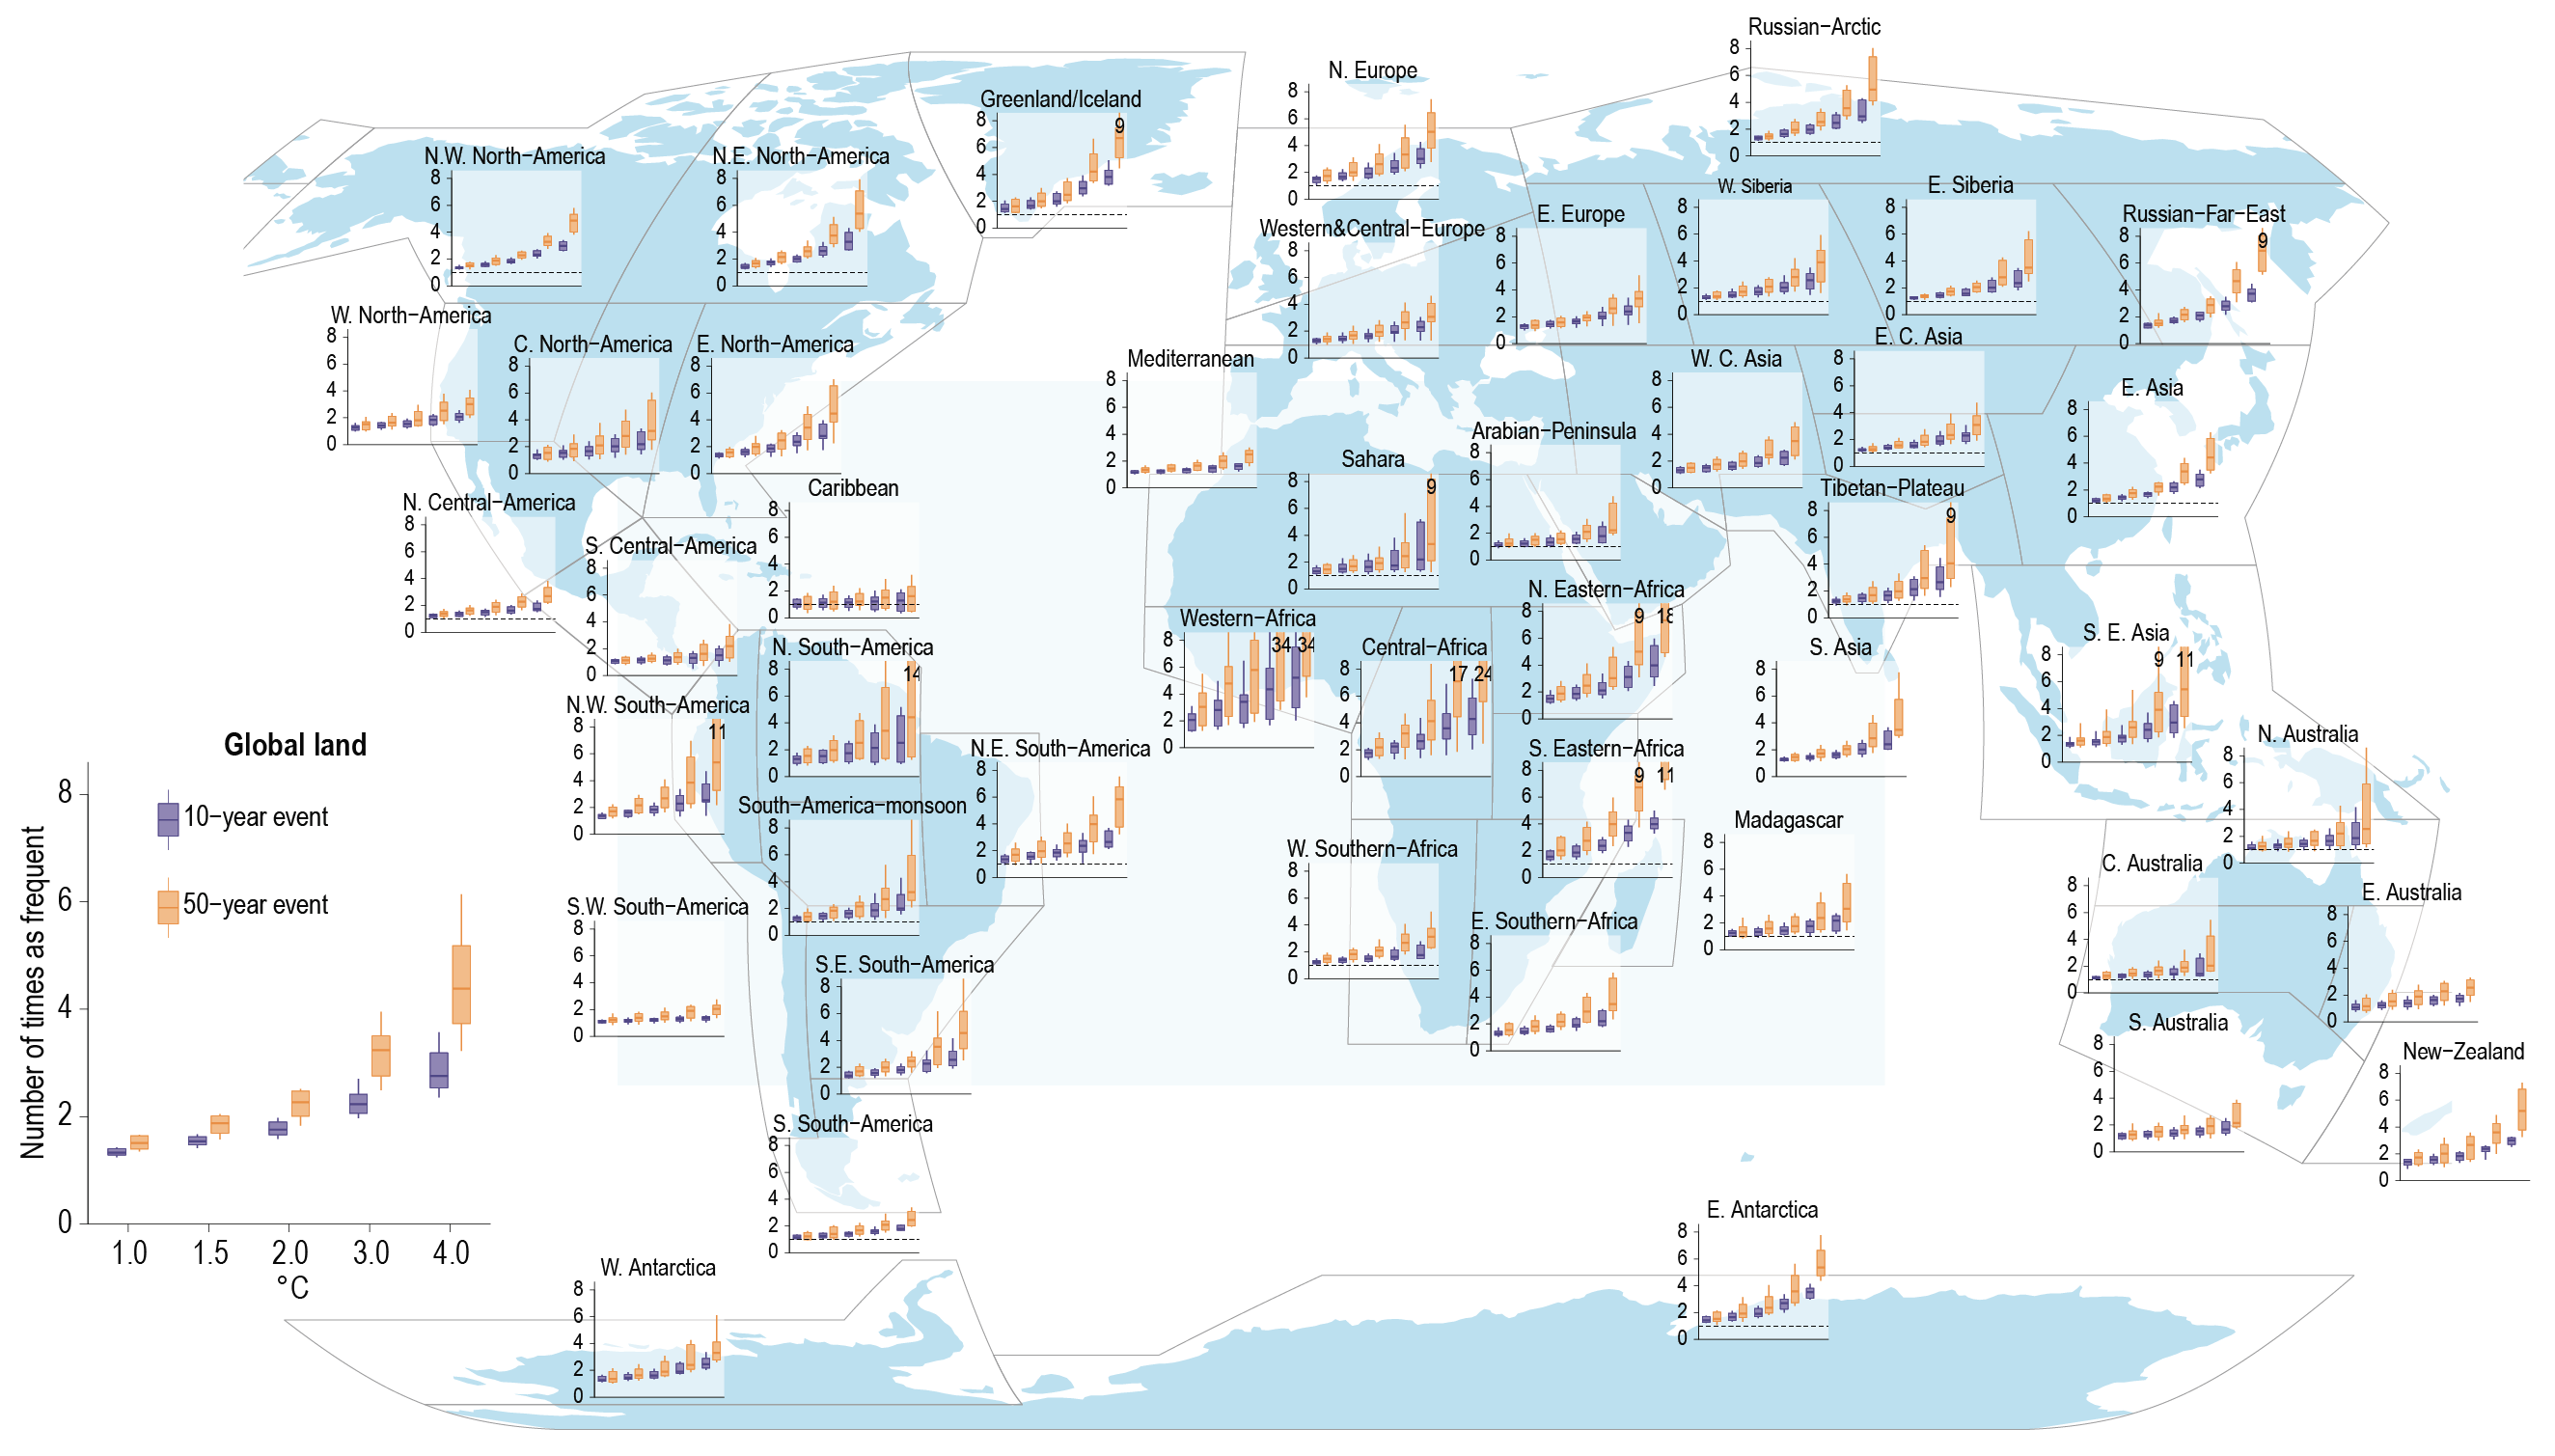 Figure 11.7 | Projected changes in the frequency of extreme precipitation events under 1°C, 1.5°C, 2°C, 3°C, and 4°C global warming levels relative to the 1850–1900 baseline. Extreme precipitation is defined as the annual maximum daily precipitation (Rx1day) that was exceeded on average once during a 10-year period (10-year event, blue) and once during a 50-year period (50-year event, orange) during the 1850–1900 base period. Results are shown for the global land area and the AR6 regions. For each box plot, the horizontal line and the box represent the median and central 66% uncertainty range, respectively, of the frequency changes across the multi-model ensemble, and the ‘whiskers’ extend to the 90% uncertainty range. The dotted line indicates no change in frequency. The results are based on the multi-model ensemble from simulations of global climate models contributing to the Coupled Model Intercomparison Project Phase 6 (CMIP6) under different Shared Socio-economic Pathway forcing scenarios. Adapted from Li et al. (2021). Further details on data sources and processing are available in the chapter data table (Table 11.SM.9).
 Phenomenon and Direction of Trend | Observed/Detected Trends Since 1950 (for +0.5°C global warming or higher) | Human Contribution to the Observed Trends Since 1950 (for +0.5°C global warming or higher) |
Warmer and/or more frequent hot days and nights over most land areas Warmer and/or fewer cold days and nights over most land areas Warm spells/heatwaves: increases in frequency or intensity over most land areas Cold spells/cold waves: decreases in frequency or intensity over most land areas | Virtually certain on global scale {11.3} Continental-scale evidence: Asia, Australasia, Europe, North America: Very likely Central and South America: High confidence Africa: Medium confidence {11.3, 11.9} | Extremely likely main contributor on global scale {11.3} Continental-scale evidence: North America, Europe, Australasia, Asia: Very likely Central and South America: High confidence Africa: Medium confidence {11.3, 11.9} |
Heavy precipitation events: increase in the frequency, intensity, and/or amount of heavy precipitation | Likely on global scale, over majority of land regions with good observational coverage {11.3} Continental-scale evidence: Asia, Europe, North America: Likely Africa, Australasia, Central and South America: Low confidence {11.3, 11.9} | Likely main contributor to the observed intensification of heavy precipitation in land regions on global scale. {11.3} Continental-scale evidence: Asia, Europe, North America: Likely Africa, Australasia, Central and South America: Low confidence {11.3, 11.9} |
Increases in agricultural and ecological drought events | Medium confidence some regions {11.6, 11.9} Increasing trends in agricultural and ecological droughts have been observed in AR6 regions on all continents (medium confidence) {11.6, 11.9} | Medium confidence some regions {11.6, 11.9} |
Increase in precipitation associated with tropical cyclones (TCs) | Medium confidence {11.7} | High confidence {11.7} |
Increase in likelihood that a TC will be at major TC intensity (Cat. 3–5) | Likely {11.7} | Medium confidence {11.7} |
Changes in frequency of rapidly intensifying tropical cyclones | Likely {11.7} | Medium confidence {11.7} |
Poleward migration of tropical cyclones in the western Pacific | Medium confidence {11.7} | Medium confidence {11.7} |
Decrease in TC forward motion over the USA | It is likely that TC translation speed has slowed over the USA since 1900. {11.7} | It is more likely than not that the slowdown of TC translation speed over the USA has contributions from anthropogenic forcing. {11.7} |
Severe convective storms (tornadoes, hail, rainfall, wind, lightning) | Low confidence in past trends in hail and winds and tornado activity due to short length of high-quality data records. {11.7} | Low confidence {11.7} |
Increase in compound events | Likely increase in the probability of compound events. High confidence that concurrent heatwaves and droughts are becoming more frequent under enhanced greenhouse gas forcing at global scale. Medium confidence that fire weather, i.e. compound hot, dry and windy events, have become more frequent in some regions. Medium confidence that compound flooding risk has increased in some locations. {11.8} | Likely that human-induced climate change has increased the probability of compound events. High confidence that human influence has increased the frequency of concurrent heatwaves and droughts. Medium confidence that human influence has increased fire weather occurrence in some regions. Low confidence that human influence has contributed to changes in compound events leading to flooding. {11.8} |
Phenomenon and Direction of Trend | Projected Changes at +1.5ºC Global Warming | Projected Changes at +2°C Global Warming | Projected Changes at +4°C Global Warming |
Warmer and/or more frequent hot days and nights over most land areas Warmer and/or fewer cold days and nights over most land areas Warm spells/heatwaves; increases in frequency or intensity over most land areas Cold spells/cold waves: decreases in frequency or intensity over most land areas | Virtually certain on global scale Extremely likely on all continents Highest increase of temperature of hottest days is projected in some mid-latitude and semi-arid regions, and the South American Monsoon region, at about 1.5 times to twice the rate of global warming (high confidence){11.3, Figure 11.3} Highest increase of temperature of coldest days is projected in Arctic regions, at about three times the rate of global warming (high confidence){11.3} Continental-scale projections: Extremely likely : Africa, Asia, Australasia, Central and South America, Europe, North America {11.3, 11.9} | Virtually certain on global scale Virtually certain on all continents Highest increase of temperature of hottest days is projected in some mid-latitude and semi-arid regions, and the South American Monsoon region, at about 1.5 times to twice the rate of global warming (high confidence){11.3, Figure 11.3} Highest increase of temperature of coldest days is projected in Arctic regions, at about three times the rate of global warming (high confidence){11.3} Continental-scale projections: Virtually certain: Africa, Asia, Australasia, Central and South America, Europe, North America {11.3, 11.9} | Virtually certain on global scale Virtually certain on all continents Highest increase of temperature of hottest days is projected in some mid-latitude and semi-arid regions, and the South American Monsoon region, at about 1.5 times to twice the rate of global warming (high confidence){11.3, Figure 11.3} Highest increase of temperature of coldest days is projected in Arctic regions, at about three times the rate of global warming (high confidence){11.3} Continental-scale projections: Virtually certain: Africa, Asia, Australasia, Central and South America, Europe, North America {11.3, 11.9} |
Heavy precipitation events: increase in the frequency, intensity, and/or amount of heavy precipitation | High confidence that increases take place in most land regions{11.4} Very likely : Asia, North America Likely: Africa, Europe High confidence: Central and South America Medium confidence: Australasia {11.4, 11.9} | Likely that increases take place in most land regions{11.4} Extremely likely : Asia, North America Very likely : Africa, Europe Likely: Australasia, Central and South America {11.4, 11.9} | Very likely that increases take place in most land regions{11.4} Virtually certain: Africa, Asia, North America Extremely likely : Central and South America, Europe Very likely Australasia {11.4, 11.9} |
Agricultural and ecological droughts: increases in intensity and/or duration of drought events | More regions affected by increases in agricultural and ecological droughts compared to observed changes (high confidence). {11.6, 11.9} Decreased precipitation is going to increase the severity of drought in some regions; atmospheric evaporative demand will continue to increase compared to pre-industrial conditions and lead to further increases in agricultural and ecological droughts due to increased evapotranspiration in some regions. (high confidence) {11.6, 11.9} | More regions affected by increases in agricultural and ecological droughts than at 1.5°C of global warming (high confidence). {11.6, 11.9} Decreased precipitation is going to increase the severity of drought in some regions; atmospheric evaporative demand will continue to increase compared to pre-industrial conditions and lead to further increases in agricultural and ecological droughts due to increased evapotranspiration in some regions. (high confidence) {11.6, 11.9} | More regions affected by increases in agricultural and ecological droughts than at 2°C of global warming (very likely) . {11.6, 11.9} Decreased precipitation is going to increase the severity of drought in several regions; atmospheric evaporative demand will continue to increase compared to pre-industrial conditions and lead to further increases in agricultural and ecological droughts due to increased evapotranspiration in several regions. (high confidence) {11.6, 11.9} |
Increase in precipitation associated with tropical cyclones (TCs) | High confidence in a projected increase of TC rain rates at the global scale with amedian projected increase due to human emissions of about 11%. {11.7} Medium confidence that rain rates will increase in every basin. {11.7} | High confidence in a projected increase of TC rain rates at the global scale with a median projected increase due to human emissions of about 14%. {11.7} Medium confidence that rain rates will increase in every basin. {11.7} | High confidence in a projected increase of TC rain rates at the global scale with a median projected increase due to human emissions of about 28%. {11.7} Medium confidence that rain rates will increase in every basin. {11.7} |
Increase in mean TC lifetime-maximum wind speed (intensity) | Medium confidence {11.7} | High confidence {11.7} | High confidence {11.7} |
Increase in likelihood that a TC will reach major TC intensity (Category 4–5) | High confidence for an increase in the proportion of TCs that reach the strongest (Category 4–5) levels. The median projected increase in this proportion is about 10%. {11.7} | High confidence for an increase in the proportion of TCs that reach the strongest (Category 4–5) levels. The median projected increase in this proportion is about 13%. {11.7} | High confidence for an increase in the proportion of TCs that reach the strongest (Category 4–5) levels. The median projected increase in this proportion is about 20%. {11.7} |
Severe convective storms | High confidence that the average and maximum rain rates associated with severe convective storms increase in some regions, including the USA. High confidence that convective available potential energy (CAPE) increases in response to global warming in the tropics and subtropics, suggesting more favourable environments for severe convective storms. Medium confidence that the frequency of spring severe convective storms is projected to increase in the USA, leading to a lengthening of the severe convective storm season. {11.7} | ||
Increase in compound events (frequency, intensity) | Likely that probability of compound events will continue to increase with global warming. High confidence that concurrent heatwaves and droughts will continue to increase under higher levels of global warming, with higher frequency/intensity with every additional 0.5°C of global warming. High confidence that fire weather, (i.e. compound hot, dry and windy events), will become more frequent in some regions at higher levels of global warming. High confidence that compound flooding at the coastal zone will increase under higher levels of global warming. {11.8} | ||
Box 11.2 | Changes in Low-likelihood, High-impact Extremes
The SREX (Chapter 3) assigned low confidence to changes in low-likelihood, high-impact (LLHI) events (termed ‘low-probability high-impact scenarios‘). Such events are often not anticipated and thus sometimes referred to as ‘surprises’. There are several types of LLHI events. Abrupt changes in mean climate are addressed in Chapter 4. Unanticipated LLHI events can either result from tipping points in the climate system (Section 1.4.4.3), such as the shutdown of the Atlantic thermohaline circulation (SROCC Chapter 6; Collins et al., 2019) or the drydown of the Amazonian rainforest (SR1.5 Chapter 3, Hoegh-Guldberg et al., 2018; Drijfhout et al., 2015), or from uncertainties in climate processes, including climate feedbacks, that may enhance or damp extremes either related to global or regional climate responses (Seneviratne et al., 2018a; Sutton, 2018). The low confidence does not by itself exclude the possibility of such events occuring, rather it indicates a poor state of knowledge. Such outcomes, while improbable, could be associated with very high impacts, and are thus highly relevant from a risk perspective (see Section 1.4.3 and Box 11.4; Sutton, 2018, 2019). Alternatively, high impacts can occur when different extremes occur at the same time, or in short succession at the same location, or in several regions with shared vulnerability (e.g., food-basket regions Gaupp et al., 2019). These ‘compound events’ are assessed in Section 11.8, and Box 11.4 provides a case study example.
Difficulties persist in determining the likelihood of occurrence and time frame of potential tipping points and LLHI events. However, new literature has emerged on unanticipated and LLHI events. There are some events that are sufficiently rare that they have not been observed in meteorological records, but whose occurrence is nonetheless plausible within the current state of the climate system – see examples below and in McCollum et al. (2020). The rare nature of such events and the limited availability of relevant data makes it difficult to estimate their occurrence probability and thus gives little evidence on whether to include such hypothetical events in planning decisions and risk assessments. The estimation of such potential surprises is often limited to events that have historical analogues (including before the instrumental records began, Wetter et al., 2014), albeit the magnitude of the event may differ. Additionally, there is also a limitation of available resources to exhaust all plausible trajectories of the climate system. As a result, there will still be events that cannot be anticipated. These events can be surprises to many in that the events have not been experienced, although their occurrence could be inferred by statistical means or physical modelling approaches (Chen et al., 2017; van Oldenborgh et al., 2017; Harrington and Otto, 2018a). Another approach focusing on the estimation of low-probability events and of events whose likelihood of occurrence is unknown consists in using physical climate models to create a physically self-consistent storyline of plausible extreme events and assessing their impacts and driving factors in past (Section 11.2.3) or future conditions (Section 11.2.4) (Hazeleger et al. , 2015; Shepherd, 2016; Zappa and Shepherd, 2017; Cheng et al. , 2018; Shepherd et al. , 2018; Sutton, 2018; Schaller et al. , 2020; Wehrli et al., 2020).
In many parts of the world, observational data are limited to 50–60 years. This means that the chance to observe an extreme event at a particular location that occurs once in several hundred or more years is small. Thus, when a very extreme event occurs, it becomes a surprise to many (Bao et al., 2017; McCollum et al., 2020), and very rare events are often associated with high impacts(van Oldenborghet al. , 2017; Philipet al. , 2018b; Tozeret al. , 2020). Attributing and projecting very rare events in a particular location by assessing their likelihood of occurrence within the same larger region and climate thus provides another way to make quantitative assessments regarding events that are extremely rare locally. Some examples of such events include:
- Hurricane Harvey, that made landfall in Houston, TX in August 2017 (Section 11.7.1.4.)
- The 2010–2011 extreme floods in Queensland, Australia (Christidis et al., 2013a)
- The 2018 concurrent heatwaves across the Northern Hemisphere (Box 11.4)
- Tropical Cyclone Idai in Mozambique (Cross-Chapter Box: Disaster in WGII AR6 Chapter 4)
- The California fires in 2018 and 2019
- The 2019–2020 Australia fires (Cross-Chapter Box: Disaster in WGII AR6 Chapter 4)
One factor making such events hard to anticipate is the fact that we now live in a non-stationary climate, and that the framework of reference for adaptation is continuously moving. As an example, the concurrent heatwaves that occurred across the Northern Hemisphere in the summer of 2018 were considered very unusual and were unprecedented given the total area that was concurrently affected(Drouardet al. , 2019; Kornhuberet al. , 2019; Toretiet al. , 2019; Vogelet al. , 2019); however, the probability of this event under 1°C global warming was found to be about 16% (Vogel et al., 2019), which is not particularly low. Similarly, the 2013 summer temperature over eastern China was the hottest on record at the time, but it had an estimated recurrence interval of about four years in the climate of 2013 (Sun et al., 2014). Furthermore, when other aspects of the risk, vulnerability, and exposure are historically high or have recently increased (see WGII, Chapter 16, Section 16.4), relatively moderate extremes can have very high impacts (Otto et al., 2015b; Philip et al., 2018b). As warming continues, the climate moves further away from its historical state we are familiar with, resulting in an increased likelihood of unprecedented events and surprises. This is particularly the case under high global warming levels – for example, the climate of the late 21st century under high-emissions scenarios, above 4°C of global warming (Cross-Chapter Box 11.1).
Another factor highlighted in Section 11.8 and Box 11.4 making events high-impact and difficult to anticipate is that several locations under moderate warming levels could be affected simultaneously, or very repeatedly by different types of extremes (Mora et al., 2018; Gaupp et al., 2019; Vogel et al., 2019). Box 11.4 shows that concurrent events at different locations, which can lead to major impacts across the world, can also result from the combination of anomalous circulation or natural variability (e.g., El Niño–Southern Oscillation) patterns with amplification of resulting responses to human-induced global warming. Also multivariate extremes at single locations pose specific challenges to anticipation (Section 11.8), with low likelihoods in the current climate but the probability of occurrence of such compound events strongly increasing with increasing global warming levels (Vogel et al., 2020a). Therefore, in order to estimate whether, and at what level of global warming, very high impacts arising from extremes would occur, the spatial extent of extremes and the potential of compounding extremes need to be assessed. Sections 11.3, 11.4, 11.7 and 11.8 highlight increasing evidence that temperature extremes, higher intensity precipitation accompanying tropical cyclones, and compound events such as dry/hot conditions conducive to wildfire or storm surges resulting from sea level rise and heavy precipitation events, pose widespread threats to societies already at relatively low warming levels. Studies have already shown that the probability for some recent extreme events is so small in the undisturbed world that these events were extremely unlikely to occur without human influence (Section 11.2.4). Box 11.2, Table 1, provides examples of projected changes in LLHI extremes (single extremes, compound events) of potential relevance for impact and adaptation assessments showing that today’s very rare events can become commonplace in a warmer future.
Box 11.2, Table 1 | Examples of changes in low-likelihood, high-impact extreme conditions (single extremes, compound events) at different global warming levels.
+1°C (Present-day) | +1.5°C | +2°C | +3°C and Higher | |
Risk ratio for annual hottest daytime temperature (TXx) with 1% of probability under present-day warming (+1°C) (Kharin et al., 2018): Global land | 1 | 3.3 (i.e., 230% higher probability) | 8.2 (i.e., 720% higher probability) | Not assessed |
Risk ratio for heavy precipitation events (Rx1day) with 1% of probability under present-day warming (+1°C) (Kharin et al., 2018): Global land | 1 | 1.2 (i.e., 20% higher probability) | 1.5 (i.e., 50% higher probability) | Not assessed |
Number of 1–5 day duration extreme floods with 1% of probability under present-day warming (+1°C) (H. Ali et al., 2019) Indian subcontinent | Up to 3 in individual locations | Up to 5 in individual locations | 2–6 in most locations | Up to 12 in individual locations (4°C) |
Probability of ‘extreme extremes’ hot days with 1/1000 probability at the end of the 20th century (Vogel et al., 2020a): Global land | About 20 days over 20 years in most locations | About 50 days in 20 years in most locations | About 150 days in 20 years in most locations | About 500 days in 20 years in most locations (3°C) |
Probability of co-occurrence in the same week of hot days with 1/1000 probability and dry days with 1/1000 probability at the end of the 20th century (Vogel et al., 2020a): Amazon | 0% probability | About one week in 20 years | About 4 to 5 weeks in 20 years | More than 9 weeks in 20 years (3°C) |
Projected soil moisture drought duration per year (Samaniego et al., 2018): Mediterranean region | 41 days (+46% compared to the late 20th century) | 58 days (+107% compared to the late 20th century) | 71 days (+154% compared to the late 20th century) | 125 days (+346% compared to the late 20th century) (3°C) |
Increase in days exposed to dangerous extreme heat – measured in Health Heat Index (HHI) (Q. Sun et al., 2019) global land | Not assessed, baseline is 1981–2000 | 1.6 times higher risk of experiencing heat >40.6 | 2.3 times higher risk of experiencing heat >40.6 | Around 80% of land area exposed to dangerous heat, tropical regions 1/3 of the year (4°C) |
Increase in regional mean fire season length (Q. Sun et al., 2019; Xu et al., 2020) global land | Not assessed, baseline is 1981–2000 | 6.2 days | 9.5 days | About 50 days (4°C) |
In summary, the future occurrence of LLHI events linked to climate extremes is generally associated with low confidence, but cannot be excluded, especially at global warming levels above 4°C. Compound events, including concurrent extremes, are a factor increasing the probability of LLHI events (high confidence). With increasing global warming, some compound events with low likelihood in past and current climate will become more frequent, and there is a higher chance of historically unprecedented events and surprises (high confidence). However, even extreme events that do not have a particularly low probability in the present climate (at more than 1°C of global warming) can be perceived as surprises because of the pace of global warming (high confidence).
11.2 Data and Methods
This section provides an assessment of observational data and methods used in the analysis and attribution of climate change specific to weather and climate extremes. It also introduces some concepts used in presenting future projections of extremes. Later sections (Sections 11.3–11.8) also provide additional assessments on relevant observational datasets and model validation specific to the type of extremes to be assessed. General background on climate modelling is provided in Chapters 4 and 10.
11.2.1 Definition of Extremes
In the literature, an event is generally considered extreme if the value of a variable exceeds (or lies below) a threshold. The thresholds have been defined in different ways, leading to differences in the meaning of extremes that may share the same name. For example, two sets of metrics for the frequency of hot/warm days have been used in the literature. One set counts the number of days when maximum daily temperature is above a relative threshold defined as the 90th or higher percentile of maximum daily temperature for the calendar day over a base period. An event based on such a definition can occur at any time of the year, and the impact of such an event would differ depending on the season. The other set counts the number of days in which maximum daily temperature is above an absolute threshold such as 35°C, because exceeding this temperature can sometimes cause health impacts (however, these impacts may depend on location and whether ecosystems and the population are adapted to such temperatures). While both types of hot extreme indices have been used to analyse changes in the frequency of hot/warm events, they represent different events that occur at different times of the year, possibly affected by different types of processes and mechanisms, and possibly also associated with different impacts.
Changes in extremes have also been examined from two perspectives: changes in the frequency for a given magnitude of extremes; or changes in the magnitude for a particular return period (frequency). Changes in the probability of extremes (e.g., temperature extremes) depend on the rarity of the extreme event that is assessed, with a larger change in probability associated with a rarer event (e.g., Kharin et al., 2018). However, changes in the magnitude represented by the return levels of the extreme events may not be as sensitive to the rarity of the event. While the answers to the two different questions are related, their relevance may differ for distinct audiences. Conclusions regarding the respective contribution of greenhouse gas forcing to changes in magnitude versus frequency of extremes may also differ (Otto et al., 2012). Correspondingly, the sensitivity of changes in extremes to increasing global warming is also dependent on the definition of the considered extremes. In the case of temperature extremes, changes in magnitude have been shown to often depend linearly on global surface temperature (Seneviratne et al., 2016; Wartenburger et al., 2017), while changes in frequency tend to be nonlinear and can, for example, be exponential for increasing global warming levels (Fischer and Knutti, 2015; Kharin et al., 2018). When similar damage occurs once a fixed threshold is exceeded, it is more important to ask a question regarding changes in the frequency. But when the exceedance of this fixed threshold becomes a normal occurrence in the future, this can lead to a saturation in the change of probability (Harrington and Otto, 2018a). Also, if the impact of an event increases with the intensity of the event, it would be more relevant to examine changes in the magnitude. Finally, adaptation to climate change might change the relevant thresholds over time, although such aspects are still rarely integrated in the assessment of projected changes in extremes. Framing is considered when forming the assessments of this Chapter, including how extremes are defined and how the questions are asked in the literature .
11.2.2 Data
Studies of past and future changes in weather and climate extremes, and in the mean state of the climate, use the same original sources of weather and climate observations, including in situ observations, remotely sensed data, and derived data products such as reanalyses. Sections 2.3 and 10.2 assess various aspects of these data sources and data products from the perspective of their general use, and in the analysis of changes in the mean state of the climate in particular. Building on these previous chapters, this subsection highlights particular aspects that are related to extremes and are most relevant to the assessment of this Chapter. The SREX (Chapter 3, Seneviratne et al., 2012) and AR5 (Chapter 2, Hartmann et al., 2013) addressed critical issues regarding the quality and availability of observed data and their relevance for the assessment of changes in extremes.
Extreme weather and climate events occur on time scales of hours (e.g., convective storms that produce heavy precipitation) to days (e.g., tropical cyclones, heatwaves), to seasons and years (e.g., droughts). A robust determination of long-term changes in these events can have different requirements for the spatial and temporal scales and sample size of the data. In general, it is more difficult to determine long-term changes for events of fairly large temporal duration, such as ‘megadroughts’ that last several years or longer (e.g., Ault et al., 2014), because of the limitations of the observational sample size. Literature that studies changes in extreme precipitation and temperature often uses indices representing specifics of extremes that are derived from daily precipitation and temperature values. Station-based indices would have the same issues as those for the mean climate regarding the quality, availability, and homogeneity of the data. For the purpose of constructing regional information and/or for comparison with model outputs, such as model evaluation, and detection and attribution, these station-based indices are often interpolated onto regular grids. Two different approaches, involving two different orders of operation, have been used in producing such gridded datasets.
In some cases, such as for the HadEX3 dataset (Dunn et al., 2020), indices of extremes are computed using time series directly derived from stations first, and are then gridded over the space. As the indices are computed at the station level, the gridded data products represent point estimates of the indices averaged over the spatial scale of the grid box. In other instances, daily values of station observations are first gridded (e.g., Contractor et al., 2020a), and the interpolated values can then be used to compute various indices. Depending on the station density, values for extremes computed from data gridded this way represent extremes of spatial scales anywhere from the size of the grid box to a point. In regions with high station density (e.g., North America, Europe), the gridded values are closer to extremes of area means and are thus more appropriate for comparisons with extremes estimated from climate model output, which is often considered to represent areal means (Chen and Knutson, 2008; Gervais et al., 2014; Avila et al., 2015; Di Luca et al., 2020b). In regions with very limited station density (e.g., Africa), the gridded values are closer to point estimates of extremes. The difference in spatial scales among observational data products and model simulations needs to be carefully accounted for when interpreting the comparison among different data products. For example, the average annual maximum daily maximum temperature (TXx) over land computed from the original ERA-Interim reanalysis (at 0.75° resolution) is about 0.4°C warmer than that computed when the ERA-Interim dataset is upscaled to the resolution of 2.5° × 3.75° (Di Luca et al., 2020).
Extreme indices computed from various reanalysis data products have been used in some studies, but reanalysis extreme statistics have not been rigorously compared to observations (Donat et al., 2016a).
In general, changes in temperature extremes from various reanalyses were most consistent with gridded observations after about 1980, but larger differences were found during the pre-satellite era (Donat et al., 2014b). Overall, lower agreement across reanalysis datasets was found for extreme precipitation changes, although temporal and spatial correlations against observations were found to be still significant. In regions with sparse observations (e.g., Africa and parts of South America), there is generally less agreement for extreme precipitation between different reanalysis products, indicating a consequence of the lack of an observational constraint in these regions (Donat et al., 2014b, 2016a). More recent reanalyses, such as ERA5 (Hersbach et al., 2020), seem to have improved over previous products, at least over some regions (e.g., Mahto and Mishra, 2019; Gleixner et al., 2020; Sheridan et al., 2020). Caution is needed when reanalysis data products are used to provide additional information about past changes in these extremes in regions where observations are generally lacking.
Satellite remote sensing data have been used to provide information about precipitation extremes because several products provide data at sub-daily resolution for precipitation, for example, Tropical Rainfall Measuring Mission (TRMM; Maggioni et al., 2016) and clouds, for example, Himawari (Bessho et al., 2016; Chen et al., 2019). However, satellites do not observe the primary atmospheric state variables directly and polar orbiting satellites do not observe any given place at all times. Hence, their utility as a substitute for high-frequency (i.e., daily) ground-based observations is limited. For instance, Timmermans et al. (2019) found little relationship between the timing of extreme daily and five-day precipitation in satellite and gridded station data products over the USA.
Box 11.3 | Extremes in Paleoclimate Archives Compared to Instrumental Records
Examining extremes in pre-instrumental information can help to put events occurring in the instrumental record (referred to as ‘observed’) in a longer-term context. This box focuses on extremes in the Common Era (CE, the last 2000 years), because there is generally higher confidence in pre-instrumental information gathered from the more recent archives from the Common Era than from earlier evidence. It addresses evidence of extreme events in paleoreconstructions, documentary evidence (such as grape harvest data, religious documents, newspapers, and logbooks) and model-based analyses, and whether observed extremes have or have not been exceeded in the Common Era. This box provides overviews of: (i) AR5 assessments; (ii) types of evidence assessed here; evidence of: (iii) droughts; (iv) temperature extremes; (v) paleofloods; and (vi) paleotempests; and (vii) a summary.
(Chapter 5 of AR5 (Masson-Delmotte et al., 2013) concluded with high confidence that droughts of greater magnitude and of longer duration than those observed in the instrumental period occurred in many regions during the preceding millennium. There was high confidence in evidence that floods during the past five centuries in northern and Central Europe, the western Mediterranean region, and eastern Asia were of a greater magnitude than those observed instrumentally, and medium confidence in evidence that floods in the Near East, India and Central North America were comparable to modern observed floods. While AR5 assessed 20th century summer temperatures compared to those reconstructed in the Common Era, it did not assess shorter duration temperature extremes.
Many factors affect confidence in information on pre-instrumental extremes. First, the geographical coverage of paleoclimate reconstructions of extremes is not spatially uniform (Smerdon and Pollack, 2016) and depends on both the availability of archives and records, which are environmentally dependent, and also the differing attention and focus from the scientific community. In Australia, for example, the paleoclimate network is sparser than for other regions, such as Asia, Europe and North America, and synthesized products rely on remote proxies and assumptions about the spatial coherence of precipitation between remote climates (Cook et al., 2016c; Freund et al., 2017). Second, pre-instrumental evidence of extremes may be focused on understanding archetypal extreme events, such as the climatic consequences of the 1815 eruption of Mount Tambora, Indonesia (Veale and Endfield, 2016). These studies provide narrow evidence of extremes in response to specific forcings (M. Li et al., 2017) for specific epochs. Third, natural archives may provide information about extremes in one season only and may not represent all extremes of the same types.
Evidence of shorter duration extreme event types, such as floods and tropical storms, is further restricted by the comparatively low chronological controls and temporal resolution (e.g., monthly, seasonal, yearly, multiple years) of most archives compared to the events (e.g., minutes to days). Natural archives may be sensitive only to intense environmental disturbances, and so only sporadically record short-duration or small spatial-scale extremes. Interpreting sedimentary records as evidence of past short-duration extremes is also complex and requires a clear understanding of natural processes (Wilhelm et al. , 2019). For example, paleoflood reconstructions of flood recurrence and intensity produced from geological evidence (e.g., river and lake sediments), speleothems (Denniston and Luetscher, 2017), botanical evidence (e.g., flood damage to trees, or tree ring reconstructions), and floral and faunal evidence (e.g., diatom fossil assemblages) require understanding of sediment sources and flood mechanisms. Pre-instrumental records of tropical storm intensity and frequency (also called paleotempest records) derived from overwash deposits of coastal lake and marsh sediments are difficult to interpret. Many factors have an impact on whether disturbances are deposited in archives (Muller et al., 2017) and deposits may provide sporadic and incomplete preservation histories (e.g., Tamura et al., 2018).
Overall, the most complete pre-instrumental evidence of extremes occurs for long-duration, large spatial-scale extremes, such as for multi-year meteorological droughts or seasonal- and regional-scale temperature extremes. Additionally, more precise insights into recent extremes emerge where multiple studies have been undertaken, compared to the confidence in extremes reported at single sites or in single studies, which may not necessarily be representative of large-scale changes, or for reconstructions that synthesize multiple proxies over large areas (e.g., drought atlases). Multiproxy synthesis products combine paleoclimate temperature reconstructions and cover sub-continental- to hemispheric-scale regions to provide continuous records of the Common Era(e.g., Ahmedet al. , 2013; Neukomet al. , 2014 for temperature).
There is high confidence in the occurrence of long-duration and severe drought events during the Common Era for many locations, although their severity compared to recent drought events differs between locations and the lengths of reconstruction provided. Recent observed drought extremes in some regions – such as the eastern Mediterranean Levant (Cook et al., 2016a), California in the USA(Cook et al., 2014b; Griffin and Anchukaitis, 2014), and in the Andes (Garreaud et al. , 2017; Domínguez-Castro et al. , 2018) – do not have precedents within the multi-century periods reconstructed in these studies, in terms of duration and/or severity. In some regions (in south-western North America(Asmerom et al., 2013; Cook et al., 2015), the Great Plains region (Cook et al., 2004), the Middle East (Kaniewski et al., 2012), and China (Gou et al., 2015)), recent drought extremes may have been exceeded in the Common Era. In further locations, there is conflicting evidence for the severity of pre-instrumental droughts compared to observed extremes, depending on the length of the reconstruction and the seasonal perspective provided(see Cooket al. , 2016c; Freundet al. , 2017 for Australia). There can also be differing conclusions for the severity, or even the occurrence, of specific individual pre-instrumental droughts when different evidence is compared (e.g., Wetter et al., 2014; Büntgen et al., 2015).
There is medium confidence that the magnitudes of large-scale, seasonal-scale extreme high temperatures in observed records exceed those reconstructed over the Common Era in some locations, such as Central Europe. In one example, multiple studies have examined the unusualness of present-day European summer temperature records in a long-term context, particularly in comparison to the exceptionally warm year of 1540 CE in Central Europe. Several studies indicate that recent extreme summers (2003 and 2010) in Europe have been unusually warm in the context of the last 500 years (Barriopedro et al., 2011; Wetter and Pfister, 2013; Wetter et al., 2014; Orth et al., 2016b), or longer (Luterbacher et al., 2016). Others studies show that summer temperatures in Central Europe in 1540 were warmer than the present-day (1966–2015) mean, but note that it is difficult to assess whether or not the 1540 summer was warmer than observed record extreme temperatures (Orth et al., 2016b).
There is high confidence that the magnitude of floods over the Common Era exceeded observed records in some locations, including Central Europe and eastern Asia. Recent literature supports the AR5 assessments of floods (Masson-Delmotte et al., 2013). For example, high temporally resolved records provide evidence of Common Era floods exceeding the probable maximum flood levels in the Upper Colorado River, USA (Greenbaum et al., 2014) and peak discharges that are double gauge levels along the middle Yellow River, China (Liu et al., 2014). Further studies demonstrate pre-instrumental or early instrumental differences in flood frequency compared to the instrumental period, including reconstructions of high and low flood frequency in the European Alps (e.g., Swierczynski et al., 2013; Amann et al., 2015) and Himalayas (Ballesteros Cánovas et al., 2017). The combination of extreme historical flood episodes determined from documentary evidence also increases confidence in the determination of flood frequency and magnitude, compared to using geomorphological archives alone (Kjeldsen et al., 2014). In regions, such as Europe and China, that have rich historical flood documents, there is strong evidence of high-magnitude flood events over pre-instrumental periods (Kjeldsen et al., 2014; Benito et al., 2015; Macdonald and Sangster, 2017). A key feature of paleoflood records is variability in flood recurrence at centennial timescales (Wilhelm et al., 2019), although constraining climate-flood relationships remains challenging. Pre-instrumental floods often occurred in considerably different contexts in terms of land use, irrigation, and infrastructure, and may not provide direct insight into modern river systems, which further prevents long-term assessments of flood changes being made based on these sources.
There is medium confidence that periods of both more and less tropical cyclone activity (frequency or intensity) than observed occurred over the Common Era in many regions. Paleotempest studies cover a limited number of locations that are predominantly coastal, and hence provide information on specific locations that cannot be extrapolated basin-wide (see Muller et al., 2017). In some locations, such as the Gulf of Mexico and the New England, USA, coast, similarly intense storms to those observed recently have occurred multiple times over centennial timescales (Donnelly et al., 2001; Bregy et al., 2018). Further research focused on the frequency of tropical storm activity. Extreme storms occurred considerably more frequently in particular periods of the Common Era, compared to the instrumental period in north-east Queensland, Australia (Nott et al., 2009; Haig et al., 2014), and the Gulf Coast (e.g., Brandon et al., 2013; Lin et al., 2014).
The probability of finding an unprecedented extreme event increases with a longer length of past record-keeping, in the absence of longer-term trends. Thus, as a record is extended to the past based on paleoreconstruction, there is a higher chance of very rare extreme events having occurred at some time prior to instrumental records. Such an occurrence is not, in itself, evidence of a change, or lack of a change, in the magnitude or the likelihood of extremes in the past or in the instrumental period at regional and local scales. Yet, the systematic collection of paleoclimate records over wide areas may provide evidence of changes in extremes. In one study, extended evidence of the last millennium from observational data and paleoclimate reconstructions using tree rings indicates that human activities affected the worldwide occurrence of droughts as early as the beginning of the 20th century (Marvel et al., 2019).
In summary, there is low confidence in overall changes in extremes derived from paleo-archives. There is high confidence that long-duration and severe drought events occurred at many locations during the last 2000 years. There is also high confidence that high-magnitude flood events occurred at some locations during the last 2000 years, but overall changes in infrastructure and human water management make the comparison with present-day records difficult. But these isolated paleo-drought and paleo-flood events are not evidence of a change, or lack of a change, in the magnitude or the likelihood of relevant extremes.
11.2.3 Attribution of Extremes
Attribution science concerns the identification of causes for changes in characteristics of the climate system (e.g., trends, single extreme events). A general overview and summary of methods of attribution science is provided in the Cross-Working Group Box 1.1. Trend detection using optimal fingerprinting methods is a well-established field, and has been assessed in AR5 (Chapter 10, Bindoff et al., 2013), and Section 3.2.1 of this Report. There are specific challenges when applying optimal fingerprinting to the detection and attribution of trends in extremes and on regional scales where the lower signal-to-noise ratio is a challenge. In particular, the method generally requires the data to follow a Normal (Gaussian) distribution, which is often not the case for extremes. However, recent studies showed that extremes can be transformed to a Gaussian distribution, for example, by averaging over space, so that optimal fingerprinting techniques can still be used (Wen et al., 2013; Zhang et al., 2013; Wan et al., 2019). Non-stationary extreme value distributions, which allow for the detailed detection and attribution of regional trends in temperature extremes, have also been used (Z. Wang et al., 2017a).
Apart from the detection and attribution of trends in extremes, new approaches have been developed to answer the question of whether, and to what extent, external drivers have altered the probability and intensity of an individual extreme event (NASEM, 2016). In AR5, there was an emerging consensus that the role of external drivers of climate change in specific extreme weather events could be estimated and quantified in principle, but related assessments were still confined to particular case studies, often using a single model, and typically focusing on high-impact events with a clear attributable signal.
However, since AR5, the attribution of extreme weather events has emerged as a growing field of climate research with an increasing body of literature (see series of supplements to the annual State of the Climate report (Peterson et al., 2012, 2013a; Herring et al., 2014, 2015, 2016, 2018), including the number of approaches to examining extreme events(described in Easterling et al., 2016; Otto, 2017; Stott et al., 2016)). A commonly used approach – often called the risk-based approach in the literature, and referred to here as the ‘probability-based approach’ – produces statements such as ‘anthropogenic climate change made this event type twice as likely ’ or ‘anthropogenic climate change made this event 15% more intense’. This is done by estimating probability distributions of the index characterizing the event in today’s climate, as well as in a counterfactual climate, and either comparing intensities for a given occurrence probability (e.g., 1-in-100-year event) or probabilities for a given magnitude (see FAQ 11.3). There are a number of different analytical methods encompassed in the probability-based approach, building on observations and statistical analyses (e.g., van Oldenborgh et al., 2012), optimal fingerprint methods (Sun et al., 2014), regional climate and weather forecast models (e.g., Schaller et al., 2016), global climate models (GCMs) (e.g., Lewis and Karoly, 2013), and large ensembles of atmosphere-only GCMs (e.g., Lott et al., 2013). A key component in any event attribution analysis is the level of conditioning on the state of the climate system. In the least conditional approach, the combined effect of the overall warming and changes in the large-scale atmospheric circulation are considered and often utilize fully coupled climate models (Sun et al., 2014). Other more conditional approaches involve prescribing certain aspects of the climate system. These range from prescribing the pattern of the surface ocean change at the time of the event (e.g., Hoerling et al., 2013, 2014), often using Atmospheric Model Intercomparison Project (AMIP) style global models, where the choice of sea surface temperature and ice patterns influences the attribution results (Sparrow et al., 2018), to prescribing the large-scale circulation of the atmosphere and using weather forecasting models or methods (e.g., Pall et al., 2017; Patricola and Wehner, 2018; Wehner et al., 2018a). These highly conditional approaches have also been called ‘storylines’ (Cross-Working Group Box 1.1; Shepherd, 2016) and can be useful when applied to extreme events that are too rare to otherwise analyse, or where the specific atmospheric conditions were central to the impact. These methods are also used to enable the use of very high-resolution simulations in cases were lower-resolution models do not simulate the regional atmospheric dynamics well (Shepherd, 2016; Shepherd et al., 2018). However, the imposed conditions limit an overall assessment of the anthropogenic influence on an event, as the fixed aspects of the analysis may also have been affected by climate change. For instance, the specified initial conditions in the highly conditional hindcast attribution approach often applied to tropical cyclones (e.g., Takayabu et al., 2015; Patricola and Wehner, 2018) permit only a conditional statement about the magnitude of the storm if similar large-scale meteorological patterns could have occurred in a world without climate change, thus precluding any attribution statement about the change in frequency if used in isolation. Combining conditional assessments of changes in the intensity with a multi-model approach does allow for the latter as well (Shepherd, 2016).
The outcome of event attribution is dependent on the definition of the event (Leach et al., 2020), as well as the framing (Otto et al., 2016; Christidis et al., 2018; Jézéquel et al., 2018) and uncertainties in observations and modelling. Observational uncertainties arise in estimating the magnitude of an event as well as its rarity (Angélil et al., 2017). Results of attribution studies can also be very sensitive to the choice of climate variables (Sippel and Otto, 2014; Wehner et al., 2016). Attribution statements are also dependent on the spatial (Uhe et al., 2016; Cattiaux and Ribes, 2018; Kirchmeier‐Young et al., 2019) and temporal (Harrington, 2017; Leach et al., 2020) extent of event definitions, as events of different scales involve different processes (W. Zhang et al., 2020) and large-scale averages generally yield higher attributable changes in magnitude or probability due to the smoothing out of noise. In general, confidence in attribution statements for large-scale heat and lengthy extreme precipitation events have higher confidence than shorter and more localized events, such as extreme storms, an aspect also relevant for determining the emergence of signals in extremes or the confidence in projections (see also Cross-Chapter Box Atlas.1).
The reliability of the representation of the event in question in the climate models used in a study is essential (Angélil et al., 2016; Herger et al., 2018). Extreme events characterized by atmospheric dynamics that stretch the capabilities of current-generation models (Section 10.3.3.4; Shepherd, 2014; Woollings et al., 2018) limit the applicability of the probability-based approach of event attribution. The lack of model evaluation, in particular in early event attribution studies, has led to criticism of the emerging field of attribution science as a whole (Trenberth et al., 2015) and of individual studies (Angélil et al., 2017). In this regard, the storyline approach (Shepherd, 2016) provides an alternative option that does not depend on the model’s ability to represent the circulation reliably. In addition, several ways of quantifying statistical uncertainty (Paciorek et al., 2018) and model evaluation (Lott and Stott, 2016; Philip et al., 2018b, 2020) have been employed to evaluate the robustness of event attribution results. For the unconditional probability-based approach, multi-model and multi-approach (e.g., combining observational analyses and model experiments) methods have been used to improve the robustness of event attribution (Hauser et al., 2017; Otto et al., 2018a; Philip et al., 2018b, 2019, 2020; van Oldenborgh et al., 2018; Kew et al., 2019).
In the regional tables provided in Section 11.9, the different lines of evidence from event attribution studies and trend attributions are assessed alongside one another to provide an assessment of the human contribution to observed changes in extremes in all AR6 regions.
11.2.4 Projecting Changes in Extremes as a Function of Global Warming Levels
The most important quantity used to characterize past and future climate change is global warming relative to its pre-industrial level. Changes in global warming are linked quasi-linearly to global cumulative carbon dioxide (CO2) emissions (IPCC, 2013), and for their part, changes in regional climate, including many types of extremes, scale quasi-linearly with changes in global warming, often independently of the underlying emissions scenarios (SR1.5 Chapter 3; Seneviratne et al., 2016; Matthews et al., 2017; Wartenburger et al., 2017; Kharin et al., 2018; Y. Sun et al., 2018a; Tebaldi and Knutti, 2018; Beusch et al., 2020; Li et al., 2021). In addition, the use of global warming levels in the context of global policy documents – in particular the 2015 Paris Agreement (UNFCCC, 2016) implies that information on changes in the climate system, and specifically extremes, as a function of global warming are of particular policy relevance. Cross-Chapter Box 11.1 provides an overview on the translation between information at global warming levels (GWLs) and scenarios.
The assessment of projections of future changes in extremes as function of GWL has an advantage in separating uncertainty associated with the global warming response (see Chapter 4) from the uncertainty resulting from the regional climate response as a function of GWLs (Seneviratne and Hauser, 2020). If the interest is in the projection of regional changes at certain GWLs, such as those defined by the Paris Agreement, projections based on time periods and emissions scenarios have unnecessarily larger uncertainty due to differences in model global transient climate responses. To take advantage of this feature and to provide easy comparison with SR1.5, assessments of projected changes in this chapter are largely provided in relation to future GWLs, with a focus on changes at +1.5°C, +2°C, and +4°C of global warming above pre-industrial levels (e.g., Tables 11.1 and 11.2 and regional tables in Section 11.9). These encompass a scenario compatible with the lowest limit of the Paris Agreement (+1.5°C), a scenario slightly overshooting the aims of the Paris Agreement (+2°C), and a ‘worst-case’ scenario with no mitigation (+4°C). Cross-Chapter Box 11.1 provides a background on the GWL sampling approach used in AR6, for the computation of GWL projections from climate models contributing to Phase 6 of the Coupled Model Intercomparison Project (CMIP6) as well as for the mapping of existing scenario-based literature for CMIP6 and the CMIP Phase 5 (CMIP5) to assessments as function of GWLs (see also Section 11.9. and Table 11.3 for an example).
While regional changes in many types of extremes do scale robustly with global surface temperature, generally irrespective of emissions scenarios (Section 11.1.4, Figures 11.3, 11.6 and 11.7 and Cross-Chapter Box 11.1), effects of local forcing can distort this relation. For example, emissions scenarios with the same radiative forcing can have different regional extreme precipitation responses resulting from different aerosol forcing (Z. Wang et al., 2017b). Another example is related to forcing from land-use and land cover changes (Section 11.1.6). Climate models often either overestimate or underestimate observed changes in annual maximum daily maximum temperature, depending on the region and considered models (Donat et al., 2017; Vautard et al., 2020). Part of the discrepancies may be due to the lack of representation of some land forcings, in particular crop intensification and irrigation (N.D. Mueller et al., 2016; Findell et al., 2017; Thiery et al., 2017, 2020). Since these local forcings are not represented, and their future changes are difficult to project, these can be important caveats when using GWL scaling to project future changes for these regions. However, these caveats also apply to the use of scenario-based projections.
The SR1.5 (Chapter 3) assessed different climate responses at +1.5°C of global warming, including transient climate responses, short-term stabilization responses, and long-term equilibrium stabilization responses, and their implications for future projections of different extremes. Indeed, the temporal dimension – that is, when the given GWL occurs – also matters for projections, in particular beyond the 21st century, and for some climate variables related to components of the climate system associated with large inertia (e.g., sea level rise and associated extremes). Nonetheless, for assessments focused on conditions within the next decades, and for the main extremes considered in this chapter, derived projections are relatively insensitive to details of climate scenarios and can be well-estimated based on transient simulations (Cross-Chapter Box 11.1; see also SR1.5).
An important question is the identification of the GWL at which a given change in a climate extreme can begin to emerge from climate noise. Figure 11.8 displays analyses of the GWLs at which emergence in hot extremes – annual maximum daily temperature represented by TXx and heavy precipitation represented by Rx1day is identified in AR6 regions for the whole CMIP5 and CMIP6 ensembles. Overall, signals for extremes emerge very early for TXx, already below 0.2°C in many regions (Figure 11.8a,b), and at around 0.5°C in most regions. This is consistent with conclusions from the SR1.5 (Chapter 3 for less-rare temperature extremes (TXx on the yearly time scale), which shows that a difference as small as 0.5°C of global warming – for example, between +1.5°C and +2°C of global warming – leads to detectable differences in temperature extremes in TXx in most WGI AR6 regions in CMIP5 projections (e.g., Wartenburger et al., 2017; Seneviratne et al., 2018b). The GWL emergence for Rx1day is also largely consistent with analyses for less-extreme heavy precipitation events (Rx5day on the yearly time scale) in SR1.5 (see Chapter 3).
 Figure 11.8 | Global and regional-scale emergence of changes in temperature (a) and precipitation (b) extremes for the globe (glob.), global oceans (oc.), global lands (land), and the AR6 regions. Colours indicate the multi-model mean global warming level at which the difference in 20-year means of the annual maximum daily maximum temperature (TXx) and the annual maximum daily precipitation (Rx1day) become significantly different from their respective mean values during the 1850–1900 base period. Results are based on simulations from the Coupled Model Intercomparison Project Phases 5 and 6 (CMIP5 and CMIP6) multi-model ensembles. See Atlas.1.3.2 for the definition of regions. Adapted from Seneviratne and Hauser (2020) under the terms of the Creative Commons Attribution licence.
 To some extent, analyses as functions of GWLs replace the time axis with a global surface temperature axis. Nonetheless, information on the timing of given changes in extremes is obviously also relevant. (For information on the time frame at which given GWLs are reached, see Cross-Chapter Box 11.1 and Section 4.6). Figure 11.5 provides a synthesis of attributed and projected changes in extremes as function of GWLs (see also Figures. 11.3, 11.6 and 11.7 for regional analyses).
Cross-Chapter Box 11.1 | Translating Between Regional Information at Global Warming Levels Versus Scenarios for End Users
Contributors: Erich Fischer (Switzerland), Mathias Hauser (Switzerland), Sonia I. Seneviratne (Switzerland), Richard Betts (United Kingdom), José M. Gutiérrez (Spain), Richard G. Jones (United Kingdom), June-Yi Lee (Republic of Korea), Malte Meinshausen (Australia/Germany), Friederike Otto (United Kingdom/Germany), Izidine Pinto (Mozambique), Roshanka Ranasinghe (The Netherlands/Sri Lanka/Australia), Joeri Rogelj (Germany/Belgium), Bjørn Samset (Norway), Claudia Tebaldi (United States of America), Laurent Terray (France)
Background
Traditionally, projections of climate variables are summarized and communicated as function of time and emissions scenarios. Recently, quantifying global and regional climate at specific global warming levels (GWLs) has become widespread, motivated by the inclusion of explicit GWLs in the long-term temperature goal of the Paris Agreement (Section 1.6.2). GWLs, expressed as changes in global surface temperature relative to the 1850–1900 period (see Cross-Chapter Box 2.3), are used in SR1.5 and in the assessment of Reasons for Concerns in the WGII reports (see also Cross-Chapter Box 12.1). Cross-Chapter Box 11.1, Figure 1 illustrates how the assessment of the climate response at GWLs relates to the uncertainty in scenarios regarding the timing of the respective GWLs, as well as to the uncertainty in the associated regional climate responses, including extremes and other climatic impact-drivers (CIDs). For many (but not all) climate variables and CIDs, the response pattern for a given GWL is consistent across different scenarios (Chapters 1, 4, 9, 11 and Atlas). GWLs are defined as long-term means (e.g., 20-year averages) compared to the pre-industrial period, are commonly used in the literature, and were also underlying main assessments of SR1.5 (Chapter 3).

Cross-Chapter Box 11.1, Figure 1 | Schematic representation of relationship between emissions scenarios, global warming levels (GWLs), regional climate responses, and impacts. The illustration shows the implied uncertainty problem associated with differentiating between 1.5°C, 2°C, and other GWLs. Focusing on GWLs raises questions associated with emissions pathways to get to these temperatures (scenarios), as well as regional climate responses and the associated impacts at the corresponding GWL (the impacts question). Adapted from James et al. (2017) and Rogelj (2013) under the terms of the Creative Commons Attribution licence.
Numerous studies have compared the regional response to anthropogenic forcing at GWLs in annual and seasonal mean values and extremes of different climate and impact variables across different multi-model ensembles and/or different scenarios (e.g., Frieleret al. , 2012; Scheweet al. , 2014; Hergeret al. , 2015; Schleussneret al. , 2016; Seneviratneet al. , 2016; Wartenburgeret al. , 2017; Bettset al. , 2018; Dosio and Fischer, 2018; Samset et al. , 2019; Tebaldiet al. , 2020; see Sections 4.6.1, 8.5.3, 9.3.1, 9.5, 9.6.3, 10.4.3 and 11.2.4 for further details). The regional response patterns at given GWLs have been found to be consistent across different scenarios for many climate variables (Cross-Chapter Box 11.1 Figure 2; Pendergrasset al. , 2015; Seneviratneet al. , 2016; Wartenburgeret al. , 2017; Seneviratne and Hauser, 2020). The consistency tends to be higher for temperature-related variables than for variables in the hydrological cycle or variables characterizing atmospheric dynamics, and for intermediate to high-emissions scenarios than for low-emissions scenarios (e.g., for mean precipitation in the Representative Concentration Pathway (RCP) 2.6 scenario: Pendergrass et al., 2015; Wartenburger et al., 2017). Nonetheless, Cross-Chapter Box 11.1 Figure 2 illustrates that, even for mean precipitation, which is known to be forcing dependent (Sections 4.6.1 and 8.5.3), scenario differences in the response pattern at a given GWL are smaller than model uncertainty and internal variability in many regions (Herger et al., 2015). The response pattern is further found to be broadly consistent between models that reach a GWL relatively early, and those that reach it later under a given Shared Socio-economic Pathway (SSP; see Cross-Chapter Box 11.1, Figure 2g,h).

Cross-Chapter Box 11.1, Figure 2 | (a–c) Coupled Model Intercomparison Project Phase 6 (CMIP6) multi-model mean precipitation change at 2°C global warming level (GWL) (20-year mean) in three different Shared Socio-economic Pathway (SSP) scenarios relative to 1850–1900. All models reaching the corresponding GWL in the corresponding scenario are averaged. The number of models averaged across is shown at the top right of the panel. The maps for the other two SSP scenarios SSP1-1.9 (five models only) and SSP3-7.0 (not shown) are consistent. (d–f) Same as (a–c) but for annual mean temperature. (g) Annual mean temperature change at 2°C in CMIP6 models with high warming rate reaching the GWL in the corresponding scenario before the earliest year of the assessed very likely range (Section 4.3.4). (h) Climate response at 2°C GWL across all SSP1-1.9, SSP2-2.6, SSP2-4.5. SSP3-7.0 and SSP5-8.5 in all other models not shown in (g). The close agreement of (g) and (h) demonstrates that the mean temperature response at 2°C is not sensitive to the rate of warming, and thereby the global mean surface air temperature (GSAT) warming of the respective models in 2081–2100. Uncertainty is represented using the advanced approach: No overlay indicates regions with robust signal, where ≥66% of models show change greater than the variability threshold and ≥80% of all models agree on the sign of change; diagonal lines indicate regions with no change or no robust signal, where <66% of models show a change greater than the variability threshold; crossed lines indicate regions with conflicting signal, where ≥66% of models show change greater than the variability threshold and <80% of all models agree on the sign of change. For more information on the advanced approach, please refer to the Cross-Chapter Box Atlas.1.
In contrast to linear pattern scaling (Mitchell, 2003; Collins et al., 2013), the use of GWLs as a dimension of integration does not require linearity in the response of a climate variable. It is therefore useful even for metrics that do not show a linear response, such as the frequency of heat extremes over land and oceans (Fischer and Knutti, 2015; Frölicher et al., 2018; Kharin et al., 2018; Perkins-Kirkpatrick and Gibson, 2017) if the relationship of the variable of interest to the GWL is scenario independent. The latter means that the response is independent of the pathway and relative contribution of various radiative forcings. For some more complex indices like warm-spell duration, or for regions with strong aerosol changes, discrepancies can be larger (Z. Wang et al., 2017b; King et al., 2018; Tebaldi et al., 2020). (See also the subsection below on GWLs vs scenarios for further caveats.)
The limited scenario dependence of the GWL-based response for many variables implies that the regional response to emissions scenarios can be split in almost independent contributions of: (i) the transient global warming response to scenarios (see Chapter 4); and (ii) the regional response as function of a given GWL, which has also been referred to as ‘regional climate sensitivity’ (Seneviratne and Hauser, 2020). This property has also been used to develop regionally resolved emulators for global climate models, using global surface temperature as input (Beusch et al., 2020; Tebaldi et al., 2020). Analyses of the CMIP6 and CMIP5 multi-model ensembles shows that the GWL-based responses are very similar for temperature and precipitation extremes across the ensembles (Seneviratne and Hauser, 2020; Wehner, 2020; Li et al. , 2021). This is despite their difference in global warming response (Chapter 4), confirming a substantial decoupling between the two responses (global warming vs GWL-based regional response) for these variables. Thus, the GWL approach isolates the uncertainty in the regional climate response from the global warming uncertainty induced by scenario, global mean model response and internal variability (Cross-Chapter Box, Figure 1).
Mapping between GWL- and scenario-based responses in model analyses
To map scenario-based climate projections into changes at specific GWLs, first, all individual Earth system model (ESM) simulations that reach a certain GWL are identified. Second, the climate response patterns at the respective GWL are calculated using an approach termed here ‘GWL-sampling’ – sometimes also referred to as epoch analysis, time shift, or time sampling approach – taking into account all models and scenarios (Cross-Chapter Box, Figure 3). Note that the range of years when a given GWL is reached in the CMIP6 ensemble is different from the AR6 assessed range of projected global surface temperature (Section 4.3.4; Table 4.5). The latter further takes into account different lines of evidence, including the assessed observed warming between pre-industrial and present day, information from observational constraints on CMIP6, and emulators using the assessed transient climate response (TCR) and equilibrium climate sensitivity (ECS) ranges (Section 4.3.4). Hence the Chapter 4 assessed range (Table 4.5) is the reference to determine when a given GWL is likely reached under given scenarios, while the mapping between scenarios/time frames and GWLs is used to assess the respective regional responses happening at these time frames (which also allows accounting for the global surface temperature assessment, rather than using scenarios analyses directly from CMIP6 output).
In the model-based asssessment of Chapters 4, 8, 10, 11, 12 and the Atlas, the estimation of changes at GWLs are generally defined as the 20-year time period in which the mean global surface air temperature (GSAT; Cross-Chapter Box 2.3) first exceeds a certain anomaly relative to 1850–1900 – for simulations that start after 1850, relative to all years up to 1900 (Cross-Chapter Box Figure 3). The years when each individual model reaches a given GWL for CMIP6 and CMIP5 can be found in Hauser et al. (2021). The changes at given GWLs are identified for each ensemble member (for all scenarios) individually. Thereby, a given GWL is potentially reached a few years earlier or later in different realizations of the same model due to internal variability, but the temperature averaged across the 20-year period analysed in any simulation is consistent with the GWL. Instead of blending the information from the different scenarios, the Interactive Atlas can be used to compare the GWL spatial patterns and timings across the different scenarios (see Section (Atlas 1.3.1).

Cross-Chapter Box11.1, Figure 3 | Illustration of the AR6 global warming level (GWL) sampling approach to derive the timing and the response at a given GWL for the case of Coupled Model Intercomparison Project Phase 6 (CMIP6) data. For the mapping of scenarios/time slices into GWLs for CMIP6, please refer to Table 4.2. Respective numbers for the CMIP5 multi-model experiment are provided in Chapter 11 Supplementary Material (11.SM.1). Note that the time frames used to derive the GWL time slices can also include a different number of years (e.g., 30 years for some analyses).
Mapping between GWL- and scenario-based responsesfor literature
A large fraction of the literature considers scenario-based analyses for given time slices. When GWL-based information is required instead, an approximated mapping of the multi-model mean can be derived based on the known GWL in the given experiments for a particular time period. As a rough approximation, CMIP6 multi-model mean projections for the near-term (2021–2040) correspond to changes at about 1.5°C, and projections for the high-end scenario (SSP5-8.5) for the long-term (2081–2100) correspond to about 4°C–5°C of global warming(see Table 4.2 for changes in the CMIP6 ensemble and the Chapter 11 Supplementary Material (11.SM.1) and Hauser (2021) for details on other time periods and CMIP5). These approximated changes are used for some of the GWL-based assessments provided in the Chapter 11 regional tables (Section 11.9 and Table 11.3) when literature based on scenario projections is used to assess estimated changes at given GWLs.
GWLs versus scenarios
The use of scenarios remains a key element to inform mitigation decisions (Cross-Chapter Box 1.4), to assess which emissions pathways are consistent with a certain GWL (Cross-Chapter Box 1.4, Figure 1), to estimate when certain GWLs are reached (Section 4.3.4), and to assess for which variables it is meaningful to use GWLs as a dimension of integration. The use of scenarios is also essential for variables whose climate response strongly depends on the contribution of radiative forcing (e.g., aerosols) or land-use and land management changes, are time and warming rate dependent (e.g., sea level rise), or differ between transient and quasi-equilibrium states. Furthermore, the use of concentration or emission-driven scenario simulations is required if regional climate assessments need to account for the uncertainty in GSAT changes or climate-carbon feedbacks.
Forcing dependence of the GWL response is found for global mean precipitation (Section 8.4.3), but less for regional patterns of mean precipitation changes (Cross-Chapter Box 11.1, Figure 2). Limited dependence is found for extremes, as highlighted above. In the cryosphere, elements that are quick to respond to warming like sea ice area, permafrost and snow, show little scenario dependence (Sections 9.3.1.1, 9.5.2.3 and 9.5.3.3), whereas slow-responding variables such as ice volumes of glaciers and ice sheets respond with a substantial delay and, due to their inertia, the response depends on when a certain GWL is reached. This also applies to some extent for sea level rise where, for example, the contributions of melting glaciers and ice sheets depend on the pathway followed to reach a given GWL (Section 9.6.3.4).
In addition to the lagged effect, the climate response at a given GWL may differ before and after a period of overshoot, for example in the Atlantic Meridional Overturning Circulation (e.g., Palter et al. 2018). Finally, as assessed in IPCC SR1.5, there is a difference in the response even for temperature-related variables if a GWL is reached in a rapidly warming transient state or in an equilibrium state when the land–sea warming contrast is less pronounced (e.g., King et al. 2020). However, in this Report, GWLs are used in the context of projections for the 21st century when the climate response is mostly not in equilibrium and where projections for many variables are less dependent on the pathway than for projections beyond 2100 (Section 9.6.3.4).
Key conclusions on assessment s based on GWLs
GWL-based projections can inform society and policymakers on how climate would change under GWLs consistent with the aims of the Paris Agreement (stabilization at 1.5°C/well below 2°C), as well as on the consequences of missing these aims and reaching GWLs of 3°C or 4°C by the end of the century. The AR6 assessment shows that every bit of global warming matters and that changes in global warming of 0.5°C lead to statistically significant changes in mean climate and climate extremes on global scale and for large regions (Sections 4.6.2, 11.2.4, 11.3, 11.4, 11.6 and 11.9, Figures 11.8 and 11.9, Atlas and Interactive Atlas), as also assessed in IPCC SR1.5.
11.3 Temperature Extremes
This section assesses changes in temperature extremes at global, continental and regional scales. The main focus is on the changes in the magnitude and frequency of moderate extreme temperatures (those that occur several times a year) to very extreme temperatures (those that occur once in 10 or more years) of time scales from a day to a season, though there is a strong emphasis on the daily scale where literature is most concentrated.
11.3.1 Mechanisms and Drivers
The SREX (IPCC, 2012) and AR5 (IPCC, 2014) concluded that greenhouse gas forcing is the dominant factor for the increases in the intensity, frequency, and duration of warm extremes and the decrease in those of cold extremes. This general global-scale warming is modulated by large-scale atmospheric circulation patterns, as well as by feedbacks such as soil moisture-evapotranspiration–temperature and snow/ice-albedo–temperature feedbacks, and local forcings such as land-use change or changes in aerosol concentrations at the regional and local scales (Sections 11.1.5 and 11.1.6, and Box 11.1). Therefore, changes in temperature extremes at regional and local scales can have heterogeneous spatial distributions. Changes in the magnitudes (or intensities) of extreme temperatures are often larger than changes in global surface temperature, because of larger warming on land than on the ocean surface (Section 2.3.1.1), and because of feedbacks, though they are of similar magnitude to changes in the local mean temperature (Figure 11.2).
Extreme temperature events are associated with large-scale meteorological patterns (Grotjahn et al., 2016). Quasi-stationary anticyclonic circulation anomalies or atmospheric blocking events are linked to temperature extremes in many regions, such as in Australia (Parker et al., 2014; Perkins-Kirkpatrick et al., 2016), Europe (Brunner et al., 2017, 2018; Schaller et al., 2018), Eurasia (Yao et al., 2017), Asia (Chen et al., 2016; Ratnam et al., 2016; Rohini et al., 2016), and North America (Yu et al., 2018, 2019; Zhang and Luo, 2019). Mid-latitude planetary wave modulations affect short-duration temperature extremes such as heatwaves (Perkins, 2015; Kornhuber et al., 2020). The large-scale modes of variability (Annex IV) affect the strength, frequency and persistence of these meteorological patterns and, hence, temperature extremes. For example, cold and warm extremes in the mid-latitudes are associated with atmospheric circulation patterns such as the Pacific-North American (PNA) pattern, as well as atmosphere–ocean coupled modes such as Pacific Decadal Variability (PDV), the North Atlantic Oscillation (NAO), and Atlantic Multi-decadal Variability (AMV) (Section 11.1.5; Kamae et al., 2014; Johnson et al., 2018; Ruprich-Robert et al., 2018; Yu et al., 2018, 2020; Müller et al., 2020; Qasmi et al., 2021). Changes in the modes of variability in response to warming would therefore affect temperature extremes (Clark and Brown, 2013; Horton et al., 2015). The level of confidence in those changes varies, both in the observations and in future projections, affecting the level of confidence in changes in temperature extremes in different regions. As highlighted in Chapters 2 to 4 of this Report, it is likely that there have been observational changes in the extratropical jets and mid-latitude jet meandering (Section 2.3.1.4.3 and Cross-Chapter Box 10.1). There is low confidence in possible effects of Arctic warming on mid-latitude temperature extremes (Cross-Chapter Box 10.1). A large portion of the multi-decadal changes in extreme temperature remains after the removal of the effect of these modes of variability, and can be attributed to human influence (Kamae et al., 2017b; Wan et al., 2019). Thus, global warming dominates changes in temperature extremes at the regional scale and it is very unlikely that dynamic responses to greenhouse-gas induced warming would alter the direction of these changes.
Land–atmosphere feedbacks strongly modulate regional- and local-scale changes in temperature extremes (high confidence) (Section 11.1.6; Seneviratne et al., 2013; Lemordant et al., 2016; Donat et al., 2017; Sillmann et al., 2017b; Hirsch et al., 2019). This effect is particularly notable in mid-latitude regions where the drying of soil moisture amplifies high temperatures, especially through increases in sensible heat flux (Whan et al., 2015; Douville et al., 2016; Vogel et al., 2017). Land–atmosphere feedbacks amplifying temperature extremes also include boundary-layer feedbacks and effects on atmospheric circulation (Miralles et al., 2014a; Schumacher et al., 2019). Soil-moisture–temperature feedbacks affect past and present-day heatwaves in observations and model simulations, both locally (Miralles et al., 2014a; Cowan et al., 2016, 2020; Hauser et al., 2016; Meehl et al., 2016; Wehrli et al., 2019) and beyond the regions of feedback occurrence through changes in regional circulation patterns (Stéfanon et al., 2014; Koster et al., 2016; Sato and Nakamura, 2019). The uncertainty due to the representation of land–atmosphere feedbacks in ESMs is a cause of discrepancy between observations and simulations (Clark et al., 2006; Mueller and Seneviratne, 2014; Meehl et al., 2016). The decrease of plant transpiration or the increase of stomata resistance under enhanced CO2 concentrations is a direct CO2 forcing of land temperatures (warming due to reduced evaporative cooling), which contributes to higher warming on land (Lemordant et al., 2016; Vicente-Serrano et al., 2020b). The snow/ice-albedo feedback plays an important role in amplifying temperature variability in the high latitudes (Diro et al., 2018) and can be the largest contributor to the rapid warming of cold extremes in the mid- and high latitudes of the Northern Hemisphere (Gross et al., 2020).
Regional external forcings, including land-use changes and emissions of anthropogenic aerosols, play an important role in the changes of temperature extremes in some regions (high confidence) (Section 11.1.6). Deforestation may have contributed to about one third of the warming of hot extremes in some mid-latitude regions since the pre-industrial time (Lejeune et al., 2018). Aspects of agricultural practice, including no-till farming, irrigation, and overall cropland intensification, may cool hot temperature extremes (Davin et al., 2014; N.D. Mueller et al., 2016). For instance, cropland intensification has been suggested to be responsible for a cooling of the highest temperature percentiles in Midwest USA (N.D. Mueller et al., 2016). Irrigation has been shown to be responsible for a cooling of hot temperature extremes of up to 1°C–2°C in many mid-latitude regions in the present climate (Thieryet al., 2017, 2020), a process not represented in most of state-of-the-art ESMs (CMIP5, CMIP6). Double cropping may have led to increased hot extremes in the inter-cropping season in part of China (Jeong et al., 2014). Rapid increases in summer warming in western Europe and north-east Asia since the 1980s are linked to a reduction in anthropogenic aerosol precursor emissions over Europe (Nabat et al., 2014; Dong et al., 2016b, 2017), in addition to the effect of increased greenhouse gas forcing (see also Section 10.1.3.1). This effect of aerosols on temperature-related extremes is also noted for declines in short-lived anthropogenic aerosol emissions over North America (Mascioli et al., 2016). On the local scale, the urban heat island (UHI) effect results in higher temperatures in urban areas than in their surrounding regions, and contributes to warming in regions of rapid urbanization, in particular for nighttime temperature extremes (Box 10.3; Phelan et al., 2015; Chapman et al., 2017; Y. Sun et al., 2019). But these local and regional forcings are generally not or not well represented in the CMIP5 and CMIP6 simulations (see also Section 11.3.3), contributing to uncertainty in model simulated changes.
In summary, greenhouse gas forcing is the dominant driver leading to the warming of temperature extremes. At regional scales, changes in temperature extremes are modulated by changes in large-scale patterns and modes of variability, feedbacks including soil-moisture–evapotranspiration–temperature or snow/ice–albedo–temperature feedbacks, and local and regional forcings such as land-use and land-cover changes, or aerosol concentrations, and decadal and multi-decadal natural variability. This leads to heterogeneity in regional changes and their associated uncertainties (high confidence). Changes in anthropogenic aerosol concentrations have likely affected trends in hot extremes in some regions. Irrigation and crop expansion have attenuated increases in summer hot extremes in some regions, such as the Midwestern USA (medium confidence). Urbanization has likely exacerbated the effects of global warming in cities, in particular for nighttime temperature extremes.
11.3.2 Observed Trends
The SREX (IPCC, 2012) reported avery likely decrease in the number of cold days and nights and increase in the number of warm days and nights at the global scale. Confidence in trends was assessed as regionally variable (low to medium confidence) due to either a lack of observations or varying signals in sub-regions.
Since SREX (IPCC, 2012) and AR5 (IPCC, 2014), many regional-scale studies have examined trends in temperature extremes using different metrics that are based on daily temperatures, such as the Commission for Climatology/World Climate Research Program/Commission for Oceanography and Marine Meteorology joint Expert Team on Climate Change Detection and Indices (ETCCDI) indices (Dunn et al., 2020). The additional observational records, along with a stronger warming signal, show very clearly that changes observed at the time of AR5 (IPCC, 2014) continued, providing strengthened evidence of an increase in the intensity and frequency of hot extremes and decrease in the intensity and frequency of cold extremes. While the magnitude of the observed trends in temperature-related extremes varies depending on the region, spatial and temporal scales, and metric assessed, evidence of a warming effect is overwhelming, robust, and consistent. In particular, an increase in the intensity and frequency of hot extremes is almost always associated with an increase in the hottest temperatures and in the number of heatwave days. It is also the case for changes (decreases) in cold extremes. For this reason, and to simplify the presentation, the phrase ‘increase in the intensity and frequency of hot extremes’ is used to represent, collectively, an increase in the magnitude of extreme day and/or night temperatures, in the number of warm days and/or nights, and in the number of heatwave days. Changes in cold extremes are assessed similarly.
On the global scale, evidence of an increase in the number of warm days and nights and a decrease in the number of cold days and nights, and an increase in the coldest and hottest extreme temperatures is very robust and consistent among all variables. Figure 11.2 displays time series of globally averaged TXx and TNn on land. Warming of land mean TXx is similar to the mean temperature warming on land, which is about 45% higher than global warming (Section 2.3.1). Warming of land mean TNn is even higher, with about 3°C of warming since 1960 (Figure 11.2). Figure 11.9 shows maps of linear trends over 1960–2018 in TXx, TNn, and frequency of warm days (TX90p). The maps for TXx and TNn show trends consistent with overall warming in most regions, with a particularly high warming of TXx in Europe and north-western South America, and a particularly high warming of TNn in the Arctic. Consistent with the observed warming in global surface temperature (Section 2.3.1.2) and the observed trends in TXx and TNn, the frequency of TX90p has increased, while that of cold nights (TN10p) has decreased since the 1950s: Nearly all land regions showed statistically significant decreases in TN10p (Alexander, 2016; Dunn et al., 2020), though trends in TX90p are variable with some decreases in Southern South America, mainly during austral summer (Rusticucci et al., 2017). A decrease in the number of cold spell days is also observed over nearly all land surface areas (Easterling et al., 2016) and in the northern mid-latitudes in particular (van Oldenborgh et al., 2019). These observed changes are also consistent when a new global land surface daily air temperature dataset is analysed (P. Zhang et al., 2019). Warming trends in temperature extremes globally, and in most land areas, over the path century are also found to be consistent in a range of observation-based datasets (Fischer and Knutti, 2014; Donat et al., 2016a; Dunn et al., 2020), with the extremes related to daily minimum temperatures changing faster than those related to daily maximum temperatures (Dunn et al., 2020; see Figure 11.2). Seasonal variations in trends in temperature-related extremes have been demonstrated. A warming in warm-season temperature extremes is detected, even during the ‘slower surface global warming’ period from the late 1990s to early 2010s (Cross-Chapter Box 3.1; Kamae et al., 2014; Seneviratne et al., 2014; Imada et al., 2017). Many studies of past changes in temperature extremes for particular regions or countries show trends consistent with this global picture, as summarized below and in Tables 11.4, 11.7, 11.10, 11.13, 11.16 and 11.19.
 Figure 11.9 | Linear trends over 1960–2018 for three temperature extreme indices: (a) the annual maximum daily maximum temperature (TXx), (b) the annual minimum daily minimum temperature (TNn), and (c) the annual number of days when daily maximum temperature exceeds its 90th percentile from a base period of 1961–1990 (TX90p); based on the HadEX3 dataset (Dunn et al. , 2020). Linear trends are calculated only for grid points with at least 66% of the annual values over the period and which extend to at least 2009. Areas without sufficient data are shown in grey. No overlay indicates regions where the trends are significant at the p = 0.1 level. Crosses indicate regions where trends are not significant. Further details on data sources and processing are available in the chapter data table (Table 11.SM.9).
 In Africa (Table 11.4), while it is difficult to assess changes in temperature extremes in parts of the continent because of a lack of data, evidence of an increase in the intensity and frequency of hot extremes and decrease in the intensity and frequency of cold extremes is clear and robust in regions where data are available. These include an increase in the frequency of warm days and nights and a decrease in the frequency of cold days and nights with high confidence (Donat et al., 2013a, 2014b; Kruger and Sekele, 2013; Chaney et al., 2014; Filahi et al., 2016; Moron et al., 2016; Ringard et al., 2016; Barry et al., 2018; Gebrechorkos et al., 2018) and an increase in heatwaves (Russo et al., 2016; Ceccherini et al., 2017). The increase in TNn is more notable than in TXx (Figure 11.9). Cold spells occasionally strike subtropical areas, but are likely to have decreased in frequency (Barry et al., 2018). The frequency of cold events has likely decreased in South Africa (Song et al., 2014; Kruger and Nxumalo, 2017), North Africa (Filahi et al., 2016; Driouech et al., 2021), and the Sahara (Donat et al., 2016a). Over the whole continent, there is medium confidence in an increase in the intensity and frequency of hot extremes and decrease in the intensity and frequency of cold extremes; it is likely thatsimilar changes have also occurred in areas with poor data coverage, as warming is widespread and as projected future changes are similar over all regions (Section 11.3.5).
In Asia (Table 11.7), there is veryrobust evidence for avery likely increase in the intensity and frequency of hot extremes and decrease in the intensity and frequency of cold extremes in recent decades. This is clear in global studies (e.g., Alexander, 2016; Dunn et al., 2020), as well as in numerous regional studies (Table 11.7). The area fraction with extreme warmth in Asia increased during 1951–2016 (Imada et al., 2018). The frequency of warm extremes increased and the frequency of cold extremes decreased in East Asia (B. Zhou et al., 2016; Chen and Zhai, 2017; Yin et al., 2017; W. Lee et al., 2018; Qian et al., 2019) and west Asia (Acar Deniz and Gönençgil, 2015; Erlat and Türkeş, 2016; Rahimi and Hejabi, 2018; Rahimi et al., 2018) with high confidence. The duration of heat extremes has also lengthened in some regions, for example, in southern China (Luo and Lau, 2016), but there is medium confidence of heat extremes increasing in frequency in South Asia (AlSarmi and Washington, 2014; Sheikh et al., 2015; Mazdiyasni et al., 2017; Zahid et al., 2017; Nasim et al., 2018; Khan et al., 2019; Sen Roy, 2019). Warming trends in daily temperature extremes indices have also been observed in central Asia (Hu et al., 2016; Feng et al., 2018), the Hindu Kush Himalaya (Sun et al., 2017), and South East Asia (Supari et al., 2017; Cheong et al., 2018). The intensity and frequency of cold spells in all Asian regions have been decreasing since the beginning of the 20th century (high confidence) (Sheikh et al., 2015; Donat et al., 2016a; Dong et al., 2018; van Oldenborgh et al., 2019).
In Australasia (Table 11.10), there is veryrobust evidence forvery likely increases in the number of warm days and warm nights and decreases in the number of cold days and cold nights since 1950 (Lewis and King, 2015; Jakob and Walland, 2016; Alexander and Arblaster, 2017). The increase in extreme minimum temperatures occurs in all seasons over most of Australia and typically exceeds the increase in extreme maximum temperatures (X.L. Wang et al., 2013b; Jakob and Walland, 2016). However, some parts of Southern Australia have shown stable or increased numbers of frost days since the 1980s (Dittus et al., 2014) (see also Section 11.3.4). Similar positive trends in extreme minimum and maximum temperatures have been observed in New Zealand, in particular in the autumn and winter seasons, although they generally show higher spatial variability (Caloiero, 2017). In the tropical Western Pacific region, spatially coherent warming trends in maximum and minimum temperature extremes have been reported for the period 1951–2011 (Whan et al., 2014; McGree et al., 2019).
In Central and South America (Table 11.13), there is high confidence that observed hot extremes (TN90p, TX90p) have increased, and cold extremes (TN10p, TX10p) have decreased over recent decades, though trends vary among different extremes types, datasets, and regions (Skansi et al., 2013; Dittus et al., 2016; Rusticucci et al., 2017; Meseguer-Ruiz et al., 2018; Salvador and de Brito, 2018; Dereczynski et al., 2020; Dunn et al., 2020; Olmo et al., 2020). An increase in the intensity and frequency of heatwave events was also observed between 1961 and 2014 in an area covering most of South America (Ceccherini et al., 2016; Geirinhas et al., 2018). However, there is medium confidence that warm extremes (TXx and TX90p) have decreased in the last decades over the central region of South-Eastern South America (SES) during austral summer (Tencer and Rusticucci, 2012; Skansi et al., 2013; Rusticucci et al., 2017; Wu and Polvani, 2017). There is medium confidence that TNn extremes are warming faster than TXx extremes, with the largest warming rates observed over North-East Brazil (NEB) and Northern South America (NSA) for cold nights (Skansi et al., 2013).
In Europe (Table 11.16), there is veryrobust evidence for avery likely increase in maximum temperatures and the frequency of heatwaves. The increase in the magnitude and frequency of high maximum temperatures has been observed consistently across regions, including in central Europe (Twardosz and Kossowska-Cezak, 2013; Christidis et al., 2015; Lorenz et al., 2019) and southern Europe (Croitoru and Piticar, 2013; El Kenawy et al., 2013; Christidis et al., 2015; Nastos and Kapsomenakis, 2015; Fioravanti et al., 2016; Ruml et al., 2017). In Northern Europe, a strong increase in extreme winter warming events has been observed (Matthes et al., 2015; Vikhamar-Schuler et al., 2016). Temperature observations for winter cold spells show a long-term decreasing frequency in Europe (Brunner et al., 2018; van Oldenborgh et al., 2019), and typical cold spells, such as that observed during the 2009–2010 winter, had an occurrence probability two times smaller currently than if climate change had not occurred (Christiansen et al., 2018).
In North America (Table 11.19), there is veryrobust evidence for avery likely increase in the intensity and frequency of hot extremes and decrease in the intensity and frequency of cold extremes for the whole continent, though there are substantial spatial and seasonal variations in the trends. Minimum temperatures display warming consistently across the continent, while there are more contrasting trends in the annual maximum daily temperatures in parts of the USA (Figure 11.9; Lee et al., 2014; van Oldenborgh et al., 2019; Dunn et al., 2020). In Canada, there is a clear increase in the intensity and frequency of hot extremes and decrease in the intensity and frequency of cold extremes (Vincent et al., 2018). In Mexico, a clear warming trend in TNn was found, particularly in the northern arid region (Montero-Martínez et al., 2018). The number of warm days has increased and the number of cold days has decreased (García-Cueto et al., 2019). Cold spells have undergone a reduction in magnitude and intensity in all regions of North America (Bennett and Walsh, 2015; Donat et al., 2016a; Grotjahn et al., 2016; Vose et al., 2017; García-Cueto et al., 2019; van Oldenborgh et al., 2019).
Extreme heat events have increased around the Arctic since 1979, particularly over Arctic North America and Greenland (Matthes et al., 2015; Dobricic et al., 2020), which is consistent with summer melt (Section 9.4.1). Observations north of 60˚N show increases in winter warm days and nights over 1979–2015, while cold days and nights declined (Sui et al., 2017). Extreme heat days are particularly strong in winter, with observations showing the warmest mid-winter temperatures at the North Pole rising at twice the rate of mean temperature (Moore, 2016), as well as increases in Arctic winter warm days (Vikhamar-Schuler et al., 2016; Graham et al., 2017). Arctic annual minimum temperatures have increased at about three times the rate of global surface temperature since the 1960s (Figures 11.2 and 11.9), consistent with the observed mean cold season (October–May) warming of 3.1°C in the region (Atlas 11.2).
Trends in some measures of heatwaves are also observed at the global scale. Globally averaged heatwave intensity, heatwave duration, and the number of heatwave days have significantly increased from 1950–2011 (Perkins, 2015). There are some regional differences in trends in characteristics of heatwaves, with significant increases reported in Europe (Russo et al., 2015; Forzieri et al., 2016;Sánchez-Benítez et al., 2020) and Australia (CSIRO and BOM, 2016; Alexander and Arblaster, 2017). In Africa, there is medium confidence that heatwaves, regardless of the definition, have been becoming more frequent, longer-lasting, and hotter over more than three decades (Fontaine et al., 2013; Mouhamed et al., 2013; Ceccherini et al., 2016, 2017; Forzieri et al., 2016; Moron et al., 2016; Russo et al., 2016). The majority of heatwave characteristics examined in China between 1961 and 2014 show increases in heatwave days, consistent with warming (You et al., 2017; Xie et al., 2020). Increases in the frequency and duration of heatwaves are also observed in Mongolia (Erdenebat and Sato, 2016) and India (Ratnam et al., 2016; Rohini et al., 2016). In the UK, the lengths of short heatwaves have increased since the 1970s, while the lengths of long heatwaves (more than 10 days) have decreased over some stations in the south-east of England (M. Sanderson et al., 2017). In Central and South America, there are increases in the frequency of heatwaves (Barros et al., 2015; Bitencourt et al., 2016; Ceccherini et al., 2016; Piticar, 2018), although decreases in Excess Heat Factor (EHF), which is a metric for heatwave intensity, are observed in South America in data derived from HadGHCND (Cavanaugh and Shen, 2015).
In summary, it is virtually certain that there has been an increase in the number of warm days and nights and a decrease in the number of cold days and nights on the global scale since 1950. Both the coldest extremes and hottest extremes display increasing temperatures. It is very likely that these changes have also occurred at the regional scale in Europe, Australasia, Asia, and North America. It is virtually certain that there has been increases in the intensity and duration of heatwaves and in the number of heatwave days at the global scale. These trends likely occur in Europe, Asia, and Australia. There is medium confidence in similar changes in temperature extremes in Africa and high confidence in South America; the lower confidence is due to reduced data availability and fewer studies. Annual minimum temperatures on land have increased about three times more than global surface temperature since the 1960s, with particularly strong warming in the Arctic (high confidence).
11.3.3 Model Evaluation
The AR5 assessed that CMIP3 and CMIP5 models generally captured the observed spatial distributions of the mean state and that the inter-model range of simulated temperature extremes was similar to the spread estimated from different observational datasets; the models generally captured trends in the second half of the 20th century for indices of extreme temperature, although they tended to overestimate trends in hot extremes and underestimate trends in cold extremes (Flato et al., 2013). Post-AR5 studies on the CMIP5 models’ performance in simulating mean and changes in temperature extremes continue to support the AR5 assessment (Fischer and Knutti, 2014; Sillmann et al., 2014; Ringard et al., 2016; Borodina et al., 2017b; Donat et al., 2017; Di Luca et al., 2020b). Over Africa, the observed warming in temperature extremes is captured by CMIP5 models, although it is underestimated in Western and Central Africa (Sherwood et al., 2014; Diedhiou et al., 2018). Over East Asia, the CMIP5 ensemble performs well in reproducing the observed trend in temperature extremes averaged over China (Dong et al., 2015). Over Australia, the multi-model mean performs better than individual models in capturing observed trends in gridded station-based ETCCDI temperature indices (Alexander and Arblaster, 2017).
Initial analyses of CMIP6 simulations (H. Chen et al., 2020; Di Luca et al., 2020a; Kim et al., 2020; Thorarinsdottir et al., 2020; Wehner et al., 2020; Li et al., 2021) indicate that the CMIP6 models perform similarly to the CMIP5 models regarding biases in hot and cold extremes. In general, CMIP5 and CMIP6 historical simulations are similar in their performance in simulating the observed climatology of extreme temperatures (high confidence). The general warm bias in hot extremes and cold bias in cold extremes reported for CMIP5 models (Kharin et al., 2013; Sillmann et al., 2013a) remain in CMIP6 models (Di Luca et al., 2020a). However, there is some evidence that CMIP6 models better represent some of the underlying processes leading to extreme temperatures, such as seasonal and diurnal variability and synoptic-scale variability (Di Luca et al., 2020a). Whether these improvements are sufficient to enhance our understanding of past changes, or to reduce uncertainties in future projections, remains unclear. The relative error estimates in the simulation of various indices of temperature extremes in the available CMIP6 models show that no single model performs the best on all indices, and the multi-model ensemble seems to outperform any individual model due to its reduction in systematic bias (Kim et al., 2020). Figure 11.10 show errors in the 1979–2014 average annual TXx and annual TNn simulated by available CMIP6 models in comparison with HadEX3 and ERA5 (Kim et al., 2020; Wehner et al., 2020; Li et al., 2021). While the magnitude of the model error depends on the reference dataset, the model evaluations drawn from different reference datasets are quite similar. In general, models reproduce the spatial patterns and magnitudes of both cold and hot temperature extremes quite well. There are also systematic biases. Hot extremes tend to be too cool in mountainous and high-latitude regions, but too warm in the eastern USA and South America. For cold extremes, CMIP6 models are too cool, except in north-eastern Eurasia and the southern mid-latitudes. Errors in seasonal mean temperatures are uncorrelated with errors in extreme temperatures and are often of opposite sign (Wehner et al., 2020).
 Figure 11.10 | Multi-model mean bias in temperature extremes (°C) for the period 1979–2014, calculated as the difference between the Coupled Model Intercomparison Project Phase 6 (CMIP6) multi-model mean and the average of observations from the values availablein HadEX3. (a) The annual hottest temperature(TXx); and (b) the annual coldest temperature (TNn). Areas without sufficient data are shown in grey. Adapted from Wehner et al. (2020) under the terms of the Creative Commons Attribution licence. Further details on data sources and processing are available in the chapter data table (Table 11.SM.9).
 Atmospheric Model Intercomparison Project (AMIP) simulations are often used in event attribution studies to assess the influence of global warming on observed temperature-related extremes. These simulations typically capture the observed trends in temperature extremes, though some regional features, such as the lack of warming in daytime warm temperature extremes over South America and parts of North America, are not reproduced in the model simulations (Dittus et al., 2018), possibly due to internal variability, deficiencies in local surface processes, or forcings that are not represented in the sea surface temperatures (SSTs). Additionally, the AMIP models assessed tend to produce overly persistent heatwave events. This bias in the duration of the events does not impact on the reliability of the models’ positive trends (Freychet et al., 2018).
Several regional climate models (RCMs) have also been evaluated in terms of their performance in simulating the climatology of extremes in various regions of the Coordinated Regional Downscaling Experiment (CORDEX) (Giorgi et al., 2009), especially in East Asia (Ji and Kang, 2015; Yu et al., 2015; Park et al., 2016; Bucchignani et al., 2017; Gao et al., 2017a; Niu et al., 2018; Y. Sun et al., 2018b; Wang et al., 2019), Europe (Vautard et al., 2013, 2021; Smiatek et al., 2016; Gaertner et al., 2018; Cardoso et al., 2019; Lorenz et al., 2019; Jacob et al., 2020; Kim et al., 2020), and Africa (J. Kim et al., 2014; Diallo et al., 2015; Dosio, 2017; Samouly et al., 2018; Mostafa et al., 2019). Compared to GCMs, RCM simulations show an added value in simulating temperature-related extremes, though this depends on topographical complexity and the parameters employed (see Section 10.3.3). The improvement with resolution is noted in East Asia (Park et al., 2016; W. Zhou et al., 2016; Shi et al., 2017; Hui et al., 2018). However, in the European CORDEX ensemble, different aerosol climatologies with various degrees of complexity were used in projections (Bartók et al., 2017; Lorenz et al., 2019) and the land surface models used in the RCMs do not account for physiological CO2 effects on photosynthesis leading to enhanced water-use efficiency and decreased evapotranspiration (Schwingshackl et al., 2019), which could lead to biases in the representation of temperature extremes in these projections (Boé et al., 2020). In addition, there are key cold biases in temperature extremes over areas with complex topography (Niu et al., 2018). Over North America, 12 RCMs were evaluated over the ARCTIC-CORDEX region (Diaconescu et al., 2018). Models performed well at simulating climate indices related to mean air temperature and hot extremes over most of the Canadian Arctic, with the exception of the Yukon region where models displayed the largest biases related to topographic effects. Two RCMs were evaluated against observed extremes indices over North America over the period 1989–2009, with a cool bias in minimum temperature extremes shown in both RCMs (Whan and Zwiers, 2016). The most significant biases are found in TXx and TNn, with fewer differences in the simulation of annual minimum daily maximum temperature (TXn) and annual maximum daily minimum temperature (TNx) in Central and Western North America. Over Central and South America, maximum temperatures from the Eta RCM are generally underestimated, although hot days, warm nights, and heatwaves are increasing in the period 1961–1990, in agreement with observations (Chou et al., 2014b; Tencer et al., 2016; Bozkurt et al., 2019).
Some land forcings are not well represented in climate models. As highlighted in the Special Report on Climate Change and Land (SRCCL) Chapter 2, there is high agreement that temperate deforestation leads to summer warming and winter cooling (Anderson et al., 2011; Gálos et al., 2011, 2013; Anderson-Teixeira et al., 2012; Chen et al., 2012; Wickham et al., 2013; Zhao and Jackson, 2014; Ahlswede and Thomas, 2017; Bright et al., 2017; Strandberg and Kjellström, 2019), which has substantially contributed to the warming of hot extremes in the northern mid-latitudes over the course of the 20th century (Lejeune et al., 2018) and in recent years (Strandberg and Kjellström, 2019). However, observed forest effects on the seasonal and diurnal cycle of temperature are not well-captured in several ESMs: while observations show a cooling effect of forest cover compared to non-forest vegetation during daytime (Li et al., 2015), in particular in arid, temperate, and tropical regions (Alkama and Cescatti, 2016), several ESMs simulate a warming of daytime temperatures for regions with forest versus non-forest cover (Lejeune et al., 2017). Also irrigation effects, which can lead to regional cooling of temperature extremes, are generally not integrated in current generations of ESMs (Section 11.3.1).
In summary, there is high confidence that climate models can reproduce the mean state and overall warming of temperature extremes observed globally and in most regions, although the magnitude of the trends may differ. The ability of models to capture observed trends in temperature-related extremes depends on the metric evaluated, the way indices are calculated, and the time periods and spatial scales considered. Regional climate models add value in simulating temperature-related extremes over GCMs in some regions. Some land forcings on temperature extremes are not well-captured (effects of deforestation) or generally not representated (irrigation) in ESMs.
11.3.4 Detection and Attribution, Event Attribution
The SREX (IPCC, 2012) assessed that it is likely anthropogenic influences have led to the warming of extreme daily minimum and maximum temperatures at the global scale. The AR5 concluded that human influence has very likely contributed to the observed changes in the intensity and frequency of daily temperature extremes on the global scale in the second half of the 20th century (IPCC, 2014). With regard to individual, or regionally or locally specific events, AR5 concluded that it is likely human influence has substantially increased the probability of occurrence of heatwaves in some locations.
Studies since AR5 continue to attribute the observed increase in the frequency or intensity of hot extremes and the observed decrease in the frequency or intensity of cold extremes to human influence, dominated by anthropogenic greenhouse gas emissions, on global and continental scales, and for many AR6 regions. These include attribution of changes in the magnitude of annual TXx, TNx, TXn, and TNn, based on different observational datasets including, HadEX2 and HadEX3, CMIP5 and CMIP6 simulations, and different statistical methods (Kim et al., 2016; Z. Wang et al., 2017a; Seong et al., 2021). As is the case for an increase in mean temperature (Section 3.3.1), an increase in extreme temperature is mostly due to greenhouse gas forcing, offset by aerosol forcing. The aerosols’ cooling effect is clearly detectable over Europe and Asia (Seong et al., 2021). As much as 75% of the moderate daily hot extremes (above 99.9th percentile) over land are due to anthropogenic warming (Fischer and Knutti, 2015). New results are found to be more robust due to the extended period that improves the signal-to-noise ratio. The effect of anthropogenic forcing is clearly detectable and attributable in the observed changes in these indicators of temperature extremes, even at country and sub-country scales, such as in Canada (Wan et al., 2019). Changes in the number of warm nights, warm days, cold nights, and cold days, and other indicators such as the Warm Spell Duration Index (WSDI), are also attributed to anthropogenic influence (Christidis and Stott, 2016; Hu et al., 2020).
Regional studies, including for Asia (Dong et al., 2018; Lu et al., 2018), Australia (Alexander and Arblaster, 2017), and Europe (Christidis and Stott, 2016), found similar results. A clear anthropogenic signal is also found in the trends in the Combined Extreme Index (CEI) for North America, Asia, Australia, and Europe (Dittus et al., 2016). While various studies have described increasing trends in several heatwave metrics (heatwave duration, the number of heatwave days, etc.) in different regions (e.g., Cowan et al., 2014; Bandyopadhyay et al., 2016; M. Sanderson et al., 2017), few recent studies have explicitly attributed these changes to causes; most of them stated that observed trends are consistent with anthropogenic warming. The detected anthropogenic signals are clearly separable from the response to natural forcing, and the results are generally insensitive to the use of different model samples, as well as different data availability, indicating robust attribution. Studies of monthly, seasonal, and annual records in various regions (Kendon, 2014; Lewis and King, 2015; Bador et al., 2016; Meehl et al., 2016; C. Zhou et al., 2019) and globally (King, 2017) show an increase in the breaking of hot records and a decrease in the breaking of cold records (King, 2017). Changes in anthropogenically attributablerecord-breaking rates are noted to be largest over the Northern Hemisphere land areas (Shiogama et al., 2016). Yin and Sun (2018) found clear evidence of an anthropogenic signal in the changes in the number of frost and ice days, when multiple model simulations were used. In some key wheat-producing regions of Southern Australia, increases in frost days or frost season length have been reported (Dittus et al., 2014; Crimp et al., 2016); these changes are linked to decreases in rainfall, cloud-cover, and subtropical ridge strength, despite an overall increase in regional mean temperatures (Dittus et al., 2014; Pepler et al., 2018).
A significant advance since AR5 has been a large number of studies focusing on extreme temperature events at monthly and seasonal scales, using various extreme event attribution methods. Diffenbaugh et al. (2017) found that anthropogenic warming has increased the severity and probability of the hottest month by more than 80% of the available observational area on the global scale. Christidis and Stott (2014) provide clear evidence that warm events have become more probable because of anthropogenic forcings. Sun et al. (2014) found that human influence has caused a more than 60-fold increase in the probability of the extreme warm 2013 summer in eastern China since the 1950s. Human influence is found to have increased the probability of the historically hottest summers in many regions of the world, both in terms of mean temperature (B. Mueller et al., 2016) and wet bulb globe temperature (WBGT; C. Li et al., 2017). In most regions of the Northern Hemisphere, changes in the probability of extreme summer average WBGT were found to be about an order of magnitude larger than changes in the probability of extreme hot summers estimated by surface air temperature (C. Li et al., 2017). In addition to these generalized, global-scale approaches, extreme event studies have found an attributable increase in the probability of hot annual and seasonal temperatures in many locations, including Australia (Knutson et al., 2014b; Lewis and Karoly, 2014), China (Sun et al., 2014; Sparrow et al., 2018; Zhou et al., 2020), Korea (Y.-H. Kim et al., 2018) and Europe (King et al., 2015b).
There have also been many extreme event attribution studies that examined short-duration temperature extremes, including daily temperatures, temperature indices, and heatwave metrics. Examples of these events from different regions are summarized in various annual Explaining Extreme Events supplements of the Bulletin of the American Meteorological Society (Peterson et al., 2012, 2013a; Herring et al., 2014, 2015, 2016, 2018, 2019, 2020), including a number of approaches to examine extreme events (described in Easterling et al., 2016; Stott et al., 2016; Otto, 2017). Several studies of recent events from 2016 onwards have determined an infinite risk ratio (a fraction of attributable risk, or FAR, of 1), indicating that the occurrence probability for such events is close to zero in model simulations without anthropogenic influences (see Herring et al., 2018, 2019, 2020; Imada et al., 2019; Vogel et al., 2019). Though it is difficult to accurately estimate the lower bound of the uncertainty range of the FAR in these cases (Paciorek et al., 2018), the fact that those events are so far outside the envelop of the models with only natural forcing indicates that it is extremely unlikely for those events to occur without human influence.
Studies that focused on the attributable signal in observed cold extreme events show human influence reducing the probability of those events. Individual attribution studies on the extremely cold winter of 2011 in Europe (Peterson et al., 2012), in the eastern USA during 2014 and 2015 (Trenary et al., 2015, 2016; Wolter et al., 2015; Bellprat et al., 2016), in the cold spring of 2013 in the United Kingdom (Christidis et al., 2014), and of 2016 in eastern China (Qian et al., 2018; Y. Sun et al., 2018b) all showed a reduced probability due to human influence on the climate. An exception is the study of Grose et al. (2018), which found an increase in the probability of the severe western Australian frost of 2016 due to anthropogenically-driven changes in circulation patterns that drive cold outbreaks and frost probability.
Different event attribution studies can produce a wide range of changes in the probability of event occurrence because of different framing. The temperature event definition itself plays a crucial role in the attributable signal (Fischer and Knutti, 2015; Kirchmeier‐Young et al., 2019). Large-scale, longer-duration events tend to have notably larger attributable risk ratios (Angélil et al., 2014, 2018; Uhe et al., 2016; Harrington, 2017; Kirchmeier‐Young et al., 2019), as natural variability is smaller. While uncertainty in the best estimates of the risk ratios may be large, their lower bounds can be quite insensitive to uncertainties in observations or model descriptions, thus increasing confidence in conservative attribution statements (Jeon et al., 2016).
The relative strength of anthropogenic influences on temperature extremes is regionally variable, in part due to differences in changes in atmospheric circulation, land–surface feedbacks, and other external drivers such as aerosols. For example, in the Mediterranean and over western Europe, risk ratios on the order of 100 have been found (Kew et al., 2019; Vautard et al., 2020), whereas in the USA, changes are much less pronounced. This is probably a reflection of the land–surface feedback enhanced extreme 1930s temperatures that reduce the rarity of recent extremes, in addition to the definition of the events and framing of attribution analyses (e.g., spatial and temporal scales considered). Local forcing may mask or enhance the warming effect of greenhouse gases. In India, short-lived aerosols or an increase in irrigation may be masking the warming effect of greenhouse gases (Wehner et al., 2018c). Irrigation and crop intensification have been shown to lead to a cooling in some regions, in particular in North America, Europe, and India (high confidence) (N.D. Mueller et al., 2016; Thiery et al., 2017, 2020; Chen and Dirmeyer, 2019). Deforestation has contributed about one third of the total warming of hot extremes in some mid-latitude regions since pre-industrial times (Lejeune et al., 2018). Despite all of these differences, and larger uncertainties at the regional scale, nearly all studies demonstrated that human influence has contributed to an increase in the frequency or intensity of hot extremes and to a decrease in the frequency or intensity of cold extremes.
In summary, long-term changes in various aspects of long- and short-duration extreme temperatures, including intensity, frequency, and duration have been detected in observations and attributed to human influence at global and continental scales. It is extremely likely that human influence is the main contributor to the observed increase in the intensity and frequency of hot extremes and the observed decrease in the intensity and frequency of cold extremes on the global scale. It is very likely that this applies on continental scales as well. Some specific recent hot extreme events would have been extremely unlikely to occur without human influence on the climate system. Changes in aerosol concentrations have affected trends in hot extremes in some regions, with the presence of aerosols leading to attenuated warming, in particular from 1950 to 1980. Crop intensification, irrigation and no-till farming have attenuated increases in summer hot extremes in some regions, such as Central North America (medium confidence).
11.3.5 Projections
The AR5 (Chapter12, Collins et al., 2013) concluded that it is virtually certain there will be more frequent hot extremes and fewer cold extremes at the global scale and over most land areas in a future warmer climate, and it is very likely that heatwaves will occur with a higher frequency and longer duration.The SR1.5 (Chapter 3, Hoegh-Guldberg et al., 2018) assessment on projected changes in hot extremes at 1.5°C and 2°C global warming is consistent with the AR5 assessment, concluding that it is very likely a global warming of 2°C, when compared with a 1.5°C warming, would lead to more frequent and more intense hot extremes on land, as well as to longer warm spells, affecting many densely inhabited regions. The SR1.5 also assessed it is very likely that the strongest increases in the frequency of hot extremes are projected for the rarest events, while cold extremes will become less intense and less frequent, and cold spells will be shorter.
New studies since AR5 and SR1.5 confirm these assessments. New literature since AR5 includes projections of temperature-related extremes in relation to changes in mean temperatures, projections based on CMIP6 simulations, projections based on stabilized global warming levels, and the use of new metrics. Constraints for the projected changes in hot extremes were also provided (Borodina et al., 2017b; Sippel et al., 2017b; Vogel et al., 2017). Overall, projected changes in the magnitude of extreme temperatures over land are larger than changes in global mean temperature, over mid-latitude land regions in particular (Figures 11.3, 11.11; Fischer et al., 2014; Seneviratne et al., 2016; B.M. Sanderson et al., 2017; Wehner et al., 2018b; Di Luca et al., 2020b). Large warming in hot and cold extremes will occur, even at the 1.5°C GWL (Figure 11.11). At this level, widespread significant changes at the grid-box level occur for different temperature indices (Aerenson et al., 2018). In agreement with CMIP5 projections, CMIP6 simulations show that a 0.5°C increment in global warming will significantly increase the intensity and frequency of hot extremes, and decrease the intensity and frequency of cold extremes on the global scale (Figures 11.6, 11.8 and 11.12). It takes less than half of a degree for the changes in TXx to emerge above the level of natural variability (Figure 11.8) and the 66% ranges of the land medians of the 10-year or 50-year TXx events do not overlap between 1.0°C and 1.5°C in the CMIP6 multi-model ensemble simulations(Figure 11.6, Li et al., 2021).
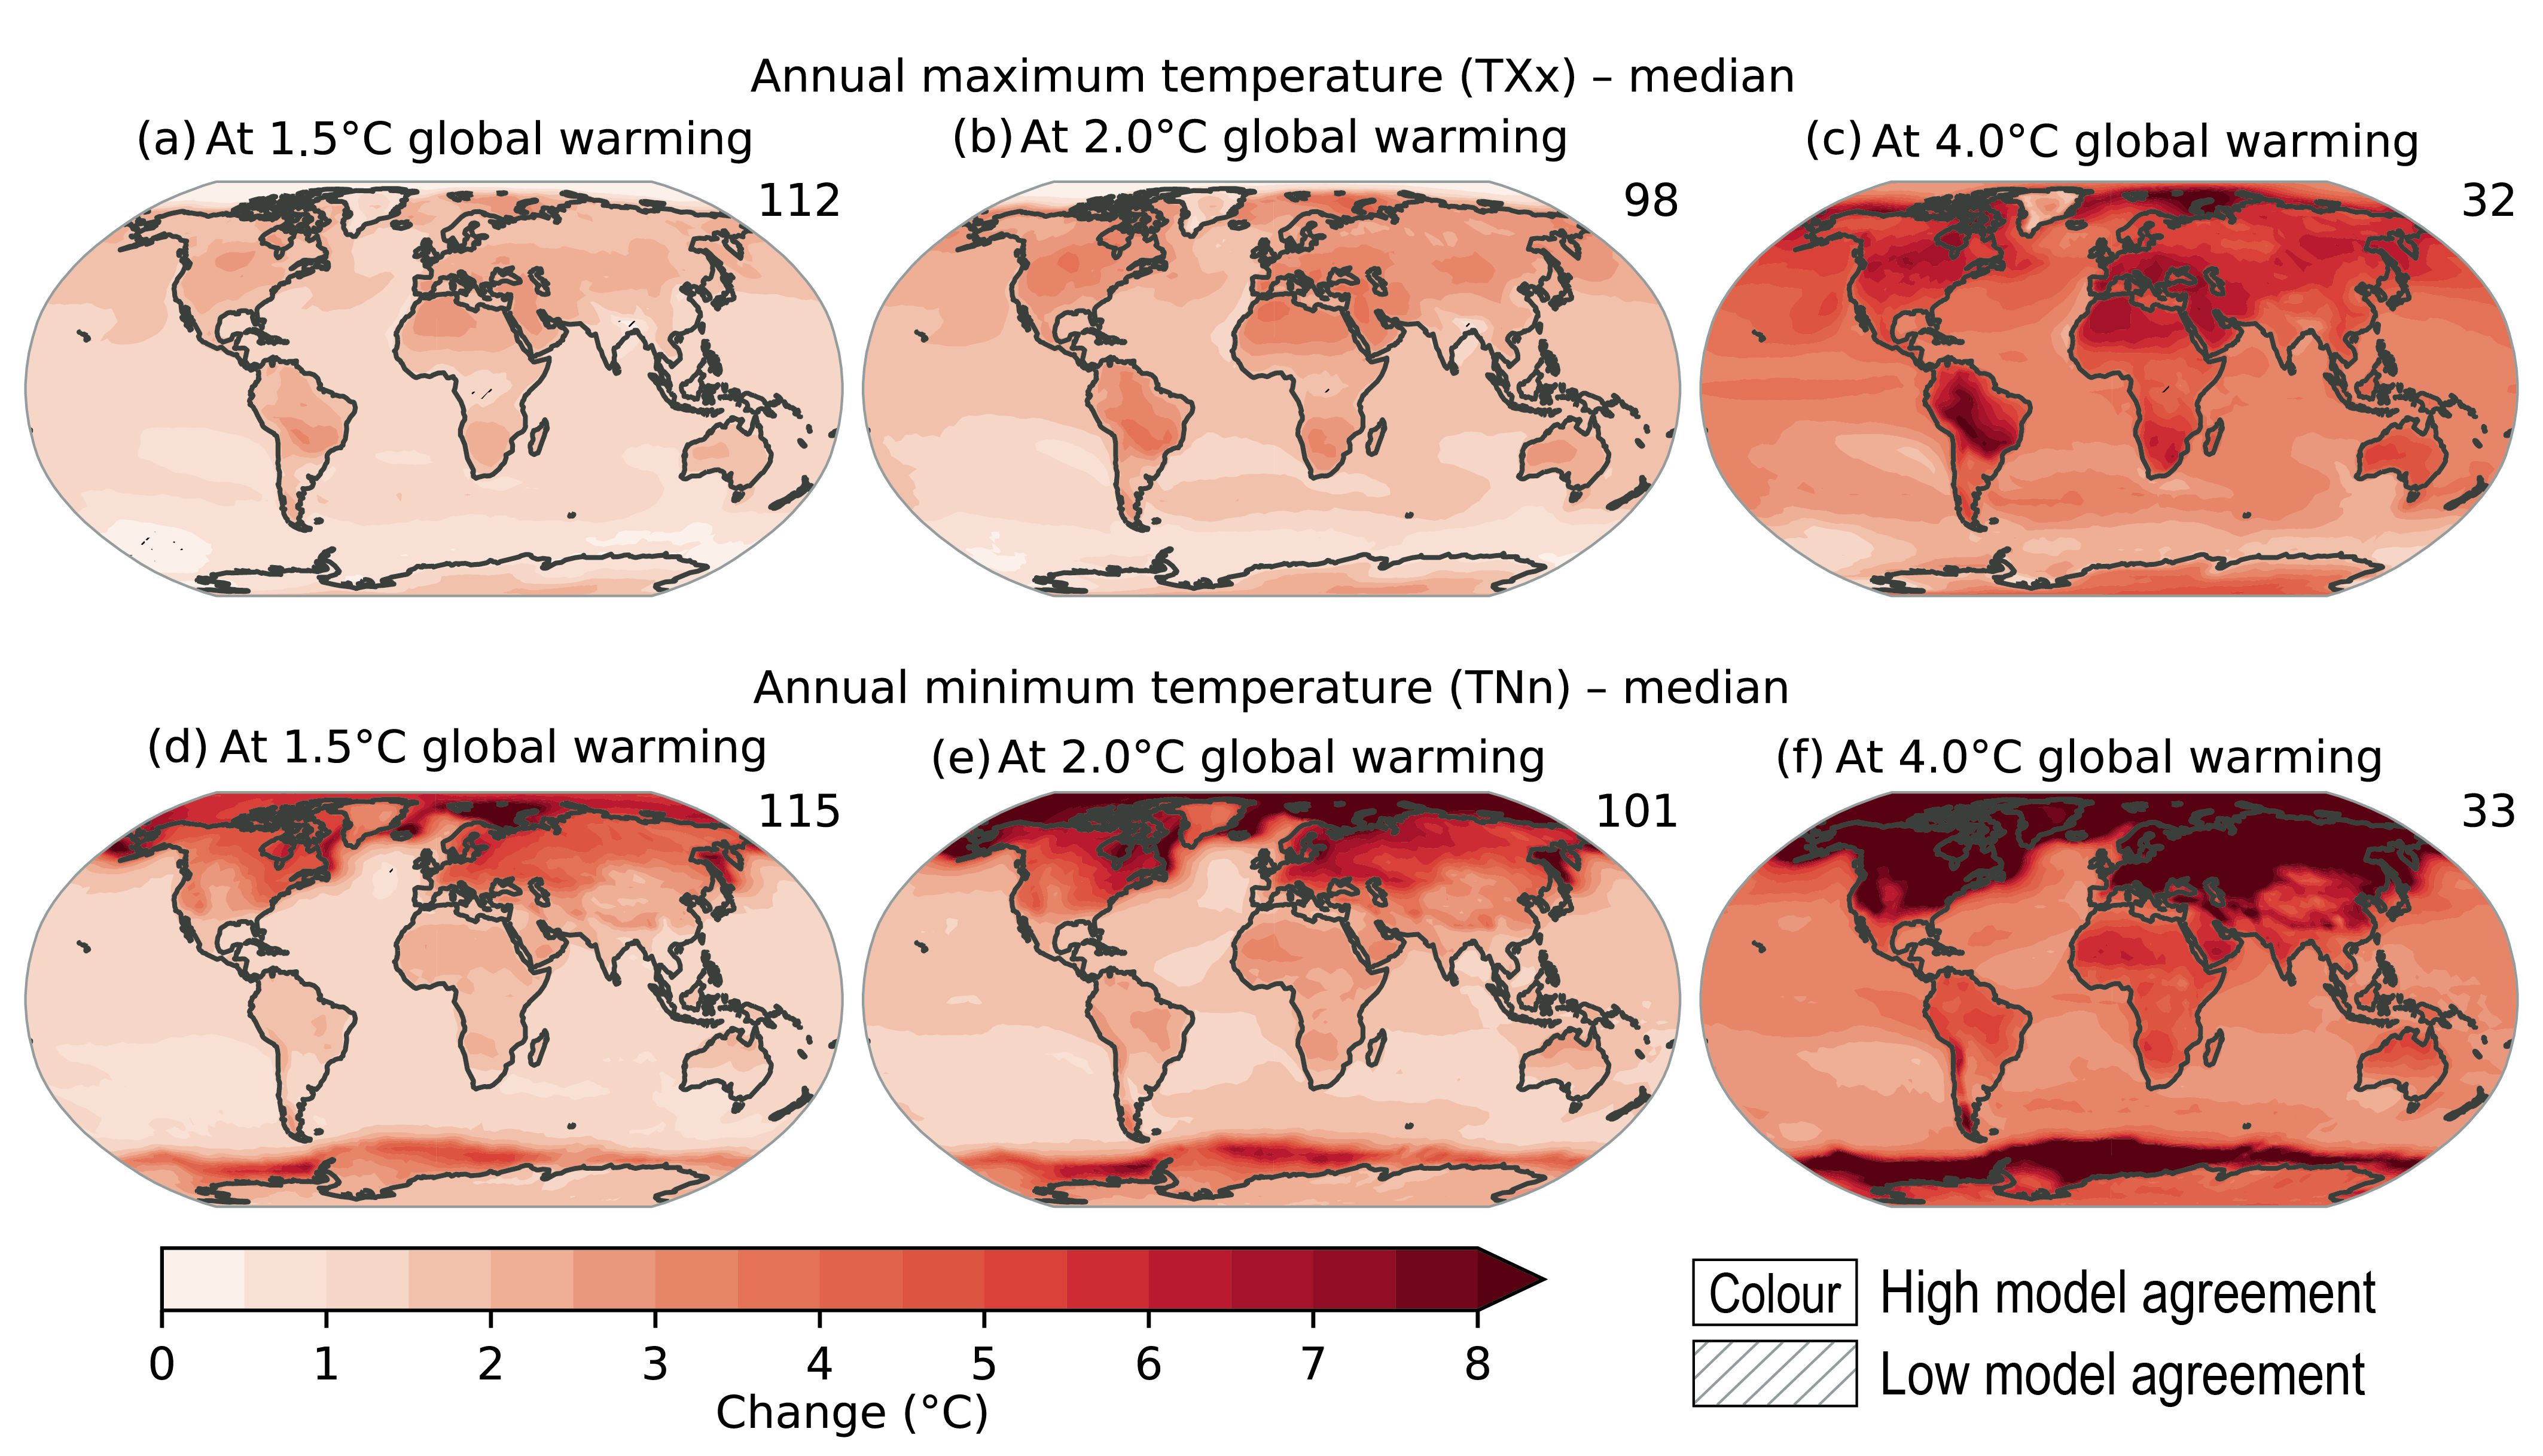 Figure 11.11 | Projected changes in (a–c) annual maximum temperature (TXx) and (d–f) annual minimum temperature (TNn) at 1.5°C, 2°C, and 4°C of global warming compared to the 1850–1900 baseline. Results are based on simulations from the Coupled Model Intercomparison Project Phase 6 (CMIP6) multi-model ensemble under the Shared Socio-economic Pathways (SSPs) SSP1-1.9, SSP1-2.6, SSP2-4.5, SSP3-7.0, and SSP5-8.5 scenarios. The numbers in the top right indicate the number of simulations included. Uncertainty is represented using the simple approach: no overlay indicates regions with high model agreement, where ≥80% of models agree on the sign of change; diagonal lines indicate regions with low model agreement, where <80% of models agree on the sign of change. For more information on the simple approach, please refer to the Cross-Chapter Box (Atlas 1. For details on the methods see Supplementary Material 11.SM.2. Changes in TXx and TNn are also displayed in the Interactive Atlas. Further details on data sources and processing are available in the chapter data table (Table 11.SM.9).
 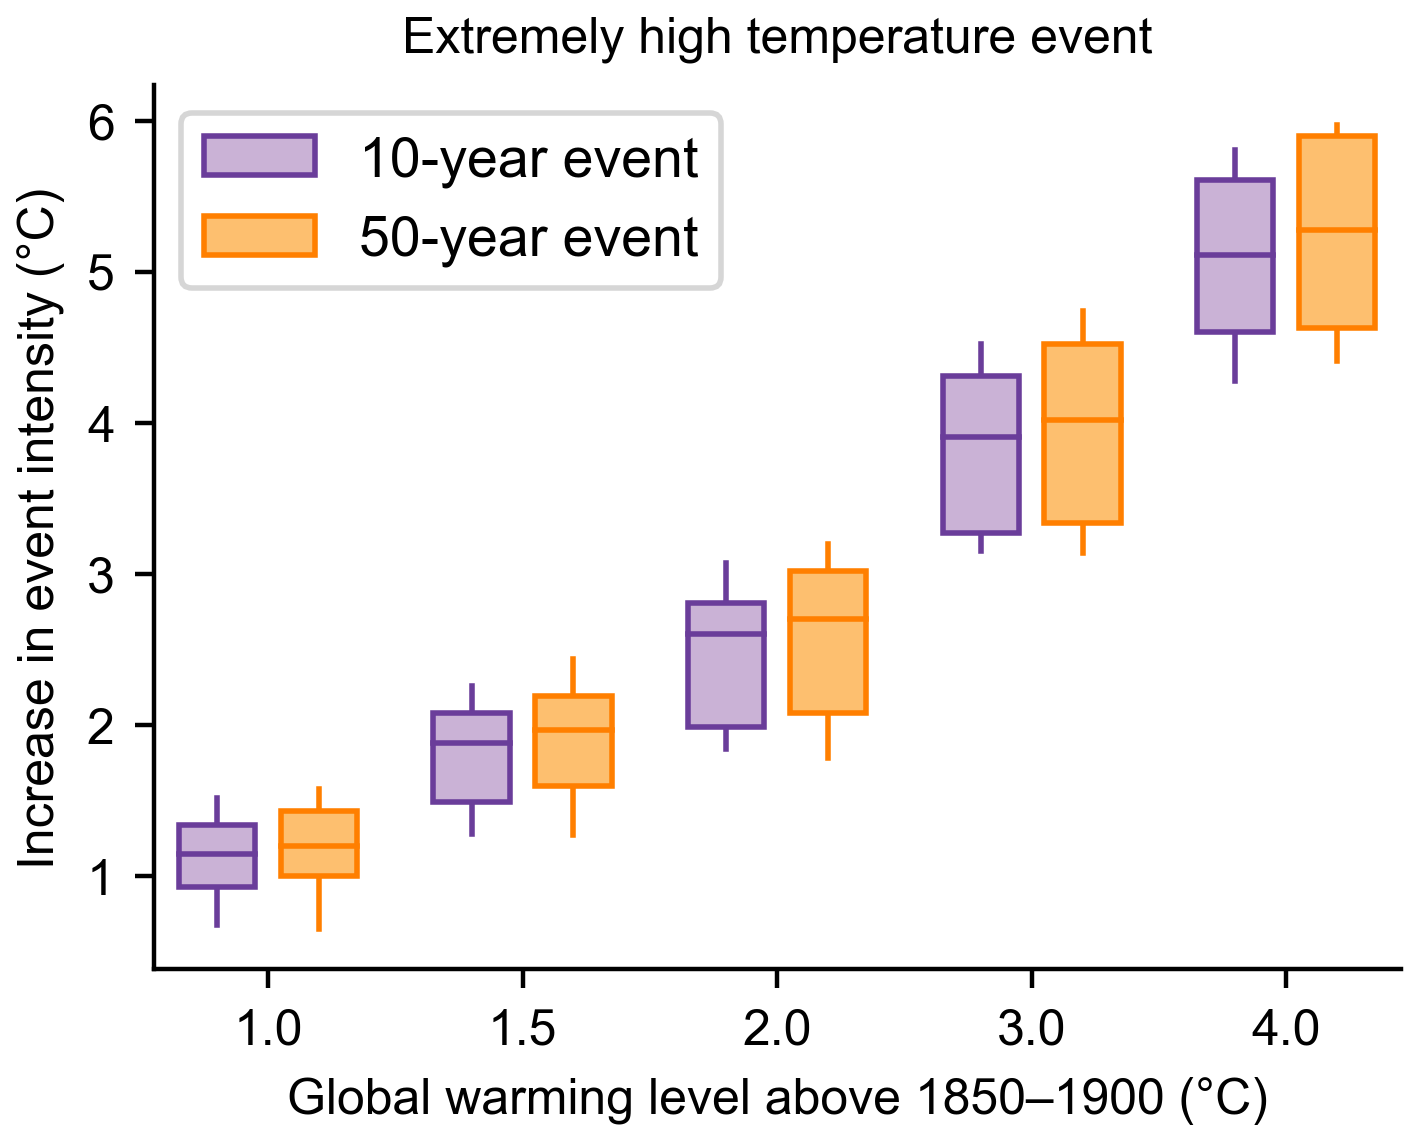 Figure 11.12 | Projected changes in the intensity of extreme temperature events under 1°C, 1.5°C, 2°C, 3°C, and 4°C global warming levels relative to the 1850–1900 baseline. Extreme temperature events are defined as the daily maximum temperatures (TXx) that were exceeded on average once during a 10-year period (10-year event, blue) and once during a 50-year period (50-year event, orange) during the 1850–1900 base period. Results are shown for the global land. For each box plot, the horizontal line and the box represent the median and central 66% uncertainty range, respectively, of the intensity changes across the multi-model ensemble, and the ‘whiskers’ extend to the 90% uncertainty range. The results are based on the multi-model ensemble from simulations of global climate models contributing to the Coupled Model Intercomparison Project Phase 6 (CMIP6) under different Shared Socio-economic Pathway forcing scenarios. Adapted from Li et al. (2021). Further details on data sources and processing are available in the chapter data table (Table 11.SM.9).
 Projected warming is larger for TNn and exhibits strong equator-to-pole amplification, similar to the warming of boreal winter mean temperatures. The warming of TXx is more uniform over land and does not exhibit this behaviour (Figure 11.11). The warming of temperature extremes on global and regional scales tends to scale linearly with global warming (Section 11.1.4; Fischer et al., 2014; Seneviratne et al., 2016; Wartenburger et al., 2017; Li et al., 2021; see also SR1.5, Chapter 3). In the mid-latitudes, the rate of warming of hot extremes can be as large as twice the rate of global warming (Figure 11.11). In the Arctic winter, the rate of warming of the temperature of the coldest nights is about three times the rate of global warming (Appendix, Figure 11.A.1). Projected changes in temperature extremes can deviate from projected changes in annual mean warming in the same regions (Figures 11.3, 11.A.1 and 11.A.2; Di Luca et al., 2020b; Wehner, 2020) due to the additional processes that control the response of regional extremes, including, in particular, soil moisture–evapotranspiration–temperature feedbacks for hot extremes in the mid-latitudes and subtropical regions, and snow/ice–albedo–temperature feedbacks in high-latitude regions.
The probability of exceeding a certain hot extreme threshold will increase, while those for cold extreme will decrease with global warming (B. Mueller et al., 2016; Lewis et al., 2017b; Suarez-Gutierrez et al., 2020b). The changes tend to scale nonlinearly with the level of global warming, with larger changes for more rare events (Section 11.2.4; Cross-Chapter Box 11.11; Figures 11.6 and 11.12; Fischer and Knutti, 2015; Kharin et al., 2018; Li et al., 2021). For example, the CMIP5 ensemble projects the frequency of the present-day climate 20-year hottest daily temperature to increase by 80% at the 1.5°C GWL and by 180% at the 2.0°C GWL, and the frequency of the present-day climate 100-year hottest daily temperature to increase by 200% and more than 700% at the 1.5°C and 2.0°C warming levels, respectively (Kharin et al., 2018). CMIP6 simulations project similar changes (Li et al., 2021).
Tebaldi and Wehner (2018) showed that, at the middle of the 21st century, 66% of the land surface area would experience the present-day 20-year return values of TXx and the running three-day average of the daily maximum temperature every other year, on average, under the Representative Concentration Pathway 8.5 (RCP8.5) scenario, as opposed to only 34% under RCP4.5. By the end of the century, these area fractions increase to 92% and 62%, respectively. Such nonlinearities in the characteristics of future regional extremes are shown, for instance, for Europe (Dosio and Fischer, 2018; Spinoni et al., 2018b; Lionello and Scarascia, 2020), Asia (Guo et al., 2017; Harrington and Otto, 2018b; King et al., 2018), and Australia (Lewis et al., 2017a) under various global warming thresholds. The nonlinear increase in fixed-threshold indices (e.g., based on a percentile for a given reference period, or on an absolute threshold) as a function of global warming is consistent with a linear warming of the absolute temperature of the temperature extremes (e.g., Whan et al., 2015). Compared to the historical climate, warming will result in strong increases in heatwave area, duration and magnitude (Vogel et al., 2020b). These changes are mostly due to the increase in mean seasonal temperature, rather than changes in temperature variability, though the latter can have an effect in some regions (Brown, 2020; Di Luca et al., 2020b; Suarez-Gutierrez et al., 2020a).
Projections of temperature-related extremes in RCMs in the CORDEX regions demonstrate robust increases under future scenarios and can provide information on finer spatial scales than GCMs (e.g., Coppola et al., 2021b). Five RCMs in the CORDEX–East Asia region project increases in the 20-year return values of temperature extremes (summer maxima), with models that exhibit warm biases projecting stronger warming (Park and Min, 2019). Similarly, in the African domain, future increases in TX90p and TN90p are projected (Dosio, 2017; Mostafa et al., 2019). This regional-scale analysis provides fine-scale information, such as distinguishing the increase in TX90p over sub-equatorial Africa (Democratic Republic of the Congo, Angola, and Zambia) with values over the Gulf of Guinea, Central African Republic, South Sudan, and Ethiopia. Empirical statistical downscaling has also been used to produce more robust estimates for future heatwaves compared to RCMs based on large multi-model ensembles (Furrer et al., 2010; Keellings and Waylen, 2014; Wang et al., 2015; Benestad et al., 2018).
In all continental regions, including Africa (Table 11.4), Asia (Table 11.7), Australasia (Table 11.10), Central and South America (Table 11.13), Europe (Table 11.16), North America (Table 11.19) and at the continental scale, it is very likely that the intensity and frequency of hot extremes will increase and the intensity and frequency of cold extremes will decrease compared with the 1995–2014 baseline, even under 1.5°C global warming. Those changes are virtually certain to occur under 4°C global warming. At the regional scale, and for almost all AR6 regions, it is likely that the intensity and frequency of hot extremes will increase and the intensity and frequency of cold extremes will decrease compared with the 1995–2014 baseline, even under 1.5°C global warming. Those changes are virtually certain to occur under 4°C global warming. Exceptions include lower confidence in the projected decrease in the intensity and frequency of cold extremes compared with the 1995–2014 baseline under 1.5°C of global warming (medium confidence) and 4°C of global warming (very likely) in Northern Central America, Central North America, and Western North America.
In Africa (Table 11.4), evidence includes increases in the intensity and frequency of hot extremes, such as warm days, warm nights, and heatwaves, and decreases in the intensity and frequency of cold extremes, such as cold days and cold nights over the continent, as projected by CMIP5, CMIP6, and CORDEX simulations (Giorgi et al., 2014; Engelbrecht et al., 2015; Lelieveld et al., 2016; Russo et al., 2016; Dosio, 2017; Bathiany et al., 2018; Mba et al., 2018; Nangombe et al., 2018; Weber et al., 2018; Kruger et al., 2019; Coppola et al., 2021b; Li et al., 2021). Cold spells are projected to decrease under all RCPs, and even at low warming levels in Western and Central Africa (Diedhiou et al., 2018). The number of cold days is projected to decrease in East Africa (Ongoma et al., 2018b).
In Asia (Table 11.7), evidence includes increases in the intensity and frequency of hot extremes, such as warm days, warm nights, and heatwaves, and decreases in the intensity and frequency of cold extremes, such as cold days and cold nights over the continent, as projected by CMIP5, CMIP6, and CORDEX simulations (Sillmann et al., 2013b; Zhou et al., 2014; R. Zhang et al., 2015; Zhao et al., 2015; Pal and Eltahir, 2016; Singh and Goyal, 2016; Xu et al., 2017; Gao et al., 2018; Han et al., 2018; Shin et al., 2018; Sui et al., 2018; L. Li et al., 2019; Zhu et al., 2020). More intense heatwaves of longer durations and occurring at a higher frequency are projected over India (Murari et al., 2015; Mishra et al., 2017) and Pakistan (Nasim et al., 2018). Future mid-latitude warm extremes, similar to those experienced during the 2010 event, are projected to become more extreme, with temperature extremes increasing potentially by 8.4°C (RCP8.5) over north-west Asia (van der Schrier et al., 2018). Over West and East Siberia, and Russian Far East, an increase in extreme heat durations is expected in all scenarios (Sillmann et al., 2013b; Kattsov et al., 2017; Reyer et al., 2017). In the MENA regions (Arabian Peninsula and Western Central Asia), extreme temperatures could increase by almost 7°C by 2100 under RCP8.5 (Lelieveld et al., 2016).
In Australasia (Table 11.10), evidence includes increases in the intensity and frequency of hot extremes, such as warm days, warm nights, and heatwaves, and decreases in the intensity and frequency of cold extremes, such as cold days and cold nights over the continent, as projected by CMIP5, CMIP6, and CORDEX simulations (CSIROand BOM, 2015; Alexander and Arblaster, 2017; Lewis et al., 2017a; Herold et al., 2018; Coppola et al., 2021b; Evans et al., 2021). Over most of Australia, increases in the intensity and frequency of hot extremes are projected to be predominantly driven by the long-term increase in mean temperatures (Di Luca et al., 2020b). Future projections indicate a decrease in the number of frost days regardless of the region and season considered (Alexander and Arblaster, 2017; Herold et al., 2018).
In Central and South America (Table 11.13), evidence includes increases in the intensity and frequency of hot extremes, such as warm days, warm nights, and heatwaves, and decreases in the intensity and frequency of cold extremes, such as cold days and cold nights over the continent, as projected by CMIP5, CMIP6, and CORDEX simulations (Chou et al., 2014a; Cabré et al., 2016; López-Franca et al., 2016; Stennett-Brown et al., 2017; Coppola et al., 2021b; Li et al., 2021; Vichot-Llano et al., 2021). Over South-Eastern South America during the austral summer, the increase in the frequency of TN90p is larger than that projected for TX90p, consistent with observed past changes (López-Franca et al., 2016). Under RCP8.5, the number of heatwave days are projected to increase for the intra-Americas region for the end of the 21st century (Angeles-Malaspina et al., 2018). A general decrease in the frequency of cold spells and frost days is projected, as indicated by several indices based on minimum temperature (López-Franca et al., 2016).
In Europe (Table 11.16), evidence includes increases in the intensity and frequency of hot extremes, such as warm days, warm nights, and heatwaves, and decreases in the intensity and frequency of cold extremes, such as cold days and cold nights over the continent, as projected by CMIP5, CMIP6, and CORDEX simulations (Lau and Nath, 2014; Ozturk et al., 2015; Russo et al., 2015; Schoetter et al., 2015; Vogel et al., 2017; Winter et al., 2017; Jacob et al., 2018; Lhotka et al., 2018; Rasmijn et al., 2018; Suarez-Gutierrez et al., 2018; Cardoso et al., 2019; Lionello and Scarascia, 2020; Molina et al., 2020; Coppola et al., 2021b; Li et al., 2021). Increases in heatwaves are greater over the southern Mediterranean and Scandinavia (Forzieri et al., 2016; Abaurrea et al., 2018; Dosio and Fischer, 2018; Rohat et al., 2019). Thebiggest increases in the number of heatwave days are expected for southern European cities (Guerreiro et al., 2018a; Junk et al., 2019), and Central European cities will see the biggest increases in maximum heatwave temperatures (Guerreiro et al., 2018a).
In North America (Table 11.19), evidence includes increases in the intensity and frequency of hot extremes, such as warm days, warm nights, and heatwaves, and decreases in the intensity and frequency of cold extremes, such as cold days and cold nights over the continent, as projected by CMIP5, CMIP6, and CORDEX simulations (Grotjahn et al., 2016; Vose et al., 2017; Alexandru, 2018; C. Li et al., 2018, 2021; C. Yang et al., 2018; X. Zhang et al., 2019; Coppola et al., 2021b). Projections of temperature extremes for the end of the 21st century show that warm days and nights are very likely to increase, and cold days and nights are very likely to decrease in all regions. There is medium confidence in large increases in warm days and warm nights in summer, particularly over the USA, and in large decreases in cold days in Canada in autumn and winter (Grotjahn et al., 2016; Vose et al., 2017; Alexandru, 2018; C. Li et al., 2018, 2021; C. Yang et al., 2018; X. Zhang et al., 2019; Coppola et al., 2021b). Minimum winter temperatures are projected to rise faster than mean winter temperatures (Underwood et al., 2017). Projections for the end of the century under RCP8.5 showed the four-day cold spell that happens on average once every five years is projected to warm by more than 10°C. CMIP5 models do not project current 1-in-20-year annual minimum temperature extremes to recur over much of the continent (Wuebbles et al., 2014).
In summary, it is virtually certain that further increases in the intensity and frequency of hot extremes, and decreases in the intensity and frequency of cold extremes, will occur throughout the 21st century and around the world. It is virtually certain that the number of hot days and hot nights and the length, frequency, and/or intensity of warm spells or heatwaves compared to 1995–2014 will increase over most land areas. In most regions, changes in the magnitude of temperature extremes are proportional to global warming levels (high confidence). The highest increase of temperature of hottest days is projected in some mid-latitude and semi-arid regions, at about 1.5 times to twice the rate of global warming (high confidence). The highest increase of temperature of coldest days is projected in Arctic regions, at about three times the rate of global warming (high confidence). The probability of temperature extremes generally increases nonlinearly with increasing global warming levels (high confidence). Confidence in assessments depends on the spatial and temporal scales of the extreme in question, with high confidence in projections of temperature-related extremes at global and continental scales for daily to seasonal scales. There is high confidence that, on land, the magnitude of temperature extremes increases more strongly than global mean temperature.
11.4 Heavy Precipitation
This section assesses changes in heavy precipitation at global and regional scales. The main focus is on extreme precipitation at a daily scale where literature is most concentrated, though extremes of shorter (sub-daily) and longer (five-day or more) durations are also assessed to the extent the literature allows.
11.4.1 Mechanisms and Drivers
The SREX (Chapter 3, Seneviratne et al., 2012) assessed changes in heavy precipitation in the context of the effects of thermodynamic and dynamic changes. Box 11.1 assesses thermodynamic and dynamic changes in a warming world to aid the understanding of changes in observations and projections in some extremes and the sources of uncertainties (see also Section 8.2.3.2). In general, warming increases the atmospheric water-holding capacity following the Clausius–Clapeyron (C-C) relation. This thermodynamic effect results in an increase in extreme precipitation at a similar rate at the global scale. On a regional scale, changes in extreme precipitation are further modulated by dynamic changes (Box 11.1).
Large-scale modes of variability, such as the North Atlantic Oscillation (NAO), El Niño–Southern Oscillation (ENSO), Atlantic Multi-decadal Variability (AMV), and Pacific Decadal Variability (PDV) (Annex IV), modulate precipitation extremes through changes in environmental conditions or embedded storms (Section 8.3.2). Latent heating can invigorate these storms (Nie et al., 2018; Z. Zhang et al., 2019a); changes in dynamics can increase precipitation intensity above that expected from the C-C scaling rate (Sections 8.2.3.2 and 11.7; Box 11.1). Additionally, the efficiency of converting atmospheric moisture into precipitation can change as a result of cloud microphysical adjustment to warming,resulting in changes in the characteristics of extreme precipitation; but changes in precipitation efficiency in a warming world are highly uncertain (Sui et al., 2020).
It is difficult to separate the effect of global warming from internal variability inthe observed changes in the modes of variability (Section 2.4). Future projections of modes of variability are highly uncertain Section 4.3.3),resulting in uncertainty in regional projections of extreme precipitation. Future warming may amplify monsoonal extreme precipitation. Changes in extreme storms, including tropical/extratropical cyclones and severe convective storms, result in changes in extreme precipitation (Section 11.7). Also, changes in sea surface temperatures (SSTs) alter land–sea contrast, leading to changes in precipitation extremes near coastal regions. For example, the projected larger SST increase near the coasts of East Asia and India can result in heavier rainfall near these coastal areas from tropical cyclones (Mei and Xie, 2016) or torrential rains (Manda et al., 2014). The warming in the western Indian Ocean is associated with increases in moisture surges on the low-level monsoon westerlies towards the Indian subcontinent, which may lead to an increase in the occurrence of precipitation extremes over central India (Krishnan et al., 2016; Roxy et al., 2017).
Decreases in atmospheric aerosols results in warming and thus an increase in extreme precipitation (Samset et al., 2018; Sillmann et al., 2019). Changes in atmospheric aerosols also result in dynamic changes such as in tropical cyclones (Takahashi et al., 2017; Strong et al., 2018). Uncertainty in the projections of future aerosol emissions results in additional uncertainty in the heavy precipitation projections of the 21st century (Lin et al., 2016).
There has been new evidence of the effect of local land-use and land-cover change on heavy precipitation. There is a growing set of literature linking increases in heavy precipitation in urban centres to urbanization (Argüeso et al., 2016; Y. Zhang et al., 2019b). Urbanization intensifies extreme precipitation, especially in the afternoon and early evening, over the urban area and its downwind region (medium confidence) (Box 10.3). There are four possible mechanisms: (i) increases in atmospheric moisture due to horizontal convergence of air associated with the urban heat island effect (Shastri et al., 2015; Argüeso et al., 2016); (ii) increases in condensation due to urban aerosol emissions (Han et al., 2011; Sarangi et al., 2017); (iii) aerosol pollution that impacts cloud microphysics (Box 8.1; Schmid and Niyogi, 2017); and (iv) urban structures that impede atmospheric motion (Shepherd, 2013; Ganeshan and Murtugudde, 2015; Paul et al., 2018). Other local forcing, including reservoirs (Woldemichael et al., 2012), irrigation (Devanand et al., 2019), or large-scale land-use and land-cover change (Odoulami et al., 2019), can also affect local extreme precipitation.
In summary, precipitation extremes are controlled by both thermodynamic and dynamic processes. Warming-induced thermodynamic change results in an increase in extreme precipitation, at a rate that closely follows the C-C relationship at the global scale (high confidence). The effects of warming-induced changes in dynamic drivers on extreme precipitation are more complicated, difficult to quantify, and are an uncertain aspect of projections. Precipitation extremes are also affected by forcings other than changes in greenhouse gases, including changes in aerosols, land-use and land-cover change, and urbanization (medium confidence).
11.4.2 Observed Trends
Both SREX (Chapter 3, Seneviratne et al., 2012) and AR5 (IPCC, 2014 Chapter 2) concluded it was likely that the number of heavy precipitation events over land had increased in more regions than it had decreased, though there were wide regional and seasonal variations, and trends in many locations were not statistically significant. This assessment has been strengthened with multiple studies findingrobust evidence of the intensification of extreme precipitation at global and continental scales, regardless of spatial and temporal coverage of observations and the methods of data processing and analysis.
The average annual maximum precipitation amount in a day (Rx1day) has significantly increased since the mid-20th century over land (Du et al., 2019; Dunn et al., 2020) and in the humid and dry regions of the globe (Dunn et al., 2020). The percentage of observing stations with statistically significant increases in Rx1day is larger than expected by chance, while the percentage of stations with statistically significant decreases is smaller than expected by chance, over the global land as a whole and over North America, Europe, and Asia (Figure 11.13; Sun et al., 2021) and over global monsoon regions (Zhang and Zhou, 2019) where data coverage is relatively good. The addition of the past decade of observational data shows a more robust increase in Rx1day over the global land region (Sun et al., 2021). Light, moderate, and heavy daily precipitation has all intensified in a gridded daily precipitation dataset (Contractor et al., 2020a). Daily mean precipitation intensities have increased since the mid-20th century in a majority of land regions (high confidence) (Section 8.3.1.3). The probability of precipitation exceeding 50 mm/day increased during 1961–2018 (Benestad et al., 2019). The globally averaged annual fraction of precipitation from days in the top 5% (R95pTOT) has also significantly increased (Dunn et al., 2020). The increase in the magnitude of Rx1day in the 20th century is estimated to be at a rate consistent with C-C scaling with respect to global mean temperature (Fischer and Knutti, 2016; Sun et al., 2021). Studies on past changes in extreme precipitation of durations longer than a day are more limited, though there are some studies examining long-term trends in annual maximum five-day precipitation (Rx5day). On global and continental scales, long-term changes in Rx5day are similar to those of Rx1day in many aspects (Zhang and Zhou 2019; Sun et al., 2021). As discussed below, at the regional scale, changes in Rx5day are also similar to those of Rx1day where there are analyses of changes in both Rx1day and Rx5day.
 Figure 11.13 | Signs and significance of the observed trends in annual maximum daily precipitation (Rx1day) during 1950–2018 at 8345 stations with suficient data. (a) Percentage of stations with statistically significant trends in Rx1day; green dots show positive trends and brown dots negative trends. Box and ‘whisker’ plots indicate the expected percentage of stations with significant trends due to chance estimated from 1000 bootstrap realizations under a no-trend null hypothesis. The boxes mark the median, 25th percentile, and 75th percentile. The upper and lower whiskers show the 97.5th and the 2.5th percentiles, respectively. Maps of stations with positive (b) and negative (c) trends. The light colour indicates stations with non-significant trends, and the dark colour stations with significant trends. Significance is determined by a two-tailed test conducted at the 5% level. Adapted from Sun et al. (2021). Figure copyright © American Meteorological Society (used with permission). Further details on data sources and processing are available in the chapter data table (Table 11.SM.9).
 Overall, there is a lack of systematic analysis of long-term trends in sub-daily extreme precipitation at the global scale. Often, sub-daily precipitation data have only sporadic spatial coverage and are of limited length. Additionally, the available data records are far shorter than needed for a robust quantification of past changes in sub-daily extreme precipitation (C. Li et al., 2019a). Despite these limitations, there are studies in regions of almost all continents that generally indicate intensification of sub-daily extreme precipitation, although there remains low confidence in an overall increase at the global scale. Studies include an increase in extreme sub-daily rainfall in summer over South Africa (Sen Roy and Rouault, 2013), annually in Australia (Guerreiro et al., 2018b), over 23 urban locations in India (Ali and Mishra, 2018), in Peninsular Malaysia (Syafrina et al., 2015), and in eastern China in the summer season during 1971–2013 (Xiao et al., 2016). In some regions in Italy (Arnone et al., 2013; Libertino et al., 2019) and in the USA during 1950–2011 (Barbero et al., 2017), there is also an increase. In general, an increase in sub-daily heavy precipitation results in an increase in pluvial floods over smaller watersheds (Ghausi and Ghosh, 2020).
There is a considerable body of literature examining scaling of sub-daily precipitation extremes, conditional on day-to-day air or dew-point temperatures (Westra et al., 2014; Fowler et al., 2021). This scaling, also termed ‘apparent scaling’ (Fowler et al., 2021), is robust when different methodologies are used in different regions, ranging between the C-C and two-times the C-C rate (e.g., Formayer and Fritz, 2017; Lenderink et al., 2017; Burdanowitz et al., 2019). This is confirmed when sub-daily precipitation data collected from multiple continents (Lewis et al., 2019) are analysed in a consistent manner using different methods (Ali et al., 2021). It has been hoped that apparent scaling might be used to help understand past and future changes in extreme sub-daily precipitation. However, apparent scaling samples multiple synoptic weather states, mixing thermodynamic and dynamic factors that are not directly relevant for climate change responses (Section 8.2.3.2; Prein et al., 2016b; Bao et al., 2017; X. Zhang et al., 2017; Drobinski et al., 2018; Sun et al., 2020). The spatial pattern of apparent scaling is different from those of projected changes over Australia (Bao et al., 2017) and North America (Sun et al., 2020) in regional climate model simulations. It thus remains difficult to use the knowledge about apparent scaling to infer past and future changes in extreme sub-daily precipitation according to observed and projected changes in local temperature.
In Africa (Table 11.5), evidence shows an increase in extreme daily precipitation for the late half of the 20th century over the continent where data are available; there is a larger percentage of stations showing significant increases in extreme daily precipitation than decreases (Sun et al., 2021). There are increases in different metrics relevant to extreme precipitation in various regions of the continent (Chaney et al., 2014; Harrison et al., 2019; Dunn et al., 2020; Sun et al., 2021). There is an increase in extreme precipitation events in Southern Africa (Weldon and Reason, 2014; Kruger et al., 2019) and a general increase in heavy precipitation over East Africa, the Greater Horn of Africa (Omondi et al., 2014). Over sub-Saharan Africa, increases in the frequency and intensity of extreme precipitation have been observed over the well-gauged areas during 1950–2013; however, this covers only 15% of the total area of sub-Saharan Africa (Harrison et al., 2019). There is medium confidence about the increase in extreme precipitation for some regions where observations are more abundant, but for Africa as whole, there is low confidence because of a general lack of continent-wide systematic analysis, the sporadic nature of available precipitation data over the continent, and spatially non-homogenous trends in places where dataare available (Donat et al., 2014a; Mathbout et al., 2018b; Alexander et al., 2019; Funk et al., 2020).
In Asia (Table 11.8), there is robust evidence that extreme precipitation has increased since the 1950s (high confidence), however, this is dominated by high spatial variability. Increases in Rx1day and Rx5day during 1950–2018 are found over two-thirds of stations. The percentage of stations with statistically significant trends is larger than can be expected by chance (Figure 11.13; Sun et al., 2021). An increase in extreme precipitation has also been observed in various regional studies based on different metrics of extreme precipitation and spatial and temporal coverage of the data. These include an increase in daily precipitation extremes over central Asia (Hu et al., 2016), most of South Asia (Zahid and Rasul, 2012; Pai et al., 2015; Sheikh et al., 2015; Adnan et al., 2016; Malik et al., 2016; Dimri et al., 2017; Priya et al., 2017; Roxy et al., 2017; Hunt et al., 2018; Kim et al., 2019; Wester et al., 2019), the Arabian Peninsula (Rahimi and Fatemi, 2019; Almazroui and Saeed, 2020; Atif et al., 2020), South East Asia (Siswanto et al., 2015; Supari et al., 2017; Cheong et al., 2018); the north-west Himalaya (Malik et al., 2016), parts of East Asia (Baeket al., 2017; Nayak et al., 2017; Ye and Li, 2017), the western Himalayas since the 1950s (Ridley et al., 2013; Dimri et al., 2015; Madhura et al., 2015), West and East Siberia, and Russian Far East (Donat et al., 2016a). A decrease was found over the eastern Himalayas (Sheikh et al., 2015; Talchabhadel et al., 2018). Increases have been observed over Jakarta (Siswanto et al., 2015), but Rx1day over most parts of the Maritime Continent has decreased (Villafuerte and Matsumoto, 2015). Trends in extreme precipitation over China are mixed with increases and decreases (G. Fu et al., 2013; Jiang et al., 2013; Ma et al., 2015; Yin et al., 2015; Xiao et al., 2016) and are not significant over China as whole (Jiang et al., 2013; Hu et al., 2016; Ge et al., 2017; Deng et al., 2018; He and Zhai, 2018; W. Li et al., 2018a; Tao et al., 2018; M. Liu et al., 2019b; Chen et al., 2021). With few exceptions, most South East Asian countries have experienced an increase in rainfall intensity, but with a reduced number of wet days (Donat et al., 2016a; Cheong et al., 2018; Naveendrakumar et al., 2019), though large differences in trends exists if the trends are estimated from different datasets, including gauge-based, remotely sensed, and reanalysis data, over a relatively short period (Kim et al., 2019). There is a significant increase in heavy rainfall (>100 mm day–1) and a significant decrease in moderate rainfall (5–100 mm day–1) in central India during the South Asian monsoon season (Deshpande et al., 2016; Roxy et al., 2017).
In Australasia (Table 11.11), available evidence has not shown an increase or a decrease in heavy precipitation over Australasia as a whole (medium confidence), but heavy precipitation tends to increase over Northern Australia (particularly the north-west) and decrease over the eastern and southernregions (e.g., Jakob and Walland, 2016; Guerreiro et al., 2018b; Dey et al., 2019b; Dunn et al., 2020; Sun et al., 2021). Available studies that used long-term observations since the mid-20th century showed nearly as many stations with an increase as those with a decrease in heavy precipitation (Jakob and Walland, 2016) or slightly more stations with a decrease than with an increase in Rx1day and Rx5day (Sun et al., 2021), or strong differences in Rx1day trends with increases over Northern Australia and Central Australia in general, but mostly decreases over Southern Australia and Eastern Australia (Dunn et al., 2020). Over New Zealand, decreases are observed for moderate–heavy precipitation events, but there are no significant trends for very heavy events (more than 64 mm in a day) for the period 1951–2012. The number of stations with an increase in very wet days is similar to that with a decrease during 1960–2019 (MfE and Stats NZ, 2020). Overall, there is low confidence in trends in the frequency of heavy rain days, with mostly decreases over New Zealand (Harringtonand Renwick, 2014; Caloiero, 2015).
In Central and South America (Table 11.14), evidence shows an increase in extreme precipitation, but in general there is low confidence; while continent-wide analyses produced wetting trends are not robust. Rx1day increased at more stations than it decreased in South America between 1950 and 2018 (Sun et al., 2021). Over the period 1950–2010, both Rx5day and R99p increased over large regions of South America, including North-Western South America, Northern South America, and South-Eastern South America (Skansi et al., 2013). There are large regional differences. A decrease in daily extreme precipitation is observed in north-eastern Brazil (Skansi et al., 2013; Bezerra et al., 2018; Dereczynski et al., 2020). Trends in extreme precipitation indices were not statistically significant over the period 1947–2012 within the São Francisco River basin in the Brazilian semi-arid region (Bezerra et al., 2018). An increase in extreme rainfall is observed in the Amazon with medium confidence (Skansi et al., 2013) and in South-Eastern South America with high confidence (Skansi et al., 2013; Valverde and Marengo, 2014; Barros et al., 2015; Ávila et al., 2016; Wu and Polvani, 2017; Lovino et al., 2018; Dereczynski et al., 2020). Among all sub-regions, South-Eastern South America shows the highest rate of increase for rainfall extremes, followed by the Amazon (Skansi et al., 2013). Increases in the intensity of heavy daily rainfall events have been observed in the southern Pacific and in the Titicaca basin (Skansi et al., 2013; Huerta and Lavado‐Casimiro, 2021). In Southern Central America, trends in annual precipitation are generally not significant, although small (but significant) increases are found in Guatemala, El Salvador, and Panama (Hidalgo et al., 2017). Small positive trends were found in multiple extreme precipitation indices over the Caribbean region over a short time period (1986–2010) (Stephenson et al., 2014; McLean et al., 2015).
In Europe (Table 11.17), there is robust evidence that the magnitude and intensity of extreme precipitation has very likely increased since the 1950s. There is a significant increase in Rx1day and Rx5day during 1950–2018 in Europe as a whole (Sun et al., 2021, also Figure 11.13). The number of stations with increases far exceeds those with decreases in the frequency of daily rainfall exceeding its 90th or 95th percentile in century-long series (Cioffi et al., 2015). The five-, 10-, and 20-year events of one-day and five-day precipitation during 1951–1960 became more common since the 1950s (van den Besselaar et al., 2013). There can be large discrepancies among studies and regions and seasons (Croitoru et al., 2013; Willems, 2013; Casanueva et al., 2014; Roth et al., 2014; Fischer et al., 2015); evidence for increasing extreme precipitation is more frequently observed for summer and winter, but not in other seasons (Madsen et al., 2014; Helama et al., 2018). An increase is observed in central Europe (Volosciuk et al., 2016; Zeder and Fischer, 2020), and in Romania (Croitoru et al., 2016). Trends in the Mediterranean region are in general not spatially consistent (Reale and Lionello, 2013), with decreases in the western Mediterranean and some increases in the eastern Mediterranean (Rajczak et al., 2013; Casanueva et al., 2014; de Lima et al., 2015; Gajić-Čapka et al., 2015; Sunyer et al., 2015; Pedron et al., 2017; Serrano-Notivoli et al., 2018; Ribes et al., 2019). In the Netherlands, the total precipitation contributed from extremes higher than the 99th percentile doubles per 1°C increase in warming (Myhre et al., 2019), though extreme rainfall trends in Northern Europe may differ in different seasons (Irannezhad et al., 2017).
In North America (Table 11.20), there is robust evidence that the magnitude and intensity of extreme precipitation has very likely increased since the 1950s. Both Rx1day and Rx5day have significantly increased in North America during 1950–2018 (Sun et al., 2021, also Figure 11.13). There is, however, regional diversity. In Canada, there is a lack of detectable trends in observed annual maximum daily (or shorter duration) precipitation (Shephard et al., 2014; Mekis et al., 2015; Vincent et al., 2018). In the USA, there is an overall increase in one-day heavy precipitation, both in terms of intensity and frequency (Villarini et al.,2012; Donat et al., 2013b; Wu, 2015; Easterling et al., 2017; H. Huang et al., 2017; Howarth et al., 2019; Sun et al., 2021), except for the southern USA (Hoerling et al., 2016) where internal variability may have played a substantial role in the lack of observed increases. In Mexico, increases are observed in R10mm and R95p (Donat et al., 2016a), very wet days over the cities (García-Cueto et al., 2019) and in total precipitation (PRCPTOT) and Rx1day (Donat et al., 2016b).
In Small Islands, there is a lack of evidence showing changes in heavy precipitation overall. There were increases in extreme precipitation in Tobago from 1985–2015 (Stephenson et al., 2014; Dookie et al., 2019) and decreases in south-western French Polynesia and the southern subtropics (low confidence) (Table 11.5; Atlas.10). Extreme precipitation leading to flooding in the Small Islands has been attributed in part to tropical cyclones, as well as being influenced by ENSO (Box 11.5; Khouakhi et al., 2016; Hoegh-Guldberg et al., 2018).
In summary, the frequency and intensity of heavy precipitation have likely increased at the global scale over a majority of land regions with good observational coverage. Since 1950, the annual maximum amount of precipitation falling in a day, or over five consecutive days, has likely increased over land regions with sufficient observational coverage for assessment, with increases in more regions than there are decreases. Heavy precipitation has likely increased on the continental scale over three continents (North America, Europe, and Asia) where observational data are more abundant. There is very low confidence about changes in sub-daily extreme precipitation due to the limited number of studies and available data.
11.4.3 Model Evaluation
Evaluating climate model competence in simulating heavy precipitation extremes is challenging due to a number of factors, including the lack of reliable observations and the spatial scale mismatch between simulated andobserved data (Avila et al., 2015; Alexander et al., 2019). Simulated precipitation represents areal means, but station-based observations are conducted at point locations and are often sparse. The areal-reduction factor, the ratio between pointwise station estimates of extreme precipitation and extremes of the areal mean, can be as large as 130% at CMIP6 resolutions (about 100 km) (Gervais et al., 2014). Hence, the order in which gridded station based extreme values are constructed (i.e., if the extreme values are extracted at the station first and then gridded, or if the daily station values are gridded and then the extreme values are extracted) represents different spatial scales of extreme precipitation and needs to be taken into account in model evaluation (Wehner et al. 2020). This aspect has been considered in some studies. Reanalysis products are used in place of station observations for their spatial completeness as well as spatial-scale comparability(Sillmann et al., 2013a; Kim et al., 2020; Li et al., 2021). However, reanalyses share similar parametrizations to the models themselves, reducing the objectivity of the comparison.
Different generations of CMIP models have improved over time, though quite modestly (Flato et al., 2013; Watterson et al., 2014). Improvements in the representation of the magnitude of the Expert Team on Climate Change Detection and Indices (ETCCDI) in CMIP5 over CMIP3(Sillmann et al., 2013a; Chen and Sun, 2015a) have been attributed to higher resolution, as higher-resolution models represent smaller areas at individual grid boxes. Additionally, the spatial distribution of extreme rainfall simulated by high-resolution models is generally more comparable to observations (Sillmann et al., 2013b; Kusunoki, 2017, 2018b; Scher et al., 2017) as these models tend to produce more realistic storms compared to coarser models (Section 11.7.2). Higher horizontal resolution alone improves simulation of extreme precipitation in some models (Wehner et al., 2014; Kusunoki, 2017, 2018b), but this is insufficient in other models (Bador et al., 2020) as parametrization also plays a significant role (M. Wu et al., 2020). A simple comparison of climatology may not fully reflect the improvements of the new models that have more comprehensive process formulations (Di Luca et al., 2015). Dittus et al. (2016) found that many of the eight CMIP5 models they evaluated reproduced the observed increase in the difference between areas experiencing an extreme high (90%) and an extreme low (10%) proportion of the annual total precipitation from heavy precipitation (R95p/PRCPTOT) for Northern Hemisphere regions. Additionally, CMIP5 models reproduced the relation between changes in extreme and non-extreme precipitation: an increase in extreme precipitation is at the cost of a decrease in non-extreme precipitation (Thackeray et al., 2018), a characteristic found in the observational record (Gu and Adler, 2018).
The CMIP6 models perform reasonably well in capturing large-scale features of precipitation extremes, including intense precipitation extremes in the intertropical convergence zone (ITCZ), and weak precipitation extremes in dry areas in the tropical regions (Li et al., 2021) but a double-ITCZ bias over the equatorial central and eastern Pacific that appeared in CMIP5 models remains (Section 3.3.2.3). There are also regional biases in the magnitude of precipitation extremes (Kim et al., 2020). The models also have difficulties in reproducing detailed regional patterns of extreme precipitation, such as over the north-east USA (Agel and Barlow, 2020), though they performed better for summer extremes over the USA (Akinsanola et al., 2020). The comparison between climatologies in the observations and in model simulations shows that the CMIP6 and CMIP5 models that have similar horizontal resolutions also have similar model evaluation scores, and their error patterns are highly correlated (Wehner et al., 2020). In general, extreme precipitation in CMIP6 models tends to be somewhat larger than in CMIP5 models (Li et al., 2021), reflecting smaller spatial scales of extreme precipitation represented by slightly higher-resolution models (Gervais et al., 2014). This is confirmed by Kim et al. (2020), who showed that Rx1day and Rx5day simulated by CMIP6 models tend to be closer to point estimates of HadEX3 data (Dunn et al., 2020) than those simulated by CMIP5. Figure 11.14 shows the multi-model ensemble bias in mean Rx1day over the period 1979–2014 from 21 available CMIP6 models when compared with observations and reanalyses. Measured by global land root-mean-square error, the model performance is generally consistent across different observed/reanalysis data products for the extreme precipitation metric (Figure 11.14). The magnitude of extreme area mean precipitation simulated by the CMIP6 models is consistently smaller than the point estimates of HadEX3, but the model values are more comparable to those of areal-mean values (Figure 11.14) of the ERA5 reanalysis or REGEN (Contractor et al., 2020b). Taylor-plot-based performance metrics reveal strong similarities in the patterns of extreme precipitation errors over land regions between CMIP5 and CMIP6 (Srivastava et al., 2020; Wehner et al., 2020) and between annual mean precipitation errors and Rx1day errors for both generations of models (Wehner et al., 2020).
 Figure 11.14 | Multi-model mean bias in annual maximum daily precipitation (Rx1day, %) for the period 1979–2014. Calculated as the difference between the Coupled Model Intercomparison Project Phase 6 (CMIP6) multi-model mean and the average of available observational or reanalysis products including (a) ERA5, (b) HadEX3, and (c) REGEN. Bias is expressed as the percent error relative to the long-term mean of the respective observational data products. Brown indicates that models are too dry, while green indicates that they are too wet. Areas without sufficient observational data are shown in grey. Adapted from Wehner et al. (2020) under the terms of the Creative Commons Attribution licence. Further details on data sources and processing are available in the chapter data table (Table 11.SM.9).
 In general, there is high confidence that historical simulations by CMIP5 and CMIP6 models of similar horizontal resolutions are interchangeable in their performance in simulating the observed climatology of extreme precipitation.
Studies using regional climate models (RCMs), for example, CORDEX (Giorgi et al., 2009) over Africa (Dosio et al., 2015; Klutse et al., 2016; Pinto et al., 2016; Gibba et al., 2019), Australia, East Asia (Park et al., 2016), Europe (Prein et al., 2016a; Fantini et al., 2018), and parts of North America (Diaconescu et al., 2018) suggest that extreme rainfall events are better captured in RCMs compared to their host GCMs due to their ability to address regional characteristics, for example, topography and coastlines. However, CORDEX simulations do not show good skill over South Asia for heavy precipitation, and do not add value with respect to their GCM source of boundary conditions (Mishra et al., 2014b; S. Singh et al., 2017). The evaluation of models in simulating regional processes is discussed in detail in Section 10.3.3.4. The high-resolution simulation of mid-latitude winter extreme precipitation over land is of similar magnitude to point observations. Simulation of summer extreme precipitation has a large bias when compared with observations at the same spatial scale. Simulated extreme precipitation in the tropics also appears to be too large, indicating possible deficiencies in the parametrization of cumulus convection at this resolution. Indeed, precipitation distributions at both daily and sub-daily time scales are much improved with a convection-permitting model (Belušić et al., 2020) over Western Africa (Berthou et al., 2019b), East Africa (Finney et al., 2019), North America and Canada (Cannon and Innocenti, 2019; Innocenti et al., 2019) and over Belgium in Europe (Vanden Broucke et al., 2019).
In summary, there is high confidence in the ability of models to capture the large-scale spatial distribution of precipitation extremes over land. The magnitude and frequency of extreme precipitation simulated by CMIP6 models are similar to those simulated by CMIP5 models (high confidence).
11.4.4 Detection and Attribution, Event Attribution
Both SREX (Chapter 3, Seneviratne et al., 2012) and AR5 (Chapter 10, IPCC, 2014) concluded with medium confidence that anthropogenic forcing has contributed to a global-scale intensification of heavy precipitation over the second half of the 20th century. These assessments were based on the evidence of anthropogenic influence on aspects of the global hydrological cycle, in particular, the human contribution to the warming-induced observed increase in atmospheric moisture that leads to an increase in heavy precipitation, and limited evidence of anthropogenic influence on extreme precipitation of durations of one and five days.
Since AR5 there has been new and robust evidence and improved understanding of human influence on extreme precipitation. In particular, detection and attribution analyses have provided consistent and robust evidence of human influence on extreme precipitation of one- and five-day durations at global to continental scales. The observed increases in Rx1day and Rx5day over the Northern Hemisphere land area during 1951–2005 can be attributed to the effect of combined anthropogenic forcing, including greenhouse gases and anthropogenic aerosols, as simulated by CMIP5 models and the rate of intensification with regard to warming is consistent with C-C scaling (Zhang et al., 2013). This is confirmed to be robust when an additional nine years of observational data and the CMIP6 model simulations were used (Cross-Chapter Box 3.2, Figure 1; Paik et al., 2020). The influence of greenhouse gases is attributed as the dominant contributor to the observed intensification. The global average of Rx1day in the observations is consistent with simulations by both CMIP5 and CMIP6 models under anthropogenic forcing, but not under natural forcing (Cross-Chapter Box 3.2, Figure 1). The observed increase in the fraction of annual total precipitation falling into the top fifth or top first percentiles of daily precipitation can also be attributed to human influence at the global scale (Dong et al., 2021). The CMIP5 models were able to capture the fraction of land experiencing a strong intensification of heavy precipitation during 1960–2010 under anthropogenic forcing, but not in unforced simulations (Fischer et al., 2014). But the models underestimated the observed trends (Borodina et al., 2017a). Human influence also significantly contributed to the historical changes in record-breaking one-day precipitation (Shiogama et al., 2016). There is also limited evidence of the influences of natural forcing. Substantial reductions in Rx5day and Simple Daily Intensity Index (SDII) for daily precipitation intensity over the global summer monsoon regions occurred during 1957–2000 after explosive volcanic eruptions (Paik and Min, 2018). The reduction in post-volcanic eruption extreme precipitation in the simulations is closely linked to the decrease in mean precipitation, for which both thermodynamic effects (moisture reduction due to surface cooling) and dynamic effects (monsoon circulation weakening) play important roles.
There has been new evidence of human influence on extreme precipitation at continental scales, including the detection of the combined effect of greenhouse gases and aerosol forcing on Rx1day and Rx5day over North America, Eurasia, and mid-latitude land regions (Zhang et al., 2013) and of greenhouse gas forcing in Rx1day and Rx5day in the mid-to-high latitudes, western and eastern Eurasia, and the global dry regions (Paik et al., 2020). These findings are corroborated by the detection of human influence in the fraction of extreme precipitation in the total precipitation over Asia, Europe, and North America (Dong et al., 2021). Human influence was found to have contributed to the increase in frequency and intensity of regional precipitation extremes in North America during 1961–2010, based on optimal fingerprinting and event attribution approaches (Kirchmeier-Young and Zhang, 2020). Tabari et al. (2020) found the observed latitudinal increase in extreme precipitation over Europe to be consistent with model-simulated responses to anthropogenic forcing.
Evidence of human influence on extreme precipitation at regional scales is more limited and less robust. In north-west Australia, the increase in extreme rainfall since 1950 can be related to increased monsoonal flow due to increased aerosol emissions, but cannot be attributed to an increase in greenhouse gases (Dey et al., 2019a). Anthropogenic influence on extreme precipitation in China was detected in one study (H. Li et al., 2017), but not in another using different detection and data-processing procedures (W. Li et al., 2018a), indicating the lack of robustness in the detection results. A still weak signal-to-noise ratio seems to be the main cause for the lack of robustness, as detection would become robust 20 years in the future (W. Li et al., 2018a). Krishnan et al. (2016) attributed the observed increase in heavy rain events (intensity >100 mm day–1) in the post-1950s over central India to the combined effects of greenhouse gases, aerosols, land-use and land-cover changes, and rapid warming of the equatorial Indian Ocean SSTs. Roxyet al. (2017) and Devanand et al. (2019) showed that the increase in widespread extremes over the South Asian Monsoon during 1950–2015 is due to the combined impacts of the warming of the Western Indian Ocean (Arabian Sea) and the intensification of irrigation water management over India.
Anthropogenic influence may have affected the large-scale meteorological processes necessary for extreme precipitation and the localized thermodynamic and dynamic processes, both contributing to changes in extreme precipitation events. Several new methods have been proposed to disentangle these effects by either conditioning on the circulation state or attributing analogues. In particular, the extremely wet winter of 2013–2014 in the UK can be attributed, approximately to the same degree, to both temperature-induced increases in saturation vapour pressure and changes in the large-scale circulation (Vautard et al., 2016; Yiou et al., 2017). There are multiple cases indicating that very extreme precipitation may increase at a rate more than the C-C rate (7% per 1°C of warming) (Pall et al., 2017; Risser and Wehner, 2017; van der Wiel et al., 2017; van Oldenborgh et al., 2017; S.-Y.S. Wang et al., 2018).
Event attribution studies found an influence of anthropogenic activities on the probability or magnitude of observed extreme precipitation events, including European winters (Schaller et al., 2016; Otto et al., 2018b), extreme 2014 precipitation over the northern Mediterranean (Vautard et al., 2015), parts of the USA for individual events (Knutson et al., 2014a; Szeto et al., 2015; Eden et al., 2016; van Oldenborgh et al., 2017), extreme rainfall in 2014 over Northland, New Zealand (Rosier et al., 2015) or China (Burke et al., 2016; Sun and Miao, 2018; Yuan et al., 2018b; Zhou et al., 2018). However, for other heavy rainfall events, studies identified a lack of evidence about anthropogenic influences (Imada et al., 2013; Schaller et al., 2014; Otto et al., 2015c; Siswanto et al., 2015). There are also studies where results are inconclusive because of limited reliable simulations (Christidis et al., 2013b; Angélil et al., 2016). Overall, both the spatial and temporal scales on which extreme precipitation events are defined are important for attribution; events defined on larger scales have larger signal-to-noise ratios and thus the signal is more readily detectable. At the current level of global warming, there is a strong enough signal to be detectable for large-scale extreme precipitation events, but the chance of detecting such signals for smaller-scale events decreases (Kirchmeier-Young et al., 2019).
In summary, most of the observed intensification of heavy precipitation over land regions is likely due to anthropogenic influence, for which greenhouse gases emissions are the main contributor. New and robust evidence since AR5 includes attribution to human influence of the observed increases in annual maximum one-day and five-day precipitation and in the fraction of annual precipitation falling in heavy events. The evidence since AR5 also includes a larger fraction of land showing enhanced extreme precipitation and a larger probability of record-breaking one-day precipitation than expected by chance, both of which can only be explained when anthropogenic greenhouse gas forcing is considered. Human influence has contributed to the intensification of heavy precipitation in three continents where observational data are more abundant (high confidence) (North America, Europe and Asia). On the spatial scale of AR6 regions, there is limited evidence of human influence on extreme precipitation, but new evidence is emerging; in particular, studies attributing individual heavy precipitation events found that human influence was a significant driver of the events, particularly in the winter season.
11.4.5 Projections
The AR5 concluded it is very likely that extreme precipitation events will be more frequent and more intense over most of the mid-latitude land masses and wet tropics in a warmer world (Collins et al., 2013). Post-AR5 studies provide more and robust evidence to support the previous assessments. These include an observed increase in extreme precipitation (Section 11.4.3) and human causes of past changes (Section 11.4.4), as well as projections based on either GCM and/or RCM simulations. The CMIP5 models project that the rate of increase in Rx1day with warming is independent of the forcing scenario (Section 8.5.3.1; Pendergrass et al., 2015) or forcing mechanism (Sillmann et al., 2017a). This is confirmed in CMIP6 simulations (Sillmann et al., 2019; Li et al., 2021). In particular, for extreme precipitation that occurs once a year or less frequently, the magnitudes of the rates of change per 1°C change in global mean temperature are similar, regardless of whether the temperature change is caused by increases in carbon dioxide (CO2), methane (CH4), solar forcing, or sulphate (SO4) (Sillmann et al., 2019). In some models – CESM1 in particular – the extreme precipitation response to warming may follow a quadratic relation (Pendergrass et al., 2019). Figure 11.15 shows changes in the 10- and 50-year return values of Rx1day at different warming levels as simulated by the CMIP6 models. The median value of the scaling over land, across all Shared Socio-economic Pathway (SSP) scenarios and all models, is close to 7% per 1°C of warming for the 50-year return value of Rx1day. It is just slightly smaller for the 10- and 50-year return values of Rx5day (Li et al., 2021). The 90% ranges of the multimodel ensemble changes across all land grid boxes in the 50-year return values for Rx1day and Rx5day do not overlap between 1.5°C and 2°C warming levels (Li et al., 2021), indicating that a small increment such as 0.5°C in global warming can result in a significant increase in extreme precipitation. Projected long-period Rx1day return value changes are larger than changes in mean Rx1day and with larger relative changes for more rare events (Pendergrass, 2018; Mizuta and Endo, 2020; Wehner, 2020). The rate of change of moderate extreme precipitation may depend more on the forcing agent, similar to the mean precipitation response to warming (Lin et al., 2016, 2018). Thus, there is high confidence that extreme precipitation that occurs once a year or less frequently increases proportionally to the amount of surface warming, and the rate of change in precipitation is not dependent on the underlying forcing agents of warming.
 Figure 11.15 | Projected changes in the intensity of extreme precipitation events under 1°C, 1.5°C, 2°C, 3°C, and 4°C global warming levels relative to the 1850–1900 baseline. Extreme precipitation events are defined as the annual maximum daily maximum precipitation (Rx1day) that was exceeded on average once during a 10-year period (10-year event, blue) and once during a 50-year period (50-year event, orange) during the 1850–1900 base period. Results are shown for the global land. For each box plot, the horizontal line and the box represent the median and central 66% uncertainty range, respectively, of the intensity changes across the multi-model median, and the ‘whiskers’ extend to the 90% uncertainty range. The results are based on the multi-model ensemble estimated from simulations of global climate models contributing to the Coupled Model Intercomparison Project Phase 6 (CMIP6) under different Shared Socio-economic Pathway forcing scenarios. Based on Li et al. (2021). Further details on data sources and processing are available in the chapter data table (Table 11.SM.9).
 The spatial patterns of the projected changes across different warming levels are quite similar, as shown in Figure 11.16, and confirmed by near-linear scaling between extreme precipitation and global warming levels at regional scales (Seneviratne and Hauser, 2020). Internal variability modulates changes in heavy rainfall (Wood and Ludwig, 2020), resulting in different changes in different regions (Seneviratne and Hauser, 2020). Extreme precipitation nearly always increases across land areas with larger increases at higher global warming levels, except in very few regions, such as Southern Europe around the Mediterranean Basin at low warming levels (Table 11.17). The very likely ranges of the multi-model ensemble changes across all land grid boxes in the 50-year return values for Rx1day and Rx5day between 1.5°C and 1°C warming levels are above zero for all continents except Europe, with the lower bound of the likely range above zero over Europe (Li et al., 2021). Decreases in extreme precipitation are confined mostly to subtropical ocean areas and are highly correlated to decreases in mean precipitation due to storm track shifts. These subtropical decreases can extend to nearby land areas in individual realizations.
 Figure 11.16 | Projected changes in annual maximum daily precipitation at (a) 1.5°C, (b) 2°C, and (c) 4°C of global warming compared to the 1850–1900 baseline. Results are based on simulations from the Coupled Model Intercomparison Project Phase 6 (CMIP6) multi-model ensemble under the Shared Socio-economic Pathway (SSP), SSP1-1.9, SSP1-2.6, SSP2-4.5, SSP3-7.0, and SSP5-8.5 scenarios. The numbers on the top right indicate the number of simulations included. Uncertainty is represented using the simple approach: no overlay indicates regions with high model agreement, where ≥80% of models agree on the sign of change; diagonal lines indicate regions with low model agreement, where <80% of models agree on the sign of change. For more information on the simple approach, please refer to the Cross-Chapter Box (Atlas 1. For details on the methods see Supplementary Material 11.SM.2. Changes in Rx1day are also displayed in the Interactive Atlas. Further details on data sources and processing are available in the chapter data table (Table 11.SM.9).
 Projected increases in the probability of extreme precipitation of fixed magnitudes are nonlinear and show larger increases for more rare events (Figures 11.7 and 11.15; Fischer and Knutti, 2015; Kharin et al., 2018; Li et al., 2021).The CMIP5 model projected increases in the probability of high (99th and 99.9th) percentile precipitation between 1.5°C and 2°C warming scenarios are consistent with what can be expected based on observed changes (Fischer and Knutti, 2015), providing confidence in the projections. The CMIP5 model simulations show that the frequency for present-day climate 20-year extreme precipitation is projected to increase by 10% at the 1.5°C global warming level, and by 22% at the 2.0°C global warming level, while the increase in the frequency for present-day climate 100-year extreme precipitation is projected to increase by 20% and more than 45% at the 1.5°C and 2.0°C warming levels, respectively (Kharin et al., 2018). CMIP6 simulations with SSP scenarios show that the frequency of 10-year and 50-year events will be approximately doubled and tripled, respectively, at a very high warming level of 4°C (Figure 11.7; Li et al., 2021).
There is a limited number of studies on the projections of extreme hourly precipitation. The ability of GCMs to simulate hourly precipitation extremes is limited (Morrison et al., 2019) and very few modelling centres archive sub-daily and hourly precipitation prior to CMIP6 experiments. RCM simulations project an increase in extreme sub-daily precipitation in North America (C. Li et al., 2019b) and Sweden (Olsson and Foster, 2013), but these models still do not explicitly resolve convective processes that are important for properly simulating extreme sub-daily precipitation. Simulations by RCMs that explicitly resolve convective processes (convection-permitting models) are limited in length and only available in a few regions because of high computing costs. Yet, a majority of the available convection-permitting simulations project increases in the intensities of extreme sub-daily precipitation events, with the amount similar to or higher than the C-C scaling rate (Kendon et al., 2014, 2019; Ban et al., 2015; Prein et al., 2016b; Helsen et al., 2020; Fowler et al., 2021). An increase is projected in extreme sub-daily precipitation over Africa (Kendon et al., 2019); East Africa (Finney et al., 2020) and Western Africa (Berthou et al., 2019a; Fitzpatrick et al., 2020), even for areas where parametrized RCMs project a decrease; in Europe (Hodnebrog et al., 2019; Chan et al., 2020); as well as in the continental USA (Prein et al., 2016b). Overall, while limited, the available evidence points to an increase in extreme sub-daily precipitation in the future. Studies on future changes in extreme precipitation for a month or longer are limited. One study projects an increase in extreme monthly precipitation in Japan under 4°C global warming for around 80% of stations in the summer (Hatsuzuka and Sato, 2019).
In Africa (Table 11.5), extreme precipitation will likely increase under warming levels of 2°C or below (compared to pre-industrial values) and very likely increase at higher warming levels. Simulations by CMIP5, CMIP6 and CORDEX regional models project an increase in daily extreme precipitation between 1.5°C and 2.0°C warming levels. The pattern of change in heavy precipitation under different scenarios or warming levels is similar with larger increases for higher warming levels (e.g., Nikulin et al., 2018; Li et al., 2021). With increases in warming, extreme precipitation is projected to increase in the majority of land regions in Africa (Mtongori et al., 2016; Pfahl et al., 2017; Diedhiou et al., 2018; Dunning et al., 2018; Akinyemi and Abiodun, 2019; Giorgi et al., 2019). Over Southern Africa, heavy precipitation will likely increase by the end of the 21st century under RCP 8.5 (Dosio, 2016; Pinto et al., 2016; Abiodun et al., 2017; Dosio et al., 2019). However, heavy rainfall amounts are projected to decrease over western South Africa (Pinto et al., 2018) as a result of a projected decrease in the frequency of the prevailing westerly winds south of the continent that translates into fewer cold fronts and closed mid-latitudes cyclones (Engelbrecht et al., 2009; Pinto et al., 2018). Heavy precipitation will likely increase by the end of the century under RCP8.5 in West Africa (Diallo et al., 2016; Dosio, 2016; Sylla et al., 2016; Abiodun et al., 2017; Akinsanola and Zhou, 2019; Dosio et al., 2019) and is projected to increase (high confidence) in Central Africa (Fotso-Nguemo et al., 2018, 2019; Sonkoué et al., 2019) and eastern Africa (Thiery et al., 2016; Ongoma et al., 2018a). In north-east and central east Africa, extreme precipitation intensity is projected to increase across CMIP5, CMIP6 and CORDEX-CORE (high confidence) in most areas annually (Coppola et al., 2021a), but the trends differ from season to season in all future scenarios (Dosio et al., 2019). In northern Africa, there is low confidence in the projected changes in heavy precipitation, either due to a lack of agreement among studies on the sign of changes (Sillmann et al., 2013a; Giorgi et al., 2014) or due to insufficient evidence.
In Asia (Table 11.8), extreme precipitation will likely increase at global warming levels of 2°C and below, butvery likely increase at higher warming levels for the region as whole. The CMIP6 multi-model median projects an increase in the 10- and 50-year return values of Rx1day and Rx5day over more than 95% of regions, even at the 2°C warming level, with larger increases at higher warming levels, independent of emissions scenarios (Li et al., 2021, also Figure 11.7). The CMIP5 models produced similar projections. Both heavy rainfall and rainfall intensity are projected to increase (Zhou et al., 2014; Guo et al., 2016, 2018; Y. Xu et al., 2016; Endo et al., 2017; Han et al., 2018; G. Kim et al., 2018). A half-degree difference in warming between the 1.5°C and 2.0°C warming levels can result in a detectable increase in extreme precipitation over the region (Li et al., 2021), in the Asian–Australian monsoon region (Chevuturi et al., 2018), and over South Asia and China (D. Lee et al., 2018; W. Li et al., 2018b). While there are regional differences, extreme precipitation is projected to increase in almost all sub-regions, though there can be spatial heterogeneity within sub-regions, such as in India (Shashikanth et al., 2018) and South East Asia (Ohba and Sugimoto, 2019). In East and South East Asia, there is high confidence that extreme precipitation is projected to intensify (Seo et al., 2014; Zhou et al., 2014; Y. Xu et al., 2016; Nayak et al., 2017; X. Wang et al., 2017; Y. Wang et al., 2017; Guo et al., 2018; D. Li et al., 2018; Sui et al., 2018). Extreme daily precipitation is also projected to increase in South Asia (Xu et al., 2017; Han et al., 2018; Shashikanth et al., 2018). The extreme precipitation indices, including Rx5day, R95p, and days of heavy precipitation (i.e., R10mm), are all projected to increase under the RCP4.5 and RCP8.5 scenarios in central and northern Asia (Xu et al., 2017; Han et al., 2018). A general wetting across the whole Tibetan Plateau and the Himalayas is projected, with increases in heavy precipitation in the 21st century (Palazzi et al., 2013; Zhou et al., 2014; Rajbhandari et al., 2015; R. Zhang et al., 2015; Wu et al., 2017; Gao et al., 2018; Paltan et al., 2018). Agreement in projected changes by different models is low in regions of complex topography such as Hindu-Kush Himalayas (Roy et al., 2019), but CMIP5, CMIP6 and CORDEX-CORE simulations consistently project an increase in heavy precipitation in higher latitude areas, such as West and East Siberia, and Russian Far East (high confidence) (Coppola et al., 2021a).
In Australasia (Table 11.11), most CMIP5 models project an increase in Rx1day under RCP4.5 and RCP8.5 scenarios for the late 21st century (CSIRO and BOM, 2015; Alexander and Arblaster, 2017; Grose et al., 2020) and the CMIP6 multi-model median projects an increase in the 10- and 50-year return values of Rx1day and Rx5day at a rate between 5% and 6% per 1°C of near-surface global mean warming (Figure 11.7; Li et al., 2021). Yet, there is large uncertainty in the increase because projected changes in dynamic processes lead to a decrease in Rx1day that can offset the thermodynamic increase over a large portion of the region (Box 11.1, Figure 1; Pfahl et al., 2017). Projected changes in moderate extreme precipitation (the 99th percentile of daily precipitation) by RCMs under RCP8.5 for 2070–2099 are mixed, with more regions showing decreases than increases (Evans et al., 2021). It is likely that daily rainfall extremes such as Rx1day will increase at the continental scale for global warming levels at or above 3°C. Daily rainfall extremes are projected to increase at the 2.0°C global warming level (medium confidence), and there is low confidence in changes at the 1.5°C. Projected changes show important regional differences with very likely increases over Northern Australia (Alexander and Arblaster, 2017; Herold et al., 2018; Grose et al., 2020) and New Zealand (MfE, 2018) where projected dynamic contributions are small (Box 11.1 Figure 1; Pfahl et al., 2017) and medium confidence on increases over central, eastern, and Southern Australia where dynamic contributions are substantial and can affect local phenomena (CSIRO and BOM, 2015; Pepler et al., 2016; Bell et al., 2019; Dowdy et al., 2019).
In Central and South America (Table 11.14), extreme precipitation will likely increase at global warming levels of 2°C and below, butvery likely increase at higher warming levels for the region as whole. A larger increase in global surface temperature leads to a larger increase in extreme precipitation, independent of emissions scenarios (Li et al., 2021). But there are regional differences in the projection, and projected changes for more moderate extreme precipitation are also more uncertain. Extreme precipitation, represented by the number of days with daily precipitation exceeding 50 mm and the annual fraction of precipitation falling during days with the top 10% daily precipitation amount, is projected to increase on the eastern coast of Southern Central America, but to decrease along the Pacific coasts of El Salvador and Guatemala (Imbach et al., 2018). Chouet al. (2014b) and Giorgi et al. (2014) projected an increase in extreme precipitation over South-Eastern South America and the Amazon. Projected changes in moderate extreme precipitation represented by the 99th percentile of daily precipitation by different models under different emissions scenarios, even at high warming levels, are mixed: increases are projected for all regions by the CORDEX-CORE and CMIP5 simulations, while increases for some regions and decreases for other regions are projected by CMIP6 simulations (Coppola et al., 2021a). Extreme precipitation is projected to increase in the La Plata basin (Cavalcanti et al., 2015; Carril et al., 2016). Taylor et al. (2018) projected a decrease in days with intense rainfall in the Caribbean under 2°C global warming by the 2050s under RCP4.5 relative to 1971–2000.
In Europe (Table 11.17), extreme precipitation will likely increase at global warming levels of 2°C and below, butvery likely increase for higher warming levels for the region as whole. The CMIP6 multi-model median projects an increase in the 10- and 50-year return values of Rx1day and Rx5day over a majority of the region at the 2°C global warming level, with more than 95% of the region showing an increase at higher warming levels (Figure 11.7; C. Li et al., 2021). The most intense precipitation events observed today in Europe are projected to almost double in occurrence for each 1°C of further global warming (Myhre et al., 2019). Extreme precipitation is projected to increase in both boreal winter and summer over Europe (Madsen et al., 2014; Christensen et al., 2015; Nissen and Ulbrich, 2017). There are regional differences, with decreases or no change for the southern part of Europe, such as the southern Mediterranean (Tramblay and Somot, 2018; Lionello and Scarascia, 2020; Coppola et al., 2021a), uncertain changes over central Europe (Argüeso et al., 2012; Croitoru et al., 2013; Rajczak et al., 2013; Casanueva et al., 2014; Patarčić et al., 2014; Paxian et al., 2014; Roth et al., 2014; Fischer and Knutti, 2015; Monjo et al., 2016) and a strong increase in the remaining parts, including the Alps region (Gobiet et al., 2014; Donnelly et al., 2017), particularly in winter (Fischer et al., 2015), and in northern Europe. In a 3°C warmer world, there will be a robust increase in extreme rainfall over 80% of land areas in northern Europe (Madsen et al., 2014; Donnelly et al., 2017; Cardell et al., 2020).
In North America (Table 11.20), the intensity and frequency of extreme precipitation will likely increase at the global warming levels of 2°C and below, and very likely increase at higher warming levels. An increase is projected by CMIP6 model simulations (Li et al., 2021) and by previous model generations (Wu,2015; Easterling et al., 2017; Innocenti et al., 2019), as well as by RCMs (Coppola et al., 2021a). Projections of extreme precipitation over the southern portion of the continent and over Mexico are more uncertain, with decreases possible (Sillmann et al., 2013b; Alexandru, 2018; Coppola et al., 2021a).
In summary, heavy precipitation will generally become more frequent and more intense with additional global warming. At global warming levels of 4°C relative to the pre-industrial, very rare (e.g., one in 10 or more years) heavy precipitation events would become more frequent and more intense than in the recent past, on the global scale (virtually certain), and in all continents and AR6 regions: The increase in frequency and intensity is extremely likely for most continents and very likely for most AR6 regions. The likelihood is lower at lower global warming levels and for less-rare heavy precipitation events. At the global scale, the intensification of heavy precipitation will follow the rate of increase in the maximum amount of moisture that the atmosphere can hold as it warms (high confidence), of about 7% per 1°C of global warming. The increase in the frequency of heavy precipitation events will be non-linear with more warming and will be higher for rarer events (high confidence), with 10- and 50-year events to be approximately double and triple, respectively, at the 4°C warming level. Increases in the intensity of extreme precipitation events at regional scales will depend on the amount of regional warming as well as changes in atmospheric circulation and storm dynamics leading to regional differences in the rate of heavy precipitation changes (high confidence).
11.5 Floods
Floods are the inundation of normally dry land, and are classified into types (e.g., pluvial floods, flash floods, river floods, groundwater floods, surge floods, coastal floods) depending on the space and time scales and the major factors and processes involved (Section 8.2.3.2; Nied et al., 2014; Aerts et al., 2018). Flooded area is difficult to measure or quantify and, for this reason, many of the existing studies on changes in floods focus on streamflow. Thus, this section assesses changes in flow as a proxy for river floods, in addition to some types of flash floods. Pluvial and urban floods – types of flash floods resulting from the precipitation intensity exceeding the capacity of natural and artificial drainage systems – are directly linked to extreme precipitation. Because of this link, changes in extreme precipitation are the main proxy for inferring changes in pluvial and urban floods (see also Section 12.4), assuming there is no additional change in the surface condition. Changes in these types of floods are not assessed in this section, but can be inferred from the assessment of changes in heavy precipitation in Section 11.4. Coastal floods due to extreme sea levels and flood changes at regional scales are assessed in Section 12.4.
11.5.1 Mechanisms and Drivers
Since AR5, the number of studies on understanding how floods may have changed, and will change in the future, has substantially increased. Floods are a complex interplay of hydrology, climate, and human management, and the relative importance of these factors varies for different flood types and regions.
In addition to the amount and intensity of precipitation, the main factors for river floods include antecedent soil moisture (Paschalis et al., 2014; Berghuijs et al., 2016; Grillakis et al., 2016; Woldemeskel and Sharma, 2016) and snow water-equivalent in cold regions (Sikorska et al., 2015; Berghuijs et al., 2016). Other factors are also important, including stream morphology (Borga et al., 2014; Slater et al., 2015), river and catchment engineering (Pisaniello et al., 2012; Nakayama and Shankman, 2013; Kim and Sanders, 2016), land-use and land-cover characteristics (Aich et al., 2016; Rogger et al., 2017) and changes (Knighton et al., 2019), and feedbacks between climate, soil, snow, vegetation, etc. (Hall et al., 2014; Ortega et al., 2014; Berghuijs et al., 2016; Buttle et al., 2016; Teufel et al., 2019). Water regulation and management have, in general, increased resilience to flooding (Formetta and Feyen, 2019), masking effects of an increase in extreme precipitation on flood probability in some regions, even though they do not eliminate very extreme floods (Vicente-Serrano et al., 2017). This means that an increase in precipitation extremes may not always result in an increase in river floods (Sharma et al., 2018; Do et al., 2020). Yet, as very extreme precipitation can become a dominant factor for river floods, there can be some correspondence in the changes in very extreme precipitation and river floods (Ivancic and Shaw, 2015; Wasko and Sharma, 2017; Wasko and Nathan, 2019). This has been observed in the western Mediterranean (Llasat et al., 2016), in China (Q. Zhang et al., 2015a) and in the USA (Peterson et al., 2013b; Berghuijs et al., 2016; Slater and Villarini, 2016).
In regions with a seasonal snow cover, snowmelt is the main cause of extreme river flooding over large areas (Pall et al., 2019). Extensive snowmelt combined with heavy and/or long-duration precipitation can cause significant floods (D. Li et al., 2019; Krug et al., 2020). Changes in floods in these regions can be uncertain because of the compounding and competing effects of the responses of snow and rain to warming that affect snowpack size: warming results in an increase in precipitation, but also a reduction in the time period of snowfall accumulation (Teufel et al., 2019). An increase in atmospheric CO2 enhances water-use efficiency by plants (Roderick et al., 2015; Milly and Dunne, 2016; Swann et al., 2016; Swann, 2018); this could reduce evapotranspiration and contribute to the maintenance of soil moisture and streamflow levels under enhanced atmospheric CO2 concentrations (Yang et al., 2019). This mechanism would suggest an increase in the magnitude of some floods in the future (Kooperman et al., 2018). But this effect is uncertain as an increase in leaf area index, and vegetation coverage could also result in overall larger water consumption (Mátyás and Sun, 2014; Mankin et al., 2019; Teuling et al., 2019), and there are also other CO2 -related mechanisms that come into play (Cross-Chapter Box 5.1).
Various factors, such as extreme precipitation (Cho et al., 2016; Archer and Fowler, 2018), glacier lake outbursts (Schneider et al., 2014; Schwanghart et al., 2016), or dam breaks (Biscarini et al., 2016) can cause flash floods. Very intense rainfall, along with a high fraction of impervious surfaces can result in flash floods in urban areas (Hettiarachchi et al., 2018). Because of this direct connection, changes in very intense precipitation can translate to changes in urban flood potential (Rosenzweig et al., 2018), though there can be a spectrum of urban flood responses to this flood potential (Smith et al., 2013), as many factors, such as the overland flow rate and the design of urban (Falconer et al., 2009) and storm water drainage systems (Maksimović et al., 2009), can play an important role. Nevertheless, changes in extreme precipitation are the main proxy for inferring changes in some types of flash floods, (which are addressed in Section 12.4), given the relation between extreme precipitation and pluvial floods, the very limited literature on urban and pluvial floods (e.g., Skougaard Kaspersen et al., 2017), and limitations of existing methodologies for assessing changes in floods (Archer et al., 2016).
In summary, there is not always a one-to-one correspondence between an extreme precipitation event and a flood event, or between changes in extreme precipitation and changes in floods, because floods are affected by many factors in addition to heavy precipitation (high confidence). Changes in extreme precipitation may be used as a proxy to infer changes in some types of flash floods that are more directly related to extreme precipitation (high confidence).
11.5.2 Observed Trends
The SREX (Seneviratne et al., 2012) assessed low confidence for observed changes in the magnitude or frequency of floods at the global scale. This assessment was confirmed by AR5 (Hartmann et al., 2013). The SR1.5 (Hoegh-Guldberg et al., 2018) found increases in flood frequency and extreme streamflow in some regions, but decreases in other regions. While the number of studies on flood trends has increased since AR5, and there were also new analyses after the release of SR1.5 (Berghuijs et al., 2017; Blöschl et al., 2019; Gudmundsson et al., 2019), hydrological literature on observed flood changes is heterogeneous, focusing at regional and sub-regional basin scales, making it difficult to synthesize at the global and sometimes regional scales. The vast majority of studies focus on river floods using streamflow as a proxy, with limited attention to urban floods. Streamflow measurements are not evenly distributed over space, with gaps in spatial coverage, and their coverage in many regions of Africa, South America, and parts of Asia is poor (e.g., Do et al., 2017), leading to difficulties in detecting long-term changes in floods (Slater and Villarini, 2017). See also Section 8.3.1.5.
Peak flow trends are characterized by high regional variability and lack overall statistical significance of a decrease or an increase over the globe as a whole. Of more than 3500 streamflow stations in the USA, central and Northern Europe, Africa, Brazil, and Australia, 7.1% stations showed a significant increase, and 11.9% stations showed a significant decrease in annual maximum peak flow during 1961–2005 (Do et al., 2017). This is in direct contrast to the global and continental scale intensification of short-duration extreme precipitation (Section 11.4.2). There may be some consistency over large regions (see Gudmundsson et al., 2019), in high streamflows (>90th percentile), including a decrease in some regions (e.g., in the Mediterranean) and an increase in others (e.g., northern Asia), but gauge coverage is often limited. On a continental scale, a decrease seems to dominate in Africa (Tramblay et al., 2020) and Australia (Ishak et al., 2013; Wasko and Nathan, 2019), an increase in the Amazon (Barichivich et al., 2018), and trends are spatially variable in other continents (Q. Zhang et al., 2015b; Bai et al., 2016; Do et al., 2017; Hodgkins et al., 2017). In Europe, flow trends have large spatial differences (Hall et al., 2014; Mediero et al., 2015; Kundzewicz et al., 2018; Mangini et al., 2018), but there appears to be a pattern of increase in north-western Europe, and a decrease in southern and eastern Europe in annual peak flow during 1960–2000 (Blöschl et al., 2019). In North America, peak flow has increased in north-east USA and decreased in south-west USA (Peterson et al., 2013b; Armstrong et al., 2014; Mallakpour and Villarini, 2015; Archfield et al., 2016; Burn and Whitfield, 2016; Wehner et al., 2017; Neri et al., 2019). There are important changes in the seasonality of peak flows in regions where snowmelt dominates, such as northern North America (Burn and Whitfield, 2016; Dudley et al., 2017) and Northern Europe (Blöschl et al., 2017), corresponding to strong winter and spring warming.
In summary, the seasonality of floods has changed in cold regions where snowmelt dominates the flow regime in response to warming (high confidence). There is low confidence about peak flow trends over past decades on the global scale , but there are regions experiencing increases, including parts of Asia, Southern South America, north-east USA, north-western Europe, and the Amazon, and regions experiencing decreases, including parts of the Mediterranean, Australia, Africa, and south-western USA.
11.5.3 Model Evaluation
Hydrological models used to simulate floods are structurally diverse (Dankers et al., 2014; Mateo et al., 2017; Şen, 2018), often requiring extensive calibration since sub-grid processes and land-surface properties need to be parametrized, irrespective of the spatial resolutions (Döll et al., 2016; Krysanova et al., 2017). The data used to drive and calibrate the models are usually of coarse resolution, necessitating the use of a wide variety of downscaling techniques (Muerth et al., 2013). This adds uncertainty not only to the models but also to the reliability of the calibrations. The quality of the flood simulations also depends on the spatial scale, as flood processes are different for catchments of different sizes. It is more difficult to replicate flood processes for large basins, as water management and water use are often more complex for these basins.
Studies that use different regional hydrological models show a large spread in flood simulations (Dankers et al., 2014; Roudier et al., 2016; Trigg et al., 2016; Krysanova et al., 2017). Regional models reproduce moderate and high flows reasonably well (0.02–0.1 flow annual exceedance probabilities), but there are large biases for the most extreme flows (0–0.02 annual flow exceedance probability), independent of the climatic and physiographic characteristics of the basins (S. Huang et al., 2017a). Global-scale hydrological models have even more challenges, as they struggle to reproduce the magnitude of the flood hazard (Trigg et al., 2016). Also, the ensemble mean of multiple models does not perform better than individual models (Zaherpour et al., 2018).
The use of hydrological models for assessing changes in floods, especially for future projections, adds another dimension of uncertainty on top of uncertainty in the driving climate projections, including emissions scenarios, and in the driving climate models (both RCMs and GCMs) (Arnell and Gosling, 2016; Hundecha et al., 2016; Krysanova et al., 2017). The differences in hydrological models (Roudier et al., 2016; Thober et al., 2018), as well as post-processing of climate model output for the hydrological models (Muerth et al., 2013; Maier et al., 2018), add to uncertainty for flood projections.
In summary, there is medium confidence that simulations for the most extreme flows by regional hydrological models can have large biases. Global-scale hydrological models still struggle with reproducing the magnitude of floods. Projections of future floods are hampered by these difficulties and cascading uncertainties, including uncertainties in emissions scenarios and the climate models that generate inputs.
11.5.4 Detection and Attribution, Event Attribution
There are very few studies focused on the attribution of long-term changes in floods, but there are studies on changes in flood events. Most of the studies focus on flash floods and urban floods, which are closely related to intense precipitation events (Hannaford, 2015). In other cases, event attribution focused on runoff using hydrological models, and examples include river basins in the UK (Section 11.4.4; Schaller et al., 2016; Kay et al., 2018), the Okavango River in Africa (Wolski et al., 2014), and the Brahmaputra River in Bangladesh (Philip et al., 2019). Findings about anthropogenic influences vary between different regions and basins. For some flood events, the probability of high floods in the current climate is lower than in a climate without an anthropogenic influence (Wolski et al., 2014), while in other cases anthropogenic influence leads to more intense floods (Cho et al., 2016; Pall et al., 2017; van der Wiel et al., 2017; Philip et al., 2018a; Teufel et al., 2019). Factors such as land-cover change and river management can also increase the probability of high floods (Ji et al., 2020). These, along with model uncertainties and the lack of studies overall, suggest a low confidence in general statements to attribute changes in flood events to anthropogenic climate change. A few individual regions have been well studied, which allows for high confidence in the attribution of increased flooding in these cases. For example, flooding in the UK following increased winter precipitation (Schaller et al., 2016; Kay et al., 2018) can be attributed to anthropogenic climate change (Schaller et al., 2016; Vautard et al., 2016; Yiou et al., 2017; Otto et al., 2018b).
Attributing changes in heavy precipitation to anthropogenic activities (Section 11.4.4) cannot be readily translated to attributing changes in floods to human activities, because precipitation is only one of the multiple factors, albeit an important one, that affect floods. For example, Teufel et al. (2017) showed that, while human influence increased the odds of the flood-producing rainfall for the 2013 Alberta flood in Canada, it was not detected to have influenced the probability of the flood itself. Schaller et al. (2016) showed that human influence on the increase in the probability of heavy precipitation translated linearly into an increase in the resulting river flow of the Thames in the UK in winter 2014, but its contribution to the inundation was inconclusive.
Gudmundsson et al. (2021) compared the spatial pattern of the observed regional trends in high river flows (>90th percentile) over 1971–2010 with that simulated by global hydrological models. The hydrological models were driven by outputs of climate model simulations under all historical forcing and pre-industrial forcing conditions. They found complex spatial patterns of extreme river flow trends. They also found the observed spatial patterns of trends can be reproduced only if anthropogenic climate change is considered, and that simulated effects of water and land management cannot reproduce the observed spatial pattern of trends. As there is only one study and multiple caveats associated with the study, including relatively poor observational data coverage, there is low confidence about human influence on the changes in high river flows on the global scale.
In summary there is low confidence in the human influence on the changes in high river flows on the global scale. In general, there is low confidence in attributing changes in the probability or magnitude of flood events to human influence because of a limited number of studies, differences in the results of these studies and large modelling uncertainties.
11.5.5 Future Projections
The SREX (Chapter 3, Seneviratne et al., 2012) stressed the low availability of studies on flood projections under different emissions scenarios, and concluded that there was low confidence in projections of flood events given the complexity of the mechanisms driving floods at the regional scale. The AR5 WGII report (Chapter 3, Jimenez Cisneros et al., 2014) assessed with medium confidence the pattern of future flood changes, including flood hazards increasing over about half of the globe (parts of southern and South East Asia, tropical Africa, north-east Eurasia, and South America) and flood hazards decreasing in other parts of the world, despite uncertainties in GCMs and their coupling to hydrological models. The SR1.5 (Chapter 3, Hoegh-Guldberg et al., 2018) assessed with medium confidence that global warming of 2°C would lead to an expansion of the fraction of global area affected by flood hazards, compared to conditions at 1.5°C of global warming, as a consequence of changes in heavy precipitation.
The majority of new studies that produce future flood projections based on hydrological models do not typically consider aspects that are also important to actual flood severity or damages, such as flood prevention measures (Neumann et al., 2015; Şen, 2018), flood control policies (Barraqué, 2017), and future changes in land cover (see also Section 8.4.1.5). At the global scale, Alfieri et al. (2017) used downscaled projections from seven GCMs as input to drive a hydrodynamic model. They found successive increases in the frequency of high floods in all continents except Europe, associated with increasing levels of global warming (1.5°C, 2°C, 4°C). These results are supported by Paltan et al. (2018), who applied a simplified runoff aggregation model forced by outputs from four GCMs. S. Huang et al. (2018) used three hydrological models forced with bias-adjusted outputs from four GCMs to produce projections for four river basins including the Rhine, Upper Mississippi, Upper Yellow, and Upper Niger under 1.5°C, 2°C, and 3°C global warming. This study found diverse projections for different basins, including a shift towards earlier flooding for the Rhine and the Upper Mississippi, a substantial increase in flood frequency in the Rhine only under the 1.5°C and 2°C scenarios, and a decrease in flood frequency in the Upper Mississippi under all scenarios.
At the continental and regional scales, the projected changes in floods are uneven in different parts of the world, but there is a larger fraction of regions with an increase than with a decrease over the 21st century (Hirabayashi et al., 2013; Dankers et al., 2014; Arnell and Gosling, 2016; Döll et al., 2018). These results suggestmedium confidence in flood trends at the global scale, but low confidence in projected regional changes. Increases in flood frequency or magnitude are identified for south-eastern and northern Asia and India (high agreement across studies), eastern and tropical Africa, and the high latitudes of North America (medium agreement), while decreasing frequency or magnitude is found for central and eastern Europe and the Mediterranean (high confidence), and parts of South America, southern and central North America, and south-west Africa (low confidence) (Hirabayashi et al., 2013; Dankers et al., 2014; Arnell and Gosling, 2016; Döll et al., 2018). Over South America, most studies based on global and regional hydrological models show an increase in the magnitude and frequency of high flows in the western Amazon (Guimberteau et al., 2013; Langerwisch et al., 2013; Sorribas et al., 2016; Zulkafli et al., 2016) and the Andes (Hirabayashi et al., 2013; Bozkurt et al., 2018). Section 12.4 provides a detailed assessment of regional flood projections.
In summary, global hydrological models project a larger fraction of land areas to be affected by an increase in river floods than by a decrease in river floods (medium confidence). There is medium confidence that river floods will increase in the western Amazon, the Andes, and south-eastern and northern Asia. Regional changes in river floods are more uncertain than changes in pluvial floods because complex hydrological processes and forcings are involved, including land cover change and human water management.
11.6 Droughts
Droughts refer to periods of time with substantially below-average moisture conditions, usually covering large areas, during which limitations in water availability result in negative impacts for various components of natural systems and economic sectors (Wilhite and Pulwarty, 2017; Ault, 2020). Depending on the variables used to characterize it and the systems or sectors being impacted, drought may be classified in different types (Figure 8.6 and Appendix Table 11.A.1) such as meteorological (precipitation deficits), agricultural(e.g., crop yield reductions or failure, often related to soil moisture deficits), ecological (related to plant water stress that causes e.g., tree mortality), or hydrologicaldroughts (e.g., water shortage in streams or storages such as reservoirs, lakes, lagoons, and groundwater; see Glossary). The distinction of drought types is not absolute, as drought can affect different sub-domains of the Earth system concomitantly, but sometimes also asynchronously, including propagation from one drought type to another (Brunner and Tallaksen, 2019). Because of this, drought cannot be characterized using a single universal definition (Lloyd-Hughes, 2014) or directly measured based on a single variable (SREX Chapter 3; Wilhite and Pulwarty, 2017). Drought can happen on a wide range of timescales – from ‘flash droughts’ on a scale of weeks, and characterized by a sudden onset and rapid intensification of drought conditions (Hunt et al., 2014; Otkin et al., 2018; Pendergrass et al., 2020) to multi-year or decadal rainfall deficits – sometimes termed ‘megadroughts’ (see Glossary; Ault et al., 2014; Cook et al., 2016b; Garreaud et al., 2017). Droughts are often analysed using indices that are measures of drought severity, duration and frequency (Sections 8.3.1.6, 8.4.1.6, 12.3.2.6 and 12.3.2.7, and Table 11.A.1). There are many drought indices published in the scientific literature, as also highlighted in SREX (SREX Chapter 3). These can range from anomalies in single variables (e.g., precipitation, soil moisture, runoff, evapotranspiration) to indices combining different atmospheric variables.
This assessment is focused on changes in physical conditions and metrics of direct relevance to droughts: (i) precipitation deficits; (ii) excess of atmospheric evaporative demand (AED); (iii) soil moisture deficits; (iv) hydrological deficits; and e) atmospheric-based indices combining precipitation and AED (Table 11.A.1). In the regional tables (Section 11.9), the assessment is structured by drought types, addressing: (i) meteorological, (ii) agricultural and ecological, and (iii) hydrological droughts. Note that the latter two assessments directly inform the Chapter 12 assessment on projected regional changes in these climatic impact-drivers (Section 12.4). The text refers to AR6 region acronyms (Section 11.9, and see Section 1.4.5).
11.6.1 Mechanisms and Drivers
Similar to many other extreme events, droughts occur as a combination of thermodynamic and dynamic processes (Box 11.1). Thermodynamic processes contributing to drought, which are modified by greenhouse gas forcing both at global and regional scales, are mostly related to heat and moisture exchanges, and are also partly modulated by plant coverage and physiology. They affect, for instance, atmospheric humidity, temperature, and radiation, which in turn affect precipitation and/or evapotranspiration in some regions and time frames. However, dynamic processes are particularly important to explain drought variability on different time scales, from a few weeks (flash droughts) to multiannual (megadroughts). There is low confidence in the effects of greenhouse gas forcing on changes in atmospheric dynamic (Section 2.4; Section 4.3.3), and on associated changes in drought occurrence. Thermodynamic processes are thus the main driver of drought changes in a warming climate (high confidence).
11.6.1.1 Precipitation Deficits
Lack of precipitation is generally the main factor controlling drought onset. There is high confidence that atmospheric dynamics, which vary on interannual, decadal and longer time scales, is the dominant contributor to variations in precipitation deficits in the majority of world regions (Dai, 2013; Miralles et al., 2014b; Seager and Hoerling, 2014; Burgman and Jang, 2015; Dong and Dai, 2015; Schubert et al., 2016; Raymond et al., 2018; Baek et al., 2019; Drumond et al., 2019; Herrera-Estrada et al., 2019; Gimeno et al., 2020; Mishra, 2020). Precipitation deficits are driven by dynamic mechanisms taking place on different spatial scales, including synoptic processes – atmospheric rivers and extratropical cyclones, blocking and ridges (Section 11.7; Sousa et al., 2017), dominant large-scale circulation patterns (Kingston et al., 2015), and global ocean–atmosphere coupled patterns such as inter-decadal Pacific Oscillation (IPO), Atlantic Multi-decadal Oscillation (AMO) and El Niño–Southern Oscillation (ENSO; Dai and Zhao, 2017). These various mechanisms occur on different scales, are not independent, and substantially interact with one another. Also regional moisture recycling and land–atmosphere feedbacks play an important role for some precipitation anomalies (see below).
There is high confidence that land–atmosphere feedbacks play a substantial or dominant role in affecting precipitation deficits in someregions (SREX, Chapter 3; Koster et al., 2011; Gimeno et al., 2012; Taylor et al., 2012; Guillod et al., 2015; Tuttle and Salvucci, 2016; Santanello Jr. et al., 2018; Haslinger et al., 2019; Herrera-Estrada et al., 2019). The sign of the feedbacks can be either positive or negative, as well as local or non-local (Taylor et al., 2012; Guillod et al., 2015; Tuttle and Salvucci, 2016). Earth system models (ESMs) tend to underestimate non-local negative soil-moisture–precipitation feedbacks (Taylor et al., 2012) and also show high variations in their representation in some regions (Berg et al., 2017b). Soil-moisture–precipitation feedbacks contribute to changes in precipitation in climate model projections in some regions, but ESMs display substantial uncertainties in their representation, and there is thus onlylow confidence in these contributions (Berg et al., 2017b; Vogel et al., 2017, 2018).
11.6.1.2 Atmospheric Evaporative Demand
Atmospheric evaporative demand (AED) quantifies the maximum amount of actual evapotranspiration (ET) that can happen from land surfaces if they are not limited by water availability (Table 11.A.1). AED is affected by radiative and aerodynamic components. For this reason, the atmospheric dryness, often quantified with the relative humidity or the vapour pressure deficit (VPD), is not equivalent to the AED, as other variables are also highly relevant, including solar radiation and wind speed (Hobbins et al., 2012; McVicar et al., 2012a; Sheffield et al., 2012). AED can be estimated using different methods (McMahon et al., 2013), and those solely based on air temperature (e.g., Hargreaves, Thornthwaite) usually overestimate it in terms of magnitude and temporal trends (Sheffield et al., 2012), in particular, in the context of substantial background warming. Physically-based combination methods such as the Penman-Monteith equation are more adequate and recommended since 1998 by the United Nations Food and Agriculture Oganization (Pereira et al., 2015). For this reason, the assessment of this Chapter, when considering atmospheric-based drought indices, only includes AED estimates using the latter (see also Section 11.9). AED is generally higher than ET, since AED represents an upper bound for ET. Hence, an AED increase does not necessarily lead to increased ET (Milly and Dunne, 2016), in particular under drought conditions given soil moisture limitation (Bonan et al., 2014; Berg et al., 2016; Konings et al., 2017; Stocker et al., 2018). In general, AED is highest in regions where ET is lowest (e.g., desert areas), further illustrating the decoupling between the two variables under limited soil moisture.
The influence of AED on drought depends on the drought type, background climate, the environmental conditions and the moisture availability (Hobbins et al., 2016, 2017; Vicente-Serrano et al., 2020a). This influence also includes effects not related to increased ET. Under low soil moisture conditions, increased AED increases plant stress, enhancing the severity of agricultural and ecological droughts (Williams et al., 2013; Allen et al., 2015; McDowell et al., 2016; Grossiord et al., 2020). Moreover, high VPD impacts overall plant physiology; it affects the leaf and xylem safety margins, and decreases the sap velocity and plant hydraulic conductance (Fontes et al., 2018). VPD also affects the plant metabolism of carbon and, if prolonged, it may cause plant mortality via carbon starvation (Breshears et al., 2013; Hartmann, 2015). Drought projections based exclusively on AED metrics overestimate changes in soil moisture and runoff deficits. Nevertheless, AED also directly impacts hydrological drought, as ET from surface waters is not limited (Wurbs and Ayala, 2014; Friedrich et al., 2018; Hogeboom et al., 2018; K. Xiao et al., 2018), and this effect increases under climate change projections (W. Wang et al., 2018; Althoff et al., 2020). In addition, high AED increases crop water consumptions in irrigated lands (García-Garizábal et al., 2014), contributing to intensifying hydrological droughts downstream (Fazel et al., 2017; Vicente-Serrano et al., 2017).
On subseasonal to decadal scales, temporal variations in AED are strongly controlled by circulation variability (Williams et al., 2014; Chai et al., 2018; Martens et al., 2018), but thermodynamic processes also play a fundamental role and, under human-induced climate change, dominate the changes in AED. Atmospheric warming due to increased atmospheric CO2 concentrations increases AED by means of enhanced VPD in the absence of other influences (Scheff and Frierson, 2015). Because of the greater warming over land than over oceans (Sections 2.3.1.1 and 11.3), the saturation pressure of water vapour increases more over land than over oceans; oceanic air masses advected over land thus contain insufficient water vapour to keep pace with the greater increase in saturation vapour pressure over land (Sherwood and Fu, 2014; Byrne and O’Gorman, 2018; Findell et al., 2019). Land–atmosphere feedbacks are also important in affecting atmospheric moisture content and temperature, with resulting effects on relative humidity and VPD (Box 11.1; Berg et al., 2016; Haslinger et al., 2019; S. Zhou et al., 2019).
11.6.1.3 Soil Moisture Deficits
Soil moisture shows an important correlation with precipitation variability (Khong et al., 2015; Seager et al., 2019), but ET also plays a substantial role in further depleting moisture from soils, in particular in humid regions during periods of precipitation deficits (Teuling et al., 2013; Padrón et al., 2020). In addition, soil moisture plays a role in drought self-intensification under dry conditions in which ET is decreased and leads to higher AED (Miralles et al., 2019), an effect that can also contribute to triggering flash droughts (Otkin et al., 2016, 2018; DeAngelis et al., 2020; Pendergrass et al., 2020). If soil moisture becomes limited, ET is reduced, which may decrease the rate of soil drying, but can also lead to further atmospheric dryness through various feedback loops (Seneviratne et al., 2010; Miralles et al., 2014a, 2019; Teuling, 2018; Vogel et al., 2018; S. Zhou et al., 2019; Liu et al., 2020). The process is complex since vegetation cover plays a role in modulating albedo and in providing access to deeper stores of water (both in the soil and groundwater). Also, changes in land cover and in plant phenology may alter ET (Sterling et al., 2013; Woodward et al., 2014; Frank et al., 2015; Döll et al., 2016; Ukkola et al., 2016; Trancoso et al., 2017; Hao et al., 2019; Lian et al., 2020). Snow depth has strong and direct impacts on soil moisture in many systems (Gergel et al., 2017; Williams et al., 2020).
Soil moisture directly affects plant water stress and ET. Soil moisture is the primary factor that controls xylem hydraulic conductance – that is, water uptake in plants (Sperry et al., 2016; Hayat et al., 2019; X. Chen et al., 2020). For this reason, soil moisture deficits are the main driver of xylem embolism, the primary cause of plant mortality (Anderegg et al., 2012, 2016; Rowland et al., 2015). Also carbon assimilation by plants strongly depends on soil moisture (Hartzell et al., 2017), with implications for carbon starvation and plant dying if soil moisture deficits are prolonged (Sevanto et al., 2014). These mechanisms explain that soil moisture deficits are usually more relevant than AED excess to explain gross primary production anomalies and vegetation stress, mostly in sub-humid and semi-arid regions (Stocker et al., 2018; Liu et al., 2020). High CO2 concentrations are shown to potentially decrease plant ET and increase plant water-use efficiency, affecting soil moisture levels, but this effect interacts with other CO2 physiological and radiative effects (Section 11.6.5.2 and Cross-Chapter Box 5.1), and has less relevance under low soil moisture (Morgan et al., 2011; Z. Xu et al., 2016; Nackley et al., 2018; Dikšaitytė et al., 2019). ESMs represent both surface (around 10cm) and total column soil moisture, whereby total soil moisture is of more direct relevance for root water uptake, in particular by trees. There is evidence that surface soil moisture projections are substantially drier than total soil moisture projections, and may overestimate drying of relevance for most vegetation (Berg et al., 2017a).
11.6.1.4 Hydrological Deficits
Drivers of streamflow and surface water deficits are complex and strongly depend on the hydrological system analysed (e.g., streamflows in the headwaters, medium course of the rivers, groundwater, highly regulated hydrological basins). Soil hydrological processes, which control the propagation of meteorological droughts throughout different parts of the hydrological cycle (Van Loon and Van Lanen, 2012), are spatially and temporally complex (Herrera-Estrada et al., 2017; S. Huang et al., 2017b) and difficult to quantify (Van Lanen et al., 2016; Apurv et al., 2017; Caillouet et al., 2017; Konapala and Mishra, 2017; Hasan et al., 2019). The physiographic characteristics of the basins also affect how droughts propagate throughout the hydrological cycle (Van Loon and Van Lanen, 2012; Van Lanen et al., 2013; Van Loon, 2015; Konapala and Mishra, 2020; Veettil and Mishra, 2020). In addition, the assessment of groundwater deficits is very difficult given the complexity of processes that involve natural and human-driven feedbacks and interactions with the climate system (Taylor et al., 2013). Streamflow and surface water deficits are affected by land cover, groundwater and soil characteristics (Van Lanen et al., 2013; Van Loon and Laaha, 2015; Barker et al., 2016; Tijdeman et al., 2018), as well as human activities (water management and demand, damming) and land-use changes (Section 11.6.4.3; Van Loon et al., 2016; He et al., 2017; Veldkamp et al., 2017; J. Wu et al., 2018; Y. Xu et al., 2019; Jehanzaib et al., 2020). Finally, snow and glaciers are relevant for water resources in some regions. For instance, warming affects snowpack levels (Dierauer et al., 2019; Huning and AghaKouchak, 2020), as well as the timing of snow melt, thus potentially affecting the seasonality and magnitude of low flows (Barnhart et al., 2016).
11.6.1.5 Atmospheric-based Drought Indices
Given the difficulties of drought quantification and data constraints, atmospheric-based drought indices combining both precipitation and AED have been developed, as they can be derived from meteorological data that is available in most regions (with few exceptions). These demand/supply indices are not intended to be metrics of soil moisture, streamflow or vegetation water stress. Because of their reliance on precipitation and AED, they are mostly related to the actual water balance in humid regions, in which ET is not limited by soil moisture and tends towards AED. In water-limited regions and in dry periods everywhere, they constitute an upper bound for overall water-balance deficits (e.g., of surface waters) but are also related to conditions conducive to vegetation stress, particularly under soil moisture limitation (Section 11.6.1.2).
Although there are many atmospheric-based drought indices, two are assessed in this chapter: the Palmer Drought Severity Index (PDSI) and the Standardized Precipitation Evapotranspiration Index (SPEI). The PDSI has been widely used to monitor and quantify drought severity (Dai et al., 2018), but is affected by some constraints (SREX Chapter 3; Mukherjee et al., 2018a). Although the calculation of the PDSI is based on a soil water budget, the PDSI is essentially a climate drought index that mostly responds to the precipitation and the AED (van der Schrier et al., 2013; Vicente-Serrano et al., 2015; Dai et al., 2018). The SPEI also combines precipitation and AED, being equally sensitive to these two variables (Vicente-Serrano et al., 2015). The SPEI is more sensitive to AED than the PDSI (Cook et al., 2014a; Vicente-Serrano et al., 2015), although under humid and normal precipitation conditions, the effects of AED on the SPEI are small (Tomas-Burguera et al., 2020). Given the limitations associated with temperature-based AED estimates (Section 11.6.1.2), only studies using the Penman-Monteith-based SPEI and PDSI (hereafter SPEI-PM and PDSI-PM) are considered in this assessment and in the regional tables in Section 11.9.
11.6.1.6 Relation of Assessed Variables and Metrics for Changes in Different Drought Types
This Chapter assesses changes in meteorological drought, agricultural and ecological droughts, and hydrological droughts. Precipitation-based indices are used for the estimation of changes in meteorological droughts, such as the Standardized Precipitation Index (SPI) and the number of consecutive dry days (CDD). Changes in total soil moisture and soil moisture-based drought events are used for the estimation of changes in agricultural and ecological droughts, complemented by changes in surface soil moisture, water-balance estimates (precipitation minus ET), and SPEI-PM and PDSI-PM. For hydrological droughts, changes in low flows are assessed, sometimes complemented by changes in mean streamflow.
In summary, different drought types exist and they are associated with different impacts and respond differently to increasing greenhouse gas concentrations. Precipitation deficits and changes in evapotranspiration govern net water availability. A lack of sufficient soil moisture, sometimes amplified by increased atmospheric evaporative demand, result in agricultural and ecological drought. Lack of runoff and surface water result in hydrological drought. Drought events are the result of dynamic and/or thermodynamic processes, with thermodynamic processes being the main driver of drought changes under human-induced climate change (high confidence).
11.6.2 Observed Trends
Evidence on observed drought trends was limited at the time of SREX (Chapter 3) and AR5 (Chapter 2). The SREX concluded: ‘There is medium confidence that since the 1950s some regions of the world have experienced a trend to more intense and longer droughts, in particular in southern Europe and west Africa, but in some regions droughts have become less frequent, less intense, or shorter, for example, in Central North America and north-western Australia.’ The assessment at the time did not distinguish between different drought types. This Chapter includes numerous updates on observed drought trends, associated with extensive new literature and longer datasets since AR5.
11.6.2.1 Precipitation Deficits
Strong precipitation deficits have been recorded in recent decades in the Amazon (2005, 2010), south-western China (2009–2010), south-western North America (2011–2014), Australia (1997–2009), California (2014), the middle East (2012–2016), Chile (2010–2015), the Great Horn of Africa (2011), among others (van Dijk et al., 2013; Mann and Gleick, 2015; Rowell et al., 2015; Marengo and Espinoza, 2016; Dai and Zhao, 2017; Garreaud et al., 2017, 2020; Marengo et al., 2017; Brito et al., 2018; Cook et al., 2018). Global studies generally show no significant trends in SPI time series (Orlowsky and Seneviratne, 2013; Spinoni et al., 2014), and in derived drought frequency and severity data (Spinoni et al., 2019), with very few regional exceptions (Section 11.9 and Figure 11.17). Long-term decreases in precipitation are found in some AR6 regions in Africa (Central Africa and East Southern Africa), and several regions in South America (North-Eastern South America, South American Monsoon, South-Western South America, and Southern South America) (Section 11.9). Evidence of precipitation-based drying trends is also found in Western Africa, consistent with studies based on CDD trends (Figure 11.17; Chaney et al., 2014; Donat et al., 2014b; Barry et al., 2018; Dunn et al., 2020), however, there is a partial recovery of the rainfall trends since the 1980s in this region (Section 10.4.2.1). Some AR6 regions show a decrease in meteorological drought, including Northern Australia, Central Australia, Northern Europe and Central North America (Section 11.9). Other regions either do not show substantial trends in long-term meteorological drought, or they display mixed signals depending on the considered time frame and sub-regions, such as in Southern Australia (Gallant et al., 2013; Delworth and Zeng, 2014; Alexander and Arblaster, 2017; Spinoni et al., 2019; Dunn et al., 2020; Rauniyar and Power, 2020) and the Mediterranean (Camuffo et al., 2013; Gudmundsson and Seneviratne, 2016; Spinoni et al., 2017; Stagge et al., 2017; Caloiero et al., 2018; Peña-Angulo et al., 2020b; see also Section 11.9 and Atlas.8.2).
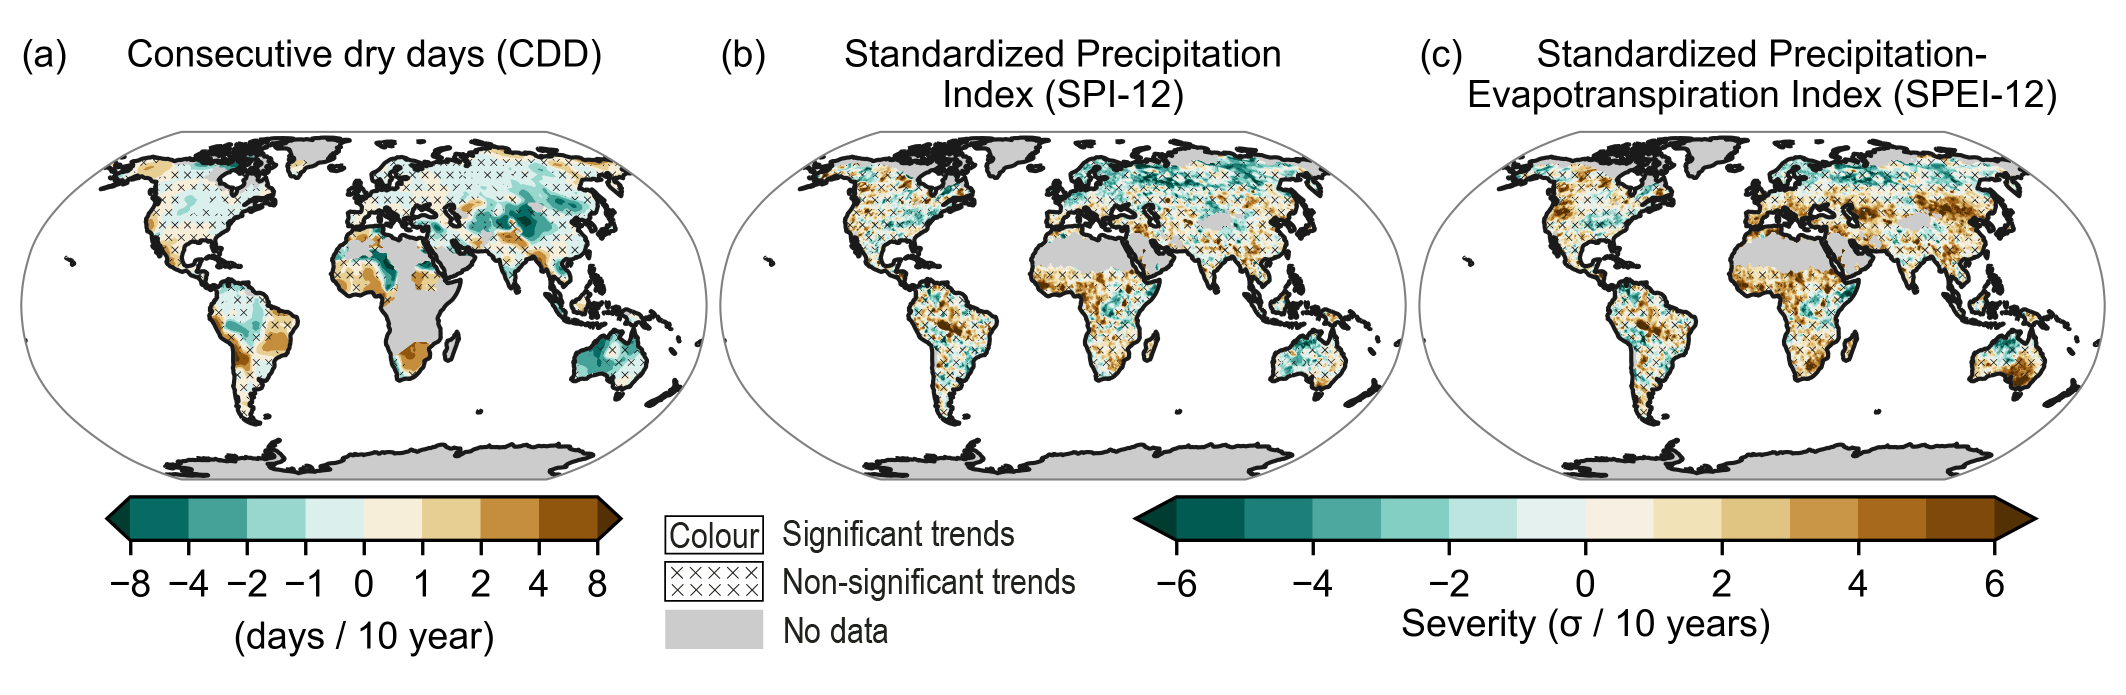 Figure 11.17 | Observed linear trend for (a) consecutive dry days (CDD) during 1960–2018, (b) standardized precipitation index (SPI) and (c) standardized precipitation-evapotranspiration index (SPEI) during 1951–2016. CDD data are from the HadEx3 dataset (Dunn et al., 2020), trend calculation of CDD as in Figure 11.9. Drought severity is estimated using 12-month SPI (SPI-12) and 12-month SPEI (SPEI-12). SPI and SPEI datasets are from Spinoni et al. (2019). The threshold to identify drought episodes was set at -1 SPI/SPEI units. Areas without sufficient data are shown in grey. No overlay indicates regions where the trends are significant at the p = 0.1 level. Crosses indicate regions where trends are not significant. For details on the methods see Supplementary Material 11.SM.2. Further details on data sources and processing are available in the chapter data table (Table 11.SM.9).
 11.6.2.2 Atmospheric Evaporative Demand
In several regions, AED increases have intensified recent drought events (Williams et al., 2014, 2020; Seager et al., 2015b; Basara et al., 2019; García-Herrera et al., 2019), enhanced vegetation stress (Allen et al., 2015; Sanginés de Cárcer et al., 2018; Yuan et al., 2019), or contributed to the depletion of soil moisture or runoff through enhanced ET (high confidence) (Teuling et al., 2013; Padrón et al., 2020). Trends in pan evaporation measurements and Penman-Monteith AED estimates provide an indication of possible trends in the influence of AED on drought. Given the observed global temperature increases (Sections 2.3.1.1 and 11.3) and dominant decrease in relative humidity over land areas (Simmons et al., 2010; Willett et al., 2014), VPD has increased globally (Barkhordarian et al., 2019; Yuan et al., 2019). Pan evaporation has increased as a consequence of VPD changes in several AR6 regions, such as East Asia (Li et al., 2013; Z. Sun et al., 2018; M.-Z. Yang et al., 2018), Western and Central Europe (Mozny et al., 2020), the Mediterranean, (Azorin-Molina et al., 2015) and Central and Southern Australia (Stephens et al., 2018). Nevertheless, there is an important regional variability in observed trends, and in other AR6 regions pan evaporation has decreased – for example, in North Central America (Breña-Naranjo et al., 2017) and in the Tibetan Plateau (C. Zhang et al., 2018)). Physical models also show an important regional diversity, with an increase in New Zealand (Salinger and Porteous, 2014) and the Mediterranean (Gocic and Trajkovic, 2014; Azorin-Molina et al., 2015; Piticar et al., 2016), a decrease in South Asia (Jhajharia et al., 2015), and strong spatial variability in North America (Seager et al., 2015b). This variability is driven by the role of other meteorological variables affecting AED. Changes in solar radiation as a consequence of solar dimming and brightening may affect trends (Section 7.2.2.2; Kambezidis et al., 2012; Wang and Yang, 2014; Sanchez-Lorenzo et al., 2015). Wind speed is also relevant (McVicar et al., 2012b), and studies suggest a reduction of the wind speed in some regions (Z. Zhang et al., 2019b) that could compensate the role of the VPD increase. Nevertheless, the VPD trend seems to dominate the overall AED trends, compared to the effects of trends in wind speed and solar radiation (Wang et al., 2012; Park Williams et al., 2017; Vicente-Serrano et al., 2020a).
11.6.2.3 Soil Moisture Deficits
There are limited long-term measurements of soil moisture from ground observations (Dorigo et al., 2011; Qiu et al., 2016; Quiring et al., 2016), which impedes their use in the analysis of trends. Among the few existing observational studies covering at least two decades, several studies have investigated trends in ground soil moisture in East Asia (Section 11.9; Chen and Sun, 2015b; Liu et al., 2015; Qiu et al., 2016). Alternatively, microwave-based satellite measurements of surface soil moisture have also been used to analyse trends (Dorigo et al., 2012; Jia et al., 2018). Although there is regional evidence that microwave-based soil moisture estimates can capture well drying trends in comparison with ground soil moisture observations (Jia et al., 2018), there is only medium confidence in the derived trends, since satellite soil moisture data are affected by inhomogeneities (Dorigo et al., 2015; Rodell et al., 2018; Preimesberger et al., 2021). Furthermore, microwave-based satellites only sense surface soil moisture, which differs from root-zone soil moisture (Berg et al., 2017a), although relationships can be derived between the two (Brocca et al., 2011). Several studies have also analysed long-term soil moisture time series from observation-driven land-surface or hydrological models, including land-based reanalysis products (Albergel et al., 2013; Jia et al., 2018; Gu et al., 2019b; Markonis et al., 2021). Such models have also been used to assess changes in land water availability, estimated as precipitation minus ET, which is equal to the sum of soil moisture and runoff (Greve et al., 2014; Padrón et al., 2020).
Overall, evidence from global studies suggests that several land regions have been affected by increased soil moisture drying or water balance drying in past decades, despite some spread among products (Albergel et al., 2013; Greve et al., 2014; Gu et al., 2019b; Padrón et al., 2020). Drying has not only occurred in dry regions but also in humid regions (Greve et al., 2014). Some studies have specifically addressed changes in soil moisture at regional scale (Section 11.9). For AR6 regions, several studies suggest an increase in the frequency and areal extent of soil moisture deficits, with examples in East Asia (Cheng et al., 2015; Y. Qin et al., 2015; Jia et al., 2018), Western and Central Europe (Trnka et al., 2015b), and the Mediterranean (Hanel et al., 2018; Moravec et al., 2019; Markonis et al., 2021). Nonetheless, some analyses also show no long-term trends in soil drying in some AR6 regions – for example, in Eastern North America (Park Williams et al., 2017) and Central North America (Seager et al., 2019), as well as in North Eastern Africa (Kew et al., 2021). The soil moisture drying trends identified in both global and regional studies are generally related to increases in ET (associated with higher AED) rather than decreases in precipitation, as identified on global land for trends in water balance in the dry season (Padrón et al., 2020), as well as for some regions (Teuling et al., 2013; Cheng et al., 2015; Trnka et al., 2015a; van Der Linden et al., 2019; X. Li et al., 2020).
Evidence from observed or observations-derived trends in soil moisture and precipitation minus ET, are combined with evidence from SPEI and PDSI-PM studies to derive regional assessments of changes in agricultural and ecological droughts (Section 11.9). This assessment is summarized in Section 11.6.2.6.
11.6.2.4 Hydrological Deficits
There is evidence based on streamflow records of increased hydrological droughts in East Asia (D. Zhang et al., 2018) and southern Africa (Gudmundsson et al., 2019). In areas of Western and Central Europe and Northern Europe, there is no evidence of changes in the severity of hydrological droughts since 1950 based on flow reconstructions (Caillouet et al., 2017; Barker et al., 2019) and observations (Vicente-Serrano et al., 2019). In the Mediterranean region, there is high confidence in hydrological drought intensification (Section 11.9; Giuntoli et al., 2013; Lorenzo-Lacruz et al., 2013; Gudmundsson et al., 2019). In south-eastern South America there is a decrease in the severity of hydrological droughts (Rivera and Penalba, 2018). In North America, depending on the methods, datasets and study periods, there are differences between studies that suggest an increase (Shukla et al., 2015; Udall and Overpeck, 2017) versus a decrease in hydrological drought frequency (Mo and Lettenmaier, 2018), but in general there is strong spatial variability (Poshtiri and Pal, 2016). Streamflow observation reference networks of near-natural catchments have also been used to isolate the effect of climate trends on hydrological drought trends in a few regions, but these show limited trends in Northern Europe and Western and Central Europe (Stahl et al., 2010; Bard et al., 2015; Harrigan et al., 2018), North America (Dudley et al., 2020) and most of Australia, with the exception of Eastern and Southern Australia (X.S. Zhang et al., 2016). Given the low availability of observations, there are few studies analysing trends of drought severity in the groundwater. Nevertheless, some studies suggest a noticeable response of groundwater droughts to climate variability (Lorenzo-Lacruz et al., 2017) and increased drought frequency and severity associated with warming, probably as a consequence of enhanced ET induced by higher AED (Maxwell and Condon, 2016). This is supported by studies in Northern Europe (Bloomfield et al., 2019) and North America (Condon et al., 2020).
11.6.2.5 Atmospheric-based Drought Indices
Globally, trends in SPEI-PM and PDSI-PM suggest slightly higher increases of drought frequency and severity in regions affected by drying over the last decades in comparison to the SPI (Dai and Zhao, 2017; Spinoni et al., 2019; Song et al., 2020), mainly in regions of Western and Southern Africa, the Mediterranean and East Asia (Figure 11.17), which is consistent with observed soil moisture trends (Section 11.6.2.3). These indices suggest that AED has contributed to increase the severity of agricultural and ecological droughts compared to meteorological droughts (García-Herrera et al., 2019; Williams et al., 2020), reduce soil moisture during the dry season (Padrón et al., 2020), increase plant water stress (Allen et al., 2015; Grossiord et al., 2020; Solander et al., 2020) and trigger more severe forest fires (Abatzoglou and Williams, 2016; Turco et al., 2019; Nolan et al., 2020). A number of regional studies based on these drought indices have also shown stronger drying trends in comparison to trends in precipitation-based indices in the following AR6 regions (see also Section 11.9): NSA (R. Fu et al., 2013; Marengo and Espinoza, 2016), SCA (Hidalgo et al., 2017), WCA (Tabari and Aghajanloo, 2013; Sharafati et al., 2020), SAS (Niranjan Kumar et al., 2013), NEAF (Zeleke et al., 2017), WSAF (Edossa et al., 2016), NWN and NEN (Bonsal et al., 2013), EAS (Yu et al., 2014; Chen and Sun, 2015b; L. Li et al., 2020; Liang et al., 2020; Z. Wu et al., 2020) and MED (Kelley et al., 2015; Stagge et al., 2017; González-Hidalgo et al., 2018; Mathbout et al., 2018a).
11.6.2.6 Synthesis for Different Drought Types
Few AR6 regions show observed increases in meteorological drought (Section 11.9), mostly in Africa and South America (NES: high confidence; WAF, CAF, ESAF, SAM, SWS, SSA, SAS: medium confidence); a few others show a decrease (WSB, ESB, NAU, CAU, NEU, CNA: medium confidence). There are stronger signals indicating observed increases in agricultural and ecological drought (Section 11.9), which highlights the role of increased ET, driven by increased AED, for these trends (Sections 11.6.2.3 and11.6.2.5). Past increases in agricultural and ecological droughts are found on all continents and several regions (WAF, CAF, WSAF, ESAF, WCA, ECA, EAS, SAU, MED, WCE, NES: medium confidence), while decreases are found only in one AR6 region (NAU: medium confidence). The more limited availability of datasets makes it more difficult to assess historical trends in hydrological drought at regional scale (Section 11.9). Increasing (MED: high confidence; WAF, EAS, SAU: medium confidence) and decreasing (NEU, SES: medium confidence) trends in hydrological droughts have only been observed in a few regions.
In summary, there is high confidence that AED has increased on average on continents, contributing to increased ET and resulting water stress during periods with precipitation deficits, in particular during dry seasons. There is medium confidence in increases in precipitation deficits in a few regions of Africa and South America. Based on multiple evidence, there is medium confidence that agricultural and ecological droughts have increased in several regions on all continents (WAF, CAF, WSAF, ESAF, WCA, ECA, EAS, SAU, MED, WCE, NES: medium confidence), while there is only medium confidence in decreases in one AR6 region (NAU). More severe hydrological droughts are found in fewer regions (MED: high confidence; WAF, EAS, SAU: medium confidence).
11.6.3 Model Evaluation
11.6.3.1 Precipitation Deficits
ESMs generally show limited performance and large spread in identifying precipitation deficits and associated long-term trends in comparison with observations (Nasrollahi et al., 2015). Meteorological drought trends in the CMIP5 ensemble showed substantial disagreements compared with observations (Orlowsky and Seneviratne, 2013; Knutson and Zeng, 2018) including a tendency to overestimate drying, in particular in mid- to high latitudes (Knutson and Zeng, 2018). The CMIP6 models display a better performance in reproducing long-term precipitation trends or seasonal dynamics in some studies in Southern South America (Rivera and Arnould, 2020), East Asia (Xin et al., 2020), southern Asia (Gusain et al., 2020), and south-western Europe (Peña-Angulo et al., 2020b), but there is still too limited evidence to allow for an assessment of possible differences in performance between CMIP5 and CMIP6. Furthermore, ESMs are generally found to underestimate the severity of precipitation deficits and the dry day frequencies in comparison to observations (Fantini et al., 2018; Ukkola et al., 2018). This is probably related to shortcomings in the simulation of persistent weather events in the mid-latitudes (Section 10.3.3.3). ESMs also show a tendency to underestimate precipitation-based drought persistence at monthly to decadal time scales (Ault et al., 2014; Moon et al., 2018). The overall inter-model spread in the projected frequency of precipitation deficits is also substantial (Touma et al., 2015; Zhao et al., 2016; Engström and Keellings, 2018). Moreover, there are spatial differences in the spread, which is higher in the regions where enhanced drought conditions are projected and under high-emissions scenarios (Orlowsky and Seneviratne, 2013). Nonetheless, some event attribution studies have concluded that droughts at regional scales can be adequately simulated by some climate models (Schaller et al., 2016; Otto et al., 2018c).
11.6.3.2 Atmospheric Evaporative Demand
There is onlylimited evidence on the evaluation of AED in state-of-the-art ESMs, which is performed on externally computed AED, based on model output (Scheff and Frierson, 2015; Liu and Sun, 2016, 2017). An evaluation of average AED in 17 CMIP5 ESMs for 1981–1999 based on potential evaporation show that the models’ spatial patterns resemble the observations, but the magnitude of potential evaporation displays strong divergence among models globally and regionally (Scheff and Frierson, 2015). The evaluation of AED in 12 CMIP5 ESMs with pan evaporation observations in East Asia for 1961–2000 (Liu and Sun, 2016, 2017) show that the ESMs capture seasonal cycles well, but that regional AED averages are underestimated due to biases in the meteorological variables controlling the aerodynamic and radiative components of AED. The CMIP5 ESMs also show a strong underestimation of atmospheric drying trends compared to reanalysis data (Douville and Plazzotta, 2017).
11.6.3.3 Soil Moisture Deficits
The performance of climate models for representing soil moisture deficits shows more uncertainty than for precipitation deficits since, in addition to the uncertainties related to cloud and precipitation processes, there is uncertainty related to the representation of complex soil hydrological and boundary-layer processes (van den Hurk et al., 2011; Lu et al., 2019; Quintana-Seguí et al., 2020). Another limitation is the lack of observations, particularly for soil moisture, in most regions (Section 11.6.2.3) and the paucity of land surface property data to parametrize land surface models, in particular soil types, soil properties and depth (Xia et al., 2015). The spatial resolution of models is an additional limitation since the representation of some land–atmosphere feedbacks and topographic effects requires detailed resolution (Nicolai-Shaw et al., 2015; Van Der Linden et al., 2019). In addition to climate models, land surface and hydrological models are also used to derive historical and projected trends in soil moisture and related land water variables (Albergel et al., 2013; Cheng et al., 2015; Gu et al., 2019b; Padrón et al., 2020; Markonis et al., 2021; Pokhrel et al., 2021).
Overall, there are contrasting results on the performance of land surface models and climate models in representing soil moisture. Some studies suggest that soil moisture anomalies are well captured by land surface models driven with observation-based forcing (Dirmeyer et al., 2006; Albergel et al., 2013; Xia et al., 2014; Balsamo et al., 2015; Reichle et al., 2017; Spennemann et al., 2020), but other studies report limited agreement in the representation of interannual soil moisture variability (Stillman et al., 2016; Yuan and Quiring, 2017; Ford and Quiring, 2019) and noticeable seasonal differences in model skill in some regions (Xia et al., 2014, 2015). Models with good skill can nonetheless display biases in absolute soil moisture (Xia et al., 2014; Gu et al., 2019a), but these are not necessarily of relevance for the simulation of surface water fluxes and drought anomalies (Koster et al., 2009). There is also substantial inter-model spread (Albergel et al., 2013), particularly for the root-zone soil moisture (Berg et al., 2017a).
Regarding the performance of regional and global climate models, an evaluation of an ensemble of RCM simulations for Europe (Stegehuis et al., 2013) shows that these models display overly strong drying in early summer, resulting in an excessive decrease of latent heat fluxes, with potential implications for more severe droughts in dry environments (Teuling, 2018; van Der Linden et al., 2019). Compared with a range of observational ET estimates, CMIP5 models show an overestimation of ET on annual scale, but an ET underestimation in boreal summer in many Northern Hemisphere mid-latitude regions, also suggesting a tendency towards excessive soil drying (Mueller and Seneviratne, 2014), consistent with identified biases in soil-moisture–temperature coupling (Donat et al., 2018; Vogel et al., 2018; Selten et al., 2020). Land surface models used in ESMs display a bias in their representation of the sensitivity of interannual land carbon uptake to soil moisture conditions, which appears related to a limited range of soil moisture variations compared to observations (Humphrey et al., 2018).
For future projections, the spread of soil moisture outputs among different ESMs is more important than internal variability and scenario uncertainty, and the bias is strongly related to the sign of the projected change (Ukkola et al., 2018; Lu et al., 2019; Selten et al., 2020). The CMIP5 ESMs that project more drying and warming in mid-latitude regions show a substantial bias in soil-moisture–temperature coupling (Donat et al., 2018; Vogel et al., 2018). Although CMIP6 and CMIP5 simulations for soil moisture changes are similar overall, some differences are found in projections in a few regions (Section 11.9; Cook et al., 2020). There is still limited evidence to assess whether there are substantial differences in model performance in the two ensembles, but improvements in modelling aspects relevant for soil moisture have been reported for precipitation (Section 11.6.3.2), and a better performance has been found in CMIP6 for the representation of long-term trends in soil moisture in continental USA (Yuan et al., 2021). Despite the mentioned model limitations, the representation of soil moisture processes in ESMs uses physical and biological understanding of the underlying processes, which can well represent the temporal anomalies associated with temporal variability and trends in climate. In summary, there is medium confidence in the representation of soil moisture deficits in ESMs and related land surface and hydrological models.
11.6.3.4 Hydrological Deficits
Streamflow and groundwater are not directly simulated by ESMs, which only simulate runoff, but they are generally represented in hydrological models (Prudhomme et al., 2014; Giuntoli et al., 2015), which are typically driven in a stand-alone manner by observed or simulated climate forcing. The simulation of hydrological deficits is much more problematic than the simulation of mean streamflow or peak flows (Fundel et al., 2013; Stoelzle et al., 2013; Velázquez et al., 2013; Staudinger et al., 2015), since models tend to be too responsive to the climate forcing and do not satisfactorily capture low flows (Tallaksen and Stahl, 2014). Simulations of hydrological drought metrics show uncertainties related to the contribution of both GCMs and hydrological models (Bosshard et al., 2013; Giuntoli et al., 2015; Samaniego et al., 2017; Vetter et al., 2017), but hydrological models forced by the same climate input data also show a large spread (van Huijgevoort et al., 2013; Ukkola et al., 2018). At the catchment scale, the hydrological model uncertainty is higher than both GCM and downscaling uncertainty (Vidal et al., 2016), and the hydrological models show issues in representing drought propagation throughout the hydrological cycle (Barella-Ortiz and Quintana Seguí, 2019). A study on the evaluation of streamflow droughts in seven global (hydrological and land surface) models compared with observations in near-natural catchments of Europe showed a substantial spread among models, an overestimation of the number of drought events, and an underestimation of drought duration and drought-affected area (Tallaksen and Stahl, 2014).
11.6.3.5 Atmospheric-based Drought Indices
A number of studies have analysed the ability of models to capture drought severity and trends based on climatic drought indices. Given the limitations of ESMs in reproducing the dynamic of precipitation deficits and AED (11.6.3.1, 11.6.3.2), atmospheric-based drought indices derived from ESM data for these two variables are also affected by uncertainties and biases. A comparison of historical trends in PDSI-PM for 1950–2014 derived from CMIP3 and CMIP5, with respective estimates derived from observations (Dai and Zhao, 2017) show a similar behaviour at global scale (long-term decrease), but low spatial agreement in the trends except in a few regions (Mediterranean, South Asia, north-western USA). In future projections, there is an important spread in PDSI-PM and SPEI-PM among different models (Cook et al., 2014a).
11.6.3.6 Synthesis for Different Drought Types
The performance of ESMs used to assessed changes in variables related to meteorological droughts, agricultural and ecological droughts, and hydrological droughts, shows the presence of biases and uncertainties compared to observations, but there is medium confidence in their overall performance for assessing drought projections given process understanding. Given the substantial inter-model spread documented for all related variables, the consideration of multi-model projections increases the confidence of model-based assessments, with onlylow confidence in assessments based on single models.
In summary, the evaluation of ESMs, land surface and hydrological models for the simulation of droughts is complex, due to the regional scale of drought trends, their overall low signal-to-noise ratio, and the lack of observations in several regions, in particular for soil moisture and streamflow. There is medium confidence in the ability of ESMs to simulate trends and anomalies in precipitation deficits and AED, and also medium confidence in the ability of ESMs and hydrological models to simulate trends and anomalies in soil moisture and streamflow deficits, on global and regional scales.
11.6.4 Detection and Attribution, Event Attribution
11.6.4.1 Precipitation Deficits
There are only two AR6 regions where there is at least medium confidence that human-induced climate change has contributed to changes in meteorological droughts (Section 11.9). In South-Western South America, there is medium confidence that human-induced climate change has contributed to an increase in meteorological droughts (Boisier et al., 2016; Garreaud et al., 2020), while in Northern Europe, there is medium confidence that it has contributed to a decrease in meteorological droughts (Section 11.9; Gudmundsson and Seneviratne, 2016). In other AR6 regions, there is inconclusive evidence in the attribution of long-term trends, but a human contribution to single meteorological events or sub-regional trends has been identified in some instances (Section 11.9; see also below). In the Mediterranean region, some studies have identified a precipitation decline or increase in meteorological drought probability for time frames since the early or mid 20th century, and a possible human contribution to these trends (Hoerling et al., 2012; Gudmundsson and Seneviratne, 2016; Knutson and Zeng, 2018), also on sub-regional scale in Syria from 1930 to 2010 (Kelley et al., 2015). On the contrary, other studies have not identified precipitation and meteorological drought trends in the region for the long term (Camuffo et al., 2013; Paulo et al., 2016; Vicente-Serrano et al., 2021) and also from the mid 20th century (Norrant and Douguédroit, 2006; Stagge et al., 2017). There is evidence of substantial internal variability in long-term precipitation trends in the region (Section 11.6.2.1), which limits the attribution of human influence on variability and trends of meteorological droughts from observational records (Kelley et al., 2012; Peña-Angulo et al., 2020b). In addition, there are important sub-regional trends showing mixed signals (Section 11.9; MedECC, 2020). The evidence thus leads to an assessment of low confidence in the attribution of observed short-term changes in meteorological droughts in the region (Section 11.9). In North America, the human influence on precipitation deficits is complex (Wehner et al., 2017), with low confidence in the attribution of long-term changes in meteorological drought in AR6 regions (Section 11.9; Lehner et al., 2018). In Africa there is low confidence that human influence has contributed to the observed long-term meteorological drought increase in Western Africa (Sections 11.9 and 10.6.2). There is low confidence in the attribution of the observed increasing trends in meteorological drought in East Southern Africa, but evidence that human-induced climate change has affected recent meteorological drought events in the region (Section 11.9).
Attribution studies for recent meteorological drought events are available for various regions. In Western and Central Europe, a multi-method and multi-model attribution study on the 2015 Central European drought did not find conclusive evidence for whether human-induced climate change was a driver of the rainfall deficit, as the results depended on model and method used (Hauser et al., 2017). In the Mediterranean region, a human contribution was found in the case of the 2014 meteorological drought in the southern Levant based on a single-model study (Bergaoui et al., 2015). In Africa, there is some evidence of a contribution of human emissions to single meteorological drought events, such as the 2015–2017 southern African drought (Funk et al., 2018a; Yuan et al., 2018a; Pascale et al., 2020), and the three-year (2015–2017) drought in the western Cape Town region of South Africa (Otto et al., 2018c). An attributable signal was not found in droughts that occurred in different years with different spatial extents in the last decade in North and South Eastern Africa (Marthews et al., 2015; Uhe et al., 2017; Otto et al., 2018a; Philip et al., 2018b; Kew et al., 2021). However, an attributable increase in 2011 long rain failure was identified (Lott et al., 2013). Further studies have attributed some African meteorological drought events to large-scale modes of variability, such as the strong 2015 El Niño (Box 11.4; Philip et al., 2018b) and increased SSTs overall (Funk et al., 2015a, 2018b). Natural variability was dominant in the California droughts of 2011–2012 to 2013–2014 (Seager et al., 2015a). In Asia, no climate change signal was found in the record dry spell over Singapore and Malaysia in 2014 (Mcbride et al., 2015) or the drought in central south-west Asia in 2013–2014 (Barlow and Hoell, 2015). Nevertheless, the South East Asia drought of 2015 has been attributed to anthropogenic warming effects (Shiogama et al., 2020). Recent droughts occurring in South America, specifically in the southern Amazon region in 2010 (Shiogama et al., 2013) and in north-east South America in 2014 (Otto et al., 2015b) and 2016 (Martins et al., 2018) were not attributed to anthropogenic climate change. Nevertheless, the central Chile drought between 2010 and 2018 has been suggested to be partly associated to global warming (Boisier et al., 2016; Garreaud et al., 2020). The 2013 New Zealand meteorological drought was attributed to human influence by Harrington et al. (2014, 2016) based on fully coupled CMIP5 models, but no corresponding change in the dry end of simulated precipitation from a stand-alone atmospheric model was found by Angélil et al. (2017).
Event attribution studies also highlight a complex interplay of anthropogenic and non-anthropogenic climatological factors for some events. For example, anthropogenic warming contributed to the 2014 drought in North Eastern Africa by increasing east African and west Pacific temperatures, and increasing the gradient between standardized western and central Pacific SSTs, causing reduced rainfall (Funk et al., 2015a). As different methodologies, models and data sources have been used for the attribution of precipitation deficits, Angélil et al. (2017) re-examined several events using a single analytical approach and climate model and observational datasets. Their results showed a disagreement in the original anthropogenic attribution in a number of precipitation deficit events, which increased uncertainty in the attribution of meteorological droughts events.
11.6.4.2 Soil Moisture Deficits
There is a growing number of studies on the detection and attribution of long-term changes in soil moisture deficits. Mueller and Zhang (2016) concluded that anthropogenic forcing contributed significantly to soil moisture drying in the warm season in the Northern Hemisphere from 1951 to 2005 and also led to an increase in the land surface area affected by soil moisture deficits, which can be reproduced by CMIP5 models only if anthropogenic forcings are involved. Gu et al. (2019b) similarly identified a global-scale soil moisture drying tendency in land surface model data from the Global Land Data Assimilation System 2 over the time frame 1948–2005, which was attributed to anthropogenic forcing based on evaluation with CMIP5 models using optimal fingerprinting. Padrón et al. (2019) analysed long-term reconstructed and CMIP5 simulated dry season water availability, defined as precipitation minus ET (i.e., equivalent to soil moisture and runoff availability), also related to agricultural and ecological droughts. They found an intensification of dry-season precipitation minus evapotranspiration deficits over a predominant fraction of the land area in the last three decades, which can only be explained by anthropogenic forcing and is mostly related to increases in ET. Similarly, Williams et al. (2020) concluded that human-induced climate change contributed to the strong soil moisture deficits recorded in the last two decades in Western North America through VPD increases associated with higher air temperatures and lower air humidity. There are few studies analysing the attribution of particular episodes of soil moisture deficits to anthropogenic influence. Nevertheless, the available modelling studies coincide in supporting an anthropogenic attribution associated with more extreme temperatures, exacerbating AED and increasing ET, and thus depleting soil moisture, as observed in southern Europe in 2017 (García-Herrera et al., 2019) and in Australia in 2018 (Lewis et al., 2020) and 2019 (van Oldenborgh et al., 2021), the latter event having strong implications in the propagation of widespread megafires (Nolan et al., 2020).
11.6.4.3 Hydrological Deficits
It is often difficult to separate the role of climate trends from changes in land use, water management and demand for changes in hydrological deficits, especially on a regional scale. However, a global study based on a recent multi-model experiment with global hydrological models and covering several AR6 regions suggests a dominant role of anthropogenic radiative forcing for trends in low, mean and high flows, while simulated effects of water and land management do not suffice to reproduce the observed spatial pattern of trends (Gudmundsson et al., 2021). Regional studies also suggest that climate trends have been dominant compared to land use and human water management for explaining trends in hydrological droughts in some regions, for instance in Ethiopia (Fenta et al., 2017), China (Xie et al., 2015), and North America for the Missouri and Colorado basins, as well as in California (Shukla et al., 2015; Udall and Overpeck, 2017; Ficklin et al., 2018; K. Xiao et al., 2018; Glas et al., 2019; Martin et al., 2020; Milly and Dunne, 2020).
In other regions, the influence of human water uses can be more important to explain hydrological drought trends (Y. Liu et al., 2016; Mohammed and Scholz, 2016). There is medium confidence that human-induced climate change has contributed to an increase of hydrological droughts in the Mediterranean (Giuntoli et al., 2013; Vicente-Serrano et al., 2014; Gudmundsson et al., 2017), but also medium confidence that changes in land use and terrestrial water management contributed to these trends (Section 11.9; Teuling et al., 2019; Vicente-Serrano et al., 2019). A global study with a single hydrological model estimated that human water consumption has intensified the magnitude of hydrological droughts by 20–40% over the last 50 years, and that the human water use contribution to hydrological droughts was more important than climatic factors in the Mediterranean, and central USA, as well as in parts of Brazil (Wada et al., 2013). However, Gudmundsson et al. (2021) concluded that the contribution of human water use is smaller than that of anthropogenic climate change to explain spatial differences in the trends of low flows based on a multi-model analysis. There is still limited evidence and thus low confidence in assessing these trends at the scale of single regions, with few exceptions (Section 11.9).
11.6.4.4 Atmospheric-based Drought Indices
Different studies using atmospheric-based drought indices suggest an attributable anthropogenic signal, characterized by the increased frequency and severity of droughts (Cook et al., 2018), associated to increased AED (Section 11.6.4.2). The majority of studies are based on the PDSI-PM. Williams et al. (2015) and Griffin and Anchukaitis (2014) concluded that increased AED has had an increased contribution to drought severity over the last decades, and played a dominant role in the intensification of the 2012–2014 drought in California. The same temporal pattern and physical mechanism was stressed by Z. Li et al. (2017) in central Asia. Marvel et al. (2019) compared tree ring-based reconstructions of the PDSI-PM over the past millennium with PDSI-PM estimates based on output from CMIP5 models. The comparisons suggested a contribution of greenhouse gas forcing to the changes since the beginning of the 20th century, although characterized with temporal differences that could be driven by temporal variations in the aerosol forcing. This was in agreement with the dominant external forcings of aridification at global scale between 1950 and 2014 (Bonfils et al., 2020). In the Mediterranean region, there is medium confidence of drying attributable to antropogenic forcing as a consequence of the strong AED increase (Gocic and Trajkovic, 2014; Azorin-Molina et al., 2015; Liuzzo et al., 2016; Maček et al., 2018), which has enhanced the severity of drought events (Vicente-Serrano et al., 2014; Stagge et al., 2017; González-Hidalgo et al., 2018). In particular, this effect was identified to be the main driver of the intensification of the 2017 drought that affected south-western Europe, and was attributed to the human forcing (García-Herrera et al., 2019). Nangombe et al. (2020) and L. Zhang et al. (2020) concluded from differences between precipitation and AED that anthropogenic forcing contributed to the 2018 droughts that affected southern Africa and south-eastern China, respectively, principally as consequence of the high AED that characterized these two events.
11.6.4.5 Synthesis for Different Drought Types
The regional evidence on attribution for single AR6 regions generally shows low confidence for a human contribution to observed trends in meteorological droughts at regional scale, with few exceptions (Section 11.9). There is medium confidence that human influence has contributed to increases in agricultural and ecological droughts in the dry season in some regions and has led to an overall increase in the affected land area. At regional scales, there is medium confidence in a contribution of human-induced climate change to increases in agricultural and ecological droughts in the Mediterranean and Western North America (Section 11.9). There is medium confidence that human-induced climate change has contributed to an increase in hydrological droughts in the Mediterranean region, but also medium confidence in contributions from other human influences, including water management and land use (Section 11.9). Several meteorological and agricultural and ecological drought events have been attributed to human-induced climate change, even in regions where no long-term changes are detected (medium confidence). However, a lack of attribution to human-induced climate change has also been shown for some events (medium confidence).
In summary, human influence has contributed to increases in agricultural and ecological droughts in the dry season in some regions due to increases in evapotranspiration (medium confidence). The increases in evapotranspiration have been driven by increases in atmospheric evaporative demand induced by increased temperature, decreased relative humidity and increased net radiation over affected land areas (high confidence). There is low confidence that human influence has affected trends in meteorological droughts in most regions, butmedium confidence that they have contributed to the severity of some single events. There is medium confidence that human-induced climate change has contributed to increasing trends in the probability or intensity of recent agricultural and ecological droughts, leading to an increase of the affected land area. Human-induced climate change has contributed to global-scale change in low flow, but human water management and land-use changes are also important drivers (medium confidence).
11.6.5 Projections
The SREX (Chapter 3) asssessed with medium confidence projections of increased drought severity in some regions, including southern Europe and the Mediterranean, central Europe, central America and Mexico, north-east Brazil, and southern Africa, and low confidence elsewhere given large inter-model spread. The AR5 (Chapters 11 and 12) also assessed large uncertainties in drought projections at the regional and global scales. The assessment of drought mechanisms under future climate change scenarios depends on the model used (Section 11.6.3). Moreover, uncertainties in drought projections are affected by the consideration of plant physiological responses to increasing atmospheric CO2 (Cross-Chapter Box 5.1; Milly and Dunne, 2016; Greve et al., 2019; Mankin et al., 2019; Yang et al., 2020), the role of soil-moisture–atmosphere feedbacks for changes in water balance and aridity (Berg et al., 2016; Zhou et al., 2021), and statistical issues related to considered drought time scales (Vicente-Serrano et al., 2020c). Nonetheless, the extensive literature available since AR5 allows a substantially more robust assessment of projected changes in droughts, also subdivided in different drought types (meteorological drought, agricultural and ecological drought, and hydrological drought). This includes assessments of projected changes in droughts, including changes at 1.5°C, 2°C and 4°C of global warming, for all AR6 regions (Section 11.9). Projected changes show increases in drought frequency and intensity in several regions as function of global warming (high confidence). There are also substantial increases in drought hazard probability from 1.5°C to 2°C global warming and for further additional increments of global warming (high confidence) (Figures 11.18 and 11.19). These findings are based on both CMIP5 and CMIP6 analyses (Section 11.9; Wartenburger et al., 2017; Greve et al., 2018; L. Xu et al., 2019), and strengthen the conclusions of SR1.5 Chapter 3.
11.6.5.1 Precipitation Deficits
Studies based on CMIP5, CMIP6 and Coordinated Regional Climate Downscaling Experiment (CORDEX) projections show a consistent signal in the sign and spatial pattern of projections of precipitation deficits. Global studies based on these multi-model ensemble projections (Orlowsky and Seneviratne, 2013; Martin, 2018; Spinoni et al., 2020; Ukkola et al., 2020; Coppola et al., 2021b) show particularly strong signal-to-noise ratios for increasing meteorological droughts in the following AR6 regions: MED, ESAF, WSAF, SAU, CAU, NCA, SCA, NSA and NES (Section 11.9). There is also substantial evidence of changes in meteorological droughts at 1.5°C versus 2°C of global warming from global studies (Wartenburger et al., 2017; L. Xu et al., 2019). The patterns of projected changes in mean precipitation are consistent with the changes in the drought duration, but they are not consistent with the changes in drought intensity (Ukkola et al., 2020). In general, CMIP6 projections suggest a stronger increase of the probability of precipitation deficits than CMIP5 projections (Cook et al., 2020; Ukkola et al., 2020). Projections for the number of CDDs in CMIP6 (Figure 11.19) for different levels of global warming relative to 1850–1900 show similar spatial patterns as projected precipitation deficits. The robustness of the patterns in projected precipitation deficits identified in the global studies is also consistent with results from regional studies (Giorgi et al., 2014; Marengo and Espinoza, 2016; Pinto et al., 2016; J. Huang et al., 2018; Maúre et al., 2018; Nangombe et al., 2018; Tabari and Willems, 2018; Abiodun et al., 2019; Dosio et al., 2019).
In Africa, a strong increase in the length of dry spells (CDD) is projected for 4°C of global warming over most of the continent, with the exception of central and eastern Africa (Section 11.9; Sillmann et al., 2013a; Giorgi et al., 2014; Han et al., 2019). In West Africa, a strong reduction of precipitation is projected (Sillmann et al., 2013a; Diallo et al., 2016; Akinsanola and Zhou, 2019; Han et al., 2019; Todzo et al., 2020) at 4°C of global warming, and CDD would increase with stronger global warming levels (Klutse et al., 2018). The regions most strongly affected are southern Africa (ESAF, WSAF) (Nangombe et al., 2018; Abiodun et al., 2019) and northern Africa (part of the MED region), with increases in meteorological droughts already at 1.5°C of global warming, and further increases with increasing global warming (Section 11.9). CDD is projected to increase more in the southern Mediterranean (northern Africa) than in the northern part of the Mediterranean region (Lionello and Scarascia, 2020).
In Asia, most AR6 regions showlow confidence in projected changes in meteorological droughts at 1.5°C and 2°C of global warming, with a few regions displaying a decrease in meteorological droughts at 4°C of global warming (RAR, ESB, RFE, ECA; medium confidence), although there is a projected increase in meteorological droughts in South East Asia at 4°C (medium confidence) (Section 11.9). In South East Asia, an increasing frequency of precipitation deficits is projected as a consequence of an increasing frequency of extreme El Niño (Cai et al., 2014b, 2015, 2018).
In Central America, projections suggest an increase in mid-summer meteorological drought (Imbach et al., 2018) and increased CDD (Chou et al., 2014a; Giorgi et al., 2014; Nakaegawa et al., 2014). In the Amazon, there is also a projected increase in dryness (Marengo and Espinoza, 2016), which is the combination of a projected increase in the frequency and geographic extent of meteorological drought in the eastern Amazon, and an opposite trend in the west (Duffy et al., 2015). In South-Western South America, there is a projected increase of CDD (Chou et al., 2014a; Giorgi et al., 2014) and in Chile, drying is projected to prevail (Boisier et al., 2018). In the South America monsoon region, an increase in CDD is projected (Chou et al., 2014a; Giorgi et al., 2014), but a decrease is projected in South-Eastern and Southern South America (Giorgi et al., 2014). In Central America, mid-summer meteorological drought is projected to intensify during 2071–2095 for the RCP8.5 scenario (Corrales‐Suastegui et al., 2020).
An increase in the frequency, duration and intensity of meteorological droughts is projected in south-west, south and east Australia (Kirono et al., 2020; Shi et al., 2020). In Canada and most of the USA, based on the SPI, Swain and Hayhoe (2015) identified drier summer conditions in projections over most of the region, and there is a consistent signal toward an increase in duration and intensity of droughts in southern North America (Pascale et al., 2016; Escalante-Sandoval and Nuñez-Garcia, 2017). In California, more precipitation variability is projected, characterized by increased frequency of consecutive drought and humid periods (Swain et al., 2018).
Substantial increases in meteorological drought are projected in Europe, in particular in the Mediterranean region, already at 1.5°C of global warming (Section 11.9). In southern Europe, model projections display a consistent drying among models (Russo et al., 2013; Hertig and Tramblay, 2017; Guerreiro et al., 2018a; Raymond et al., 2019). In Western and Central Europe there is some spread in CMIP5 projections, with some models projecting very strong drying, and others close to no trend (Vogel et al., 2018), although CDD is projected to increase in CMIP5 projections under the RCP 8.5 scenario (Hari et al., 2020). The overall evidence suggests an increase in meteorological drought at 4°C in the WCE region (medium confidence) (Section 11.9).
Overall, based on global and regional studies, several hot spot regions are identified, displaying more frequent and severe meteorological droughts with increasing global warming, including several AR6 regions at 1.5°C (WSAF, ESAF, SAU, MED, NES) and 2°C of global warming (WSAF, ESAF, EAU, SAU, MED, NCA, SCA, NSA, NES) (Section 11.9). At 4°C of global warming, there is also confidence in increases in meteorological droughts in further regions (WAF, WCE, ENA, CAR, NWS, SAM, SWS, SSA; Section 11.9), showing a geographical expansion of meteorological drought with increasing global warming. Only few regions are projected to have less intense or frequent meteorological droughts (Section 11.9).
11.6.5.2 Atmospheric Evaporative Demand
Effects of AED on droughts in future projections is under debate. The CMIP5 models project an increase in AED over the majority of the world with increasing global warming, mostly as a consequence of strong VPD increases (Scheff and Frierson, 2015; Vicente-Serrano et al., 2020a). However, ET is projected to increase less than AED in many regions due to plant physiological responses related to: i) CO2 effects on plant photosynthesis; and ii) soil moisture control on ET.
Several studies suggest that increasing atmospheric CO2 could lead to reduced leaf stomatal conductance, which would increase water-use efficiency and reduce plant water needs, thus limiting ET (Cross-Chapter Box 5.1; Roderick et al., 2015; Milly and Dunne, 2016; Swann et al., 2016; Greve et al., 2017; Scheff et al., 2017; Lemordant et al., 2018; Swann, 2018). The implemention of a CO2 -dependent land resistance parameter has been suggested for the estimation of AED (Yang et al., 2019). Nevertheless, there are other relevant mechanisms, as soil moisture deficits and VPD also play an important role in the control of the leaf stomatal conductance (Z. Xu et al., 2016; Menezes-Silva et al., 2019; Grossiord et al., 2020), and a number of ecophysiological and anatomical processes affect the response of plant physiology under higher atmospheric CO2 concentrations (Cross-Chapter Box 5.1; Mankin et al., 2019; Menezes-Silva et al., 2019). The benefits of the atmospheric CO2 for plant stress and agricultural and ecological droughts would be minimal precisely during dry periods given stomatal closure in response to limited soil moisture (Allen et al., 2015; Z. Xu et al., 2016). In addition, CO2 effects on plant stomatal conductance could not entirely compensate for the increased demand associated with warming (Liu and Sun, 2017); in large tropical and subtropical regions (e.g., southern Africa, the Amazon, the Mediterranean and southern North America), AED is projected to increase, even considering the possible CO2 effects on land resistance (Vicente-Serrano et al., 2020a). Moreover, these CO2 effects would not affect the direct evaporation from soil and water bodies, which is very relevant in the reservoirs of warm areas (Friedrich et al., 2018). Because of these uncertainties, there is low confidence whether increased CO2 -induced water-use efficiency in vegetation will substantially reduce global plant transpiration and will diminish the frequency and severity of soil moisture and streamflow deficits associated with the radiative effect of higher CO2 concentrations (Cross-Chapter Box 5.1).
Another mechanism reducing the ET response to increased AED in projections is the control of soil moisture limitations on ET, which leads to reduced stomatal conductance under water stress (Berg and Sheffield, 2018; Stocker et al., 2018; Zhou et al., 2021). This response may be further amplified through VPD-induced decreases in stomatal conductance (Anderegg et al., 2020). However, the decreased stomatal conductance in response to soil moisture limitation and enhanced CO2 would further enhance AED (Sherwood and Fu, 2014; Berg et al., 2016; Teuling, 2018; Miralles et al., 2019), whereby the overall effects on AED in ESMs are found to be of similar magnitude for soil moisture limitation and CO2 physiological effects on stomatal conductance (Berg et al., 2016). Increased AED is thus both a driver and a feedback with respect to changes in ET, complicating the interpretation of its role on drought changes with increasing CO2 concentrations and global warming.
11.6.5.3 Soil Moisture Deficits
Areas with projected soil moisture decreases do not fully coincide with areas that have projected precipitation decreases, although there is substantial consistency in the respective patterns (Dirmeyer et al., 2013; Berg and Sheffield, 2018). However, there are more regions affected by increased soil moisture deficits (Figure 11.19) than precipitation deficits (Figures 2a,b,c and Cross-Chapter Box 11.1) as a consequence of enhanced AED and the associated increased ET, as highlighted by some studies (Orlowsky and Seneviratne, 2013; Dai et al., 2018; Section 8.2.2.1). Moisture in the top soil layer is projected to decrease more than precipitation at all warming levels (Lu et al., 2019), extending the regions affected by severe soil moisture deficits over most of south and central Europe (Lehner et al., 2017; Ruosteenoja et al., 2018; Samaniego et al., 2018; van Der Linden et al., 2019), southern North America (Cook et al., 2019), South America (Orlowsky and Seneviratne, 2013), southern Africa (Lu et al., 2019), East Africa (Rowell et al., 2015), Southern Australia (Kirono et al., 2020), India (Mishra et al., 2014a) and East Asia (Figure 11.19; Cheng et al., 2015). Projected changes in total soil moisture display less widespread drying than those for surface soil moisture (Berg et al., 2017a), but still more than for precipitation (Cross-Chapter Box 11.1, Figures 2a,b,c). The severity of droughts based on surface soil moisture in future projections is stronger than projections based on precipitation and runoff (Dai et al., 2018; Vicente-Serrano et al., 2020c). Nevertheless, in many parts of the world where soil moisture is projected to decrease, the signal-to-noise ratio among models is low; only the projections in the Mediterranean, Europe, the south-western USA, and southern Africa show a high signal-to-noise ratio in soil moisture projections (Figure 11.19; Lu et al., 2019). Increases in soil moisture deficits are found to be statistically signicant at regional scale in the Mediterranean region, southern Africa and western South America for changes as small as 0.5°C in global warming, based on differences between +1.5°C and +2°C of global warming (Wartenburger et al., 2017). Several other regions are affected when considering changes in droughts for higher changes in global warming (Section 11.9 and Figure 11.19). Seasonal projections of drought frequency for boreal winter (December–January–February) and summer (June–July–August), from CMIP6 multi-model ensemble for 1.5°C, 2°C and 4°C global warming levels, show contrasting trends (Figure 11.19). In the boreal winter in the Northern Hemisphere, the areas affected by drying show high agreement with those characterized by an increase in meteorological drought projections (Figures 8.14 and 12.4). On the contrary, in the boreal summer, the drought frequency increases worldwide in comparison to meteorological drought projections, with large areas of the Northern Hemisphere displaying a high signal-to-noise ratio (low spead between models). This stresses the dominant influence of ET (as a result of increased AED) in intensifying agricultural and ecological droughts in the warm season in many locations, including mid- to high latitudes.
Increased soil moisture limitation and associated changes in droughts are projected to lead to increased vegetation stress affecting the global land carbon sink in ESM projections (Green et al., 2019), with implications for projected global warming (Cross-Chapter Box 5). There is high confidence that the global land sink will become less efficient due to soil moisture limitations and associated agricultural and ecological drought conditions in some regions in higher-emissions scenarios, specially under global warming levels above 4°C; however, there is low confidence in how these water cycle feedbacks will play out in lower-emissions scenarios (at 2°C global warming or lower; Cross-Chapter Box 5.1).
 Figure 11.18 | Projected changes in (a) the intensity and (b) the frequency of drought under 1°C, 1.5°C, 2°C, 3°C, and 4°C global warming levels relative to the 1850–1900 baseline. (c) Summaries are computed for the AR6 regions in which there is at least medium confidence in an increase in agriculture/ecological drought at the 2°C global warming level (‘drying regions’), including Western North America, Central North America, North Central America, Southern Central America, Northern South America, North-Eastern South America, South American Monsoon, South-Western South America, Southern South America, West and Central Europe, Mediterranean, West Southern Africa, East Southern Africa, Madagascar, Eastern Australia, Southern Australia. Caribbean is not included in the calculation because the number of land grid points was too small. A drought event is defined as a 10-year drought event whose annual mean soil moisture was below its 10th percentile from the 1850–1900 base period. For each box plot, the horizontal line and the box represent the median and central 66% uncertainty range, respectively, of the frequency or the intensity changes across the multi-model ensemble, and the ‘whiskers’ extend to the 90% uncertainty range. The line of zero in (a) indicates no change in intensity, while the line of one in (b) indicates no change in frequency. The results are based on the multi-model ensemble estimated from simulations of global climate models contributing to the Coupled Model Intercomparison Project Phase 6 (CMIP6) under different Shared Socio-economic Pathway (SSP) forcing scenarios. Intensity changes in (a) are expressed as standard deviations of the interannual variability in the period 1850–1900 of the corresponding model. For details on the methods see Supplementary Material 11.SM.2. Further details on data sources and processing are available in the chapter data table (Table 11.SM.9).
 11.6.5.4 Hydrological Deficits
Some studies support wetting tendencies as a response to a warmer climate when considering globally averaged changes in runoff over land (Roderick et al., 2015; Greve et al., 2017; Y. Yang et al., 2018), and streamflow projections respond to enhanced CO2 concentrations in CMIP5 models (Yang et al., 2019). Nevertheless, when focusing regionally on low-runoff periods, model projections also show an increase of hydrological droughts in large world regions (Wanders and Van Lanen, 2015; Dai et al., 2018; Vicente-Serrano et al., 2020c). In general, the frequency of hydrological deficits is projected to increase over most of the continents, although with regionally and seasonally differentiated effects (Section 11.9), with medium confidence of increase in the following AR6 regions: WCE, MED, SAU, WCA, WNA, SCA, NSA, SAM, SWS, SSA, WSAF, ESAF and MDG (Section 11.9; Forzieri et al., 2014; Prudhomme et al., 2014; Giuntoli et al., 2015; Wanders and Van Lanen, 2015; Roudier et al., 2016; Marx et al., 2018; Cook et al., 2019; Zhao et al., 2020). However, there are large uncertainties related to the hydrological/impact model used (Prudhomme et al., 2014; Schewe et al., 2014; Gosling et al., 2017), limited signal-to-noise ratio (due to model spread) in several regions (Giuntoli et al., 2015), and also uncertainties in the projection of future human activities, including water demand and land cover changes, which may represent more than 50% of the projected changes in hydrological droughts in some regions (Wanders and Wada, 2015).
Regions dependent on mountainous snowpack as a temporary reservoir may be affected by severe hydrological droughts in a warmer world. In the southern European Alps, both winter and summer low flows are projected to be more severe, with a 25% decrease in the 2050s (Vidal et al., 2016). In western USA, a 22% reduction in winter snow water equivalent is projected at around 2°C of global warming, with a further decrease of a 70% reduction at 4°C global warming (Rhoades et al., 2018). This decline would cause less predictable hydrological droughts in snowmelt-dominated areas of North America (Livneh and Badger, 2020). The exact magnitude of the influence of higher temperatures on snow-related droughts is, however, difficult to estimate (Mote et al., 2016), since the streamflow changes could affect the timing of peak streamflows but not necessarily their magnitude. In addition, projected changes in hydrological droughts downstream of declining glaciers can be very complex to assess (Chapter 9, see also SROCC).
11.6.5.5 Atmospheric-based Drought Indices
Studies show a stronger drying in projections based on atmospheric-based drought indices compared to ESM projections of changes in soil moisture (Berg and Sheffield, 2018) and runoff (Yang et al., 2019). It has been suggested that this difference is due to physiological CO2 effects (Section 11.6.5.2; Roderick et al., 2015; Milly and Dunne, 2016; Swann et al., 2016; Lemordant et al., 2018; Scheff, 2018; Swann, 2018; Greve et al., 2019; Yang et al., 2020). Nonetheless, there is evidence that differences in projections between atmospheric-based drought indices and water-balance metrics from ESMs are not alone due to CO2 -plant effects (Berg et al., 2016; Scheff et al., 2021). Differences can also be related to the fact that AED is an upper bound for ET in dry regions and conditions (Section 11.6.1.2) and that soil moisture stress limits increases in ET in projections (Section 11.6.5.2; Berg et al., 2016; Zhou et al., 2021). In general, atmospheric-based indices show more drying than total column soil moisture (Berg and Sheffield, 2018; Cook et al., 2020; Scheff et al., 2021), but are more consistent with projected increases in surface soil moisture deficits (Dirmeyer et al., 2013; Dai et al., 2018; Lu et al., 2019; Cook et al., 2020; Vicente-Serrano et al., 2020c).
Atmospheric-based drought indices are not metrics of soil moisture or runoff (Section 11.6.1.5) so their projections may not necessarily reflect the same trend of online simulated soil moisture and runoff. Independently of effects on the land water balance, atmospheric-based drought indices will reflect the potential vegetation stress resulting from deficits between available water and enhanced AED, even in conditions with no or low ET. Under dry conditions, the enhanced AED associated with human forcing would increase plant water stress (Brodribb et al., 2020), with effects on widespread forest dieback and mortality (Anderegg et al., 2013; Williams et al., 2013; Allen et al., 2015; McDowell and Allen, 2015; McDowell et al., 2016, 2020), and stronger risk of megafires (Flannigan et al., 2016; Podschwit et al., 2018; Clarke and Evans, 2019; Varela et al., 2019). For these reasons, there is high confidence that the future projections of enhanced drought severity showed by the PDSI-PM and the SPEI-PM are representative of more frequent and severe plant stress episodes and more severe agricultural and ecological drought impacts in some regions.
Global tendencies towards more severe and frequent agricultural and ecological drought conditions are identified in future projections when focusing on atmospheric-based drought indices such as the PDSI-PM or the SPEI-PM. They expand the spatial extent of drought conditions compared to meteorological drought to most of North America, Europe, Africa, Central and East Asia and Southern Australia (Cook et al., 2014a; Chen and Sun, 2017a, b; Gao et al., 2017b; Lehner et al., 2017; Zhao and Dai, 2017; Dai et al., 2018; Naumann et al., 2018; Potopová et al., 2018; Gu et al., 2020; Vicente-Serrano et al., 2020c; Dai, 2021). Projections in PDSI-PM and SPEI-PM are used to complement total soil moisture projections in assessing projected changes in agricultural and ecological drought (Section 11.9).
11.6.5.6 Synthesis for Different Drought Types
The tables in Section 11.9 provide assessed projected changes in metorological drought, agricultural and ecological drought, and hydrological droughts. The assessment shows that several regions will be affected by more severe agricultural and ecological droughts even if global warming is stabilized at 2°C, including MED, WSAF, SAM and SSA (high confidence), and ESAF, MDG, EAU, SAU, SCA, CAR, NSA, NES, SWS, WCE, NCA, WNA and CNA (medium confidence). Some regions are also projected to be affected by more severe agricultural and ecological droughts at 1.5°C (MED, WSAF, ESAF, SAU, NSA, SAM, SSA, can; medium confidence) At 4°C of global warming, even more regions would be affected by agricultural and ecological droughts (WCE, MED, CAU, EAU, SAU, WCA, EAS, SCA, CAR, NSA, NES, SAM, SWS, SSA, NCA, CNA, ENA, WNA, WSAF, ESAF and MDG). NEAF, SAS are also projected to experience less agricultural and ecological drought with global warming (medium confidence). Projected changes in meteorological droughts are, overall, less extended but also affect several AR6 regions, at 1.5°C and 2°C (MED, EAU, SAU, SCA, NSA, NCA, WSAF, ESAF, MDG) and 4°C of global warming (WCE, MED, EAU, SAU, SEA, SCA, CAR, NWS, NSA, NES, SAM, SWS, SSA, NCA, ENA, WAF, WSAF, ESAF, MDG). Several regions are also projected to be affected by more hydrological droughts at 1.5°C and 2°C (WCE, MED, WNA, WSAF, ESAF) and 4°C of global warming (NEU, WCE, EEU, MED, SAU, WCA, SCA, NSA, SAM, SWS, SSA, WNA, WSAF, ESAF, MDG). To illustrate the changes in both intensity and frequency of drought in the regions where strongest changes are projected, Figure 11.18 displays changes in the intensity and frequency of soil moisture drought under different global warming levels (1.5°C, 2°C, 4°C) relative to the 1851-1900 baseline based on CMIP6 simulations under different SSP forcing scenarios averaged over “drying regions”, i.e. AR6 regions for which there is at least medium confidence in increase in agricultural and ecological drought at 2°C of global warming. The 90% uncertainty ranges for the projected changes in both intensity and frequency are above zero, indicating significant increase in both intensity and frequency of drought in these regions as whole.
In summary, more regions are affected by increases in agricultural and ecological droughts with increasing global warming (high confidence). New evidence strengthens the SR1.5 conclusion that even relatively small incremental increases in global warming (+0.5°C) cause a worsening of droughts in some regions (high confidence). Some regions are projected to be affected by more severe agricultural and ecological droughts at 1.5°C of global warming (MED, WSAF, ESAF, SAU, NSA, SAM, SSA, can; medium confidence). A larger number of regions are projected to be affected by more severe agricultural and ecological droughts at 2°C of global warming, including MED, WSAF, SAM and SSA (high confidence), and ESAF, MDG, EAU, SAU, SCA, CAR, NSA, NES, SWS, WCE, NCA, WNA and CNA (medium confidence). At 4°C of global warming, even more regions would be affected by agricultural and ecological droughts (WCE, MED, CAU, EAU, SAU, WCA, EAS, SCA, CAR, NSA, NES, SAM, SWS, SSA, NCA, CNA, ENA, WNA, WSAF, ESAF and MDG). Some regions are also projected to experience less agricultural and ecological drought with global warming (medium confidence;NEAF, SAS). There is high confidence that the projected increases in agricultural and ecological droughts are strongly affected by AED increases in a warming climate, although ET increases are projected to be smaller than those in AED due to soil moisture limitations and CO2 effects on leaf stomatal conductance. Enhanced atmospheric CO2 concentrations lead to enhanced water-use efficiency in plants (medium confidence), but there is low confidence that it can alleviate agricultural and ecological droughts, or hydrological droughts, at higher global warming levels characterized by limited soil moisture and enhanced AED.
Projected changes in meteorological droughts are overall less extended than for agricultural and ecological droughts, but also affect several AR6 regions, even at 1.5°C and 2°C of global warming. Several regions are also projected to be more strongly affected by hydrological droughts with increasing global warming (NEU, WCE, EEU, MED, SAU, WCA, SCA, NSA, SAM, SWS, SSA, WNA, WSAF, ESAF, MDG). Increased soil moisture limitation and associated changes in droughts are projected to lead to increased vegetation stress in many regions, with implications for the global land carbon sink (Cross-Chapter Box 5). There is high confidence that the global land carbon sink will become less efficient due to soil moisture limitations and associated drought conditions in some regions in higher-emissions scenarios, especially under global warming levels above 4°C; however, there is low confidence on how these water cycle feedbacks will play out in lower-emissions scenarios (at 2°C global warming or lower; Cross-Chapter Box5.1).
11.7 Extreme Storms
Extreme storms, such as tropical cyclones (TCs), extratropical cyclones (ETCs), and severe convective storms often have substantial societal impacts. Quantifying the effect of climate change on extreme storms is challenging, partly because extreme storms are rare, short-lived, and local, and individual events are largely influenced by stochastic variability. The high degree of random variability makes detection and attribution of extreme storm trends more uncertain than detection and attribution of trends in other aspects of the environment in which the storms evolve (e.g., larger-scale temperature trends). Projecting changes in extreme storms is also challenging because of constraints in the models’ ability to accurately represent the small-scale physical processes that can drive these changes. Despite the challenges, progress has been made since AR5.
The SREX (Chapter 3) concluded that there is low confidence in observed long-term (40 years or more) trends in TC intensity, frequency, and duration, and any observed trends in phenomena such as tornadoes and hail; it is likely that extratropical storm tracks have shifted poleward in both the Northern and Southern Hemispheres, and that heavy rainfalls and mean maximum wind speeds associated with TCs will increase with continued greenhouse gas warming; it is likely that the global frequency of TCs will either decrease or remain essentially unchanged, while it is more likely than not that the frequency of the most intense storms will increase substantially in some ocean basins; there is low confidence in projections of small-scale phenomena such as tornadoes and hail storms; and there is medium confidence that there will be a reduced frequency and a poleward shift of mid-latitude cyclones due to future anthropogenic climate change.
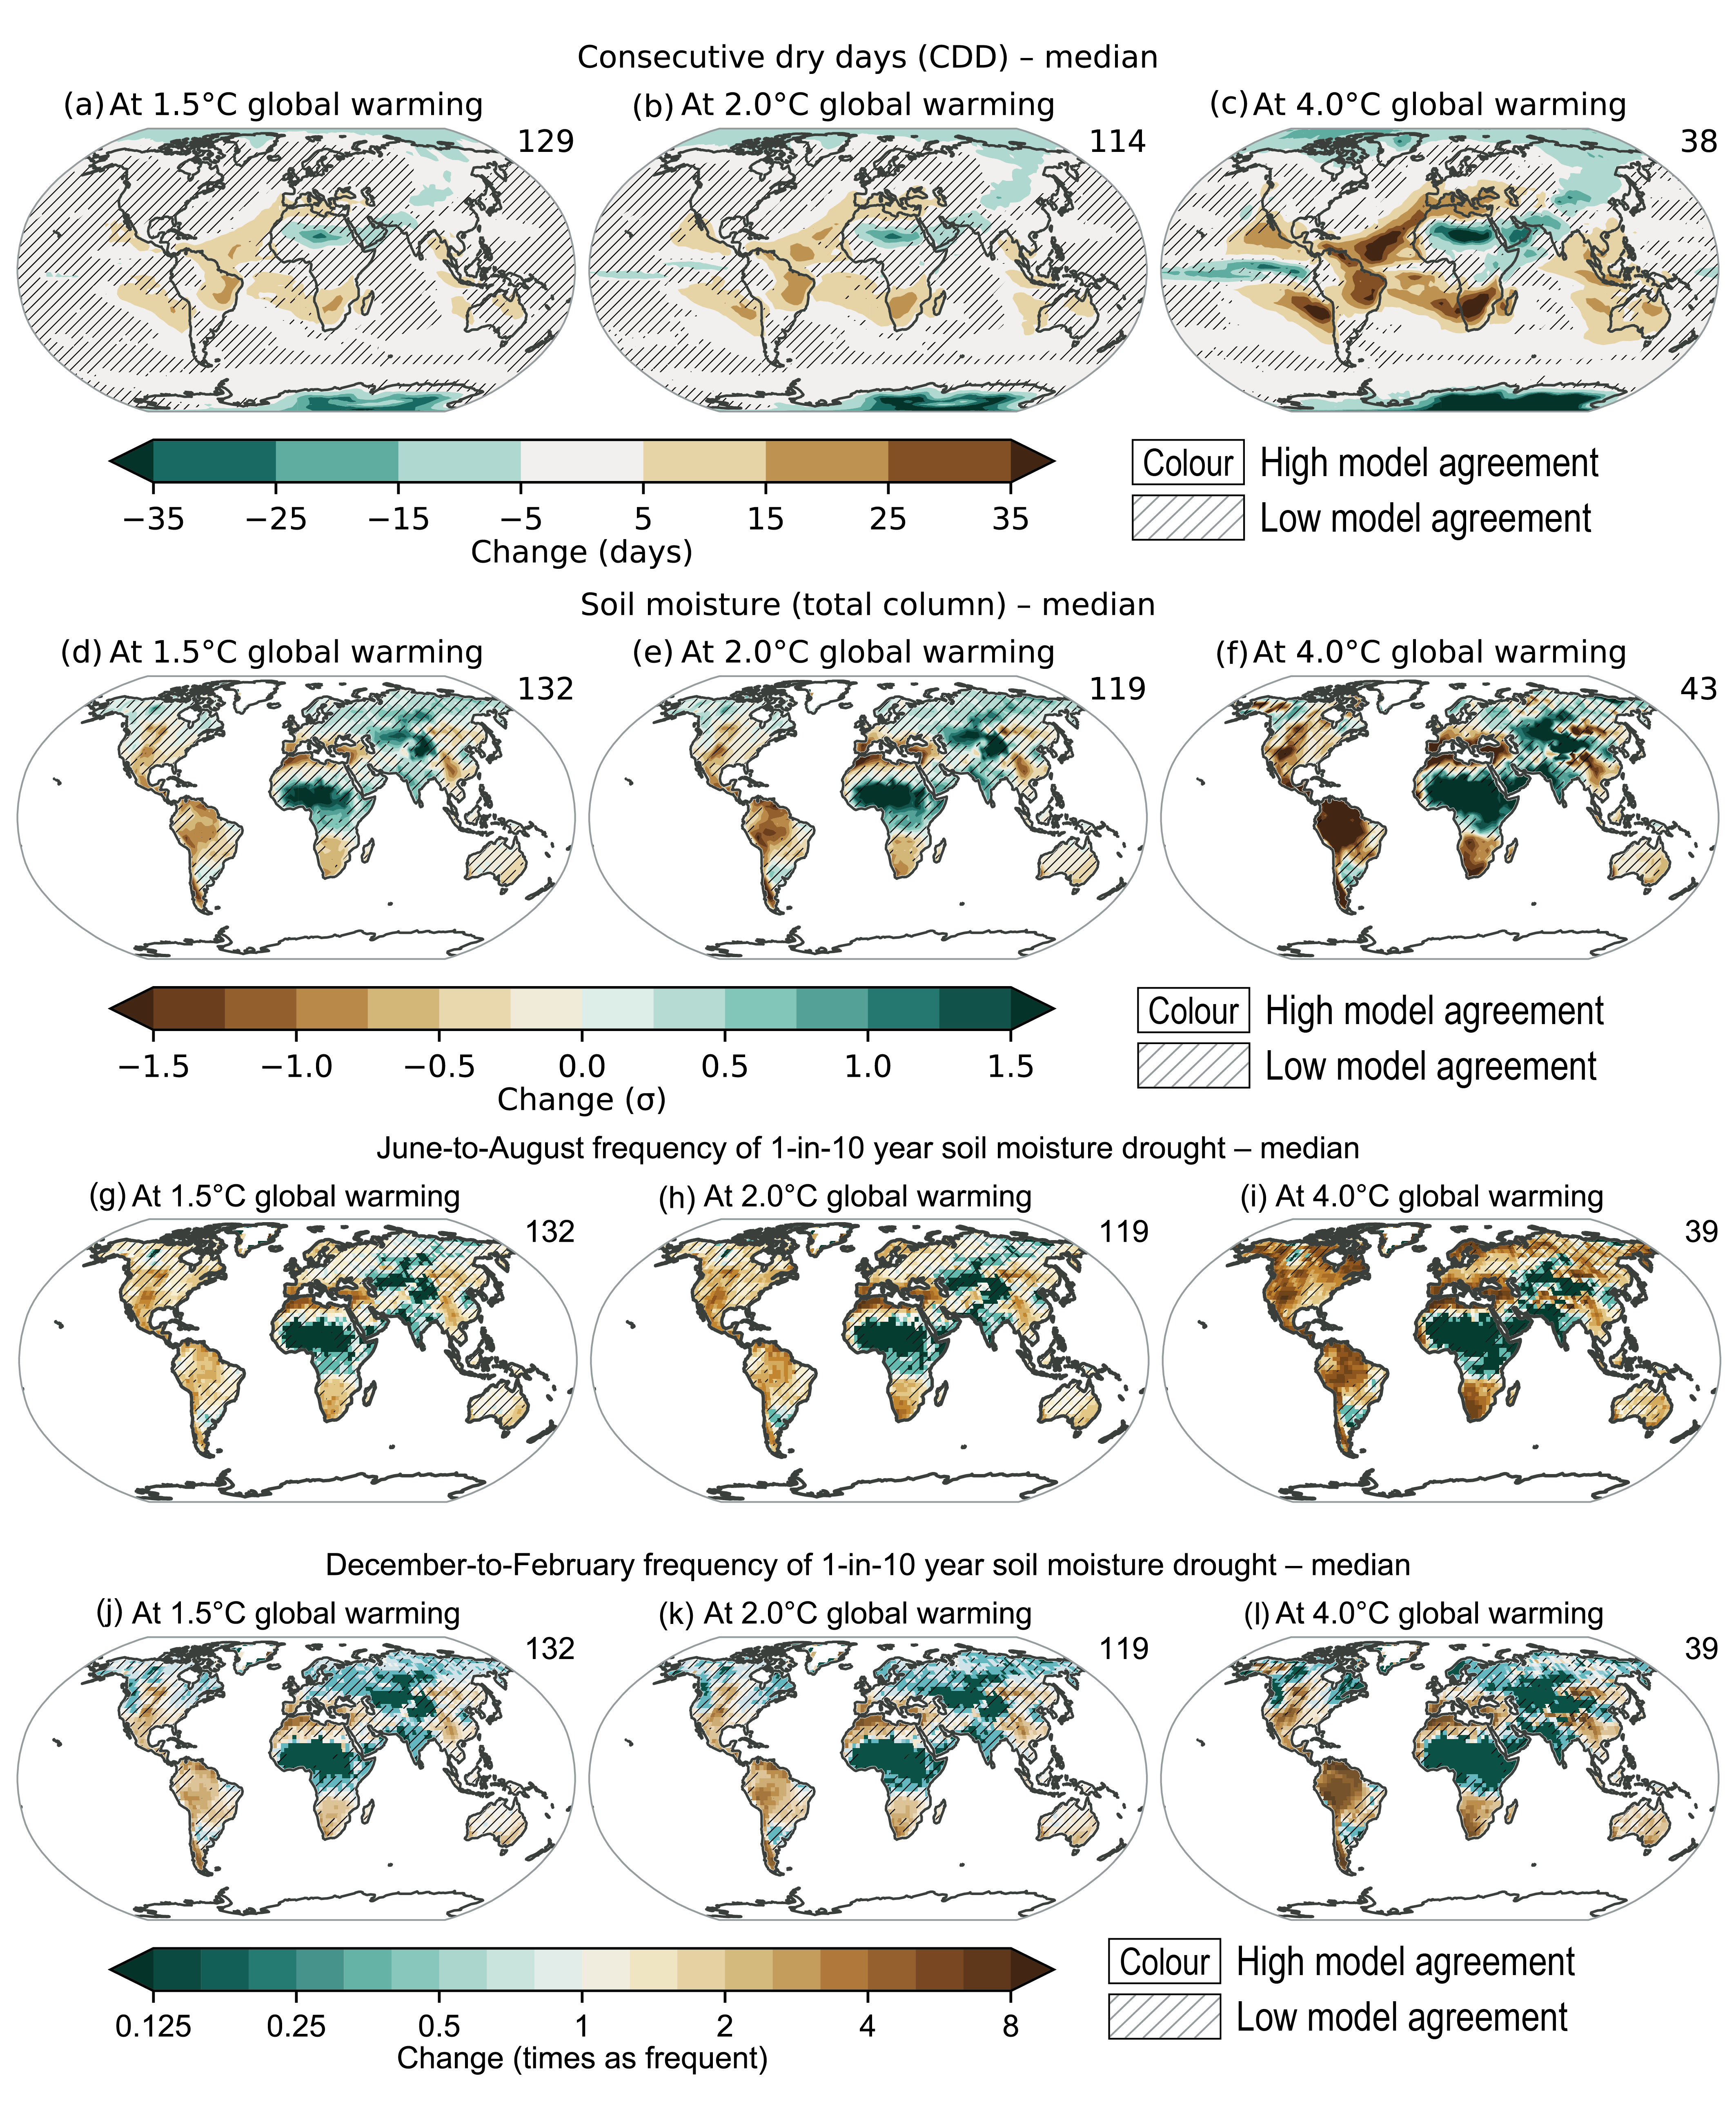 Figure 11.19 | Projected changes in (a–c) the number of consecutive dry days (CDD), (d–f) annual mean soil moisture over the total column, and (g–l) the frequency and intensity of 1-in-10-year soil moisture drought for the June-to-August and December-to-February seasons at 1.5°C, 2°C, and 4°C of global warming compared to the 1850–1900 baseline. The unit for soil moisture change is the standard deviation of interannual variability in soil moisture during 1850–1900. Standard deviation is a widely used metric in characterizing drought severity. A projected reduction in mean soil moisture by one standard deviation corresponds to soil moisture conditions typical of about 1-in-6-year droughts during 1850–1900 becoming the norm in the future. Results are based on simulations from the Coupled Model Intercomparison Project Phase 6 (CMIP6) multi-model ensemble under the Shared Socio-economic Pathway (SSP), SSP1-1.9, SSP1-2.6, SSP2-4.5, SSP3-7.0, and SSP5-8.5 scenarios. The numbers in the top right indicate the number of simulations included. Uncertainty is represented using the simple approach: no overlay indicates regions with high model agreement, where ≥80% of models agree on the sign of change; diagonal lines indicate regions with low model agreement, where <80% of models agree on the sign of change. For more information on the simple approach, please refer to the Cross-Chapter Box (Atlas 1. For details on the methods see Supplementary Material 11.SM.2. Changes in CDDs are also displayed in the Interactive Atlas. Further details on data sources and processing are available in the chapter data table (Table 11.SM.9).
 Since SREX, several IPCC Reports also assessed storms. The AR5 (Chapter 2, Hartmann et al., 2013) assessment observed with low confidence long-term trends in TC metrics, but revised the statement from SREX to state that it is virtually certain that there are increasing trends in North Atlantic TC activity since the 1970s, with medium confidence that anthropogenic aerosol forcing has contributed to these trends. The AR5 concluded that it is likely that TC precipitation and mean intensity will increase and more likely than not that the frequency of the strongest storms will increase with continued greenhouse gas warming. confidence in projected trends in overall TC frequency remained low. confidence in observed and projected trends in hail storm and tornado events also remained low. The SROCC (Chapter 6, Collins et al., 2019) assessed past and projected TCs and ETCs, supporting the AR5 conclusions with some additional detail. Literature subsequent to AR5 adds support to the likelihood of increasing trends in TC intensity, precipitation, and frequency of the most intense storms, while some newer studies have added uncertainty to projected trends in overall frequency. A growing body of literature since AR5 on the poleward migration of TCs led to a new assessment in SROCC of low confidence that the migration in the western North Pacific represents a detectable climate change contribution from anthropogenic forcing. The SR1.5 (Chapter 3, Hoegh-Guldberg et al., 2018) essentially confirmed the AR5 assessment of TCs and ETCs, adding that heavy precipitation associated with TCs is projected to be higher at 2°C compared to 1.5°C global warming (medium confidence).
The SREX, AR5, SROCC, and SR1.5, do not provide assessments of the atmospheric rivers, and SROCC and SR1.5 do not assess severe convective storms and extreme winds. This section assesses the state of knowledge on the four phenomena of TCs, ETCs, severe convective storms, and extreme winds. Atmospheric rivers are addressed in Chapter 8. In this respect, this assessment closely mirrors the SROCC assessment of TCs and ETCs, while updating SREX and AR5 assessments of severe convective storms and extreme winds.
11.7.1 Tropical Cyclones
11.7.1.1 Mechanisms and Drivers
The genesis, development, and tracks of TCs depend on conditions of the larger-scale circulations of the atmosphere and ocean (Christensen et al., 2013). Large-scale atmospheric circulations, such as the Hadley and Walker circulations and the monsoon circulations can significantly affect TCs, as can internal variability acting on various time scales (Annex IV), from intra-seasonal (e.g., the Madden–Julian and Boreal Summer Intraseasonal oscillations and equatorial waves) and interannual (e.g., the El Niño–Southern Oscillation and Pacific and Atlantic Meridional Modes), to inter-decadal (e.g., Atlantic Multidecadal Variability and Pacific Decadal Variability). This broad range of natural variability makes detection of anthropogenic effects difficult, and uncertainties in the projected changes of these modes of variability increase uncertainty in the projected changes in TC activity. Aerosol forcing also affects sea surface temperature (SST) patterns and cloud microphysics, and it is likely that observed changes in TC activity are partly caused by changes in aerosol forcing (Evan et al., 2011; Ting et al., 2015; Sobel et al., 2016, 2019; Takahashi et al., 2017; Zhao et al., 2018; Reed et al., 2019). Among possible changes from these drivers, there is medium confidence that the Hadley cell has widened and will continue to widen in the future (Sections 2.3, 3.3 and 4.5). This likely causes latitudinal shifts of TC tracks (Sharmila and Walsh, 2018). Regional TC activity changes are also strongly affected by projected changes in SST warming patterns (Yoshida et al., 2017), which are highly uncertain (Chapters 4 and 9).
11.7.1.2 Observed Trends
Identifying past trends in TC metrics remains a challenge due to the heterogeneous character of the historical instrumental data, which are known as ‘best-track’ data (Schreck et al., 2014). There is low confidence in most reported long-term (multi-decadal to centennial) trends in TC frequency- or intensity-based metrics due to changes in the technology used to collect the best-track data. This should not be interpreted as implying that no physical (real) trends exist, but rather as indicating that either the quality or the temporal length of the data is not adequate to provide robust trend detection statements, particularly in the presence of multi-decadal variability.
There are previous and ongoing efforts to homogenize the best-track data (Elsner et al., 2008; Kossin et al., 2013, 2020; Choy et al., 2015; Landsea, 2015; Emanuel et al., 2018) and there is substantial literature that finds positive trends in intensity-related metrics in the best-track during the ‘satellite period’, which is generally limited to around the past 40 years (Kang and Elsner, 2012; Kishtawal et al., 2012; Kossin et al., 2013, 2020; Mei and Xie, 2016; Zhao et al., 2018; Tauvale and Tsuboki, 2019). When best-track trends are tested using homogenized data, the intensity trends generally remain positive, but are smaller in amplitude (Kossin et al., 2013; Holland and Bruyère, 2014). Kossin et al. (2020) extended the homogenized TC intensity record to the period 1979–2017 and identified significant global increases in major TC exceedance probability of about 6% per decade. In addition to trends in TC intensity, there is evidence that TC intensification rates and the frequency of rapid intensification events have increased within the satellite era (Kishtawal et al., 2012; Balaguru et al., 2018; Bhatia et al., 2018). The increase in intensification rates is found in the best-track and the homogenized intensity data.
A subset of the best-track data corresponding to hurricanes that have directly impacted the USA since 1900 is considered to be reliable, and shows no trend in the frequency of USA landfall events (Knutson et al., 2019). However, an increasing trend in normalized USA hurricane damage, which accounts for temporal changes in exposed wealth (Grinsted et al., 2019), and a decreasing trend in TC translation speed over the USA (Kossin, 2019) have also been identified in this period. A similarly reliable subset of the data representing TC landfall frequency over Australia shows a decreasing trend in Eastern Australia since the 1800s (Callaghan and Power, 2011), as well as in other parts of Australia since 1982 (Chand et al., 2019; Knutson et al., 2019). A paleoclimate proxy reconstruction shows that recent levels of TC interactions along parts of the Australian coastline are the lowest in the past 550–1500 years (Haig et al., 2014). Existing TC datasets show substantial inter-decadal variations in basin-wide TC frequency and intensity in the western North Pacific, but a statistically significant north-westward shift in the western North Pacific TC tracks since the 1980s (T.-C. Lee et al., 2020). Inthe case of the North Indian Ocean, analyses of trends are highly dependent on the details of each analysis (e.g., pre- and/or post-monsoon season period, or Bay of Bengal and/or Arabian Sea region). The most consistent trends are an increase in the occurrence of the most intense TCs, and a decrease in the overall TC frequency, in particular in the Bay of Bengal (Sahoo and Bhaskaran, 2016; Balaji et al., 2018; Singh et al., 2019; Baburaj et al., 2020). In the South Indian Ocean (SIO), an increase in the occurrence of the most intense TCs has been noted; however, there are well-known data quality issues there (Kuleshov et al., 2010; Fitchett, 2018). When the SIO data are homogenized, a significant increase is found in the fractional proportion of global Category 3–5 TC instances (6-hourly intensity estimates during the lifetime of each TC) to all Category 1–5 instances (Kossin et al., 2020).
 Figure 11.20 | Summary schematic of past and projected changes in tropical cyclone (TC), extratropical cyclone (ETC), atmospheric river (AR), and severe convective storm (SCS) behaviour. Global changes (blue shading) from top to bottom: (i) Increased mean and maximum rain rates in TCs, ETCs, and ARs [past (low confidence due to lack of reliable data) and projected (high confidence)]; (ii) Increased proportion of stronger TCs [past (medium confidence) and projected (high confidence)]; (iii) Decrease or no change in global frequency of TC genesis [past (low confidence due to lack of reliable data) and projected (medium confidence)]; and (iv) Increased and decreased ETC wind speed, depending on the region, as storm tracks change [past (low confidence due to lack of reliable data) and projected (medium confidence)]. Regional changes, from left to right: (i) Poleward TC migration in the western North Pacific and subsequent changes in TC exposure [past (medium confidence) and projected (medium confidence)]; (ii) Slowdown of TC forward translation speed over the contiguous USA and subsequent increase in TC rainfall [past (medium confidence) and projected (low confidence due to lack of directed studies)]; and (iii) Increase in mean and maximum SCS rain rate and increase in spring SCS frequency and season length over the contiguous USA [past (low confidence due to lack of reliable data) and projected (medium confidence)].
 As with all confined regional analyses of TC frequency, it is generally unclear whether any identified changes are due to a basin-wide change in TC frequency, or to systematic track shifts (or both). From an impacts perspective, however, these changes over land are highly relevant and emphasize that large-scale modifications in TC behaviour can have a broad spectrum of impacts on a regional scale.
Subsequent to AR5, two metrics have been analysed that are argued to be comparatively less sensitive to data issues than frequency- and intensity-based metrics. Trends in these metrics have been identified over the past 70 years or more (Knutson et al., 2019). The first metric – the mean latitude where TCs reach their peak intensity – exhibits a global and regional poleward migration during the satellite period (Kossin et al., 2014). The poleward migration can influence TC hazard exposure and risk (Kossin et al., 2016a) and is consistent with the independently observed expansion of the tropics (Lucas et al., 2014). The migration has been linked to changes in the Hadley circulation (Altman et al., 2018; Sharmila and Walsh, 2018; Studholme and Gulev, 2018). The migration is also apparent in the mean locations where TCs exhibit eyes (Knapp et al., 2018), which is when TCs are most intense. Part of the Northern Hemisphere poleward migration is due to basin-wide changes in TC frequency (Kossin et al., 2014, 2016b; Moon et al., 2015, 2016) and the trends, as expected, can be sensitive to the time period chosen (Tennille and Ellis, 2017; Kossin, 2018; Song and Klotzbach, 2018) and to subsetting of the data by intensity (Zhan and Wang, 2017). The poleward migration is particularly pronounced and well-documented in the western North Pacific basin (Kossin et al., 2016a; Oey and Chou, 2016; Liang et al., 2017; Nakamura et al., 2017; Altman et al., 2018; Daloz and Camargo, 2018; J. Sun et al., 2019; T.-C. Lee et al., 2020; Yamaguchi and Maeda, 2020a; Kubota et al., 2021).
A second metric that is argued to be comparatively less sensitive to data issues than frequency- and intensity-based metrics is TC translation speed (Kossin, 2018), which exhibits a global slowdown in the best-track data over the period 1949–2016. TC translation speed is a measure of the speed at which TCs move across the Earth’s surface, and is very closely related to local rainfall amounts (i.e., a slower translation speed causes greater local rainfall). TC translation speed also affects structural wind damage and coastal storm surge by changing the hazard event duration. The slowdown is observed in the best-track data from all basins except the Northern Indian Ocean, and is also found in a number of regions where TCs interact directly with land. The slowing trends identified in the best-track data by Kossin (2018) have been argued to be largely due to data heterogeneity. Moon et al. (2019) and Lanzante (2019) provide evidence that meridional TC track shifts project onto the slowing trends, and argue that these shifts are due to the introduction of satellite data. Kossin (2019) provides evidence that the slowing trend is real by focusing on Atlantic TC track data over the contiguous USA in the 118-year period 1900–2017, which are generally considered reliable. In this period, mean TC translation speed has decreased by 17%. The slowing TC translation speed is expected to increase local rainfall amounts, which would increase coastal and inland flooding. In combination with slowing translation speed, abrupt TC track direction changes – that can be associated with track ‘meanders’ or ‘stalls’ – have become increasingly common along the North American coast since the mid-20th century, leading to more rainfall in the region (Hall and Kossin, 2019).
In summary, there is mounting evidence that a variety of TC characteristics have changed over various time periods. It is likely that the global proportion of Category 3–5 tropical cyclone instances and the frequency of rapid intensification events have increased globally over the past 40 years. It is very likely that the average location where TCs reach their peak wind intensity has migrated poleward in the western North Pacific Ocean since the 1940s. It is likely that TC translation speed has slowed over the USA since 1900.
11.7.1.3 Model Evaluation
Accurate projections of future TC activity have two principal requirements: accurate representation of changes in the relevant environmental factors (e.g., SSTs) that can affect TC activity, and accurate representation of actual TC activity in given environmental conditions.In particular, models’ capacity to reproduce historical trends or interannual variabilities of TC activity is relevant to the confidence in future projections. One test of the models is to evaluate their ability to reproduce the dependency of the TC statistics in the different basins in the real world, in addition to their capability of reproducing atmospheric and ocean environmental conditions. For the evaluation of projections of TC-relevant environmental variables, AR5 confidence statements were based on global surface temperature and moisture, but not on the detailed regional structure of SST and atmospheric circulation changes such as steering flows and vertical shear, which affect characteristics of TCs (genesis, intensity, tracks, etc.). Various aspects of TC metrics are used to evaluate how capable models are of simulating present-day TC climatologies and variability (e.g., TC frequency, wind intensity, precipitation, size, tracks, and their seasonal and interannual changes) (Walsh et al., 2015; Camargo and Wing, 2016; Knutson et al., 2019, 2020). Other examples of TC climatology/variability metrics are spatial distributions of TC occurrence and genesis (Walsh et al., 2015), seasonal cycles and interannual variability of basin-wide activity (Zhao et al., 2009; Shaevitz et al., 2014; Kodama et al., 2015; Murakami et al., 2015; Yamada et al., 2017) or landfalling activity (Lok and Chan, 2018), as well as newly developed process-diagnostics designed specifically for TCs in climate models (D. Kim et al., 2018; Wing et al., 2019; Moon et al., 2020).
Confidence in the projection of intense TCs, such as those of Category 4–5, generally becomes higher as the resolution of the models becomes higher. The Coupled Model Intercomparison Project Phases 5 and 6 (CMIP5/6) class climate models (around 100–200 km grid spacing) cannot simulate TCs of Category 4–5 intensity. They do simulate storms of relatively high vorticity that are at best described as ‘TC-like’, but metrics such as storm counts are highly dependent on tracking algorithms (Camargo, 2013; Wehner et al., 2015; Zarzycki and Ullrich, 2017; Roberts et al., 2020a). High-resolution GCMs (around 10–60 km grid spacing), as used in HighResMIP (Haarsma et al., 2016; Roberts et al., 2020a), begin to capture some structures of TCs more realistically, as well as produce intense TCs of Category 4–5 despite the effects of parametrized deep cumulus convection processes (Murakami et al., 2015; Wehner et al., 2015; Yamada et al., 2017; Roberts et al., 2018; Moon et al., 2020). Convection-permitting models (around 1–10 km grid-spacing), such as used in some dynamical downscaling studies, provide further realism with capturing TC eye-wall structures (Tsuboki et al., 2015). Model characteristics besides resolution, especially details of convective parametrization, can influence a model’s ability to simulate intense TCs (Reed and Jablonowski, 2011; Zhao et al., 2012; He and Posselt, 2015; D. Kim et al., 2018; Zhang and Wang, 2018; Camargo et al., 2020). However, models’ dynamical cores and other physics also affect simulated TC properties (Reed et al., 2015; Vidale et al., 2021). Both wide-area regional and global convection-permitting models without the need for parameterized convection are becoming more useful for TC regional model projection studies (Tsuboki et al., 2015; Kanada et al., 2017a; Gutmann et al., 2018) and global model projection studies (Satoh et al., 2015, 2017; Yamada et al., 2017), as they capture more realistic TC eye wall structures (Kinter III et al., 2013) and are becoming more useful for investigating changes in TC structures (Kanada et al., 2013; Yamada et al., 2017). Large ensemble simulations of GCMs with 60 km grid spacing provide TC statistics that allow more reliable detection of changes in the projections, which are not well captured in any single experiment (Yoshida et al., 2017; Yamaguchi et al., 2020). Variable resolution global models offer an alternative to regional models for individual TC or basin-wide simulations (Yanase et al., 2012; Zarzycki et al., 2014; Harris et al., 2016; Reed et al., 2020; Stansfield et al., 2020). Computationally less intense than equivalent uniform resolution global models, they also do not require lateral boundary conditions, thus reducing this source of error (Hashimoto et al., 2016). Confidence in the projection of TC statistics and properties is increased by the use of higher-resolution models with more realistic simulations.
Operational forecasting models also reproduce TCs, and their use for climate projection studies shows promise. However, there is limited application for future projections as they are specifically developed for operational purposes, and TC climatology is not necessarily well evaluated. Intercomparison of operational models indicates that enhancement of horizontal resolution can provide more credible projections of TCs (Nakano et al., 2017). Likewise, high-resolution climate models show promise as TC forecast tools (Zarzycki and Jablonowski, 2015; Reed et al., 2020), further narrowing the continuum of weather and climate models, and increasing confidence in projections of future TC behaviour. However, higher horizontal resolution does not necessarily lead to an improved TC climatology (Camargo et al., 2020).
Atmosphere–ocean interaction is an important process in TC evolution. Atmosphere–ocean coupled models are generally better than atmosphere-only models at capturing realistic processes related to TCs (Murakami et al., 2015; Ogata et al., 2015, 2016; Zarzycki, 2016; Kanada et al., 2017b; Scoccimarro et al., 2017). However, the basin-scale SST biases commonly found in atmosphere–ocean models can introduce substantial errors in the simulated TC number (Hsu et al., 2019). Higher-resolution ocean models improve the simulation of TCs by reducing the SST climatology bias (Li and Sriver, 2018; Roberts et al., 2020a). Coarse resolution atmospheric models may degrade coupled model performance as well. For example, in a case study of Hurricane Harvey, Trenberth et al. (2018) suggested that the lack of realistic hurricane frequency and intensity within coupled climate models hampers the models’ ability to simulate SST and ocean heat content and their changes.
Even with higher-resolution atmosphere–ocean coupled models, TC projection studies still rely on assumptions in experimental design that introduce uncertainties. Computational constraints often limit the number of simulations, resulting in relatively small ensemble sizes and incomplete analyses of possible future SST magnitude and pattern changes (Zhao and Held, 2011; Knutson et al., 2013). Uncertainties in aerosol forcing also are reflected in TC projection uncertainty (Wang et al., 2014).
Regional climate models (RCM) with grid spacing around 15–50 km can be used to study the projection of TCs. RCMs are run with lateral and surface boundary conditions, which are specified by the atmospheric state and SSTs simulated by GCMs. Various combinations of the lateral and surface boundary conditions can be chosen for RCM studies, and uncertainties in the projection can be further examined in general. They are used for studying changes in TC characteristics in a specific area, such as Vietnam (Redmond et al., 2015) and the Philippines (Gallo et al., 2019).
Less computationally expensive downscaling approaches that allow larger ensembles and long-term studies are also used in the projection of TCs (Emanuel et al., 2006; C.Y. Lee et al., 2018). A statistical–dynamical TC downscaling method requires assumptions of the rate of seeding of random initial disturbances, which are generally assumed to not change with climate change (Emanuel et al., 2008; Emanuel, 2013). The results with the downscaling approach might depend on the assumptions, which are required for the simplification of the methods.
In summary, various types of models are useful to study how TCs change in response to climate changes, and there is no unique solution for choosing a model type. However, higher-resolution models generally capture TC properties more realistically (high confidence). In particular, models with horizontal resolutions of 10–60 km are capable of reproducing strong TCs with Category 4–5 and those of 1–10 km are capable of the eye wall structure of TCs. Uncertainties in TC simulations come from details of the model configuration of both dynamical and physical processes. Models with realistic atmosphere–ocean interactions are generally better than atmosphere-only models at reproducing realistic TC evolutions (high confidence).
11.7.1.4 Detection and Attribution, Event Attribution
There is general agreement in the literature that anthropogenic greenhouse gases and aerosols have measurably affected observed oceanic and atmospheric variability in TC-prone regions (see Chapter 3). This underpinned the SROCC assessment of medium confidence that humans have contributed to the observed increase in Atlantic hurricane activity since the 1970s (Chapter 5, Bindoff et al., 2013). Literature subsequent to AR5 lends further support to this statement (Knutson et al., 2019). However, there is still no consensus on the relative magnitude of human and natural influences on past changes in Atlantic hurricane activity, and particularly on which factor has dominated the observed increase (Ting et al., 2015) and it remains uncertain whether past changes in Atlantic TC activity are outside the range of natural variability. A recent result using high-resolution dynamical model experiments suggested that the observed spatial contrast in TC trends cannot be explained only by multi-decadal natural variability, and that external forcing plays an important role (Murakami et al., 2020).Observational evidence for significant global increases in the proportion of major TC intensities (Kossin et al., 2020) is consistent with both theory and numerical modelling simulations, which generally indicate an increase in mean TC peak intensity and the proportion of very intense TCs in a warming world (Knutson et al., 2015, 2020; Walsh et al., 2015, 2016). In addition, high-resolution coupled model simulations provide support that natural variability alone is unlikely to explain the magnitude of the observed increase in TC intensification rates and upward TC intensity trend in the Atlantic basin since the early 1980s (Bhatia et al., 2019; Murakami et al., 2020).
The cause of the observed slowdown in TC translation speed is not yet clear. Yamaguchi et al. (2020) used large ensemble simulations to argue that part of the slowdown is due to actual latitudinal shifts of TC tracks, rather than data artefacts, in addition to atmospheric circulation changes. G. Zhang et al. (2020) used large ensemble simulations to show that anthropogenic forcing can lead to a robust slowdown, particularly outside of the tropics at higher latitudes. Yamaguchi and Maeda (2020b) found a significant slowdown in the western North Pacific over the past 40 years and attributed the slowdown to a combination of natural variability and global warming. The slowing trend since 1900 over the USA is robust and significant after removing multi-decadal variability from the time series (Kossin, 2019). Among the hypotheses discussed is the physical linkage between warming and slowing circulation (Held and Soden, 2006; see also Section 8.2.2.2), with expectations of Arctic amplification and weakening circulation patterns through weakening meridional temperature gradients (Coumou et al., 2018; see also Cross-Chapter Box 10.1), or through changes in planetary wave dynamics (Mann et al., 2017). The tropics expansion and the poleward shift of the mid-latitude westerlies associated with warming is also suggested as the reason of the slowdown (G. Zhang et al., 2020). However, the connection of these mechanisms to the slowdown has not been robustly shown. Furthermore, slowing trends have not been unambiguously observed in circulation patterns that steer TCs, such as the Walker and Hadley circulations (Section 2.3.1.4), although these circulations generally slow down in numerical simulations under global warming (Sections 4.5.1.6 and 8.4.2.2).
The observed poleward trend in western North Pacific TCs remains significant after accounting for the known modes of dominant interannual to decadal variability in the region (Kossin et al., 2016a), and is also found in CMIP5 model-simulated TCs (in the recent historical period 1980–2005), although it is weaker than observed and is not statistically significant (Kossin et al., 2016a). However, the trend is significant in 21st-century CMIP5 projections under the RCP8.5 scenario, with a similar spatial pattern and magnitude to the past observed changes in that basin over the period 1945–2016, supporting a possible anthropogenic greenhouse gas contribution to the observed trends (Kossin et al., 2016a; Knutson et al., 2019).
The recent active TC seasons in some basins have been studied to determine whether there is anthropogenic influence. For 2015, Murakami et al. (2017b) explored the unusually high TC frequency near Hawaii and in the eastern Pacific basin. W. Zhang et al. (2016b) considered unusually high Accumulated Cyclone Energy (ACE) in the western North Pacific; and S.-H. Yang et al. (2018) and Yamada et al. (2019) looked at TC intensification in the western North Pacific. These studies suggest that the anomalous TC activity in 2015 was not solely explained by the effect of an extreme El Niño (see Box 11.4) and that there was also an anthropogenic contribution, mainly through the effects of SSTs in subtropical regions. In the post-monsoon seasons of 2014 and 2015, tropical storms with lifetime maximum winds greater than 46 m s−1 were first observed over the Arabian Sea, and Murakami et al. (2017a) showed that the probability of late-season severe tropical storms is increased by anthropogenic forcing compared to the preindustrial era. Murakami et al. (2018) concluded that the active 2017 Atlantic hurricane season was mainly caused by pronounced SSTs in the tropical North Atlantic and that these types of seasonal events will intensify with projected anthropogenic forcing. The trans-basin SST change, which might be driven by anthropogenic aerosol forcing, also affects TC activity. Takahashi et al. (2017) suggested that a decrease in sulphate aerosol emissions caused about half of the observed decreasing trends in TC genesis frequency in the south-eastern region of the western North Pacific during 1992–2011.
Event attribution is used in TC case studies to test whether the severities of recent intense TCs are explained without anthropogenic effects. In a case study of Hurricane Sandy (2012), Lackmann (2015) found no statistically significant impact of anthropogenic climate change on storm intensity, while projections in a warmer world showed significant strengthening. However, Magnusson et al. (2014) found that, in European Centre for Medium-Range Weather Forecast (ECMWF) simulations, the simulated cyclone depth and intensity, as well as precipitation, were larger when the model was driven by the warmer actual SSTs than the climatological average SSTs. In Super Typhoon Haiyan, which struck the Philippines on 8 November 2013, Takayabu et al. (2015) took an event attribution approach with cloud system-resolving (around 1 km) downscaling ensemble experiments to evaluate the anthropogenic effect on typhoons, and showed that the intensity of the simulated worst-case storm in the actual conditions was stronger than that in a hypothetical condition without historical anthropogenic forcing in the model. However, in a similar approach with two coarser parametrized convection models, Wehner et al. (2019) found conflicting human influences on Haiyan’s intensity. Patricola and Wehner (2018) found little evidence of an attributable change in intensity of hurricanes Katrina (2005), Irma (2017), and Maria (2017) using a regional climate model configured between 3 km and 4.5 km resolution. They did, however, find attributable increases in heavy precipitation totals. These results imply that higher resolution, such as in a convective permitting 5 km or less mesh model, is required to obtain a robust anthropogenic intensification of a strong TC by simulating realistic rapid intensification (Kanada and Wada, 2016; Kanada et al., 2017a), and that whether the TC intensification can be attributed to the recent warming depends on the case.
The dominant factor in the extreme rainfall amounts during Hurricane Harvey’s passage onto the USA in 2017 was its slow translation speed. But studies published after the event have argued that anthropogenic climate change contributed to an increase in rain rate, which compounded the extreme local rainfall caused by the slow translation. Emanuel (2017) used a large set of synthetically-generated storms and concluded that the occurrence of extreme rainfall as observed in Harvey was substantially enhanced by anthropogenic changes to the larger-scale ocean and atmosphere characteristics; Trenberth et al. (2018) linked Harvey’s rainfall totals to the anomalously large ocean heat content from the Gulf of Mexico; and van Oldenborgh et al. (2017) and Risser and Wehner (2017) applied extreme value analysis to extreme rainfall records in the Houston, Texas region, both attributing large increases to climate change. Large precipitation increases during Harvey due to global warming were also found using climate models (van Oldenborgh et al., 2017; S.-Y.S. Wang et al., 2018). Harvey precipitation totals were estimated in these papers to be three to 10 times more probable due to climate change. A best estimate from a regional climate and flood model is that urbanization increased the risk of the Harvey flooding by a factor of 21 (W. Zhang et al., 2018), using a regional climate and flood model, found that surface roughness from urbanization increased the risk of the Harvey flooding by a factor of 21. Anthropogenic effects on precipitation increases were also predicted in advance from a forecast model for Hurricane Florence in 2018 (Reed et al., 2020).
In summary, it is very likely that the recent active TC seasons in the North Atlantic, the North Pacific, and Arabian basins cannot be explained without an anthropogenic influence. The anthropogenic influence on these changes is principally associated to aerosol forcing, with stronger contributions to the response in the North Atlantic. It is more likely than not that the slowdown of TC translation speed over the USA has contributions from anthropogenic forcing. It is likely that the poleward migration of TCs in the western North Pacific and the global increase in TC intensity rates cannot be explained entirely by natural variability. Event attribution studies of specific strong TCs provide limited evidence for anthropogenic effects on TC intensifications so far, but high confidence for increases in TC heavy precipitation. There is high confidence that anthropogenic climate change contributed to extreme rainfall amounts during Hurricane Harvey (2017) and other intense TCs.
11.7.1.5 Projections
A summary of studies on TC projections for the late 21st century, particularly studies since AR5, is given by Knutson et al. (2020), which is an assessment report mandated by the World Meteorological Organization (WMO). Studies subsequent to Knutson et al. (2020) are generally consistent, and the confidence assessments here closely follow theirs (Cha et al., 2020), although there are some differences due to the varying confidence calibrations between the IPCC and WMO reports.
There is not an established theory for the drivers of future changes in the frequency of TCs. Most, but not all, high-resolution global simulations project significant reductions in the total number of TCs, with the bulk of the reduction at the weaker end of the intensity spectrum as the climate warms (Knutson et al., 2020). Recent exceptions based on high-resolution coupled model results arenoted in Bhatia et al. (2018) and Vecchi et al. (2019). Vecchi et al. (2019) showed that the representation of synoptic-scale seeds for TC genesis in their high-resolution model causes different projections of global TC frequency, and there is evidence for a decrease in cyclone seeds in some projected TCsimulations (Sugi et al., 2020; Yamada et al., 2011). However, other research indicates that TC seeds are not an independent control on climatological TC frequency, rather the seeds covary with the large-scale controls on TCs (Patricola et al., 2018). While empirical genesis indices derived from observations and reanalysis describe well the observed subseasonal and interannual variability of current TC frequency (Camargo et al., 2007, 2009; Tippett et al., 2011; Menkes et al., 2012), they fail to predict the decreased TC frequency found in most high-resolution model simulations (Zhang et al., 2010; Camargo, 2013; Wehner et al., 2015), as they generally project an increase as the climate warms. This suggests a limitation of the use of the empirical genesis indices for projections of TC genesis, in particular due to their sensitivity to the humidity variable considered in the genesis index for these projections (Camargo et al., 2014). In a different approach, a statistical–dynamical downscaling framework assuming a constant seeding rate with warming (Emanuel, 2013, 2021) exhibits increases in TC frequency consistent with genesis indices-based projections, while downscaling with a different model leads to two different scenarios depending on the humidity variable considered (C.-Y. Lee et al., 2020). This disparity in the sign of the projected change in global TC frequency, and the difficulty in explaining the mechanisms behind the different signed responses, further emphasize the lack of process understanding of future changes in tropical cyclogenesis (Walsh et al., 2015; Hoogewind et al., 2020). Even within a single model, uncertainty in the pattern of future SST changes leads to large uncertainties (including the sign) in the projected change in TC frequency in individual ocean basins, although global TCs would appear to be less sensitive (Yoshida et al., 2017; Bacmeister et al., 2018).
Changes in SST and atmospheric temperature and moisture play a role in tropical cyclogenesis (Walsh et al., 2015). Reductions in vertical convective mass flux due to increased tropical stability have been associated with a reduction in cyclogenesis (Held and Zhao, 2011; Sugi et al., 2012). Satoh et al. (2015) further posit that the robust simulated increase in the number of intense TCs, and hence increased vertical mass flux associated with intense TCs, must lead to a decrease in overall TC frequency because of this association. The Genesis Potential Index can be modified to mimic the TC frequency decreases of a model by altering the treatment of humidity (Camargo et al., 2014). This supports the idea that increased mid-tropospheric saturation deficit (Emanuel et al., 2008) controls TC frequency, but the approach remains empirical. Other possible controlling factors, such as a decline in the number of seeds (held constant in Emanuel’s downscaling approach, or dependent on the genesis index formulation in the approach proposed by C.-Y. Lee et al., 2020) caused by increased atmospheric stability have been proposed, but questioned as an important factor (Patricola et al., 2018). The resolution of atmospheric models affects the number of seeds, hence TC genesis frequency (Vecchi et al., 2019; Sugi et al., 2020; Yamada et al., 2021). The diverse and sometimes inconsistent projected changes in global TC frequency by high-resolution models indicate that better process understanding and improvement of the models are needed to raise confidence in these changes.
Most TC-permitting model simulations (10–60 km or finer grid spacing) are consistent in their projection of increases in the proportion of intense TCs (Category 4–5), as well as an increase in the intensity of the strongest TCs defined by maximum wind speed or central pressure fall (Murakami et al., 2012; Tsuboki et al., 2015; Wehner et al., 2018a; Knutson et al., 2020). The general reduction in the total number of TCs, which is concentrated in storms weaker than or equal to Category 1, contributes to this increase. The models are somewhat less consistent in projecting an increase in the frequency of Category 4–5TCs (Wehner et al., 2018a; Knutson et al., 2020). The projected increase in the intensity of the strongest TCs is consistent with theoretical understanding (e.g., Emanuel, 1987) and observations (e.g., Kossin et al., 2020). For a 2°C global warming, the median proportion of Category 4–5 TCs increases by 13%, while the median global TC frequency decreases by 14%, which implies that the median of the global Category 4–5 TC frequency is slightly reduced by 1% or almost unchanged (Knutson et al., 2020). Murakami et al. (2020) projected a decrease in TC frequency over the coming century in the North Atlantic due to greenhouse warming, as consistent with Dunstone et al. (2013), and a reduction in TC frequency almost everywhere in the tropics in response to +1% CO2 forcing. Exceptions include the central North Pacific (Hawaii region), east of the Philippines in the North Pacific, and two relatively small regions in the northern Arabian Sea and Bay of Bengal. These projections can vary substantially between ocean basins, possibly due to differences in regional SST warming and warming patterns (Sugi et al., 2017; Yoshida et al., 2017; Bacmeister et al., 2018). A summary of projections of TC characteristics is schematically shown by Figure 11.20.
The increase in global TC maximum surface wind speeds is about 5% for a 2°C global warming across a number of high-resolution multi-decadal studies (Knutson et al., 2020). This indicates the deepening in global TC minimum surface pressure under the global warming conditions. A regional cloud-permitting model study shows that the strongest TC in the western North Pacific can be as strong as 857 hPa in minimum surface pressure with a wind speed of 88 m s–1under warming conditions in 2074–2087 (Tsuboki et al., 2015). TCs are also measured by quantities such as ACE and the power dissipation index (PDI), which conflate TC intensity, frequency, and duration (Murakami et al., 2014). Several TC modelling studies (Yamada et al., 2010; H.S. Kim et al., 2014; Knutson et al., 2015) project little change or decreases in the globally accumulated value of PDI or ACE, which is due to the decrease in the total number of TCs.
A projected increase in global average TC rain rates of about 12% for a 2°C global warming is consistent with the Clausius–Clapeyron scaling of saturation-specific humidity (Knutson et al., 2020). Increases substantially greater than Clausius–Clapeyron scaling are projected in some regions, which is caused by increased low-level moisture convergence due to projected TC intensity increases in those regions (Knutson et al., 2015; Phibbs and Toumi, 2016; Patricola and Wehner, 2018; M. Liu et al., 2019a). Projections of TC precipitation using large-ensemble experiments (Kitoh and Endo, 2019) show that the annual maximum one-day precipitation total is projected to increase, except for the western North Pacific where only a small change (or even a reduction) is projected, mainly due to a projected decrease of TC frequency. They also show that the 10-year return value of extreme Rx1day associated with TCs will greatly increase in a region extending from Hawaii to the south of Japan. TC tracks and the location of topography relative to TCs significantly affect precipitation, thus, in general, areas on the eastern and southern faces of mountains have more impacts of TC precipitation changes (Hatsuzuka et al., 2020). Projection studies using variable-resolution models in the North Atlantic (Stansfield et al., 2020) indicate that TC-related precipitation rates within North Atlantic TCs and the amount of hourly precipitation due to TC are projected to increase by the end of the century compared to a historical simulation. However, the annual average TC-related Rx5day over the eastern USA is projected to decrease because of a reduction in landfalling TCs. RCM studies with around 25–50 km grid spacing are used to study projected changes in TCs. The projected changes of TCs in South East Asia simulated by RCMs are consistent with those of most GCMs, showing a decrease in TC frequency and an increase in the amount of TC-associated precipitation or an increase in the frequency of intense TCs (Redmond et al., 2015; Gallo et al., 2019).
Projected changes in TC tracks or TC areas of occurrence in the late 21st century vary considerably among available studies, although there is better agreement in the western North Pacific. Several studies project either poleward or eastward expansion of TC occurrence over the western North Pacific region, and more TC occurrence in the central North Pacific (Yamada et al., 2017; Yoshida et al., 2017; Wehner et al., 2018a; Roberts et al., 2020b). The observed poleward expansion of the latitude of maximum TC intensity in the western North Pacific is consistently reproduced by the CMIP5 models and downscaled models, and these models show further poleward expansion in the future; the projected mean migration rate of the mean latitude where TCs reach their lifetime-maximum intensity is 0.2±0.1° from CMIP5 model results, while it is 0.13±0.04° from downscaled models in the western North Pacific (Kossin et al., 2014, 2016a). In the North Atlantic, while the location of TC maximum intensity does not show clear poleward migration observationally (Kossin et al., 2014), it tends to migrate poleward in projections (Garner et al., 2017). The poleward migration is less robust among models and observations in the Indian Ocean, eastern North Pacific, and South Pacific (e.g., Tauvale and Tsuboki, 2019; Ramsay et al. 2018; Cattiaux et al. 2020). There is presently no clear consensus in projected changes in TC translation speed (Knutson et al., 2020), although recent studies suggest a slowdown outside of the tropics (Kossin, 2019; Yamaguchi et al., 2020; G. Zhang et al., 2020), but regionally there can even be an acceleration of the storms (Hassanzadeh et al., 2020).
The spatial extent, or ‘size’, of the TC wind field is an important determinant of storm surge and damage. No detectable anthropogenic influences on TC size have been identified to date, because TCs in observations vary in size substantially (Chan and Chan, 2015) and there is no definite theory on what controls TC size, although this is an area of active research (Chavas and Emanuel, 2014; Chan and Chan, 2018). However, projections by high-resolution models indicate future broadening of TC wind fields when compared to TCs of the same categories (Yamada et al., 2017), while Knutson et al. (2015) simulate a reasonable interbasin distribution of TC size climatology, but project no statistically significant change in global average TC size. A plausible mechanism is that, as the tropopause height becomes higher with global warming, the eye wall areas become wider because the eye walls are inclined outward with height to the tropopause. This effect is only reproduced in high-resolution convection-permitting models capturing eye walls, and such modelling studies are not common. Moreover, the projected TC size changes are generally on the order of 10% or less, and these size changes are still highly variable between basins and studies. Thus, the projected change in both magnitude and sign of TC size is uncertain.
The coastal effects of TCs depend on TC intensity, size, track, and translation speed. Projected increases in sea level, average TC intensity, and TC rainfall rates each generally act to further elevate future storm surge and fresh-water flooding (see Section 9.6.4.2). Changes in TC frequency could contribute toward increasing or decreasing future storm surge risk, depending on the net effects of changes in weaker vs stronger storms. Several studies (McInnes et al., 2014, 2016; Little et al., 2015; Garner et al., 2017; Timmermans et al., 2017, 2018) have explored future projections of storm surge in the context of anthropogenic climate change with the influence of both sea level rise and future TC changes. Garner et al. (2017) investigated the near-future changes in the New York City coastal flood hazard, and suggested a small change in storm-surge height because effects of TC intensification are compensated by the offshore shifts in TC tracks, but concluded that the overall effect due to the rising sea levels would increase the flood hazard. Future projection studies of storm surge in East Asia, including China, Japan and Korea, also indicate that storm surges due to TCs become more severe (J.A. Yang et al., 2018; Mori et al., 2019, 2021; J. Chen et al., 2020b). For the Pacific Islands, McInnes et al. (2014) found that the future projected increase in storm surge in Fiji is dominated by sea level rise, and projected TC changes make only a minor contribution. Among various storm surge factors, there is high confidence that sea level rise will lead to a higher possibility of extreme coastal water levels in most regions, with all other factors assumed equal.
In the North Atlantic, vertical wind shear, which inhibits TC genesis and intensification, varies in a quasi-dipole pattern, with one centre of action in the tropics and another along the south-east USA coast (Vimont and Kossin, 2007). This pattern of variability creates a protective barrier of high shear along the USA coast during periods of heightened TC activity in the tropics (Kossin, 2017), and appears to be a natural part of the Atlantic ocean–atmosphere climate system (Ting et al., 2019). Greenhouse gas forcing in CMIP5 and the Community Earth System Model Large Ensemble (Kay et al., 2015) simulations, however, erodes the pattern and degrades the natural shear barrier along the USA coast. Following the RCP8.5 emissions scenario, the magnitude of the erosion of the barrier equals the amplitude of past natural variability (time of emergence) by the mid-21st century (Ting et al., 2019). The projected reduction of shear along the USA East Coast with warming is consistent among studies (e.g., Vecchi and Soden, 2007).
In summary, average peak TC wind speeds and the proportion of Category 4–5 TCs will very likely increase globally with warming. It is likely that the frequency of Category 4–5 TCs will increase in limited regions over the western North Pacific. It is very likely that average TC rain rates will increase with warming, and likely that the peak rain rates will increase at rate greater than the Clausius–Clapeyron scaling rate of 7% per 1°C of warming in some regions due to increased low-level moisture convergence caused by regional increases in TC wind intensity. It is likely that the average location where TCs reach their peak wind intensity will migrate poleward in the western North Pacific Ocean as the tropics expand with warming, and that the global frequency of TCs over all categories will decrease or remain unchanged.
11.7.2 Extratropical Storms
This section focuses on extratropical cyclones (ETCs) that are either classified as strong or extreme by using some measure of their intensity, or by being associated with the occurrence of extremes in variables such as precipitation or near-surface wind speed (Seneviratne et al., 2012). Since AR5, the high relevance of ETCs for extreme precipitation events has been well established (Pfahl and Wernli, 2012; Catto and Pfahl, 2013; Utsumi et al., 2017), with 80% or more of hourly and daily precipitation extremes being associated with either ETCs or fronts over oceanic mid-latitude regions, and somewhat smaller, but still very large, proportions of events over mid-latitude land regions (Utsumi et al., 2017). The emphasis in this section is on individual ETCs that have been identified using some detection and tracking algorithms. Mid-latitude atmospheric rivers are assessed in Section 8.3.2.8.
11.7.2.1 Observed Trends
Section 2.3.1.4.3 concluded that there is overall low confidence in recent changes in the total number of ETCs over both hemispheres, and that there is medium confidence in a poleward shift of the storm tracks over both hemispheres since the 1980s. Overall, there is also low confidence in past-century trends in the number and intensity of the strongest ETCs due to the large interannual and decadal variability (Feser et al., 2015; Reboita et al., 2015; Wang et al., 2016; Varino et al., 2019) and due to temporal and spatial heterogeneities in the number and type of assimilated data in reanalyses, particularly before the satellite era (Krueger et al., 2013; Tilinina et al., 2013; Befort et al., 2016; Chang and Yau, 2016; Wang et al., 2016). There is medium confidence that the agreement among reanalyses and detection and tracking algorithms is higher when considering stronger cyclones (Neu et al., 2013; Pepler et al., 2015; Wang et al., 2016). Over the Southern Hemisphere, there is high confidence that the total number of ETCs with low central pressures (<980 hPa) has increased between 1979 and 2009, with all eight reanalyses considered by Wang et al. (2016) showing positive trends, and five of them showing statistically significant trends. Similar results were found by Reboita et al. (2015) using a different detection and tracking algorithm and a single reanalysis product. Over the Northern Hemisphere, there is high agreement among reanalyses that the number of cyclones with low central pressures (<970 hPa) has decreased in summer and winter during the period 1979–2010 (Tilinina et al., 2013; Chang et al., 2016). However, changes exhibit substantial decadal variability and do not show monotonic trends since the 1980s. For example, over the Arctic and North Atlantic, Tilinina et al. (2013) showed that the number of cyclones with very low central pressure (<960 hPa) increased from 1979 to 1990 and then declined until 2010 in all five reanalyses considered. Over the North Pacific, the number of cyclones with very low central pressure reached a peak around 2000 and then decreased until 2010 in the five reanalyses considered (Tilinina et al., 2013). Overall, however, it should be noted that characterising trends in the dynamical intensity of ETCs (e.g., wind speeds) using the absolute central pressure is problematic because the central pressure depends on the background mean sea level pressure, which varies seasonally and regionally (e.g., Befort et al., 2016).
11.7.2.2 Model Evaluation
There is high confidence that coarse-resolution climate models (e.g., CMIP5 and CMIP6) underestimate the dynamical intensity of ETCs, including the strongest ETCs, as measured using a variety of metrics, including mean pressure gradient, mean vorticity and near-surface wind speeds, over most regions (Colle et al., 2013; Zappa et al., 2013a; Govekar et al., 2014; Di Luca et al., 2016; Trzeciak et al., 2016; Seiler et al., 2018; Priestley et al., 2020). There is also high confidence that most current climate models underestimate the number of explosive systems (i.e., systems showing a decrease in mean sea level pressure of at least 24 hPa in 24 hours) over both hemispheres (Seiler and Zwiers, 2016a; Gao et al., 2020;Priestley et al., 2020). There is high confidence that the underestimation of the intensity of ETCs is associated with the coarse horizontal resolution of climate models, with higher horizontal resolution models, including HighResMIP and CORDEX, usually showing better performance (Colle et al., 2013; Zappa et al., 2013a; Di Luca et al., 2016; Trzeciak et al., 2016; Seiler et al., 2018; Gao et al., 2020; Priestley et al., 2020). The improvement by higher-resolution models is found, even when comparing models and reanalyses after post-processing data to a common resolution (Zappa et al., 2013a; Di Luca et al., 2016; Priestley et al., 2020). The systematic bias in the intensity of ETCs has also been linked to the inability of current climate models to resolve diabatic processes, particularly those related to the release of latent heat (Willison et al., 2013; Trzeciak et al., 2016) and the formation of clouds (Govekar et al., 2014). There is medium confidence that climate models simulate well the spatial distribution of precipitation associated with ETCs over the Northern Hemisphere, together with some of the main features of the ETC life cycle, including the maximum in precipitation occurring just before the peak in dynamical intensity (e.g., vorticity) as observed in a reanalysis and observations (Hawcroft et al., 2018). There is, however, large observational uncertainty in ETC-associated precipitation (Hawcroft et al., 2018) and limitations in the simulation of frontal precipitation, including overly low rainfall intensity over mid-latitude oceanic areas in both hemispheres (Catto et al., 2015).
11.7.2.3 Detection and Attribution, Event Attribution
(Section 3.3.3.3 concluded that there is low confidence in the attribution of observed changes in the number of ETCs in the Northern Hemisphere and high confidence that the poleward shift of storm tracks in the Southern Hemisphere is linked to human activity, mostly due to emissions of ozone-depleting substances. Specific studies attributing changes in the most extreme ETCs are not available. The human influence on individual extreme ETC events has been considered only a few times and there is overall low confidence in the attribution of these changes (NASEM, 2016; Vautard et al., 2019).
11.7.2.4 Projections
The frequency of ETCs is expected to change, primarily following a poleward shift of the storm tracks as discussed in Section 4.5.1.6 (see also Figure 4.31) and Section 8.4.2.8. There is medium confidence that changes in the dynamical intensity (e.g., wind speeds) of ETCs will be small, although changes in the location of storm tracks can lead to substantial changes in local extreme wind speeds (Zappa et al., 2013b; Chang, 2014; Li et al., 2014; Seiler and Zwiers, 2016b; Yettella and Kay, 2017; Barcikowska et al., 2018; Kar-Man Chang, 2018). Yettella and Kay (2017) detected and tracked ETCs over both hemispheres in an ensemble of 30 Community Earth System Model Large Ensemble simulations, differing only in their initial conditions, and found that changes in mean wind speeds around ETC centres are often negligible between present (1986–2005) and future (2081–2100) periods. Using 19 CMIP5 models, Zappa et al. (2013b) found an overall reduction in the number of cyclones associated with low-troposphere (850-hPa) wind speeds larger than 25 m s–1 over the North Atlantic and Europe with the number of the 10% strongest cyclones decreasing by about 8% and 6% in December–January–February and June–July–August according to the RCP4.5 scenario (2070–2099 vs. 1976–2005). Over the North Pacific, Chang (2014) showed that CMIP5 models project a decrease in the frequency of ETCs, with the largest central pressure perturbation (i.e., the depth, strongly related with low-level wind speeds) by the end of the century according to simulations using the RCP8.5 scenario. Using projections from CMIP5 GCMs under the RCP8.5 scenario (1981–2000 to 2081–2100), Seiler and Zwiers (2016b) projected a northward shift in the number of explosive ETCs in the northern Pacific, with fewer and weaker events south, and more frequent and stronger events north of 45°N. Using 19 CMIP5 GCMs under the RCP8.5 scenario, Kar-Man Chang (2018) found a significant decrease in the number of ETCs associated with extreme wind speeds (2081–2100 vs. 1980–99) over the Northern Hemisphere (average decrease of 17%) and over some smaller regions, including the Pacific and Atlantic regions.
Over the Southern Hemisphere, future changes (RCP8.5 scenario; 1980–1999 to 2081–2100) in extreme ETCs were studied by Chang (2017) using 26 CMIP5 models, and a variety of intensity metrics (850-hPa vorticity, 850-hPa wind speed, mean sea level pressure and near-surface wind speed). They found that the number of extreme cyclones is projected to increase by at least 20% and as much as 50%, depending on the specific metric used to define extreme ETCs. Increases in the number of strong cyclones appear to be robust across models and for most seasons, although they show strong regional variations, with increases occurring mostly over the southern flank of the storm track, consistent with a shift and intensification of the storm track. Overall, there is medium confidence that projected changes in the dynamical intensity of ETCs depend on the resolution and formulation (e.g., explicit or implicit representation of convection) of climate models (Booth et al., 2013; Michaelis et al., 2017; Zhang and Colle, 2017).
As reported in AR5 and in Section 8.4.2.8, despite small changes in the dynamical intensity of ETCs, there is high confidence that the precipitation associated with ETCs will increase in the future (Zappa et al., 2013b; Marciano et al., 2015; Pepler et al., 2016; Michaelis et al., 2017; Yettella and Kay, 2017; Zhang and Colle, 2017; Barcikowska et al., 2018; Hawcroft et al., 2018; Zarzycki, 2018; Kodama et al., 2019; Bevacqua et al., 2020a; Reboita et al., 2021). There is high confidence that increases in precipitation will follow increases in low-level water vapour (i.e., about 7% per 1°C of surface warming; see Box 11.1) and will be larger for higher warming levels (Zhang and Colle, 2017). There is medium confidence that precipitation changes will show regional and seasonal differences due to distinct changes in atmospheric humidity and dynamical conditions (Zappa et al., 2015; Hawcroft et al., 2018), with decreases in some specific regions such as the Mediterranean (Zappa et al., 2015; Barcikowska et al., 2018). There is high confidence that snowfall associated with winter ETCs will decrease in the future, because increases in tropospheric temperatures lead to a lower proportion of precipitation falling as snow (O’Gorman, 2014; Rhoades et al., 2018; Zarzycki, 2018). However, there is medium confidence that extreme snowfall events associated with winter ETCs will change little in regions where snowfall will be supported in the future (O’Gorman, 2014; Zarzycki, 2018).
In summary, there is low confidence in past changes in the dynamical intensity (e.g., maximum wind speeds) of ETCs and medium confidence that, in the future, these changes will be small, although changes in the location of storm tracks could lead to substantial changes in local extreme wind speeds. There is high confidence that average and maximum ETC precipitation-rates will increase with warming, with the magnitude of the increases associated with increases in atmospheric water vapour. There is medium confidence that projected changes in the intensity of ETCs, including wind speeds and precipitation, depend on the resolution and formulation of climate models.
11.7.3 Severe Convective Storms
Severe convective storms are convective systems that are associated with extreme phenomena such as tornadoes, hail, heavy precipitation (rain or snow), strong winds, and lightning. The assessment of changes in severe convective storms in SREX (Chapter 3, Seneviratne et al., 2012) and AR5 (Chapter 12, Collins et al., 2013) is limited and focused mainly on tornadoes and hail storms. The SREX assessed that there is low confidence in observed trends in tornadoes and hail because of data inhomogeneities and inadequacies in monitoring systems. Subsequent literature assessed in the Climate Science Special Report (Kossin et al., 2017) led to the assessment of the observed tornado activity over the 2000s in the USA, with a decrease in the number of days per year with tornadoes and an increase in the number of tornadoes on these days (medium confidence). However, there is low confidence in past trends for hail and severe thunderstorm winds. Climate models consistently project environmental changes that would support an increase in the frequency and intensity of severe thunderstorms that combine tornadoes, hail, and winds (high confidence), but there is low confidence in the details of the projected increase. Regional aspects of severe convective storms and details of the assessment of tornadoes and hail are also assessed in Section 12.3.3.2 (tornadoes), Section 12.3.4.5 (hail), Section 12.4.5.3 (Europe), Section 12.4.6.3 (North America), and Section 12.7.2 (regional gaps and uncertainties).
11.7.3.1 Mechanisms and Drivers
Severe convective storms are sometimes embedded in synoptic-scale weather systems, such as TCs, ETCs, and fronts (Kunkel et al., 2013). They are also generated as individual events as mesoscale convective systems (MCSs) and mesoscale convective complexes (MCCs, a special type of a large, organized and long-lived MCS), without being clearly embedded within larger-scale weather systems. In addition to the general vigorousness of precipitation, hail, and winds associated with MCSs, characteristics of MCSs are viewed in new perspectives in recent years, probably because of both the development of dense mesoscale observing networks and advances in high-resolution mesoscale modelling (Sections 11.7.3.2 and 11.7.3.3). The horizontal scale of MCSs is discussed with their organization of the convective structure, and it is examined with a concept of ‘convective aggregation’ in recent years (Holloway et al., 2017). MCSs sometimes take a linear shape and stay almost stationary with successive production of cumulonimbus on the upstream side (back-building type convection), and cause heavy rainfall (Schumacher and Johnson, 2005). Many of the recent severe rainfall events in Japan are associated with band-shaped precipitation systems (Kunii et al., 2016; Oizumi et al., 2018; Tsuguti et al., 2018; Kato, 2020), suggesting common characteristics of severe precipitation, at least in East Asia. The convective modes of severe storms in the USA can be classified into rotating or linear modes and preferable environmental conditions for these modes, such as vertical shear, have been identified (Trapp et al., 2005; Smith et al., 2013; Allen, 2018). Cloud microphysics characteristics of MCSs were examined and the roles of warm rain processes on extreme precipitation were emphasized recently (Sohn et al., 2013; Hamada et al., 2015; Hamada and Takayabu, 2018). Idealized studies also suggest the importance of ice and mixed-phase processes of cloud microphysics on extreme precipitation (Sandvik et al., 2018; Bao and Sherwood, 2019). However, it is unknown whether the types of MCS are changing in recent periods or observed ubiquitously all over the world.
Severe convective storms occur under conditions preferable for deep convection, that is, conditionally unstable stratification, sufficient moisture, both in lower and middle levels of the atmosphere, and a strong vertical shear. These large-scale environmental conditions are viewed as necessary conditions for the occurrence of severe convective systems, or the resulting tornadoes and lightning, and the relevance of these factors strongly depends on the region (e.g., Antonescu et al., 2016a; Allen, 2018; Tochimoto and Niino, 2018). Frequently used metrics are atmospheric static stability, moisture content, convective available potential energy (CAPE) and convective inhibition, wind shear or helicity, including storm-relative environmental helicity (Tochimoto and Niino, 2018; Elsner et al., 2019). These metrics, largely controlled by large-scale atmospheric circulations or synoptic weather systems, such as TCs and ETCs, are then generally used to examine severe convective systems. In particular, there is high confidence that CAPE in the tropics and the subtropics increases in response to global warming (M.S. Singh et al., 2017), as supported by theoretical studies (Singh and O’Gorman, 2013; Seeley and Romps, 2015; Romps, 2016; Agard and Emanuel, 2017). The uncertainty, however, arises from the balance between factors affecting severe storm occurrence. For example, the warming of mid-tropospheric temperatures leads to an increase in the freezing level, which leads to increased melting of smaller hailstones, while there may be some offset by stronger updrafts driven by increasing CAPE, which would favour the growth of larger hailstones, leading to less melting when falling (Allen, 2018; Mahoney, 2020).
There are few studies on relations between changes in severe convective storms and those of the large-scale circulation patterns. Tornado outbreaks in the USA are usually associated with ETCs with their frontal systems and TCs (Fuhrmann et al., 2014; Tochimoto and Niino, 2016). In early June to late July in East Asia, associated with the Baiu/Changma/Mei-yu, severe precipitation events are frequently caused by MCSs. Severe precipitation events are also caused by remote effects of TCs, known as predecessor rain events (Galarneau et al., 2010). Atmospheric rivers and other coherent types of enhanced water vapour flux also have the potential to induce severe convective systems (Kamae et al., 2017a; Waliser and Guan, 2017; Ralph et al., 2018; see Section 8.3.2.8.2). Combined with the above drivers, topographic effects also enhance the intensity and duration of severe convective systems and the associated precipitation (Ducrocq et al., 2008; Piaget et al., 2015). However, the changes in these drivers are not generally significant, so their relations to severe convective storms are unclear.
In summary, severe convective storms are sometimes embedded in synoptic-scale weather systems, such as TCs, ETCs and fronts, and modulated by large-scale atmospheric circulation patterns. The occurrence of severe convective storms and the associated severe events, including tornadoes, hail, and lightning, is affected by environmental conditions of the atmosphere, such as CAPE and vertical shear. The uncertainty, however, arises from the balance between these environmental factors affecting severe storm occurrence.
11.7.3.2 Observed Trends
Observed trends in severe convective storms or MCSs are not well documented, but the climatology of MCSs has been analysed in specific regions (North America, South America, Europe, Asia; regional aspects of convective storms are separately assessed in Chapter 12). As the definition of severe convective storms varies depending on the literature, it is not straightforward to make a synthesizing view of observed trends in severe convective storms in different regions. However, analysis using satellite observations provides a global view of MCSs (Kossin et al., 2017). The global distribution of thunderstorms is captured (Zipser et al., 2006; Liu and Zipser, 2015) by using the satellite precipitation measurements by the Tropical Rainfall Measuring Mission (TRMM) and Global Precipitation Mission (GPM) (Hou et al., 2014). The climatological characteristics of MCSs are provided by satellite analyses in South America (Durkee and Mote, 2010; Rasmussen and Houze, 2011; Rehbein et al., 2018) and those of MCCs in the Maritime Continent by Trismidianto and Satyawardhana (2018). Analysis of the environmental conditions favourable for severe convective events indirectly indicates the climatology and trends of severe convective events (Allen et al., 2018; Taszarek et al., 2018, 2019), though favourable conditions depend on the location, such as the difference for tornadoes associated with ETCs between the USA and Japan (Tochimoto and Niino, 2018).
Observed trends in severe convective storms are highly regionally dependent. In the USA, it is indicated that there is no significant increase in convective storms, and hail and severe thunderstorms (Kunkel et al., 2013; Kossin et al., 2017). There is an upward trend in the frequency and intensity of extreme precipitation events in the USA (high confidence) (Kunkel et al., 2013; Easterling et al., 2017), and MCSs have increased in occurrence and precipitation amounts since 1979 (limited evidence) (Feng et al., 2016). Significant interannual variability of hailstone occurrences is found in the Southern Great Plains of the USA (Jeong et al., 2020). The mean annual number of tornadoes has remained relatively constant, but their variability of occurrence has increased since the 1970s,particularly over the 2000s, with a decrease in the number of days per year, but an increase in the number of tornadoes on these days (Brooks et al., 2014; Elsner et al., 2015, 2019; Kossin et al., 2017; Allen, 2018). There has been a shift in the distribution of tornadoes, with increases in the mid-south of the USA and decreases over the High Plains (Gensini and Brooks, 2018). Trends in MCSs are relatively more visible for particular aspects of MCSs, such as lengthening of active seasons and dependency on duration. MCSs have increased in occurrence and precipitation amounts since 1979 (Easterling et al., 2017). Feng et al. (2016) analysed that the observed increases in spring total and extreme rainfall in the central USA are dominated by MCSs, with increased frequency and intensity of long-lasting MCSs.
Studies on trends in severe convective storms and their ingredients outside of the USA are limited. Westra et al. (2014) found that there is an increase in the intensity of short-duration convective events (minutes to hours) over many regions of the world, except eastern China. In Europe, a climatology of tornadoes shows an increase in detected tornadoes between 1800 and 2014, but this trend might be affected by the density of observations (Antonescu et al., 2016a, b). An increase in the trend in extreme daily rainfall is found in south-eastern France, where MCSs play a key role in this type of event (Blanchet et al., 2018; Ribes et al., 2019). Trend analysis of the mean annual number of days with thunderstorms since 1979 in Europe indicates an increase over the Alps and central, south-eastern, and eastern Europe, with a decrease over the south-west (Taszarek et al., 2019). In the Sahelian region, Taylor et al. (2017) analysed MCSs using satellite observations since 1982 and showed an increase in the frequency of extreme storms. In Bangladesh, the annual number of propagating MCSs decreased significantly during 1998–2015 based on TRMM precipitation data (Habib et al., 2019). Prein and Holland (2018) estimated the hail hazard from large-scale environmental conditions using a statistical approach and showed increasing trends in the USA, Europe, and Australia. However, trends in hail on regional scales are difficult to validate because of an insufficient length of observations and inhomogeneous records (Allen, 2018). The high spatial variability of hail suggests it is reasonable that there would be local signals of both positive and negative trends, and the trends that are occurring in hail globally are uncertain. In China, the total number of days that have either a thunderstorm or hail have decreased by about 50% from 1961 to 2010, and the reduction in these severe weather occurrences correlates strongly with the weakening of the East Asian summer monsoon (Q. Zhang et al., 2017). More regional aspects of severe convective storms are detailed in Chapter 12.
In summary, because the definition of severe convective storms varies depending on the literature and the region, it is not straightforward to make a synthesizing view of observed trends in severe convective storms in different regions. In particular, observational trends in tornadoes, hail, and lightning associated with severe convective storms are not robustly detected due to insufficient coverage of the long-term observations. There is medium confidence that the mean annual number of tornadoes in the USA has remained relatively constant, but their variability of occurrence has increased since the 1970s, particularly over the 2000s, with a decrease in the number of days per year, and an increase in the number of tornadoes on these days (high confidence). Detected tornadoes have also increased in Europe, but the trend depends on the density of observations.
11.7.3.3 Model Evaluation
The explicit representation of severe convective storms requires non-hydrostatic models with horizontal grid spacings finer than 4 km, denoted as convection-permitting models or storm-resolving models (Section 10.3.1). Convection-permitting models are becoming available to run over a wide domain, such as a continental scale or even over the global area, and show realistic climatological characteristics of MCSs (Prein et al., 2015; Guichard and Couvreux, 2017; Satoh et al., 2019). Such high-resolution simulations are computationally too expensive to perform at the larger domain and for long periods, and alternative methods by using an RCM with dynamical downscaling are generally used (Section 10.3.1). Convection-permitting models are used as the flagship project of CORDEX to particularly study projections of thunderstorms (Section 10.3.3). Simulations of North American MCSs by a convection-permitting model conducted by Prein et al. (2020) were able to capture the main characteristics of the observed MCSs, such as their size, precipitation rate, propagation speed, and lifetime. Cloud-permitting model simulations in Europe also showed sub-daily precipitation realistically (Ban et al., 2014; Kendon et al., 2014). Evaluation of precipitation conducted using convection-permitting simulations around Japan showed that finer resolution improves intense precipitation (Murata et al., 2017). MCSs over Africa simulated using convection-permitting models showed better extreme rainfall (Kendon et al., 2019) and diurnal cycles and convective rainfall over land than the coarser-resolution RCMs or GCMs (Stratton et al., 2018; Crook et al., 2019).
The other modelling approach is the analysis of the environmental conditions that control characteristics of severe convective storms using the typical climate model results in CMIP5/6 (Allen, 2018). Severe convective storms are generally formed in environments with large CAPE and tornadic storms are, in particular, formed with a combination of large CAPE and strong vertical wind shear. As the processes associated with severe convective storms occur over a wide range of spatial and temporal scales, some of which are poorly understood and are inadequately sampled by observational networks, the model calibration approaches are generally difficult and insufficiently validated. Therefore, model simulations and their interpretations should be done with much caution.
In summary, there are typically two kinds of modelling approaches for studying changes in severe convective storms. One is to use convection-permitting models in wider regions or the global domain in time-sliced downscaling methods to directly simulate severe convective storms. The other is the analysis of the environmental conditions that control characteristics of severe convective storms by using coarse-resolution GCMs. Even in finer-resolution convection-permitting models, it is difficult to directly simulate tornadoes, hail storms, and lightning, so modelling studies of these changes are limited.
11.7.3.4 Detection and Attribution, Event Attribution
It is extremely difficult to detect differences in time and space of severe convective storms (Kunkel et al., 2013). Although some ingredients that are favourable for severe thunderstorms have increased over the years, others have not; thus, overall, changes in the frequency of environments favourable for severe thunderstorms have not been statistically significant. Event attribution studies on severe convective events have now been undertaken for some cases. For the case of the heavy rain event of July 2018 in Japan (Box 11.4), Kawase et al. (2020) took a storyline approach to show that the rainfall during this event in Japan was increased by approximately 7% due to recent rapid warming around Japan. For the case of the December 2015 extreme rainfall event in Chennai, India, the extremity of the event was equally caused by the warming trend in the Bay of Bengal SSTs and the strong El Niño conditions (van Oldenborgh et al., 2016; Boyaj et al., 2018). For hailstorms, such as those that caused disasters in the USA in 2018, detection of the role of climate change in changing hail storms is more difficult, because hail storms are not, in general, directly simulated by convection-permitting models and not adequately represented by the environmental parameters of coarse-resolution GCMs (Mahoney, 2020).
In summary, it is extremely difficult to detect and attribute changes in severe convective storms. There is limited evidence that extreme precipitation associated with severe convective storms has increased in some cases.
11.7.3.5 Projections
Future projections of severe convective storms are usually studied either by analysing the environmental conditions simulated by climate models, or by a time-slice approach with higher-resolution convection-permitting models by comparing simulations downscaled with climate model results under historical conditions and those under hypothesized future conditions (Kendon et al., 2017; Allen, 2018). Up to now, individual studies using convection-permitting models gave projections of extreme events associated with severe convective storms in local regions, and it is not generally possible to obtain global or general views of projected changes of severe convective storms. Prein et al. (2017) investigated future projections of North American MCS simulations and showed an increase in MCS frequency and an increase in total MCS precipitation volume by the combined effect of increases in maximum precipitation rates associated with MCSs and increases in their size. Rasmussen et al. (2020) investigated future changes in the diurnal cycle of precipitation by capturing organized and propagating convection and showed that weak-to-moderate convection will decrease, and strong convection will increase in frequency in the future. Ban et al. (2015) found that the day-long and hour-long precipitation events in summer intensify in the European region covering the Alps. Kendon et al. (2019) showed future increases in extreme three-hourly precipitation in Africa. Murata et al. (2015) investigated future projections of precipitation around Japan and showed a decrease in monthly mean precipitation in the eastern Japan Sea region in December, suggesting that convective clouds become shallower in the future in the winter over the Japan Sea.
The other approach is the projection of the environmental conditions that control characteristics of severe convective storms by analysing climate model results. There is high confidence that CAPE, particularly summer mean CAPE and high percentiles of the CAPE in the tropics and subtropics, increases in response to global warming in an ensemble of climate models including those of CMIP5, mainly from increased low-level specific humidity (Sobel and Camargo, 2011; M.S. Singh et al., 2017; J. Chen et al., 2020a). Convective inhibition becomes stronger over most land areas under global warming, resulting mainly from reduced low-level relative humidity over land (J. Chen et al., 2020a). However, there are large differences within the CMIP5 ensemble for environmental conditions, which contribute to some degree of uncertainty (Allen, 2018). Because the relation between simulated environments in models and the occurrence of severe convective storms are, in general, insufficiently validated, there is generallylow confidence in the projection of severe convective storms with the approach of the environmental conditions.
In the USA, projected changes in the environmental conditions show an increase in CAPE and no changes or decreases in the vertical wind shear, suggesting favourable conditions for an increase in severe convective storms in the future, but the interpretation of how tornadoes or hail will change is an open question because of the strong dependence on shear (Brooks, 2013). Diffenbaugh et al. (2013) showed robust increases in the occurrence of the favourable environments for severe convective storms with increased CAPE and stronger low-level wind shear in response to future global warming. A downscaling approach showed that the variability of the occurrence of severe convective storms increases in spring in late 21st-century simulations (Gensini and Mote, 2015). Future changes in hail occurrence in the USA examined through convection-permitting dynamical downscaling suggested that the hail season may begin earlier in the year and exhibit more interannual variability, with increases in the frequency of large hail in broad areas over the USA (Trapp et al., 2019). There is medium confidence that the frequency and variability of the favourable environments for severe convective storms will increase in spring, and low confidence for summer and autumn (Diffenbaugh et al., 2013; Gensini and Mote, 2015; Hoogewind et al., 2017). The occurrence of hail events in Colorado in the USA was examined by comparing both present-day and projected future climates using high-resolution model simulations capable of resolving hailstorms (Mahoney et al., 2012), which showed that hail is almost eliminated at the surface in the future in most of the simulations, despite more intense future storms and significantly larger amounts of hail generated in-cloud.
Future changes in severe convection environments show enhancement of instability with less robust changes in the frequency of strong vertical wind shear in Europe (Púčik et al., 2017) and in Japan (Muramatsu et al., 2016). In Japan, the frequency of conditions favourable for strong tornadoes increases in spring, and partly in summer.
In summary, the average and maximum rain rates associated with severe convective storms increase in a warming world in some regions, including the USA (high confidence). There is high confidence from climate models that CAPE increases in response to global warming in the tropics and subtropics, suggesting more favourable environments for severe convective storms. The frequency of severe convective storms in spring is projected to increase in the USA, leading to a lengthening of the severe convective storm season (medium confidence); evidence in other regions is limited. There is significant uncertainty about projected regional changes in tornadoes, hail, and lightning due to limited analysis of simulations using convection-permitting models (high confidence).
11.7.4 Extreme Winds
Extreme winds are defined here in terms of the strongest near-surface wind speeds that are generally associated with extreme storms, such as TCs, ETCs, and severe convective storms. In previous IPCC reports, near-surface wind speed (including extremes), has not been assessed as a variable in its own right, but rather in the context of other extreme atmospheric or oceanic phenomena. The exception was the SREX report (Seneviratne et al., 2012), which specifically examined past changes and projections of mean and extreme near-surface wind speeds. A strong decline in extreme winds compared to mean winds was reported for the continental northern mid-latitudes. Due to the small number of studies and uncertainties in terrestrial-based surface wind measurements, the findings were assigned low confidence in SREX. The AR5 reported a weakening of mean and maximum winds from the 1960s or 1970s to the early 2000s in the tropics and mid-latitudes, and increases in high latitudes, but with low confidence in changes in the observed surface winds over land (Hartmann et al., 2013). Observed trends in mean wind speed over land and the ocean are assessed in Section 2.3.1.4.4. Aspects of climate impact-drivers for winds are addressed in Sections 12.3.3 and 12.5.2, and their regional changes are assessed in Section 12.4.
Observationally, although not specifically addressing extreme wind speed changes, negative surface wind speed trends (stilling) were found in the tropics and mid-latitudes of both hemispheres of –0.014 m s–1yr–1, while positive trends were reported at high latitudes poleward of 70 degrees, based on a review of 148 studies (McVicar et al., 2012b). An earlier study attributed the stilling to both changes in atmospheric circulation and an increase in surface roughness due to an overall increase in vegetation cover (Vautard et al., 2010). Since then, a number of studies have mostly confirmed these general negative mean-wind trends based on anemometer data for Spain (Azorin-Molina et al., 2017), Turkey, (Dadaser-Celik and Cengiz, 2014), the Netherlands, (Wever, 2012), Saudi Arabia, (Rehman, 2013), Romania, (Marin et al., 2014), and China (Chen et al., 2013). Lin et al. (2013) note that wind speed variability over China is greater at high-elevation locations compared to those closer to mean sea level. Hande et al. (2012), using radiosonde data, found an increase in surface wind speed on Macquarie Island of Australia.
A number of new studies have examined surface wind speeds over the ocean using ship-based measurements, satellite altimeters, and Special Sensor Microwave/Imagers (Tokinaga and Xie, 2011; Zieger et al., 2014). It has been noted that wind speed trends tend to be stronger in altimeter measurements, although the spatial patterns of change are qualitatively similar in both instruments (Zieger et al., 2014). Q. Liu et al. (2016) found positive trends in surface wind speeds over the Arctic Ocean in 20 years of satellite observations. Small positive trends in mean wind speed were found in 33 years of satellite data, together with larger trends in the 90th percentile values over global oceans (Ribal and Young, 2019). These results were consistent with an earlier study that found a positive trend in 1-in-100-year wind speeds (Young et al., 2012). A positive change in mean wind speeds was found for the Arabian Sea and the Bay of Bengal (Shanas and Kumar, 2015) and Zheng et al. (2017) found that positive wind speed trends over the ocean were larger during winter seasons than summer seasons.
Changes in extreme winds are associated with changes in the characteristics (locations, frequencies, and intensities) of extreme storms, including TCs, ETCs, and severe convective storms. For TCs, as assessed in Section 11.7.1.5, it is projected that the average peak TC wind speeds will increase globally with warming, while the global frequency of TCs over all categories will decrease or remain unchanged; the average location where TCs reach their peak wind intensity will migrate poleward in the western North Pacific Ocean as the tropics expand with warming. Frequency, intensities, and geographical distributions of extreme wind events associated with TCs will change according to these TC changes. For ETCs, by the end of the century, CMIP5 models show that the number of ETCs associated with extreme winds will significantly decrease in the mid- and high latitudes of the Northern Hemisphere in winter, with the projected decrease being larger over the Atlantic (Kar-Man Chang, 2018), while it will significantly increase irrespective of the season in the Southern Hemisphere (Section 11.7.2.4; Chang, 2017). Over the ocean in the subtropics, a large ensemble of 60-km global model simulations indicated that extreme winds associated with storm surges will intensify over 15–35°N in the Northern Hemisphere (Mori et al., 2019). However, extreme surface wind speeds will mostly decrease due to decreases in the number and intensity of TCs over most tropical areas of the Southern Hemisphere (Mori et al., 2019). The projected changes in the frequency of extreme winds are associated with the future changes in TCs and ETCs.
Extreme cyclonic windstorms that share some characteristics with both TCs and ETCs occur regularly over the Mediterranean Sea and are often referred to as ‘medicanes’ (Ragone et al., 2018; Miglietta and Rotunno, 2019; Zhang et al., 2021). Medicanes pose substantial threats to regional islands and coastal zones. A growing body of literature consistently found that the frequency of medicanes decreases under warming, while the strongest medicanes become stronger (Gaertner et al., 2007; Romero and Emanuel, 2013, 2017; Cavicchia et al., 2014; Tous et al., 2016; Romera et al., 2017; González-Alemán et al., 2019). This is also consistent with expected global changes in TCs under warming (Section 11.7.1). Based on the consistency of these studies, it is likely that medicanes will decrease in frequency, while the strongest medicanes become stronger under warming scenario projections (medium confidence).
In summary, the observed intensity of extreme winds is becoming less severe in the low to mid-latitudes, while becoming more severe in high latitudes poleward of 60 degrees (low confidence). Projected changes in the frequency and intensity of extreme winds are associated with projected changes in the frequency and intensity of TCs and ETCs (medium confidence).
11.8 Compound Events
The SREX (SREX Chapter 3) first defined compound events as: (i) two or more extreme events occurring simultaneously or successively, (ii) combinations of extreme events with underlying conditions that amplify the impact of the events, or (iii) combinations of events that are not themselves extremes but lead to an extreme event or impact when combined.
Further definitions of compound events have emerged since SREX. Zscheischler et al. (2018) defined compound events broadly as ‘the combination of multiple drivers and/or hazards that contributes to societal or environmental risk’. This definition is used in the present assessment, because of its clear focus on the risk framework established by the IPCC, and also highlighting that compound events may not necessarily result from dependent drivers. Compound events have been classified into: preconditioned events, where a weather-driven or climate-driven precondition aggravates the impacts of a climatic impact-driver; multivariate events, where multiple drivers and/or climatic impact-drivers lead to an impact; temporally compounding events, where a succession of hazards leads to an impact; and spatially compounding events, where hazards in multiple connected locations cause an aggregated impact (Zscheischler et al., 2020). Drivers include processes, variables, and phenomena in the climate and weather domain that may span over multiple spatial and temporal scales. Hazards (such as floods, heatwaves, wildfires; also termed ´climatic impact-drivers´ in this report, see Chapter 12) are usually the immediate physical precursors to negative impacts, but can occasionally have positive outcomes (Flach et al., 2018). The present assessment focuses on the physical dimension of changes in compound events, as it is part of the IPCC AR6 Working Group I Report.
11.8.1 Overview
The combination of two or more – not necessarily extreme – weather or climate events that occur: i) at the same time; ii) in close succession; or iii) concurrently in different regions, can lead to extreme impacts that are much larger than the sum of the impacts due to the occurrence of individual extremes alone. This is because multiple stressors can exceed the coping capacity of a system more quickly. The contributing events can be of similar types (clustered multiple events) or of different types (Zscheischler et al., 2020). Many major weather- and climate-related catastrophes are inherently of a compound nature (Zscheischler et al., 2019).This has been highlighted for a broad range of hazards, such as droughts, heatwaves, wildfires, coastal extremes, and floods (Westra et al., 2016; AghaKouchak et al., 2020; Ridder et al., 2020). Co-occurring extreme precipitation and extreme winds can result in infrastructural damage (Martius et al., 2016); the compounding of storm surge and precipitation extremes can cause coastal floods (Wahl et al., 2015); the combination of drought and heat can lead to tree mortality (Section 11.6; Allen et al., 2015); and wildfires increase occurrences of hailstorms and lightning (Y. Zhang et al., 2019a). Compound storm types consisting of co-located cyclone, front and thunderstorm systems have a higher chance of causing extreme rainfall and extreme winds than individual storm types (Dowdy and Catto, 2017). Extremes may occur at similar times at different locations (De Luca et al., 2020a, b) but affect the same system, for instance, spatially concurrent climate extremes affecting crop yields and food prices (Singh et al., 2018; Anderson et al., 2019). Studies also show an increasing likelihood for breadbasket regions to be concurrently affected by climate extremes with increasing global warming, even between 1.5°C and 2°C of global warming (Box 11.2; Gaupp et al., 2019). Concomitant extreme conditions at different locations become more probable as changes in climate extremes are emerging over an increasing fraction of the land area (Sections 11.2.3, 11.2.4, 11.8.2 and 11.8.3, and Box 11.4).
Finally, impacts may occur because of large multivariate anomalies in the climate drivers, if systems are adapted to historical multivariate climate variability (Flach et al., 2017). For instance, ecosystems are typically adapted to the local covariability of temperature and precipitation such that a bivariate anomaly may have a large impact, even though neither temperature nor precipitation may be extreme based on a univariate assessment (Mahony and Cannon, 2018). Given that almost all systems are affected by weather and climate phenomena at multiple space-time scales (Raymond et al., 2020), it is natural to consider extremes in a compound event framework. It should be noted, however, that multi-hazard dependencies can also decrease risk, for instance when hazards are negatively correlated (Hillier et al., 2020). Despite this recognition, the literature on past and future changes in compound events has been limited, but is growing. This section assesses examples of types of compound events in available literature.
In summary, compound events include the combination of two or more – not necessarily extreme – weather or climate events that occur (i) at the same time, (ii) in close succession, or (iii) concurrently in different regions. The land area affected by concurrent extremes has increased (high confidence). Concurrent extreme events at different locations, but possibly affecting similar sectors (e.g., breadbaskets) in different regions, will become more frequent with increasing global warming, in particular above +2°C of global warming (high confidence).
11.8.2 Concurrent Extremes in Coastal and Estuarine Regions
Coastal and estuarine zones are prone to a number of meteorological extreme events and also to concurrent extremes (see also Section 6.8.2 in SROCC). Floods are a major climatic impact-driver in coastal regions around the world (Chapter 12), and flood occurrence may be influenced by the dependence between storm surge, extreme rainfall, and river flow, but also by sea level rise, waves and tides, as well as groundwater for estuaries. Floods with multiple drivers are often referred to as ‘compound floods’ (Wahl et al., 2015; Moftakhari et al., 2017; Bevacqua et al., 2020c).
At USA coasts, the probability of co-occurring storm surge and heavy precipitation is higher for the Atlantic/Gulf coast relative to the Pacific coast (Wahl et al., 2015). Furthermore, six studied locations on the USA coast with long overlapping time series show an increase in the dependence between heavy precipitation and storm surge over the last century, leading to more frequent co-occurring storm surge and heavy precipitation events at the present day (Wahl et al., 2015). Storm surge and extreme rainfall are also dependent in most locations on the Australian coasts (Zheng et al., 2013) and in Europe along the Dutch coasts (Ridder et al., 2018), along the Mediterranean Sea, the Atlantic coast and the North Sea (Bevacqua et al., 2019). The probability of flood occurrence can be assessed via the dependence between storm surge and river flow (Bevacqua et al., 2020b, c). For instance, the occurrence of a North Sea storm surge in close succession with an extreme Rhine or Meuse river discharge is much more probable due to their dependence, compared to if both events were independent (Kew et al., 2013; Klerk et al., 2015). Significant dependence between high sea levels and high river discharge are found for more than half of the available station observations, which are mostly located around the coasts of North America, Europe, Australia, and Japan (Ward et al., 2018). Combining global river discharge with a global storm surge model, hotspots of compound flooding have been discovered that are not well covered by observations in some regions, including Madagascar, Northern Morocco, Vietnam, and Taiwan of China (Couasnon et al., 2020). In the Dutch Noorderzijlvest area, there is more than a two-fold increase in the frequency of exceeding the highest warning level compared to the case if storm surge and heavy precipitation were independent (van den Hurk et al., 2015). In other regions and seasons, the dependence can be insignificant (W. Wu et al., 2018) and there can be significant seasonal and regional differences in the storm surge–heavy precipitation relationship. Assessments of flood probabilities are often not based on actual flood measurements; instead, they are estimated from its main drivers, including astronomical tides, storm surge, heavy precipitation, and high streamflow. Such single driver analyses might underestimate flood probabilities if multiple correlated drivers contribute to flood occurrence (e.g., van den Hurk et al., 2015).
Many coastal areas are also prone to the occurrence of compound precipitation and wind extremes, which can cause damage, including to infrastructure and natural environments. A high percentage of co-occurring wind and precipitation extremes are found in coastal regions and in areas with frequent tropical cyclones. Finally, the combination of extreme wave height and duration is also shown to influence coastal erosion processes (Corbella and Stretch, 2012).
Aspects of concurrent extremes in coastal and estuarine environments have increased in frequency and/or magnitude over the last century in some regions. These include an increase in the dependence between heavy precipitation and storm surge over the last century, leading to more frequent co-occurring storm surge and heavy precipitation events in the present day along USA coastlines (Wahl et al., 2015). In Europe, the probability of compound flooding occurrence increases most strongly along the Atlantic coast and the North Sea under strong warming. This increase is mostly driven by an intensification of precipitation extremes and aggravated flooding probability due to sea level rise (Bevacqua et al., 2019). At the global scale and under a high-emissions scenario, the concurrence probability of meteorological conditions driving compound flooding would increase by more than 25%, on average, along coastlines worldwide by 2100, compared to the present (Bevacqua et al., 2020c). Sea level extremes and their physical impacts in the coastal zone arise from a complex set of atmospheric, oceanic, and terrestrial processes that interact on a range of spatial and temporal scales and will be modified by a changing climate, including sea level rise (McInnes et al., 2016). Interactions between sea level rise and storm surges (Little et al., 2015), and sea level and fluvial flooding (Moftakhari et al., 2017) are projected to lead to more frequent and intense compound coastal flooding events as sea levels continue to rise.
In summary, there is medium confidence that, over the last century, the probability of compound flooding has increased in some locations, including along the USA coastline. There is high confidence that the occurrence and magnitude of compound flooding in coastal regions will increase in the future due to both sea level rise and increases in heavy precipitation.
11.8.3 Concurrent Droughts and Heatwaves
Concurrent droughts and heatwaves have a number of negative impacts on human society and natural ecosystems. Studies since SREX and AR5 show several occurrences of observed combinations of drought and heatwaves in various regions.
Over most land regions, temperature and precipitation are strongly negatively correlated during summer (Zscheischler and Seneviratne, 2017), mostly due to land–atmosphere feedbacks (Sections 11.1.6 and 11.3.2), but also because synoptic-scale weather systems favourable for extreme heat are also unfavourable for rain (Berg et al., 2015). This leads to a strong correlation between droughts and heatwaves (Zscheischler and Seneviratne, 2017). Drought events characterized by low precipitation and extreme high temperatures have occurred, for example, in California (AghaKouchak et al., 2014), inland Eastern Australia (King et al., 2014), and large parts of Europe (Orth et al., 2016a). The 2018 growing season was both record-breaking dry and hot in Germany (Zscheischler and Fischer, 2020).
The probability of co-occurring meteorological droughts and heatwaves has increased in the observational period in many regions and will continue to do so under unabated warming (Herrera-Estrada and Sheffield, 2017; Zscheischler and Seneviratne, 2017; Hao et al., 2018; Sarhadi et al., 2018; Alizadeh et al., 2020; Wu et al., 2021). Overall, projections of increases in co-occurring drought and heatwaves are reported in northern Eurasia (Schubert et al., 2014), Europe (Orth et al., 2016a; Sedlmeier et al., 2018), south-east Australia (Kirono et al., 2017), multiple regions of the USA (Diffenbaugh et al., 2015; Herrera-Estrada and Sheffield, 2017), north-west China (X. Li et al., 2019; Kong et al., 2020) and India (Sharma and Mujumdar, 2017). The dominant signal is related to the increase in heatwave occurrence, which has been attributed to anthropogenic forcing (Section 11.3.4). This means that, even if drought occurrence is unaffected, compound hot and dry events will be more frequent (Sarhadi et al., 2018; Yu and Zhai, 2020).
Drought and heatwaves are also associated with fire weather, related through high temperatures, low soil moisture, and low humidity. Fire weather refers to weather conditions conducive to triggering and sustaining wildfires, which generally include temperature, soil moisture, humidity, and wind (Chapter 12). Concurrent hot and dry conditions amplify conditions that promote wildfires (Schubert et al., 2014; Littell et al., 2016; Dowdy, 2018; Hope et al., 2019). Burnt area extent in western USA forests (Abatzoglou and Williams, 2016) and particularly in California (Williams et al., 2019) has been linked to anthropogenic climate change via a significant increase in vapour pressure deficit, a primary driver of wildfires. A study of the western USA examined the correlation between historical water-balance deficits and annual area burned, across a range of vegetation types, from temperate rainforest to desert (McKenzie and Littell, 2017). The relationship between temperature and dryness, and wildfire, varied with ecosystem type, and the fire–climate relationship was nonstationary and vegetation-dependent. In many fire-prone regions, such as the Mediterranean and China’s Daxing’anling region, projections for increased severity of future drought and heatwaves may lead to an increased frequency of wildfires relative to observed climatology (Tian et al., 2017; Ruffault et al., 2018). Observations show a long-term trend towards more dangerous weather conditions for bushfires in many regions of Australia, which is attributable (at least in part) to anthropogenic climate change (Dowdy, 2018). There is emerging evidence that recent regional surges in wildland fires are being driven by changing weather extremes (Cross-Chapter Box 3; Jia et al., 2019; SRCCL Chapter 2). Between 1979 and 2013, the global burnable area affected by long fire weather seasons doubled, and the mean length of the fire weather season increased by 19% (Jolly et al., 2015). However, at the global scale, the total burned area has been decreasing between 1998 and 2015 due to human activities mostly related to changes in land use (Andela et al., 2017). Given the projected high confidence increase in compound hot and dry conditions, there is high confidence that fire weather conditions will become more frequent at higher levels of global warming in some regions. This assessment is also consistent with Chapter 12’s examination of regional projected changes in fire weather. The SRCCL (Chapter 2) assessed with high confidence that future climate variability is expected to enhance the risk and severity of wildfires in many biomes such as tropical rainforests.
In summary, there is high confidence that concurrent heatwaves and droughts have increased in frequency over the last century at the global scale due to human influence. There is medium confidence that weather conditions that promote wildfires (fire weather) have become more probable in southern Europe, northern Eurasia, the USA, and Australia over the last century. There is high confidence that compound hot and dry conditions become more probable in nearly all land regions as global mean temperature increases. There is high confidence that fire weather conditions will become more frequent at higher levels of global warming in some regions.
Box 11.4 | Case Study: Global-scale Concurrent Climate Anomalies – the 2015–2016 Extreme El Niño and 2018 Boreal Spring–Summer
Occurrence of concurrent or near-concurrent extremes in different parts of a region, or in different locations around the world, challenges adaptation and risk management capacity. This can occur as a result of natural climate variability, as climates in different parts of the world are interconnected through large-scale atmospheric–oceanic teleconnections. In addition, in a warming climate, the probability of having several locations being affected simultaneously by, for example, hot extremes and heatwaves increases strongly as a function of global warming, with detectable changes even for changes as small as +0.5°C of additional global warming (Sections 11.2.4 and 11.3, Cross-chapter Box 11.1). Recent articles have highlighted the risks associated with concurrent extremes over large spatial scales (e.g., Lehner and Stocker, 2015; Boers et al., 2019; Gaupp et al., 2019). There is evidence that such global-scale extremes associated with hot temperature extremes are increasing in occurrence (Sippel et al., 2015; Vogel et al., 2019). Hereafter, the focus is on two case studies of recent global-scale events that featured concurrent extremes in several regions across the world. The first focuses on concurrent extremes driven by variability in tropical Pacific sea surface temperatures (SSTs) associated with the 2015–2016 extreme El Niño, while the second addresses the impacts of global warming combined with abnormal atmospheric circulation patterns in the 2018 boreal spring/summer.

Box 11.4, Figure 1 | | Analysis of the percentage of land area affected by temperature extremes larger than two (blue) or three (orange) standard deviations in June–July–August (JJA) between 30°N and 80°N using a normalization. This figure shows a substantial increase in the overall land area affected by very strong hot extremes since 1990. Adapted from Sippel et al. (2015).
The extreme El Niño in 2015–2016
El Niño–Southern Oscillation (ENSO) is one of the phenomena that have the ability to bring multitudes of extremes in different parts of the world, especially in extreme El Niño (Annex IV.2.3) cases. Additionally, the background climate warming associated with greenhouse gas forcing can significantly exacerbate extremes in parts of the world, even under normal El Niño conditions. The 2015–2016 extreme El Niño event was one of the three extreme El Niño events since the 1980s and the availability of satellite rainfall observations. According to some measures, it was the strongest El Niño in the past 145 years (Barnard et al., 2017). The 2015–2016 warmth was unprecedented at the central equatorial Pacific (Niño4: 5°N–5°S, 150°E–150°W), and this exceptional warmth was unlikely to have occurred entirely naturally, appearing to reflect an anthropogenically forced trend (Newman et al., 2018). In particular, its signal was seen in very high monthly global mean surface temperature (GMST) values in late 2015 and early 2016, contributing to the highest record of GMST in 2016 (Section 2.3.1.1). Both the ENSO amplitude and the frequency of high-magnitude events since 1950 is higher than over the pre-industrial period (medium confidence) (Section 2.4.2), suggesting that global extremes similar to those associated with the 2015–2016 extreme El Niño would occur more frequently under further increases in global warming. A brief summary of extreme events that happened in 2015–2016 is provided in Sections 6.2.2 and 6.5.1.1 of the Special Report on the Ocean and Cryosphere in a Changing Climate (SROCC). We provide some highlights illustrating extremes that occurred in different parts of the world during the 2015–2016 extreme El Niño in Box 11.4, Table 1, as well as in the short summary that follows.
Box 11.4, Table 1 | List of events related to the 2015–2016 Extreme El Niño in the literature.
Region | Period | Events | References |
Indonesia | July 2015 to June 2016 | Droughts, forest fire | Field et al. (2016); Huijnen et al. (2016); Patra et al. (2017); Hartmann et al. (2018) |
Northern Australia | Between late 2015 and early 2016 | High temperature and drought | |
Amazon | September 2015 to May 2016 | Droughts, forest fire | Jiménez-Muñoz et al. (2016); Erfanian et al. (2017); Aragão et al. (2018); Panisset et al. (2018); Ribeiro et al. (2018) |
The entirety of South America north of 20°S | Austral spring and 2015–2016 summer | Droughts | |
Ethiopia | February-September 2015 | Droughts | |
Southern Africa | November 2015–April 2016 | Droughts | Funk et al. (2016, 2018a); Blamey et al. (2018); Yuan et al. (2018a) |
Europe | Boreal 2015–2016 winter | Effects on circulation patterns | |
India | May 2016 | High temperature | |
India | December 2015 | Extreme rainfall | |
China | June–July 2016 | Extreme rainfall | Sun and Miao (2018); Yuan et al. (2018b); Zhou et al. (2018) |
Western North Pacific | Boreal summer 2015 | The large number (13) of Category 4 and 5 tropical cyclones | Blunden and Arndt (2016); B. Mueller et al. (2016); W. Zhang et al. (2016a) ; Hong et al., (2018); Yamada et al. (2019) |
Eastern North Pacific | Boreal summer 2015 | A record-breaking number of tropical cyclones | |
Global | 2015–2016 El Niño | High CO2 release to the atmosphere associated with droughts and fires in several affected regions |
Several regions were strongly affected by droughts in 2015, including Indonesia, Australia, the Amazon region, Ethiopia, southern Africa, and Europe. As a result, global measurements of land water anomalies were particularly low in that year (Humphrey et al., 2018). In 2015, Indonesia experienced a severe drought and forest fire, causing pronounced impact on economy, ecology and human health due to haze crisis(Fieldet al. , 2016; Huijnenet al. , 2016; Patraet al. , 2017; Hartmannet al. , 2018). The northern part of Australia experienced high temperatures and low precipitation between late 2015 and early 2016, and the extensive mangrove trees were damaged along the Gulf of Carpentaria in Northern Australia (Duke et al., 2017). The Amazon region experienced the most intense droughts of this century in 2015–2016. This drought was more severe than the previous major droughts that occurred in the Amazon in 2005 and 2010 (Lewis et al., 2011; Erfanian et al., 2017; Panisset et al., 2018). The 2015–2016 Amazon drought impacted the entirety of South America north of 20°S during the austral spring and summer (Erfanian et al., 2017). It also increased forest fire incidence by 36% compared to the preceding 12 years (Aragão et al., 2018) and, as a consequence, increased the biomass burning outbreaks and the carbon monoxide (CO) concentration in the area, affecting air quality (Ribeiro et al., 2018). This out-of-season drought affected the water availability for human consumption and agricultural irrigation. It also left rivers with very low water levels and large sandbanks, preventing ship transportation of food, medicines, and fuels (INMET, 2017). Eastern African countries were impacted by drought in 2015. The drought in Ethiopia was the worst in several decades and was associated with the 2015–2016 extreme El Niño (Blunden and Arndt, 2016; Philip et al., 2018b). It was suggested that anthropogenic warming contributed to the 2015 Ethiopian and southern African droughts by increasing SSTs and local air temperatures (Funk et al., 2016, 2018b; Yuan et al., 2018a). It has also been suggested that the 2015–2016 extreme El Niño affected circulation patterns in Europe during the 2015–2016 winter (Geng et al., 2017; Scaife et al., 2017).
The atmospheric CO2 growth rate was particularly high in 2015, possibly related to some of the mentioned droughts, in particular in Indonesia and the Amazon region, leading to higher CO2 release in combination with less CO2 uptake from land areas (Humphrey et al., 2018). The impact of the 2015–2016 extreme El Niño on vegetation systems via drought was also shown from satellite data (Kogan and Guo, 2017). Overall, tropical forests were a carbon source to the atmosphere during the 2015–2016 El Niño-related drought, with some estimates suggesting that up to 2.3 PgC were released (Brando et al., 2019).
The 2015–2016 extreme El Niño has induced extreme precipitation in some regions. Severe rainfall events were observed in Chennai city in India in Devember 2015, and the Yangtze river region in China in June–July 2016, and it was shown that these rainfall events are partly attributed to the 2015–2016 extreme El Niño(van Oldenborghet al. , 2016; Boyajet al. , 2018; Sun and Miao, 2018; Yuanet al. , 2018b; Zhouet al., 2018).
In 2015, tropical cyclone activity was notably high in the North Pacific (Blunden and Arndt, 2016). Over the western North Pacific, there were 13 Category 4 and 5 tropical cyclones (TCs), more than twice the area’s typical annual value of 6.3 (W. Zhang et al., 2016b). Similarly, a record-breaking number of TCs were observed in the eastern North Pacific, particularly in the western part of that domain (Collins et al., 2016; Murakami et al., 2017b). These extraordinary TC activities were related to the average SST anomaly during that year, which were associated with the 2015–2016 extreme El Niño and the positive phase of the Pacific Meridional Mode (Murakami et al., 2017b; Hong et al., 2018; Yamada et al., 2019). However, it has been suggested that the intense TC activities in both the western and the eastern North Pacific in 2015 were not only due to the El Niño, but also to a contribution of anthropogenic forcing (Murakami et al., 2017b; S.-H. Yang et al., 2018). The impact of the Indian Ocean SST was also suggested to contribute to the extreme TC activity in the western North Pacific in 2015 (Zhan et al., 2018). In contrast, in Australia, it was the least active TC season since satellite records began in 1969–1970 (Blunden and Arndt, 2017).
Global-scale temperature extremes and concurrent precipitation extremes in boreal 2018 spring and summer
In the 2018 boreal spring–summer season (May–August), wide areas of the mid-latitudes in the Northern Hemisphere experienced heat extremes and (in part) enhanced drought(Box 11.4, Figure 2; Kornhuberet al. , 2019; Vogelet al. , 2019). The reported impacts included(Vogel et al., 2019): 90 deaths from heat strokes in Quebec (Canada); 1469 deaths from heat strokes in Japan (Shimpo et al., 2019); 48 heat-related deaths in the Republic of Korea (Min et al., 2020); heat warnings affecting 90,000 students in the USA; fires in numerous countries (Canada (British Columbia), USA (California), Finland (Lapland), Latvia); crop losses in the UK, Germany and Switzerland (Vogel et al., 2019) and overall in central and Northern Europe (leading to yield reductions of up to 50% for the main crops (Toreti et al., 2019); fish deaths in Switzerland; and melting of roads in the Netherlands and the UK, among others. In addition to the numerous hot and dry extremes, an extremely heavy rainfall event occurred over wide areas of Japan from 28 June to 8 July 2018 (Tsuguti et al., 2018), which was followed by a heatwave (Shimpo et al., 2019). The heavy precipitation event caused more than 230 deaths in Japan, and was named ‘the Heavy Rain Event of July 2018’.
The heavy precipitation event was characterized by unusually widespread and persistent rainfall and locally anomalous total precipitation led by band-shaped precipitation systems, which are frequently associated with heavy precipitation events in East Asia (Section 11.7.3; Kato, 2020). The extreme rainfall in Japan was caused by anomalous moisture transport with a combination of abnormal jet condition (Takemi and Unuma, 2019; Takemura et al., 2019; Tsuji et al., 2020; Yokoyama et al., 2020), which can be viewed as an atmospheric river (Sections 8.2.2.8 and 11.7.2; Yatagai et al., 2019) caused by intensified inflow velocity and high SST around Japan (Sekizawa et al., 2019; Kawase et al., 2020).
This precipitation event and the subsequent heatwave are related to abnormal condition of the jet stream and North Pacific Subtropical High in this month (Shimpo et al., 2019; Ren et al., 2020), which caused extreme conditions from Europe, Eurasia, and North America (Box 11.4, Figure 2; Kornhuber et al., 2019). A combination of the positive anomaly of the North Atlantic Oscillation (NAO, Annex IV.2.1) and the meandering jets is necessary to explain the pattern of the observed anomalies (Drouard et al. , 2019). A role of Atlantic SST anomaly on the meandering jets and the subtropical high have been suggested (B. Liu et al., 2019). These dynamic and thermodynamic components generally have substantial influence on extreme rainfall in East Asia (Oh et al., 2018), but it is under investigation whether these factors were due to anthropogenic forcing.
Regarding the hot extremes that occurred across the Northern Hemisphere in the 2018 boreal May–July period, Vogel et al. (2019) found that the event was unprecedented in terms of the total area affected by hot extremes (on average, about 22% of populated and agricultural areas in the Northern Hemisphere) for that period, but was consistent with a +1°C climate which was the estimated global mean temperature anomaly around that time (for 2017; SR1.5). This study also found that events similar to the 2018 May–July temperature extremes would approximately occur two out of three years under +1.5°C of global warming, and every year under +2°C of global warming. Imada et al. (2019) also suggest that the mean annual occurrence of extreme hot days in Japan will be expected to increase by 1.8 times under a global warming level of 2°C above pre-industrial levels. Kawase et al. (2020) showed that the extreme rainfall in Japan during this event was increased by approximately 7% due to recent rapid warming around Japan. Imada et al. (2020) showed that the probability of the Heavy Rain Event of July 2018 in Japan was increased from 0.22% to 2.00% due to anthropogenic warming. Hence, it is virtually certain that these 2018 concurrent events would not have occurred without human-induced global warming. Concurrent events of this type are also projected to happen more frequently under higher levels of global warming. However, there is currentlylow confidence in projected changes in the frequency or strength of the anomalous circulation patterns leading to concurrent extremes (e.g., Cross-Chapter Box 10.1).
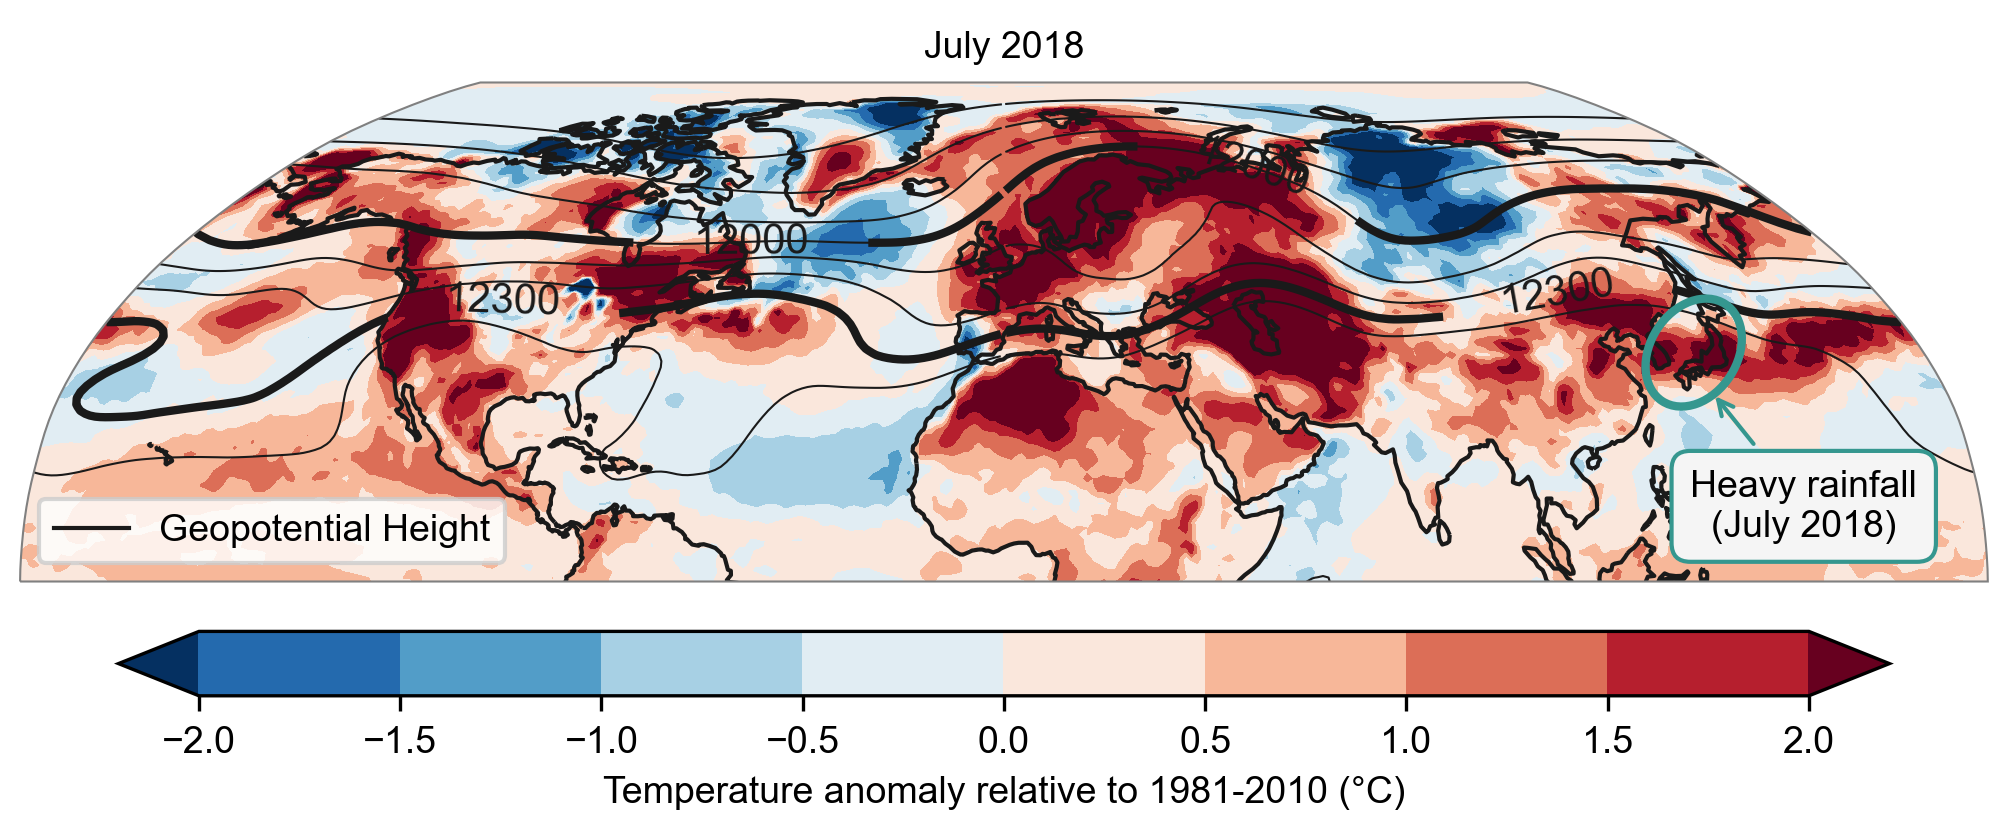
Box 11.4, Figure 2 | Meteorological conditions in July 2018. The colour shading shows the monthly mean near-surface air temperature anomaly with respect to 1981–2010. Contour lines indicate the geopotential height in m, highlighted are the isolines on 12,000 m and 12,300 m, which indicate the approximate positions of the polar-front jet and subtropical jet, respectively. The light blue-green ellipse shows the approximate extent of the strong precipitation event that occurred at the beginning of July in the region of Japan and Korea. All data is from the global European Centre for Medium-Range Weather Forecasts (ECMWF) Reanalysis v5 (ERA5, Hersbach et al., 2020).
The case studies presented in this Box illustrate the current state of knowledge regarding the contribution of human-induced climate change to recent concurrent extremes in the global domain. Recent years have seen a more frequent occurrence of such events. The heatwave in Europe in the 2019 boreal summer and its coverage in the global domain is an additional example (Vautard et al., 2020). However, very few studies investigate which types of concurrent extreme events could occur under increasing global warming. It has been noted that such events could also be of particular risk for concurrent impacts in the world’s breadbaskets (Zampieri et al., 2017; Kornhuber et al., 2020; see also Section 11.8.1).
In summary, the 2015–2016 extreme El Niño and the 2018 boreal spring/summer extremes were two examples of recent concurrent extremes. The El Niño event in 2015–2016 was one of the three extreme El Niño events since the 1980s, and there are many extreme events concurrently observed in this period including droughts, heavy precipitation, and more frequent intense tropical cyclones. Both the ENSO amplitude and the frequency of high-magnitude events since 1950 is higher than over the pre-industrial period (medium confidence), suggesting that global extremes similar to those associated with the 2015–2016 extreme El Niño would occur more frequently under further increases in global warming. The 2018 boreal spring/summer extremes were characterized by heat extremes and enhanced droughts in wide areas of the mid-latitudes in the Northern Hemisphere and extremely heavy rainfall in East Asia. These concurrent events were generally related to the abnormal condition of the jet and North Pacific Subtropical High, but also amplified by background global warming. It is virtually certain that these 2018 concurrent extreme events would not have occurred without human-induced global warming. Recent years have seen a more frequent occurrence of such concurrent events. However, it is still unknown which types of concurrent extreme events could occur under increasing global warming.
11.9 Regional Information on Extremes
This section complements the assessments of changes in temperature extremes (Section 11.3), heavy precipitation (Section 11.4), and droughts (Section 11.6), by providing additional regional details. Regional changes in floods are assessed in Chapter 12. Owing to the large number of regions and space limitations, the regional assessment for each of the AR6 reference regions (see Section 1.5.2.2 for a description) is presented here in a set of tables. The tables are organized according to types of extremes (temperature, heavy precipitation, droughts) for Africa (Tables 11.4–11.6), Asia (Tables 11.7–11.9), Australasia (Tables 11.10–11.12), Central and South America (Tables 11.13–11.15), Europe (Tables 11.16–11.18), and North America (Tables 11.19–11.21). Each table contains regional assessments for observed changes, the human contribution to the observed changes, and projections of changes in these extremes at 1.5°C, 2°C and 4°C of global warming. A synthesis of regional changes in hot extremes, heavy precipitation, agricultural and ecological droughts, and hydrological droughts can be found in the Chapter 11 Appendix in Table 11.A.2.
11.9.1 Overview
Sections 11.9.2, 11.9.3 and 11.9.4 provide brief summaries of the underlying evidence used to derive the regional assessments for temperature extremes, heavy precipitation events, and droughts, respectively. The assessments take into account evidence from studies based on global datasets (global studies), as well as regional studies. Global studies include analyses for all continents and AR6 regions with sufficient data coverage, and provide an important basis for cross-region consistency, as the same data and methods are used for all regions. However, individual regional studies may include additional information that is missed in global studies, and thus provide an important regional calibration for the assessment.
The assessments are presented using the calibrated confidence and likelihood language (Box 1.1). Low confidence is assessed when there is limited evidence, either because of a lack of available data in the region and/or a lack of relevant studies. Low confidence is also assessed when there is a lack of agreement on the evidence of a change, which may be due to large variability or inconsistent changes depending on the considered sub-regions, time frame, models, assessed metrics, or studies. In cases when the evidence is strongly contradictory, for example, with substantial regional changes of opposite sign, ‘mixed signal’ is indicated. With an assessment of low confidence, the direction of change is not indicated in the tables. A direction of change (increase or decrease) is provided with an assessment of medium confidence, high confidence, likely , or higher likelihood levels. Likelihood assessments are only provided in the case of high confidence. In some cases, there may be confidence in a small or no change.
For projections, changes are assessed at three global warming levels (GWLs; Cross-Chapter Box 11.1): 1.5°C, 2°C and 4°C. The assessments use literature based both on GWL projections and scenario-based projections. In the case of literature on scenario-based projections, a mapping between scenarios/time frames and GWLs was performed, as documented in Cross-Chapter Box 11.1. Projections of changes in temperature and precipitation extremes are assessed relative to two different baselines: the recent past (1995–2014) and pre-industrial (1850–1900). With smaller changes relative to the variability, in particular because droughts happen on longer timescales compared to extremes of daily temperature and precipitation, it is more difficult to distinguish changes in drought relative to the recent past. As such, changes in droughts are assessed relative to the pre-industrial baseline, unless indicated otherwise.
11.9.2 Temperature Extremes
Tables 11.4, 11.7, 11.10, 11.13, 11.16, and 11.19 include assessments for past temperature extremes and their attribution, as well as future projections. The evidence is mostly drawn from changes in metrics based on daily maximum and minimum temperatures, similar to those used in Section 11.3. The regional assessments start from global studies that used consistent analyses for all regions globally with sufficient data. This includes Dunn et al. (2020) for observed changes, and Li et al. (2021) and the Chapter 11 Supplementary Material (11.SM) for projections with the CMIP6 multi-model ensemble. Evidence from regional studies, and those based on the CMIP5 multi-model ensemble or CORDEX simulations, are then used to refine the confidence assessments. For attribution, Seong et al. (2020) provide a consistent analysis for AR6 regions, and Z. Wang et al. (2017a) for SREX regions. Additional regional studies, including event attribution analyses (Section 11.2), are used when available. In some regions that were not analysed in Seong et al. (2020), and those with no known event attribution studies, medium confidence of a human contribution is assessed: when there is strong evidence of changes from observations that are in the direction of model-projected changes for the future; when the magnitude of projected changes increases with global warming; and where there is no other evidence to the contrary. This assessment is further supported by an understanding of how temperature extremes change with the mean temperature and overwhelming evidence of a human contribution to the observed larger-scale changes in the mean temperature and temperature extremes.
11.9.3 Heavy Precipitation
Tables 11.5, 11.8, 11.11, 11.14, 11.17, and 11.20 include assessments for past changes in heavy precipitation events and their attribution, as well as future projections. The evidence is mostly drawn from changes in metrics based on one-day or five-day precipitation amounts, as addressed in Section 11.4. Similar to temperature extremes, the assessment of changes in heavy precipitation uses global studies, including Dunn et al. (2020) and Sun et al. (2021) for observed changes, and Li et al. (2021) and the Chapter 11 Supplementary Material (11.SM) for projected changes using the CMIP6 multi-model ensemble. For attribution, Paik et al. (2020) provided continental analyses where data coverage was sufficient, but no attribution studies based on global data are available for the regional scale. For each region, regional studies, and studies based on the CMIP5 multi-model ensemble or CORDEX simulations, are also considered in the assessments for past changes, attribution, and projections.
11.9.4 Droughts
Tables 11.6, 11.9, 11.12, 11.15, 11.18, and 11.21 provide regional assessments on past, attributed and projected changes in droughts. The assessment is subdivided in three drought categories corresponding to four drought types: i) meteorological droughts, ii) agricultural and ecological droughts, and iii) hydrological droughts (see Section 11.6). A list of metrics and global studies used for the assessments is provided below. The evidence from global studies is complemented in each continent with evidence from regional studies. An overview of studies considered for the assessments in projections is provided in Table 11.3.
Meteorological droughts are assessed based on observed and projected changes in precipitation-only metrics such as the Standardized Precipitation Index (SPI) and Consecutive Dry Days (CDD). Observed changes are assessed based on two global studies, Dunn et al. (2020) for CDD, and Spinoni et al. (2019) for SPI. For projections, evidence for changes at 1.5°C and 2°C of global warming is drawn from L. Xu et al. (2019) and Touma et al. (2015) (based on RCP8.5 for 2010–2054 compared to 1961–2005) for SPI (CMIP5) and the Chapter 11 Supplementary Material (11.SM) for CDD (CMIP6). For projections at 4°C of global warming, evidence is drawn from several sources, including Touma et al. (2015) and Spinoni et al. (2020) for SPI (from CMIP5 and CORDEX, respectively), and 11.SM for CDD (CMIP6). No global-scale studies are available for the attribution of meteorological drought, so this assessment is based on regional detection and attribution or event attribution studies.
Agricultural and ecological droughts are primarily assessed based on observed and projected changes in total column soil moisture, complemented by evidence on changes in surface soil moisture, water-balance (precipitation minus evapotranspiration (ET)) and metrics driven by precipitation and atmospheric evaporative demand (AED) such as the SPEI and PDSI (Section 11.6). In the latter, only studies including estimates based on the Penman–Monteith equation (SPEI-PM and PDSI-PM) are considered because of biases associated with temperature-only approaches (Section 11.6). Medium to high confidence in drying was assigned in the assessment for arid regions if a signal was also identifiable in total soil moisture in addition to surface soil moisture or metrics that combine AED and precipitation, which tend to dry more in these regions. For observed changes, evidence is drawn from several sources: Padrón et al. (2020) for changes in precipitation minus ET, as well as soil moisture from the multi-model Land Surface Snow and Soil Moisture Model Intercomparison Project within CMIP6 (11.SM; van Den Hurk et al., 2016); Greve et al. (2014) for changes in precipitation minus ET, and precipitation minus AED; Spinoni et al. (2019) for changes in SPEI-PM; and Dai and Zhao (2017) for changes in PDSI-PM.
Reference | Model Dataa | Indexa | Drought Type | Projection Horizons | Baseline |
11.SM | CMIP6 | CDD, Soil moisture (total, surface) | MET | 1.5°C, 2°C, 4°C | 1850–1900 |
CMIP6 | Soil moisture (total, surface), runoff (total, surface) | AGR/ECOL, HYDR | 2071–2011, SSP1-2.6 (about 2°C, Cross-Chapter Box 11.1; Table 4.2) 2071–2011, SSP3-7-3 (about 4°C, Cross-Chapter Box 11.1; Table 4.2) | 1850–1900 | |
CMIP5 | SPI, soil moisture (total, surface) | MET, AGR/ECOL | 1.5°C, 2°C | 1971–2000 | |
CMIP5 | SPI, SRI | MET, HYDR | 2010–2054, RCP8.5 (about 1.5°C; Cross-Chapter Box 11.1 and 11.SM.1) 2055–2099, RCP8.5 (about 3.5°C, Cross-Chapter Box 11.1 and 11.SM.1) | 1961–2005 | |
CORDEX (CMIP5 driving GCMs, RCMs) | SPI | MET | 2071–2100, RCP4.5 (about 2.5°C, Cross-Chapter Box 11.1 and 11.SM.1) 2071–2100, RCP8.5 (about 4.5°C, Cross-Chapter Box 11.1 and 11.SM.1) | 1981–2010 | |
One GCM (EC-EARTH3-HR v3.1) driven with SST fields from seven CMIP5 GCMs | SPEI-PM | AGR/ECOL | 1.5°C, 2°C, (3°C) | 0.6°C | |
CMIP5 | SPEI-PM | AGR/ECOL | 2070–2100, RCP8.5 (about 4.5°C, Cross-Chapter Box 11.1 and 11.SM.1) | 1970–2000 | |
ISI-MIP (six GHMs and five CMIP5 GCMs) | Low-flows days | HYDR | 2066–2099, RCP8-5 (about 4°C, Cross-Chapter Box 11.1 and 11.SM.1) | 1972–2005 | |
One GHM (VIC) driven by four CMIP5 GCMs | Extreme low runoff | HYDR | 1.5°C, 2°C | 2006–2015 |
aCMIP5 and CMIP6: Coupled Model Intercomparison Project Phases 5/6; CORDEX: Coordinated Regional Downscaling Experiment; GCMs: global climate models; RCMs: regional climate models; SST: sea surface temperatures; ISI-MIP: Inter-Sectoral Impact Model Intercomparison Project; GHMs: Global Hydrological Models; CDD: consecutive dry days index; SPI: Standardized Precipitation Index; SRI: Standardized Runoff Index; SPEI-PM: Penman–Monteith-based Standardized Precipitation Evapotranspiration Index.
For projections at 1.5°C of global warming, evidence is drawn from: L. Xu et al. (2019), based on CMIP5; 11.SM based on CMIP6 for changes in total column and surface soil moisture; and from Naumann et al. (2018) for changes in SPEI-PM, based on EC-Earth simulations driven with SSTs from seven CMIP5 Earth system models. For projections at 2°C of global warming, evidence is drawn from L. Xu et al. (2019) based on CMIP5, and Cook et al. (2020) (SSP1-2.6, 2071–2100 compared to pre-industrial) and the Chapter 11 Supplementary Material (11.SM) based on CMIP6, for changes in total column and surface soil moisture; evidence is also drawn from Naumann et al. (2018) for changes in SPEI-PM. For projections at 4°C of global warming, evidence is mostly drawn from: Cook et al. (2020) (SSP3-7.0, 2071–2100) and the Chapter 11 Supplementary Material (11.SM) based on CMIP6 for changes in total column and surface soil moisture; and from Vicente-Serrano et al. (2020c) for changes in SPEI-PM based on CMIP5. No global-scale studies with regional-scale information are available for the attribution of agricultural and ecological droughts, so this assessment is based on regional detection and attribution or event attribution studies.
Hydrological droughts are assessed based on observed and projected changes in low flows, complemented by information on changes in mean runoff. For observed changes, evidence is drawn from three studies (Dai and Zhao, 2017; Gudmundsson et al., 2019, 2021). For projected changes at 1.5°C of global warming, evidence is drawn from Touma et al. (2015) based on analyses of the Standardized Runoff Index (SRI) (CMIP5, based on 2010–2054 compared to 1961–2005), complemented with regional studies when available. For projected changes at 2°C of global warming, evidence is also drawn from Cook et al. (2020) for changes in runoff in CMIP6 (Scenario SSP1-2.6, 2071–2100), and from J. Zhai et al. (2020) for changes in low flows based on simulations with a single model. For projected changes at 4°C of global warming, evidence is drawn from: Touma et al. (2015) based on CMIP5 analyses of SRI; Cook et al. (2020) for changes in surface and total runoff based on CMIP6; and Giuntoli et al. (2015) for changes in low flows based on the Inter-Sectoral Impact Model Intercomparison Project (ISI-MIP) based on six Global Hydrological Models (GHMs) and five GCMs, including an analysis of inter-model signal-to-noise ratio. One global-scale study with regional-scale information is available for the attribution of hydrological droughts (Gudmundsson et al., 2021), but only in a few AR6 regions. This information was complemented with evidence from regional detection and attribution, and event attribution studies when available.
Acknowledgements
Alexis Berg, Tim Brodribb, Jamie Hannaford, Nate McDowell, Jack Scheff, Peter Stott, Lena Tallaksen, Peter Thorne, Francis Zwiers.
Frequently Asked Questions
FAQ 11.1 | How Do Changes In Climate Extremes Compare With Changes In Climate Averages?
Human-caused climate change alters the frequency and intensity of climate variables (e.g., surface temperature) and phenomena (e.g., tropical cyclones) in a variety of ways. We now know that the ways in which average and extreme conditions have changed (and will continue to change) depend on the variable and the phenomenon being considered. Changes in local surface temperature extremes closely follow the corresponding changes in local average surface temperatures. On the contrary, changes in precipitation extremes (heavy precipitation) generally do not follow those in average precipitation, and can even move in the opposite direction (e.g., with average precipitation decreasing but extreme precipitation increasing).
Climate change will manifest very differently depending on which region, season and variable we are interested in. For example, over some parts of the Arctic, temperatures will warm at rates about three to four times higher during winter compared to summer months. And in summer, most of northern Europe will experience larger temperatures increases than most places in south-east South America and Australasia, with differences that can be larger than 1°C, depending on the level of global warming. In general, differences across regions and seasons arise because the underlying physical processes differ drastically across regions and seasons.
Climate change will also manifest differently for different weather regimes and can lead to contrasting changes in average and extreme conditions. Observations of the recent past and climate model projections show that, in most places, changes in daily temperatures are dominated by a general warming where the climatological average and extreme values are shifted towards higher temperatures, making warm extremes more frequent and cold extremes less frequent. The top panels in FAQ 11.1, Figure 1 show projected changes in surface temperature for long-term average conditions (left) and for extreme hot days (right) during the warm season (summer in mid- to high latitudes). Projected increases in long-term average temperature differ substantially between different places, varying from less than 3°C in some places in central South Asia and southern South America to over 7°C in some places in North America, North Africa and the Middle East. Changes in extreme hot days follow changes in average conditions quite closely, although, in some places, the warming rates for extremes can be intensified (e.g., southern Europe and the Amazon basin) or weakened (e.g., northern Asia and Greenland) compared to average values.
Recent observations and global and regional climate model projections point to changes in precipitation extremes (including both rainfall and snowfall extremes) differing drastically from those in average precipitation. The bottom panels in FAQ 11.1, Figure 1 show projected changes in the long-term average precipitation (left) and in heavy precipitation (right). Averaged precipitation changes show striking regional differences, with substantial drying in places such as southern Europe and northern South America and wetting in places such as the Middle East and southern South America. Changes in extreme precipitation are much more uniform, with systematic increases over nearly all land regions. The physical reasons behind the different responses of averaged and extreme precipitation are now well understood. The intensification of extreme precipitation is driven by the increase in atmospheric water vapour (about 7% per 1°C of warming near the surface), although this is modulated by various dynamical changes. In contrast, changes in average precipitation are driven not only by moisture increases but also by slower processes that constrain future changes over the globe to only 2–3% per 1°C of warming near the surface.
In summary, the specific relationship between changes in average and extreme conditions strongly depends on the variable or phenomenon being considered. At the local scale, average and extreme surface temperature changes are strongly related, while average and extreme precipitation changes are often weakly related. For both variables, the changes in average and extreme conditions vary strongly across different places due to the effect of local and regional processes.

FAQ 11.1, Figure 1 | Global maps of future changes in surface temperature (top panels) and precipitation (bottom panels) for long-term average (left) and extreme conditions (right). All changes were estimated using the Coupled Model Intercomparison Project Phase 6 (CMIP6) ensemble median for a scenario with a global warming of 4°C relative to 1850–1900 temperatures. Average surface temperatures refer to the warmest three-month season (summer in mid- to high latitudes) and extreme temperatures refer to the hottest day in a year. Precipitation changes, which can include both rainfall and snowfall changes, are normalized by 1850–1900 values and shown as a percentage; extreme precipitation refers to the largest daily precipitation in a year.
FAQ 11.2 | Will Unprecedented Extremes Occur As a Result Of Human-InducedClimate Change?
Climate change has already increased the magnitude and frequency of extreme hot events and decreased the magnitude and frequency of extreme cold events, and, in some regions, intensified extreme precipitation events. As the climate moves away from its past and current states, we will experience extreme events that are unprecedented, either in magnitude, frequency, timing or location. The frequency of these unprecedented extreme events will rise with increasing global warming. Additionally, the combined occurrence of multiple unprecedented extremes may result in large and unprecedented impacts.
Human-induced climate change has already affected many aspects of the climate system. In addition to the increase in global surface temperature, many types of weather and climate extremes have changed. In most regions, the frequency and intensity of hot extremes have increased and those of cold extremes have decreased. The frequency and intensity of heavy precipitation events have increased at the global scale and over a majority of land regions. Although extreme events such as land and marine heatwaves, heavy precipitation, drought, tropical cyclones, and associated wildfires and coastal flooding have occurred in the past and will continue to occur in the future, they often come with different magnitudes or frequencies in a warmer world. For example, future heatwaves will last longer and have higher temperatures, and future extreme precipitation events will be more intense in several regions. Certain extremes, such as extreme cold, will be less intense and less frequent with increasing warming.
Unprecedented extremes – that is, events not experienced in the past – will occur in the future in five different ways (FAQ 11.2, Figure 1). First, events that are considered to be extreme in the current climate will occur in the future with unprecedented magnitudes. Second, future extreme events will also occur with unprecedented frequency. Third, certain types of extremes may occur in regions that have not previously encountered those types of events. For example, as the sea level rises, coastal flooding may occur in new locations, and wildfires are already occurring in areas, such as parts of the Arctic, where the probability of such events was previously low. Fourth, extreme events may also be unprecedented in their timing. For example, extremely hot temperatures may occur either earlier or later in the year than they have in the past.

FAQ 11.2, Figure 1 | New types of unprecedented extremes that will occur as a result of climate change.
Finally, compound events – where multiple extreme events of either different or similar types occur simultaneously and/or in succession – may be more probable or severe in the future. These compound events can often impact ecosystems and societies more strongly than when such events occur in isolation. For example, a drought along with extreme heat will increase the risk of wildfires and agriculture damages or losses. As individual extreme events become more severe as a result of climate change, the combined occurrence of these events will create unprecedented compound events. This could exacerbate the intensity and associated impacts of these extreme events.
Unprecedented extremes have already occurred in recent years, relative to the 20th century climate. Some recent extreme hot events would have had very little chance of occurring without human influence on the climate (see FAQ 11.3). In the future, unprecedented extremes will occur as the climate continues to warm. Those extremes will happen with larger magnitudes and at higher frequencies than previously experienced. Extreme events may also appear in new locations, at new times of the year, or as unprecedented compound events. Moreover, unprecedented events will become more frequent with higher levels of warming, for example at 3°C of global warming compared to 2°C of global warming.
FAQ 11.3 | Did Climate Change Cause That Recent Extreme Event In My Country?
While it is difficult to identify the exact causes of a particular extreme event, the relatively new science of event attribution is able to quantify the role of climate change in altering the probability and magnitude of some types of weather and climate extremes. There is strong evidence that characteristics of many individual extreme events have already changed because of human-driven changes to the climate system. Some types of highly impactful extreme weather events have occurred more often and have become more severe due to these human influences. As the climate continues to warm, the observed changes in the probability and/or magnitude of some extreme weather events will continue as the human influences on these events increase.
It is common to question whether human-caused climate change caused a major weather- and climate-related disaster. When extreme weather and climate events do occur, both exposure and vulnerability play an important role in determining the magnitude and impacts of the resulting disaster. As such, it is difficult to attribute a specific disaster directly to climate change. However, the relatively new science of event attribution enables scientists to attribute aspects of specific extreme weather and climate events to certain causes. Scientists cannot answer directly whether a particular event was caused by climate change, as extremes do occur naturally, and any specific weather and climate event is the result of a complex mix of human and natural factors. Instead, scientists quantify the relative importance of human and natural influences on the magnitude and/or probability of specific extreme weather events. Such information is important for disaster risk reduction planning, because improved knowledge about changes in the probability and magnitude of relevant extreme events enables better quantification of disaster risks.
On a case-by-case basis, scientists can now quantify the contribution of human influences to the magnitude and probability of many extreme events. This is done by estimating and comparing the probability or magnitude of the same type of event between the current climate – including the increases in greenhouse gas concentrations and other human influences – and an alternate world where the atmospheric greenhouse gases remained at pre-industrial levels. FAQ 11.3 Figure 1 illustrates this approach using differences in temperature and probability between the two scenarios as an example. Both the pre-industrial (blue) and current (red) climates experience hot extremes, but with different probabilities and magnitudes. Hot extremes of a given temperature have a higher probability of occurrence in the warmer current climate than in the cooler pre-industrial climate. Additionally, an extreme hot event of a particular probability will be warmer in the current climate than in the pre-industrial climate. Climate model simulations are often used to estimate the occurrence of a specific event in both climates. The change in the magnitude and/or probability of the extreme event in the current climate compared to the pre-industrial climate is attributed to the difference between the two scenarios, which is the human influence.

FAQ 11.3, Figure 1 | Changes in climate result in changes in the magnitude and probability of extremes. Example of how temperature extremes differ between a climate with pre-industrial greenhouse gases (shown in blue) and the current climate (shown in orange) for a representative region. The horizontal axis shows the range of extreme temperatures, while the vertical axis shows the annual chance of each temperature event’s occurrence. Moving towards the right indicates increasingly hotter extremes that are more rare (less probable). For hot extremes, an extreme event of a particular temperature in the pre-industrial climate would be more probable (vertical arrow) in the current climate. An event of a certain probability in the pre-industrial climate would be warmer (horizontal arrow) in the current climate. While the climate under greenhouse gases at the pre-industrial level experiences a range of hot extremes, such events are hotter and more frequent in the current climate.
Attributable increases in probability and magnitude have been identified consistently for many hot extremes. Attributable increases have also been found for some extreme precipitation events, including hurricane rainfall events, but these results can vary among events. In some cases, large natural variations in the climate system prevent attributing changes in the probability or magnitude of a specific extreme to human influence. Additionally, attribution of certain classes of extreme weather (e.g., tornadoes) is beyond current modelling and theoretical capabilities. As the climate continues to warm, larger changes in probability and magnitude are expected and, as a result, it will be possible to attribute future temperature and precipitation extremes in many locations to human influences. Attributable changes may emerge for other types of extremes as the warming signal increases.
In conclusion, human-caused global warming has resulted in changes in a wide variety of recent extreme weather events. Strong increases in probability and magnitude, attributable to human influence, have been found for many heatwaves and hot extremes around the world.
Large Tables
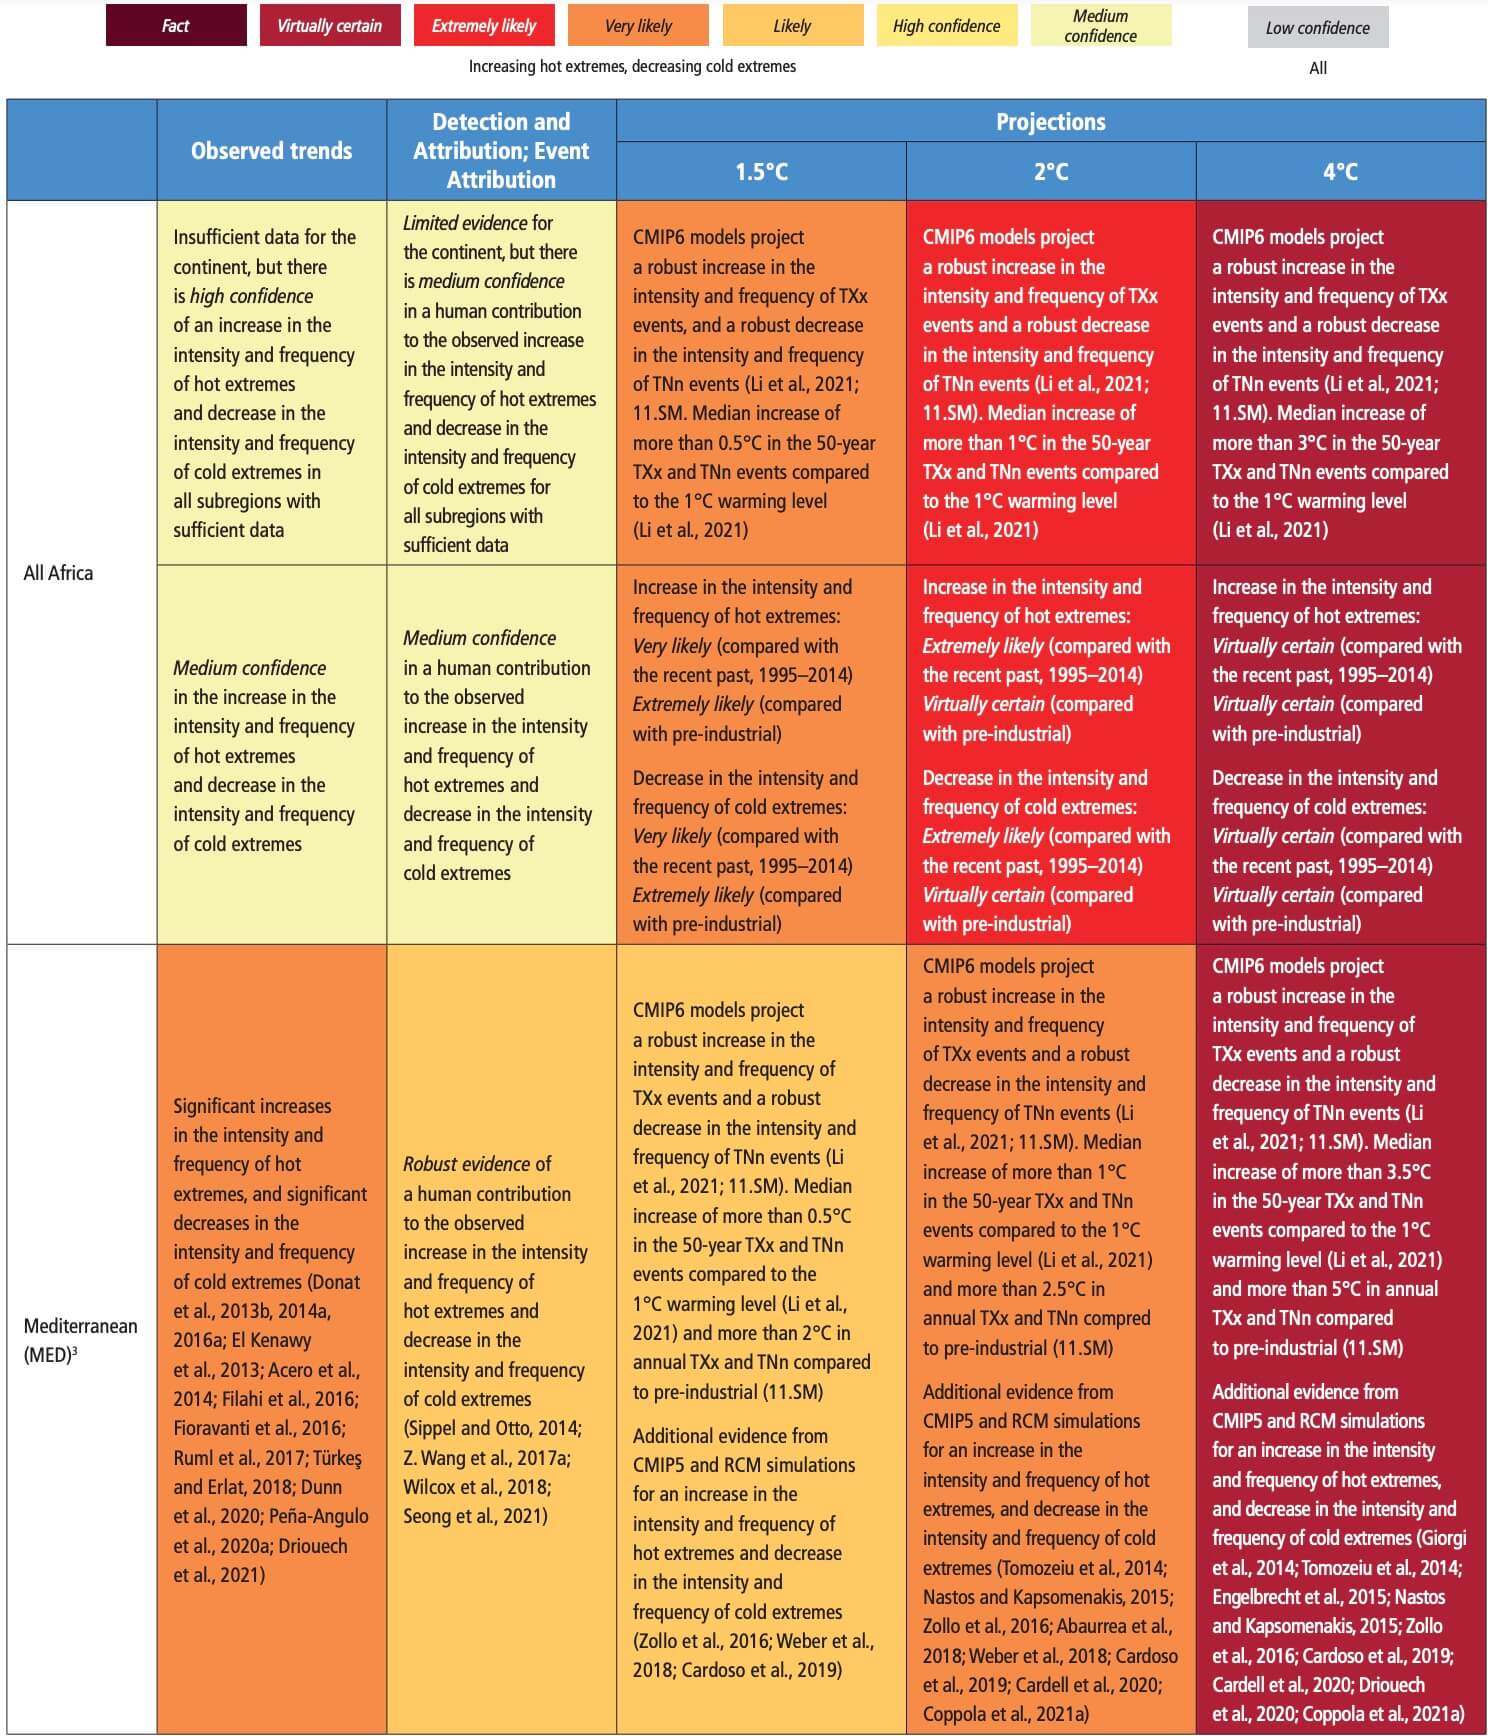
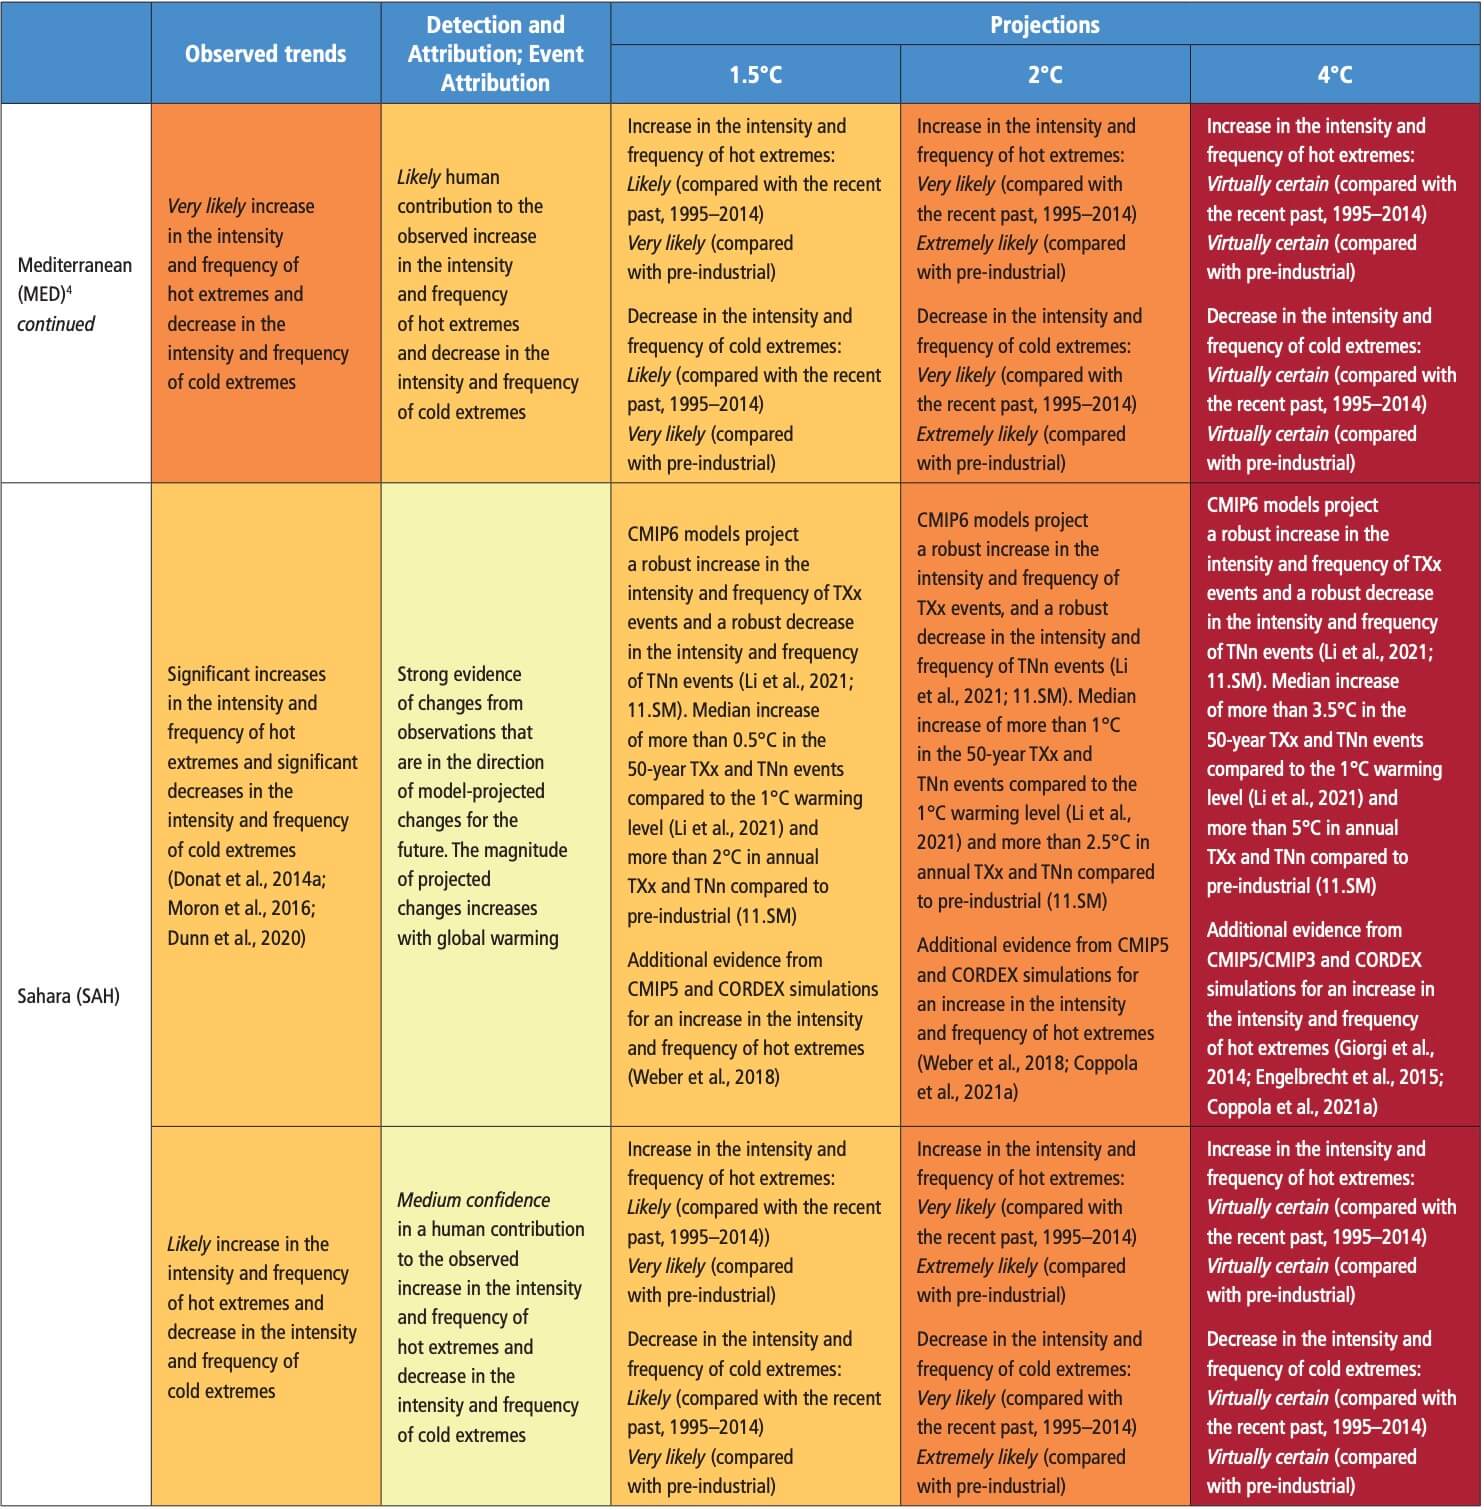
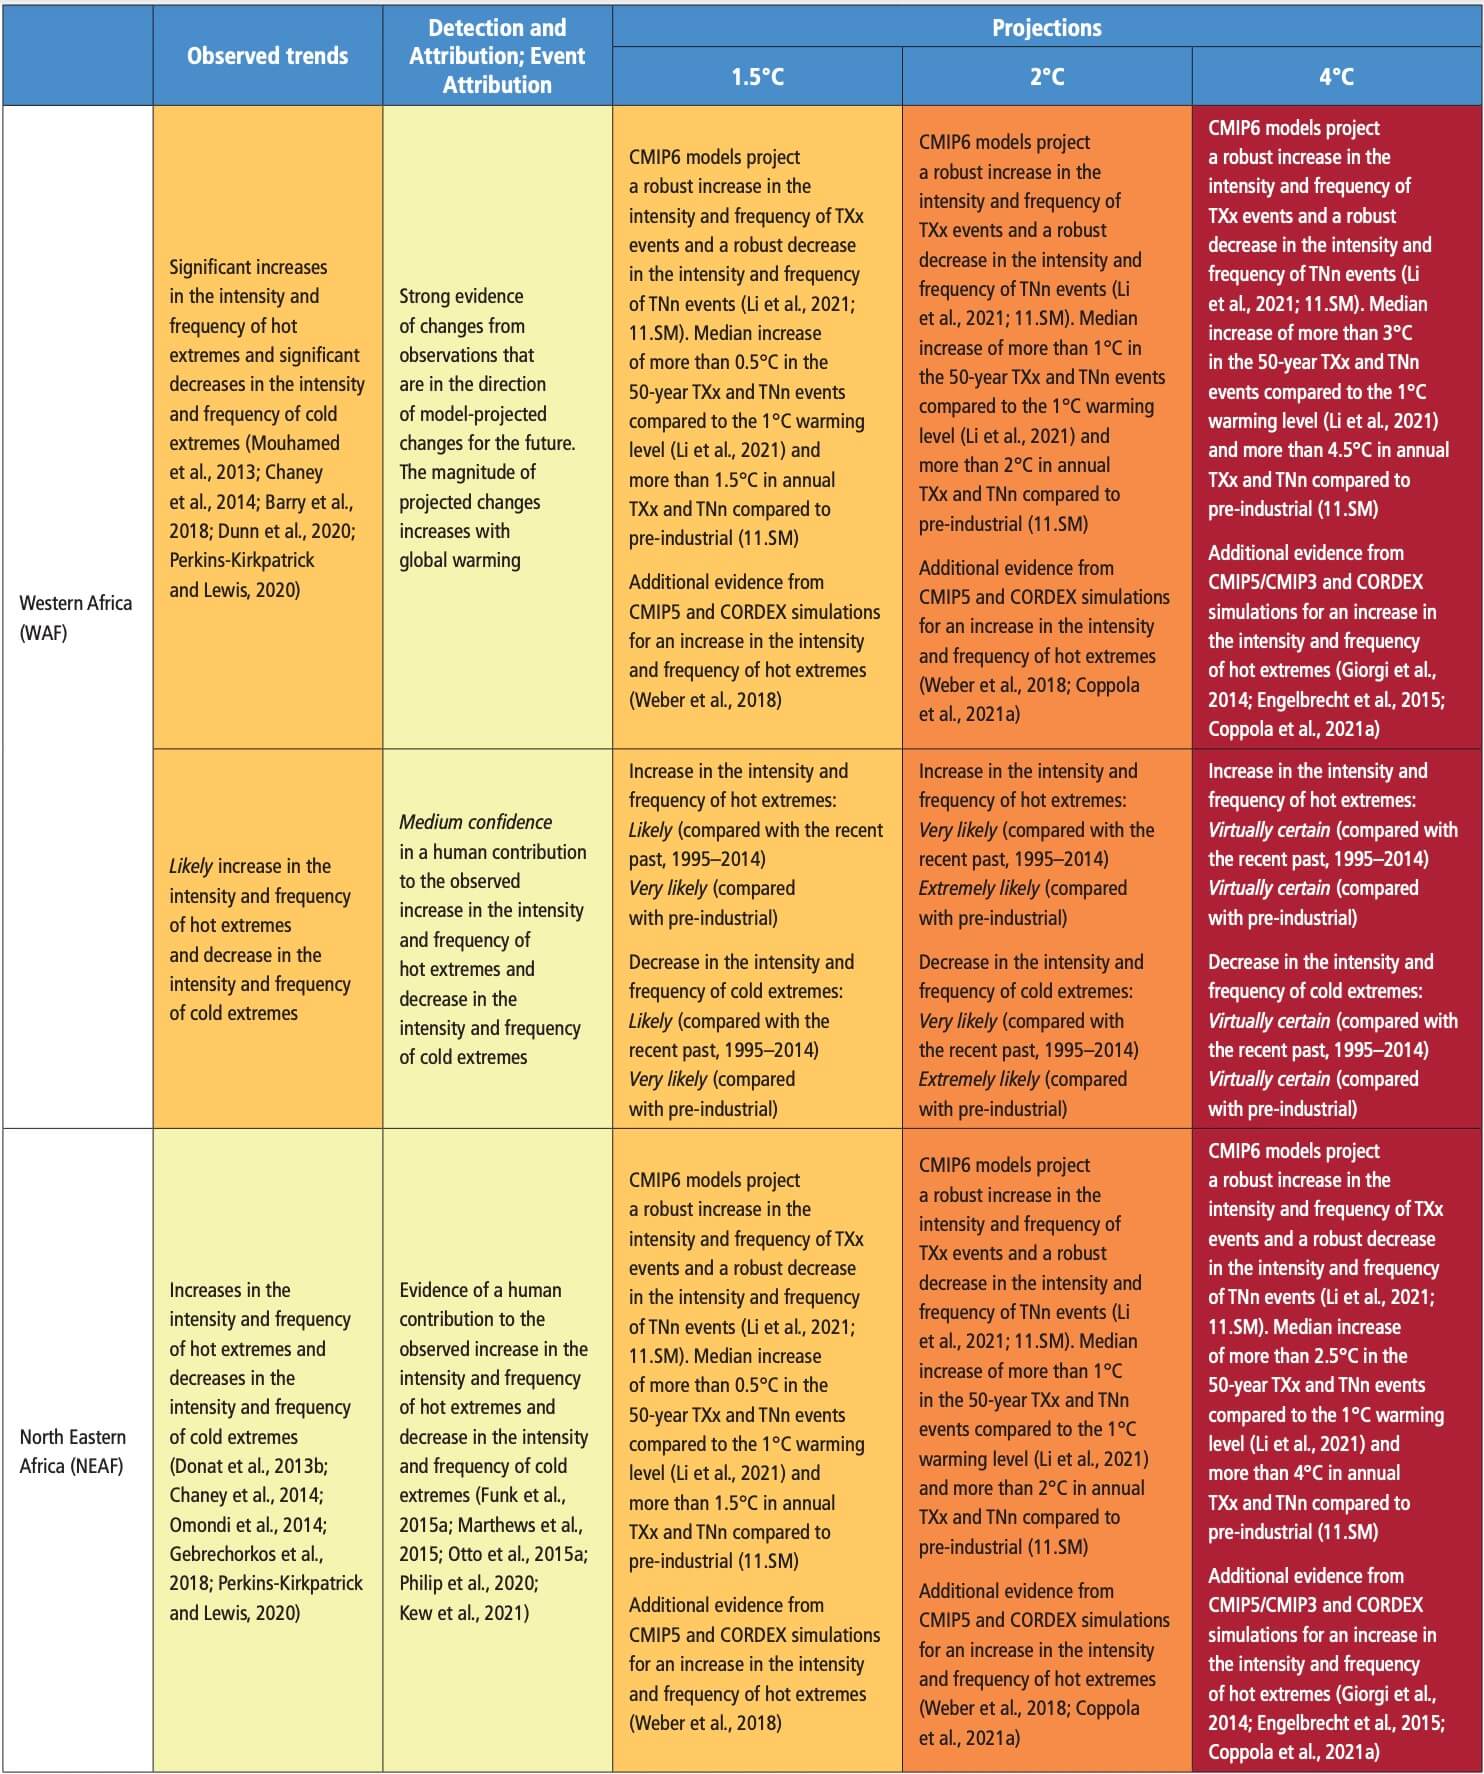
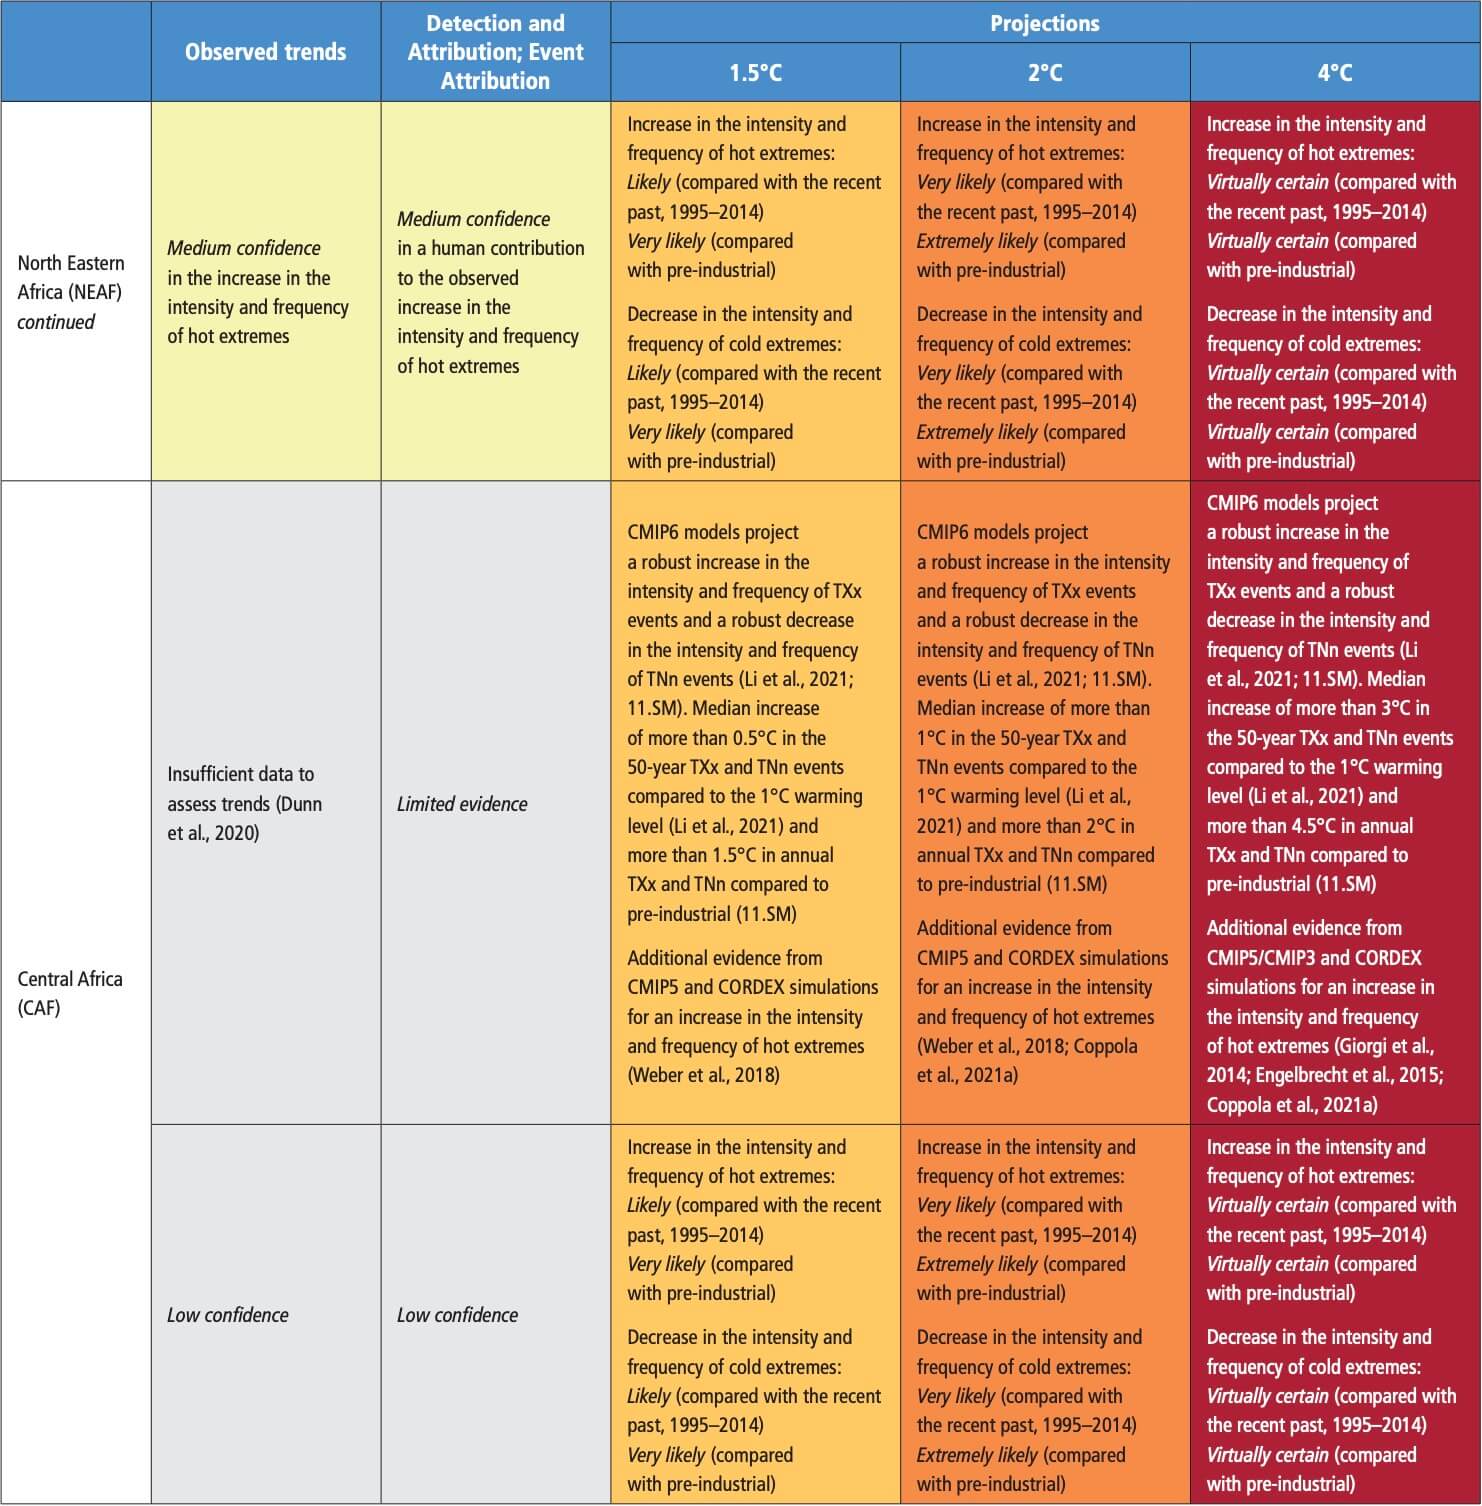
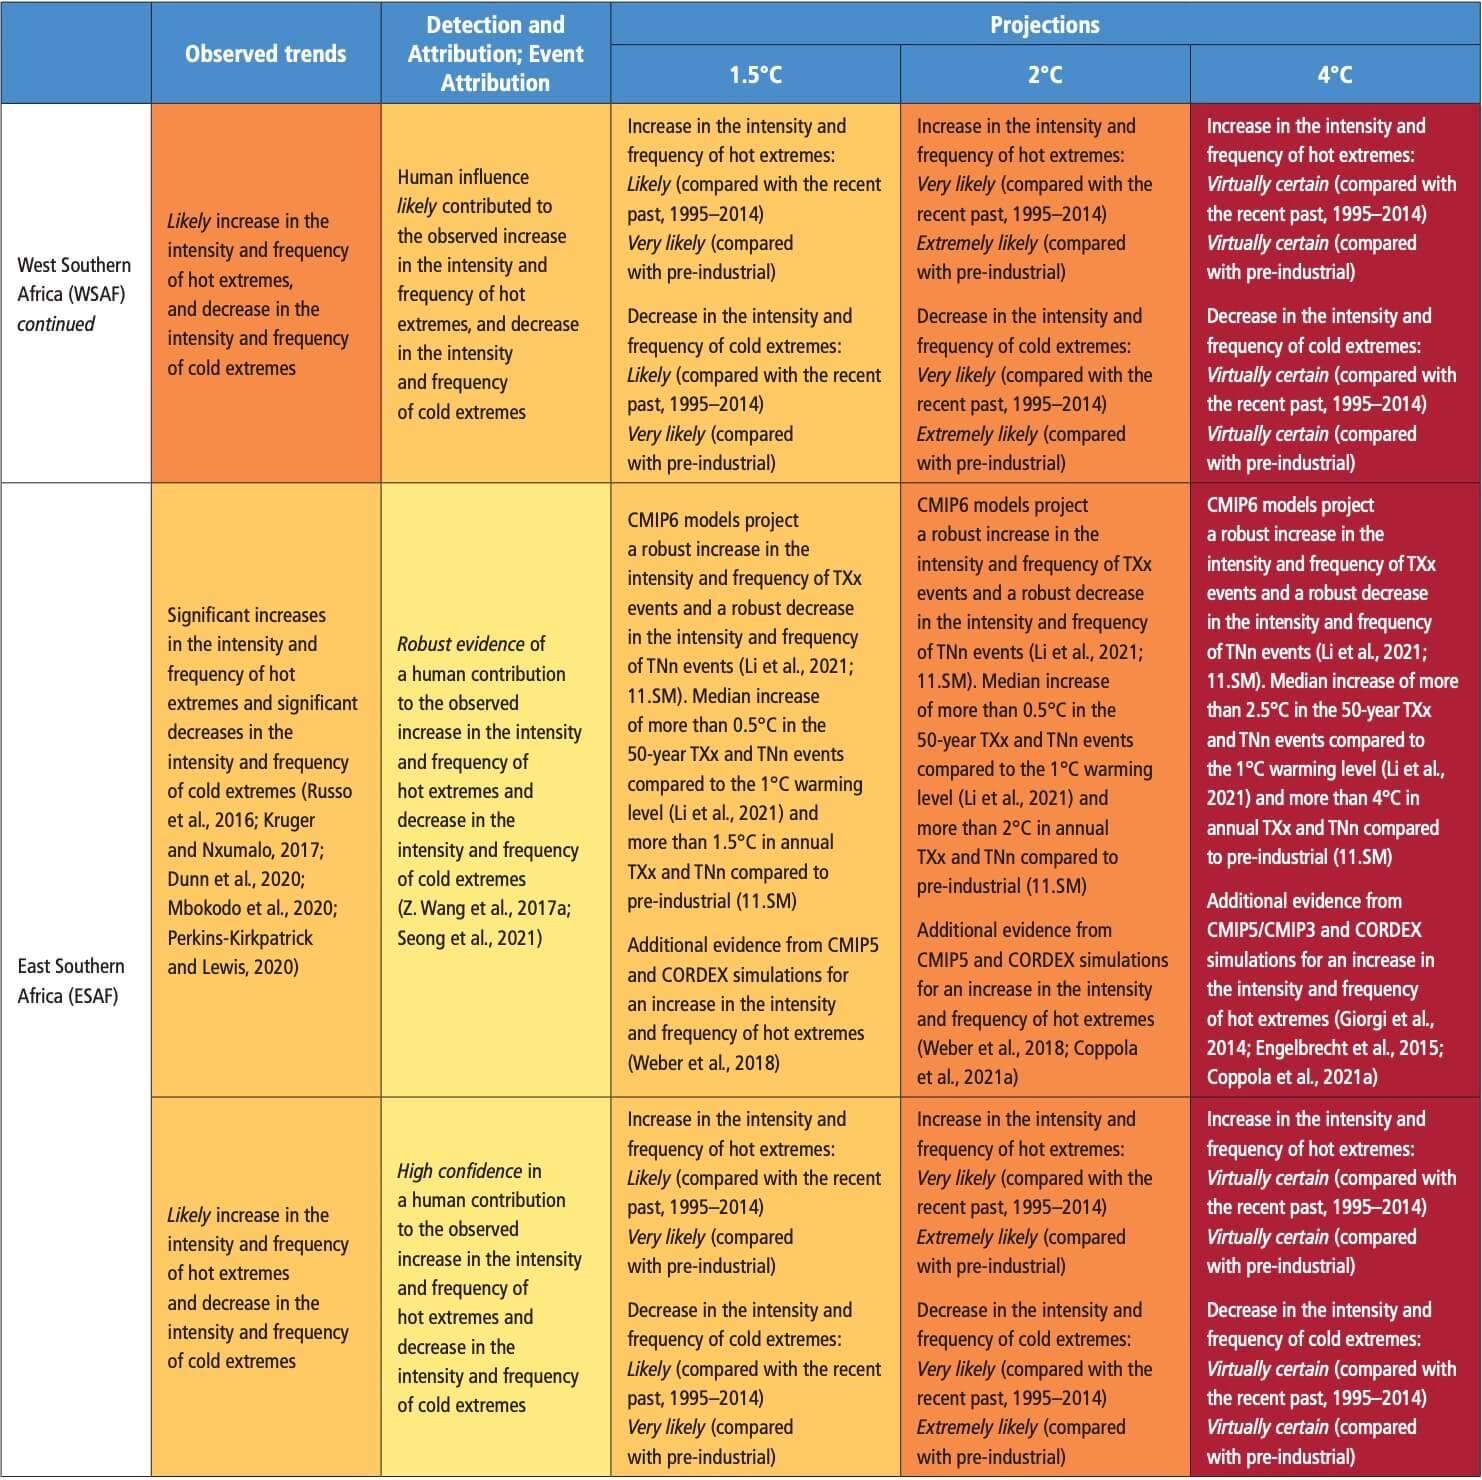
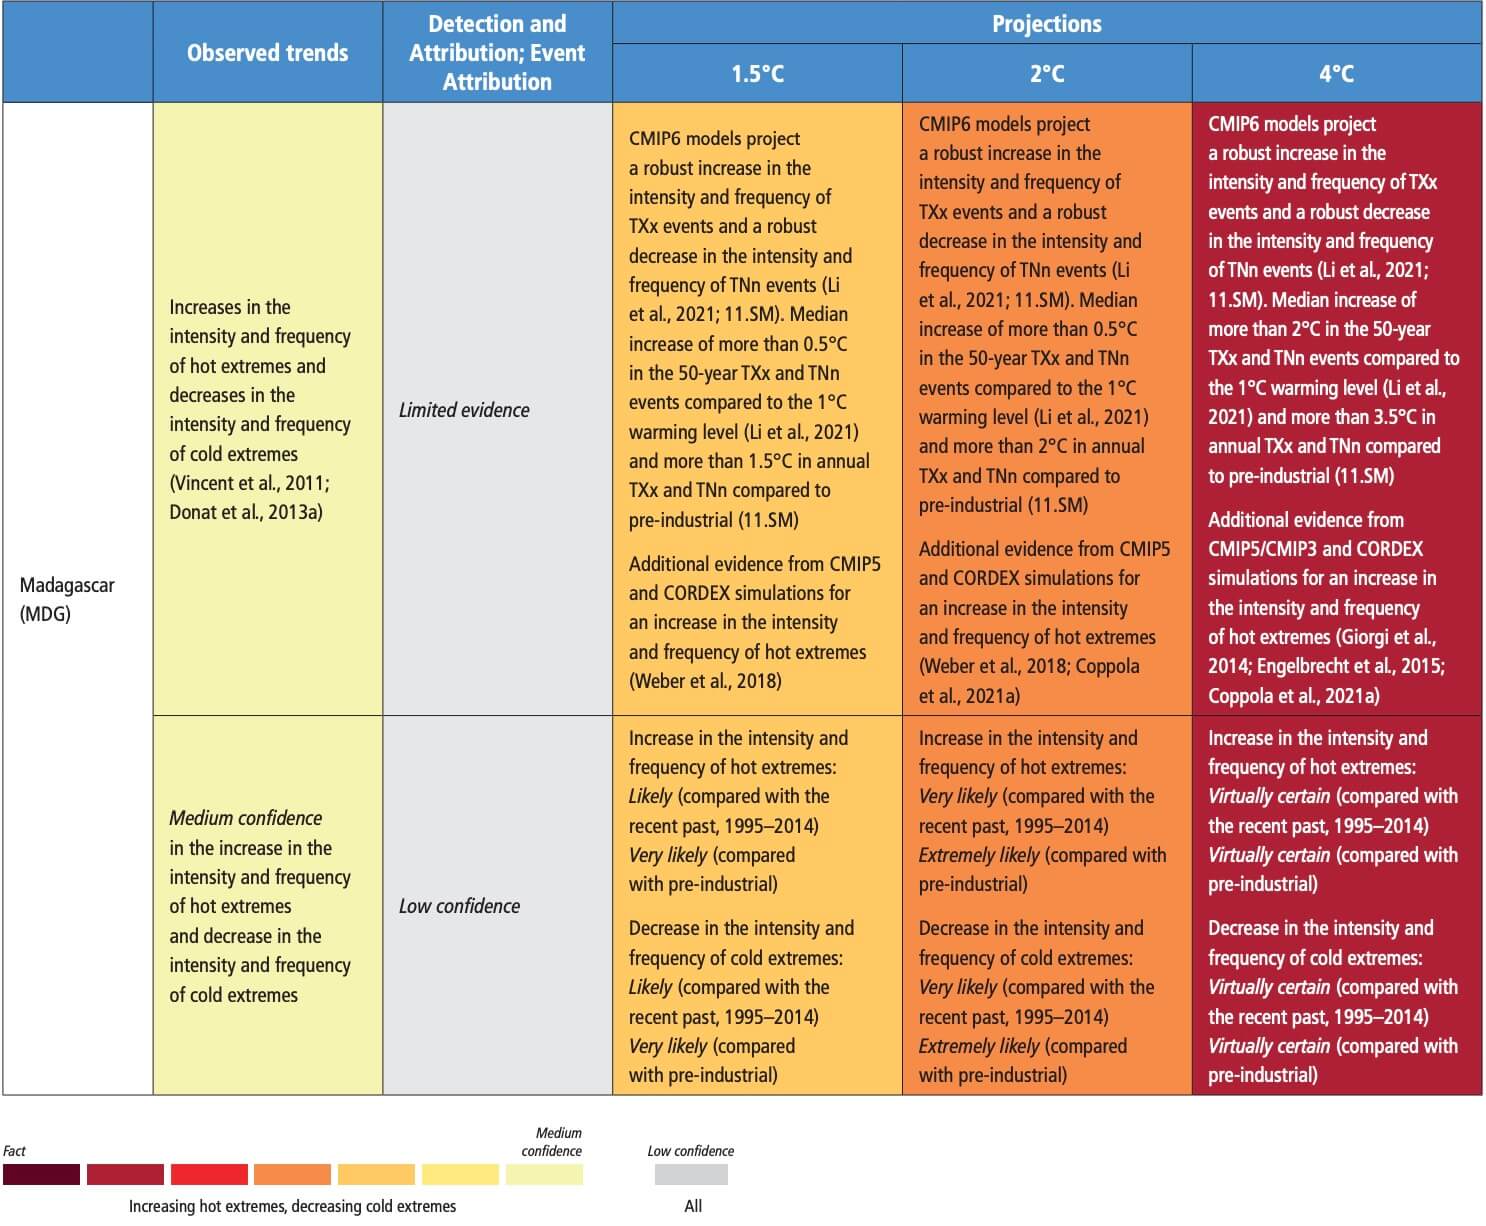 Table 11.5 | Observed trends, human contribution to observed trends, and projected changesat 1.5°C, 2°C and 4°C of global warming for heavy precipitation in Africa, subdivided by AR6 regions. See Sections 11.9.1 and 11.9.3 for details.
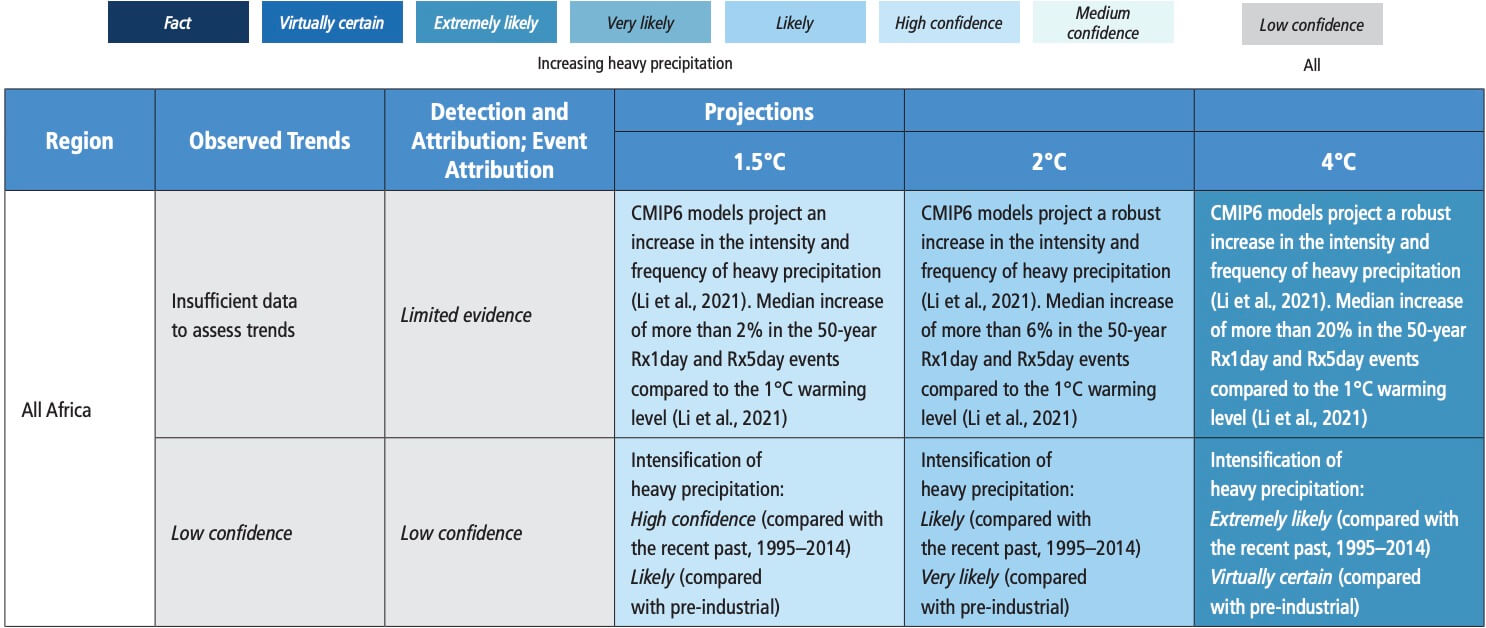
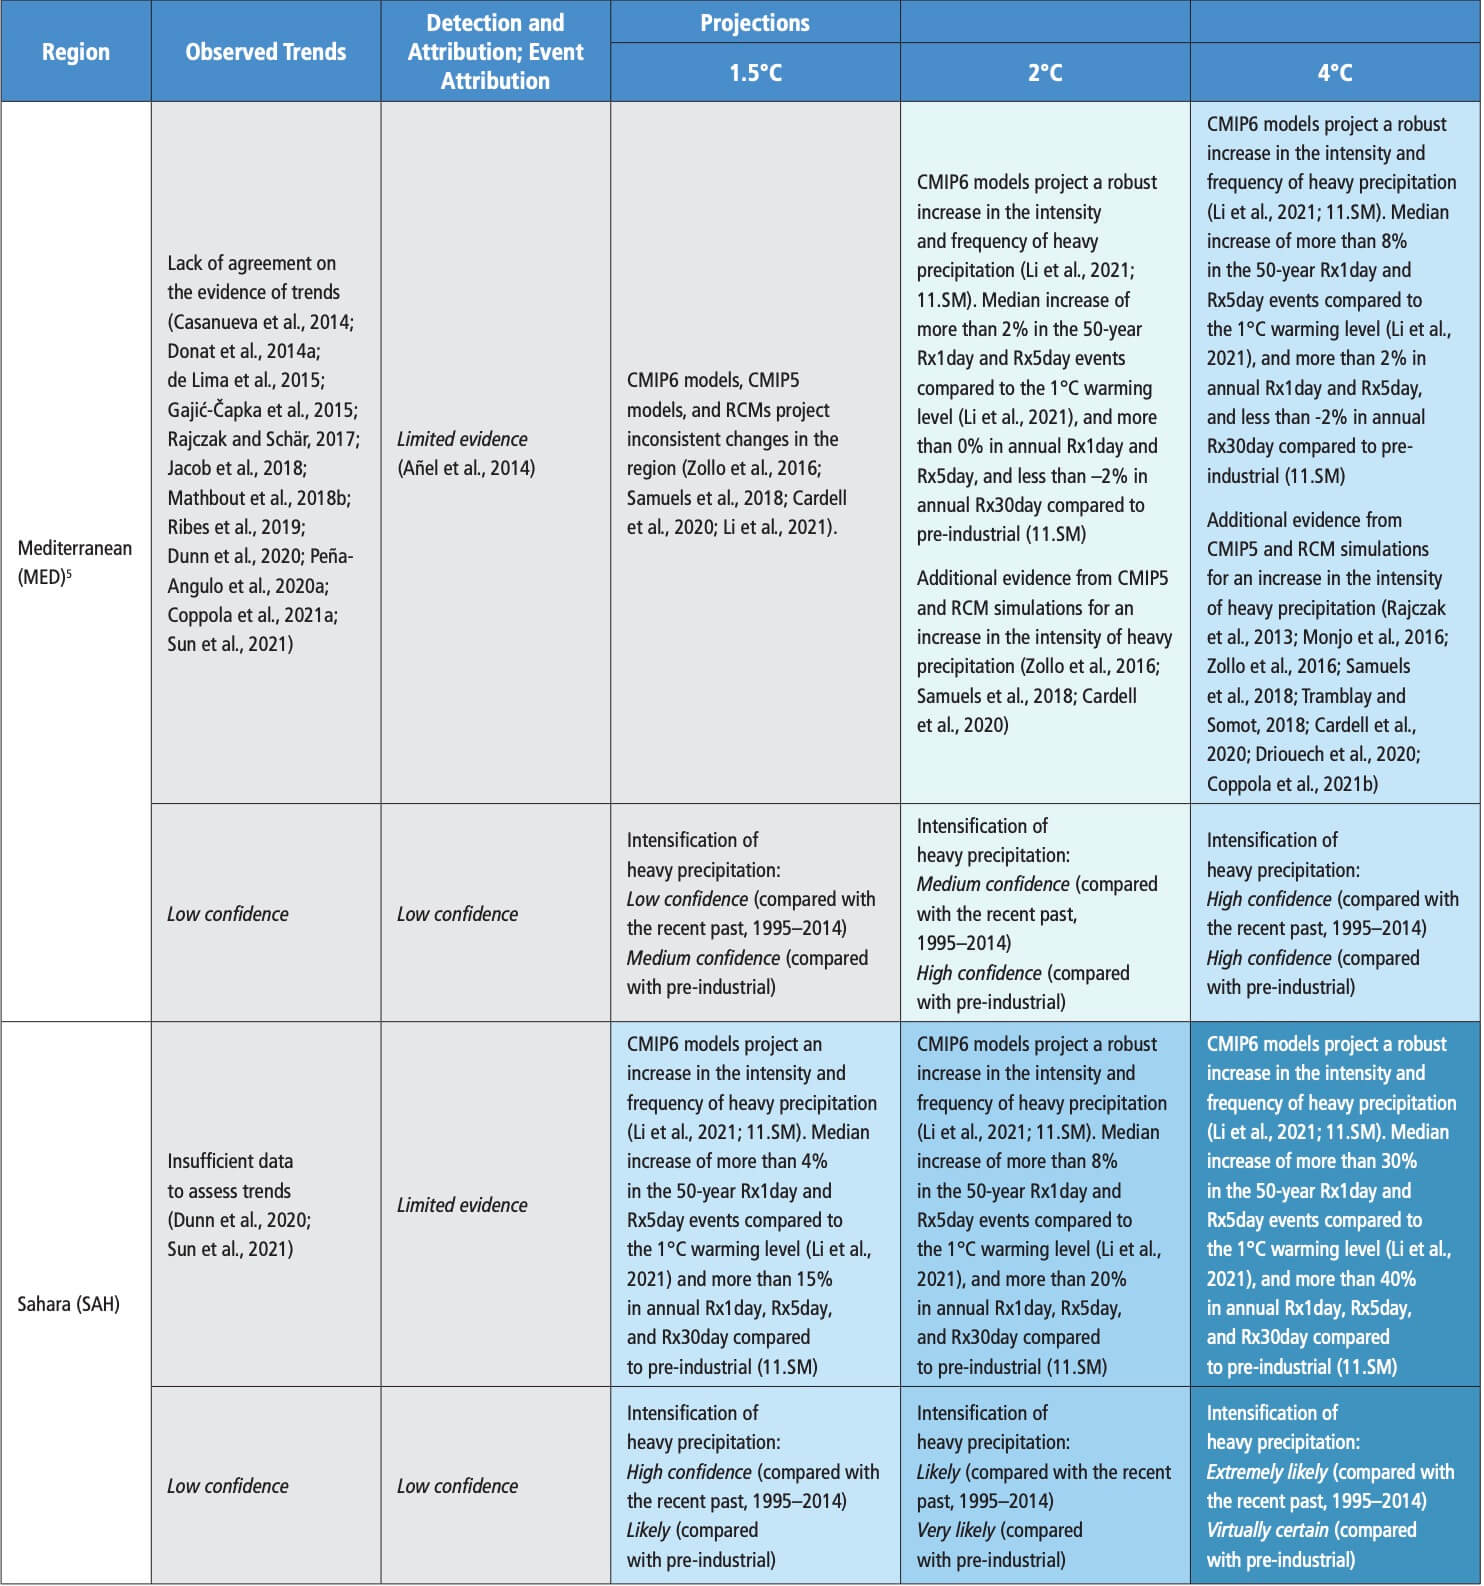
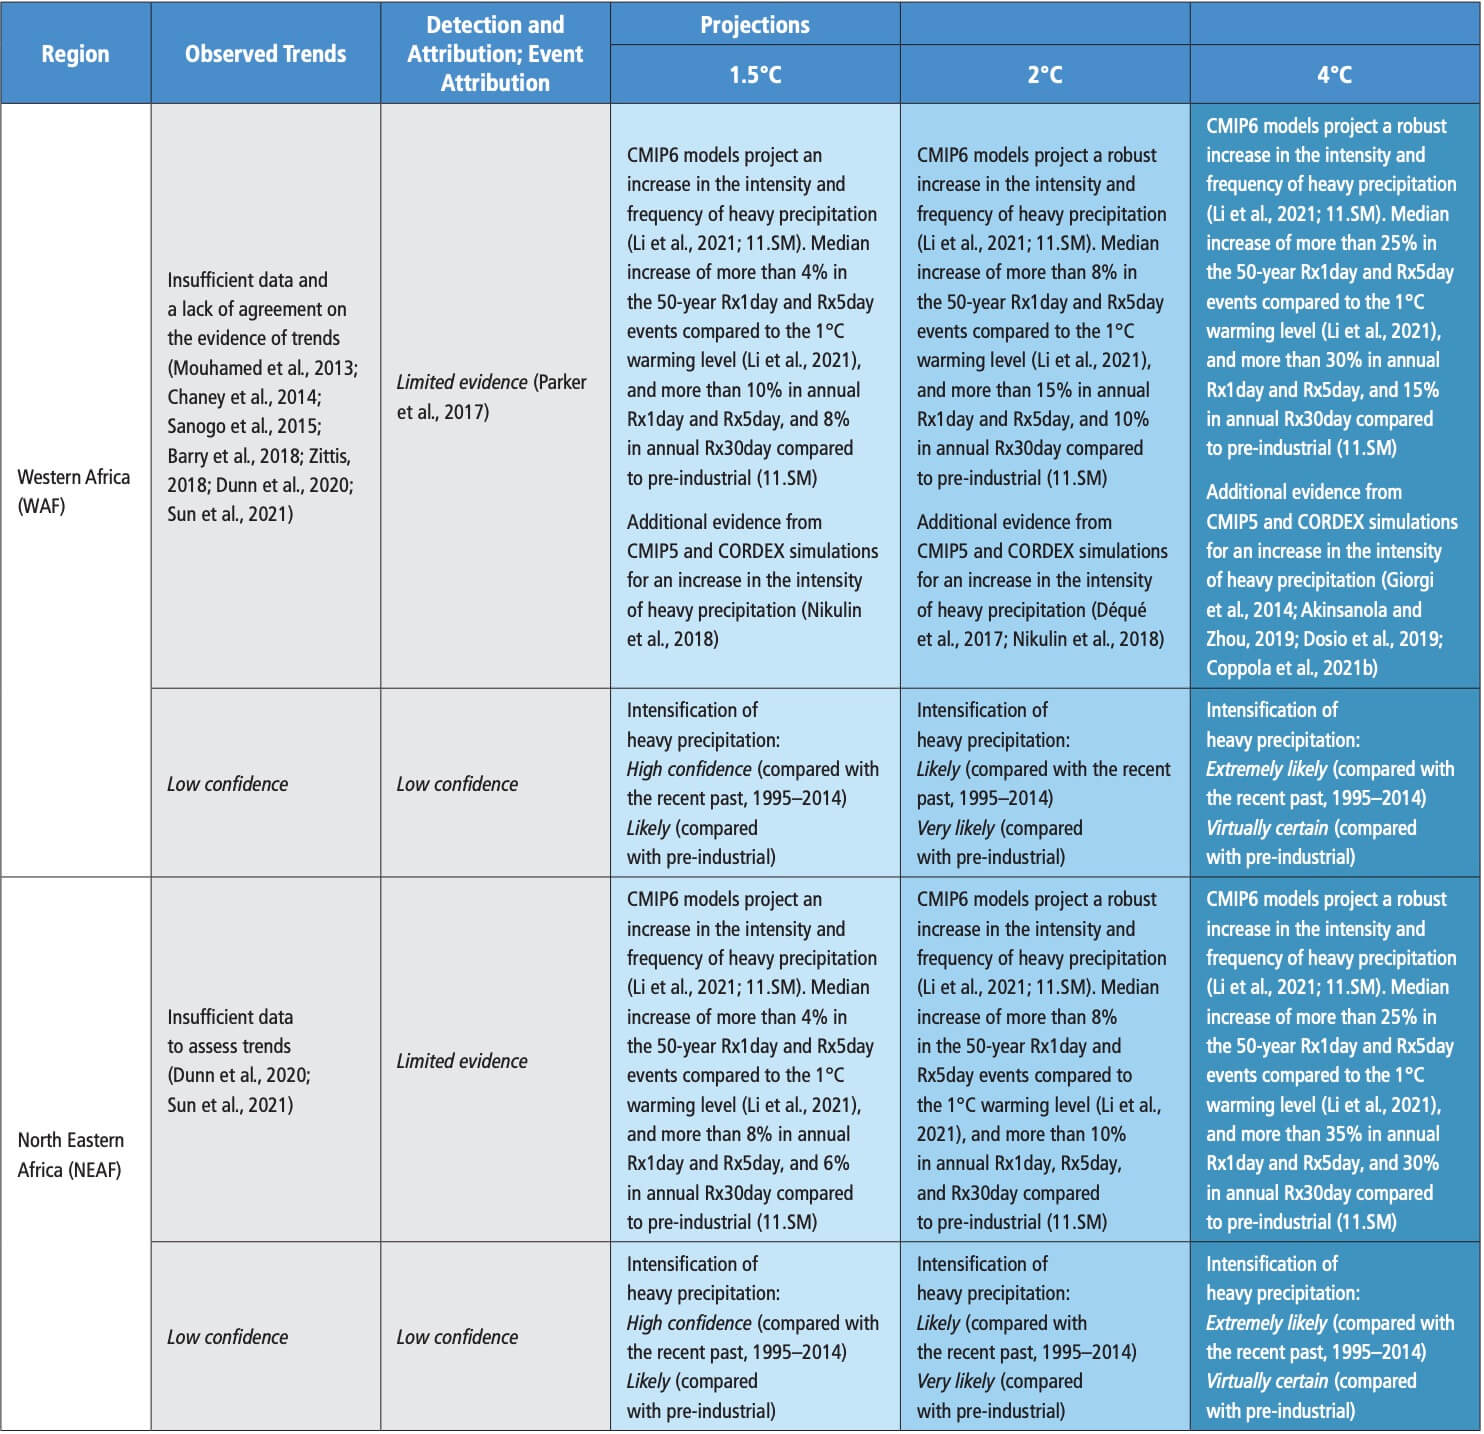
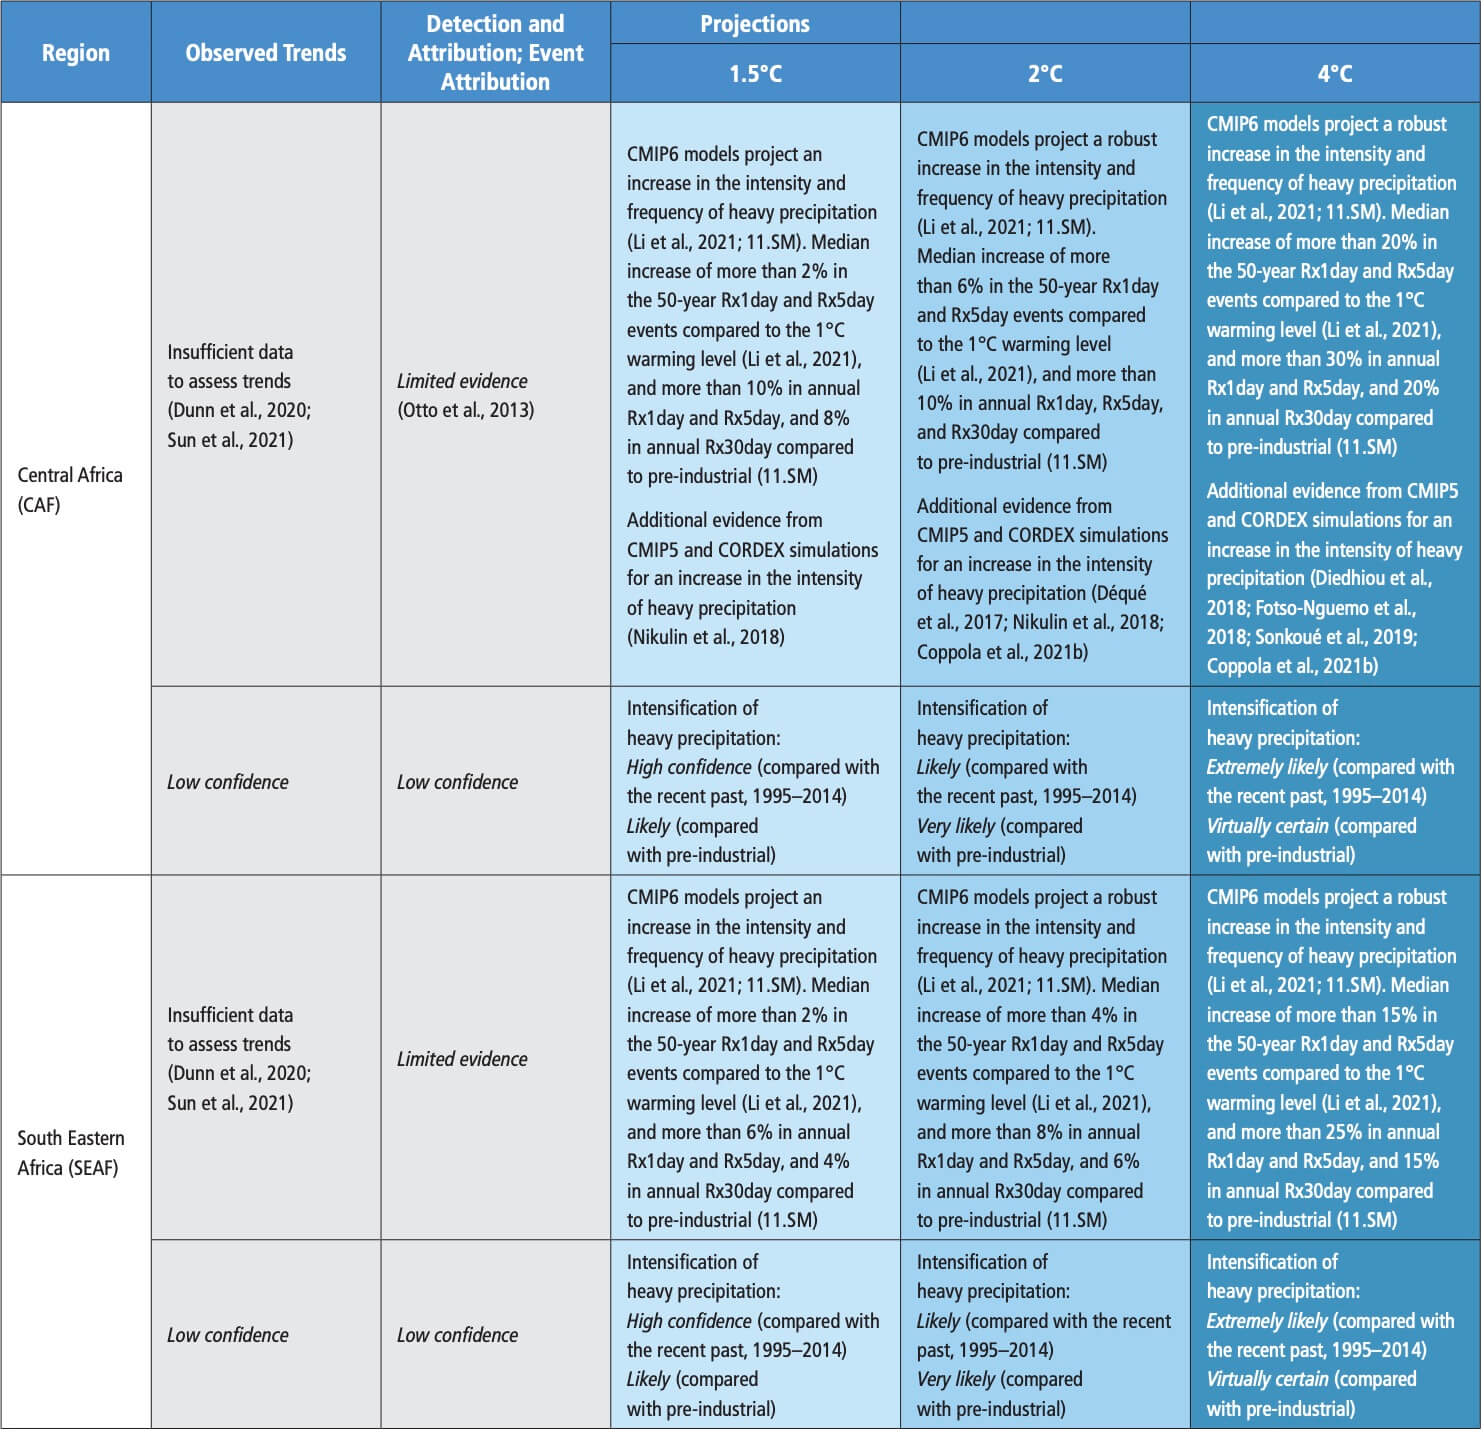
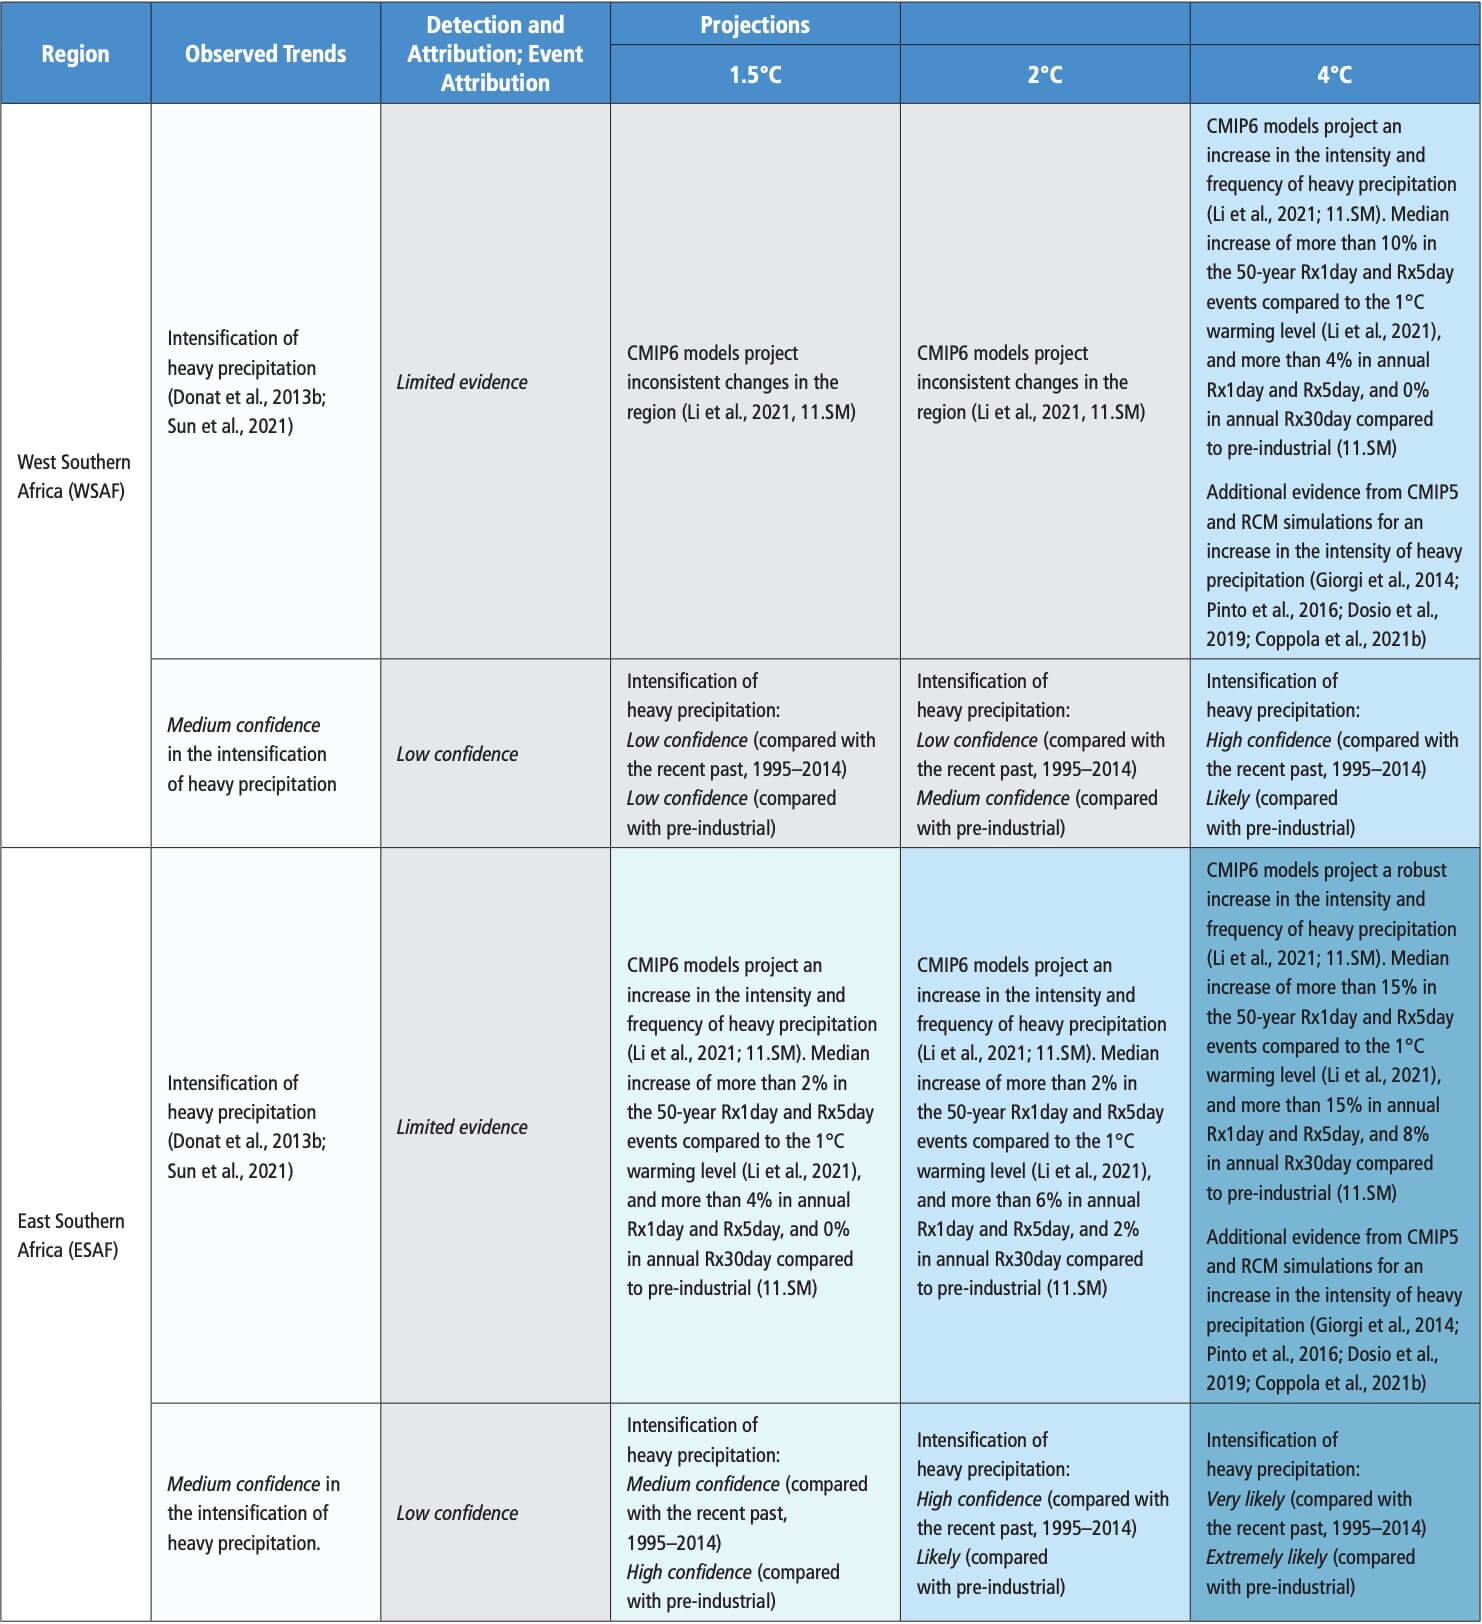
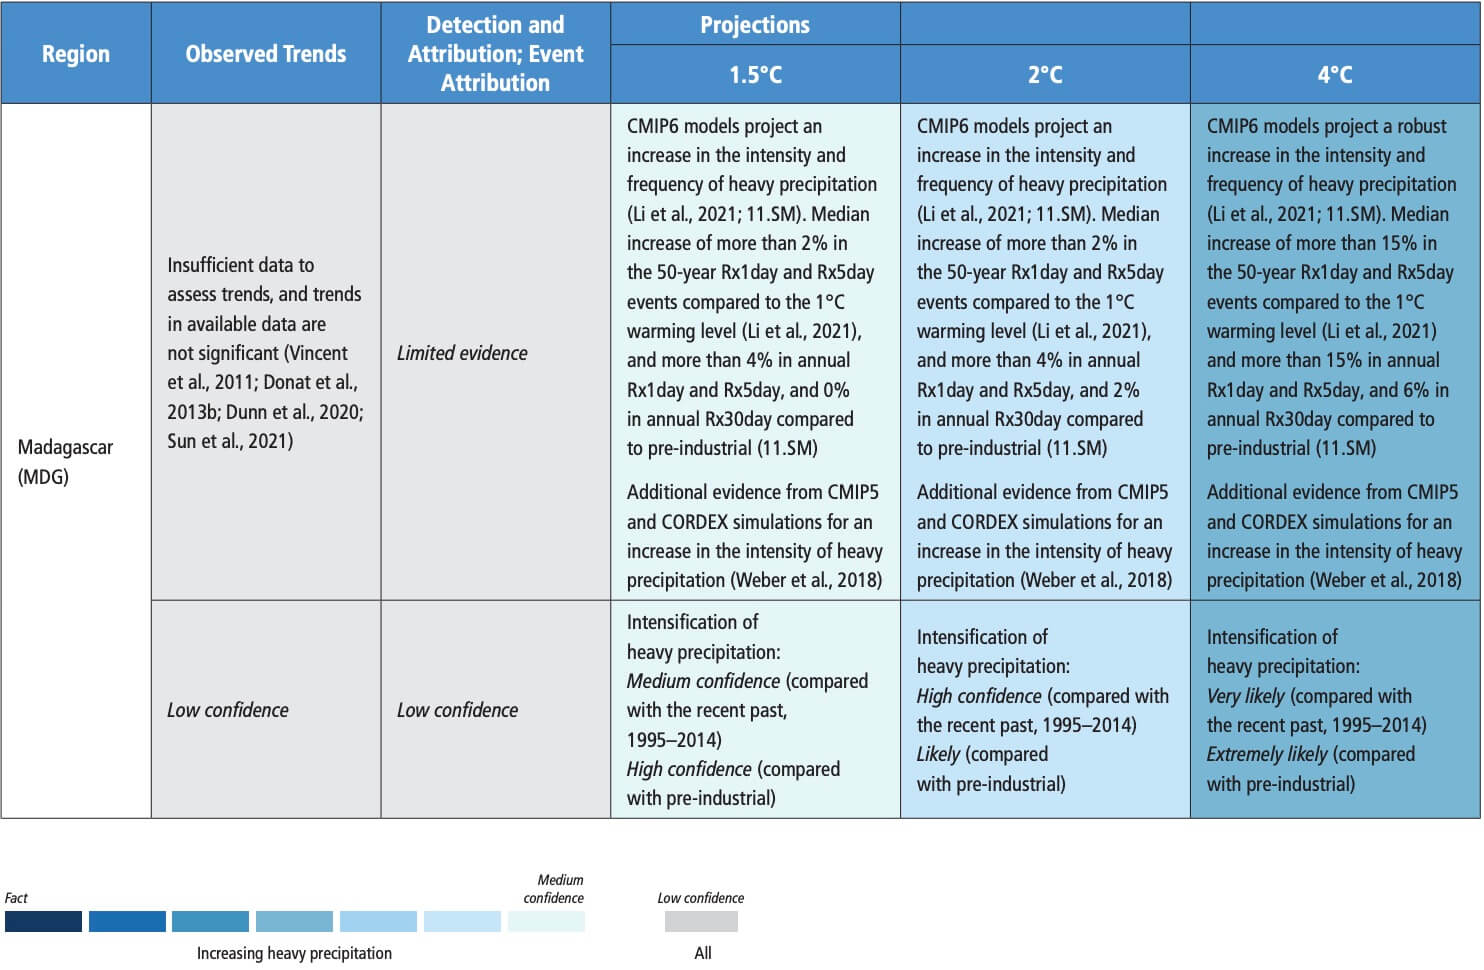 Table 11.6 | Observed trends, human contribution to observed trends, and projected changes at 1.5°C, 2°C and 4°C of global warming for meteorological droughts (MET), agricultural and ecological droughts (AGR/ECOL), and hydrological droughts (HYDR) in Africa, subdivided by AR6 regions. See Sections 11.9.1 and 11.9.4 for details.
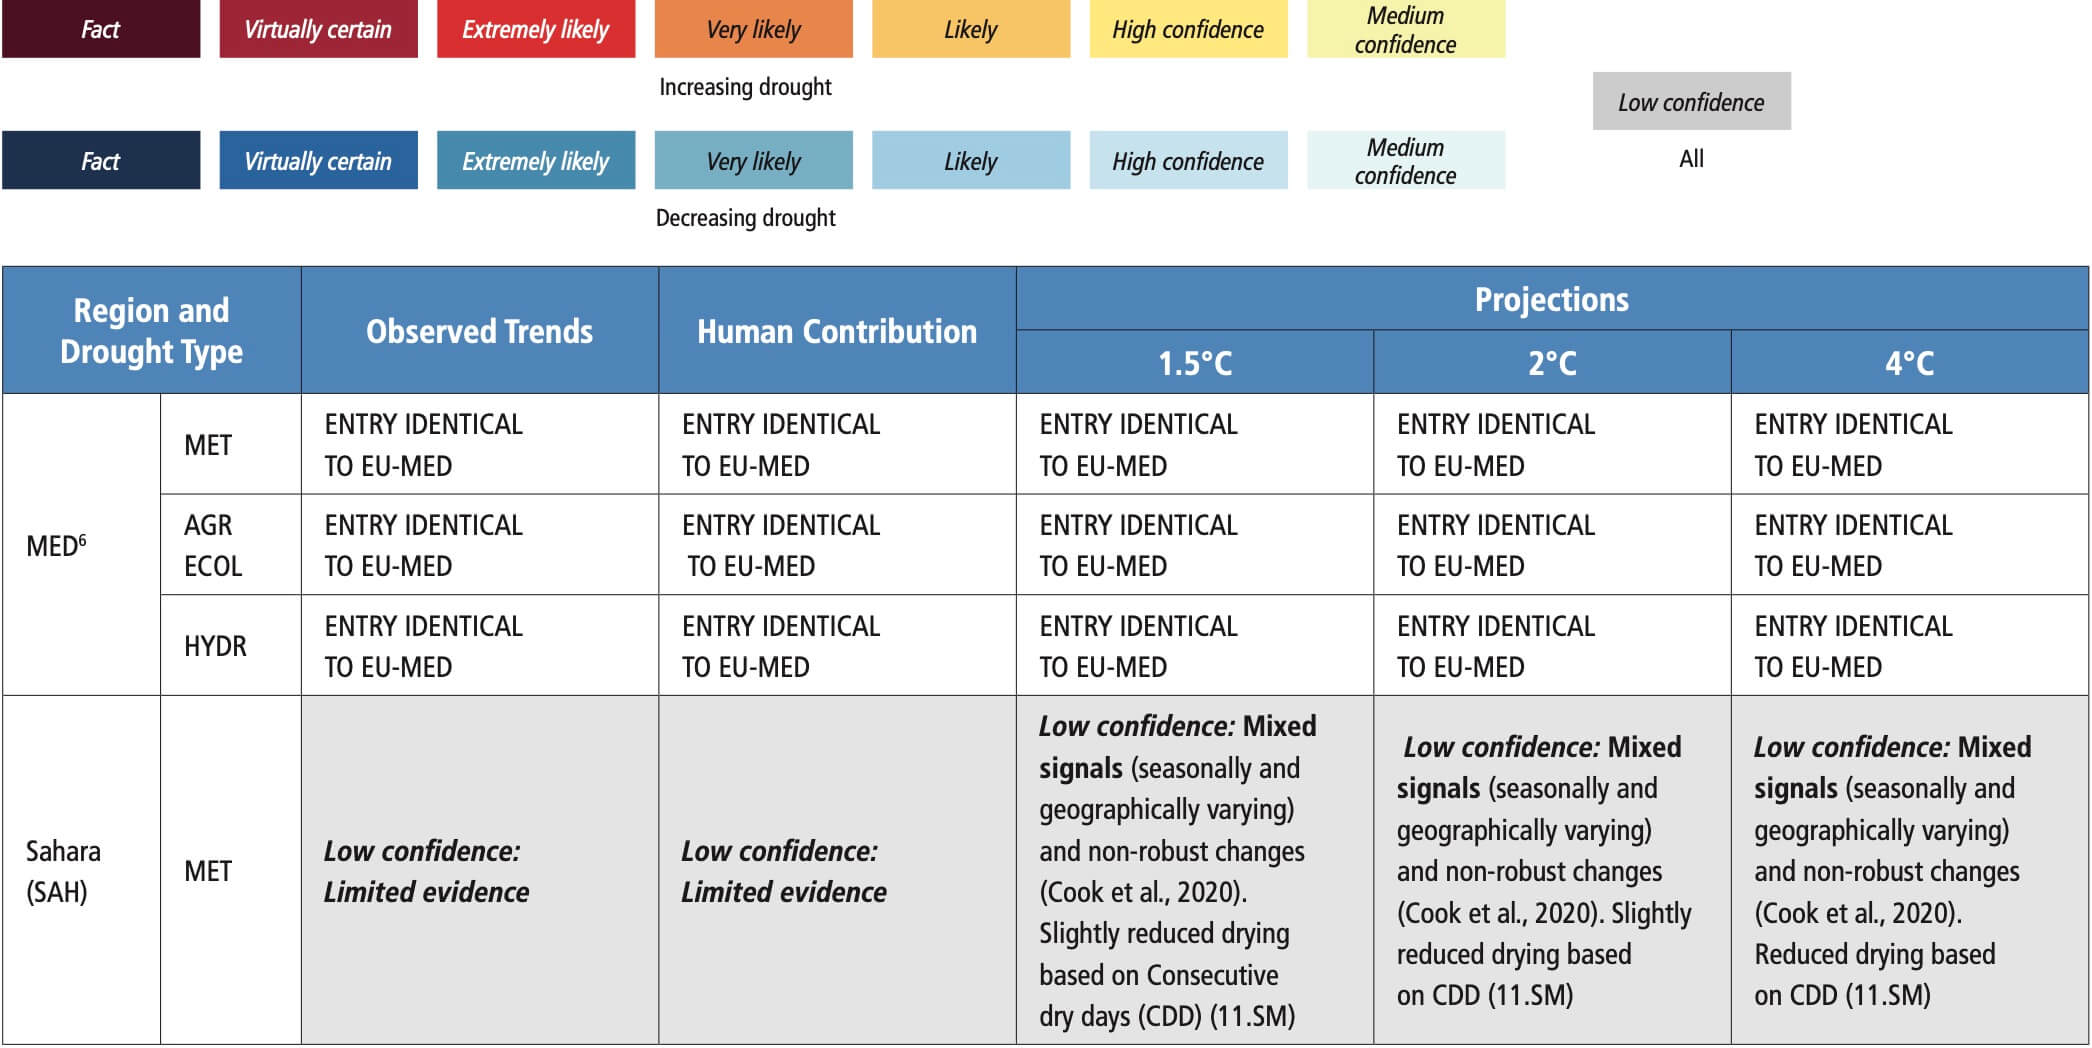
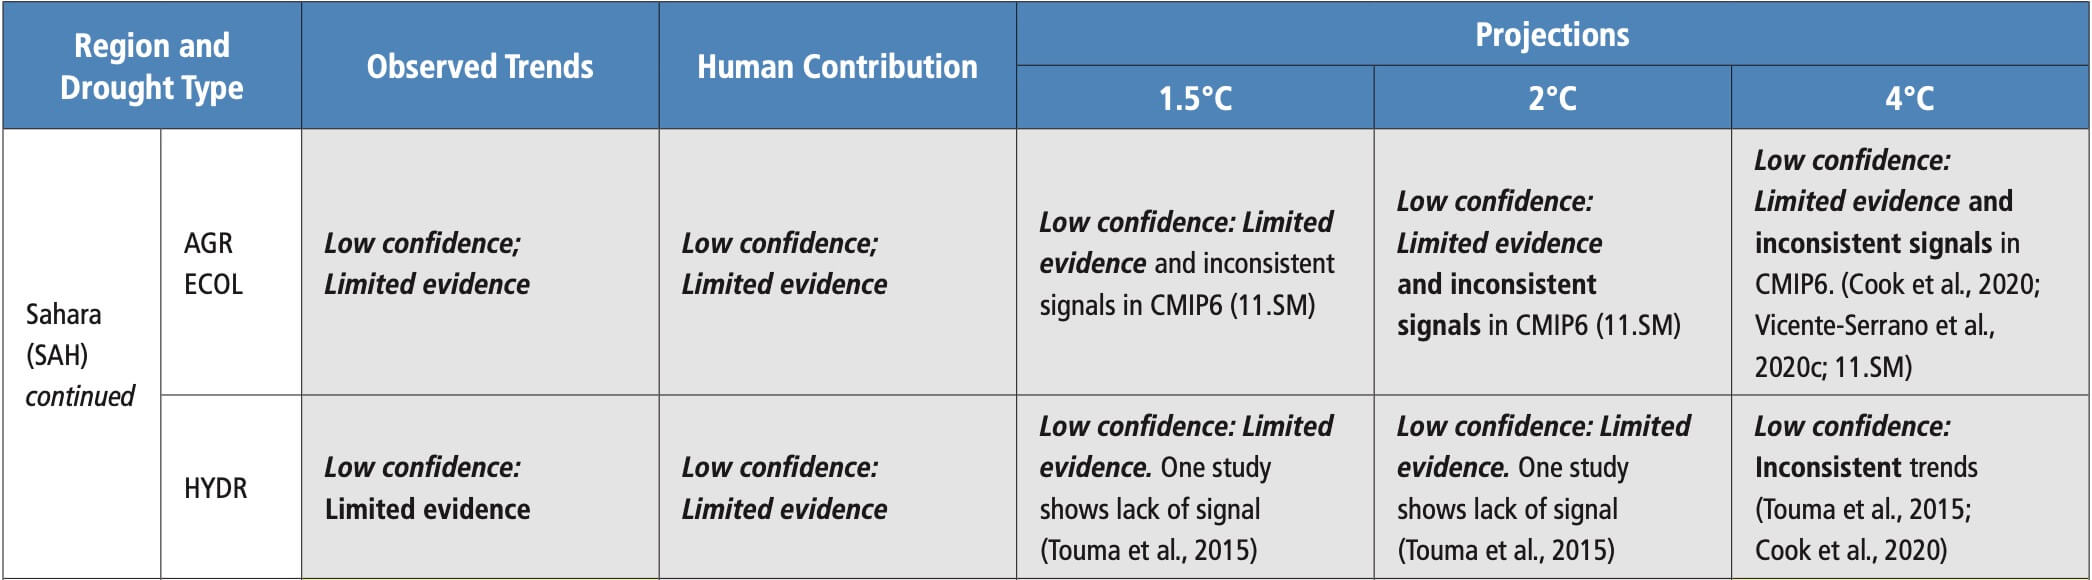
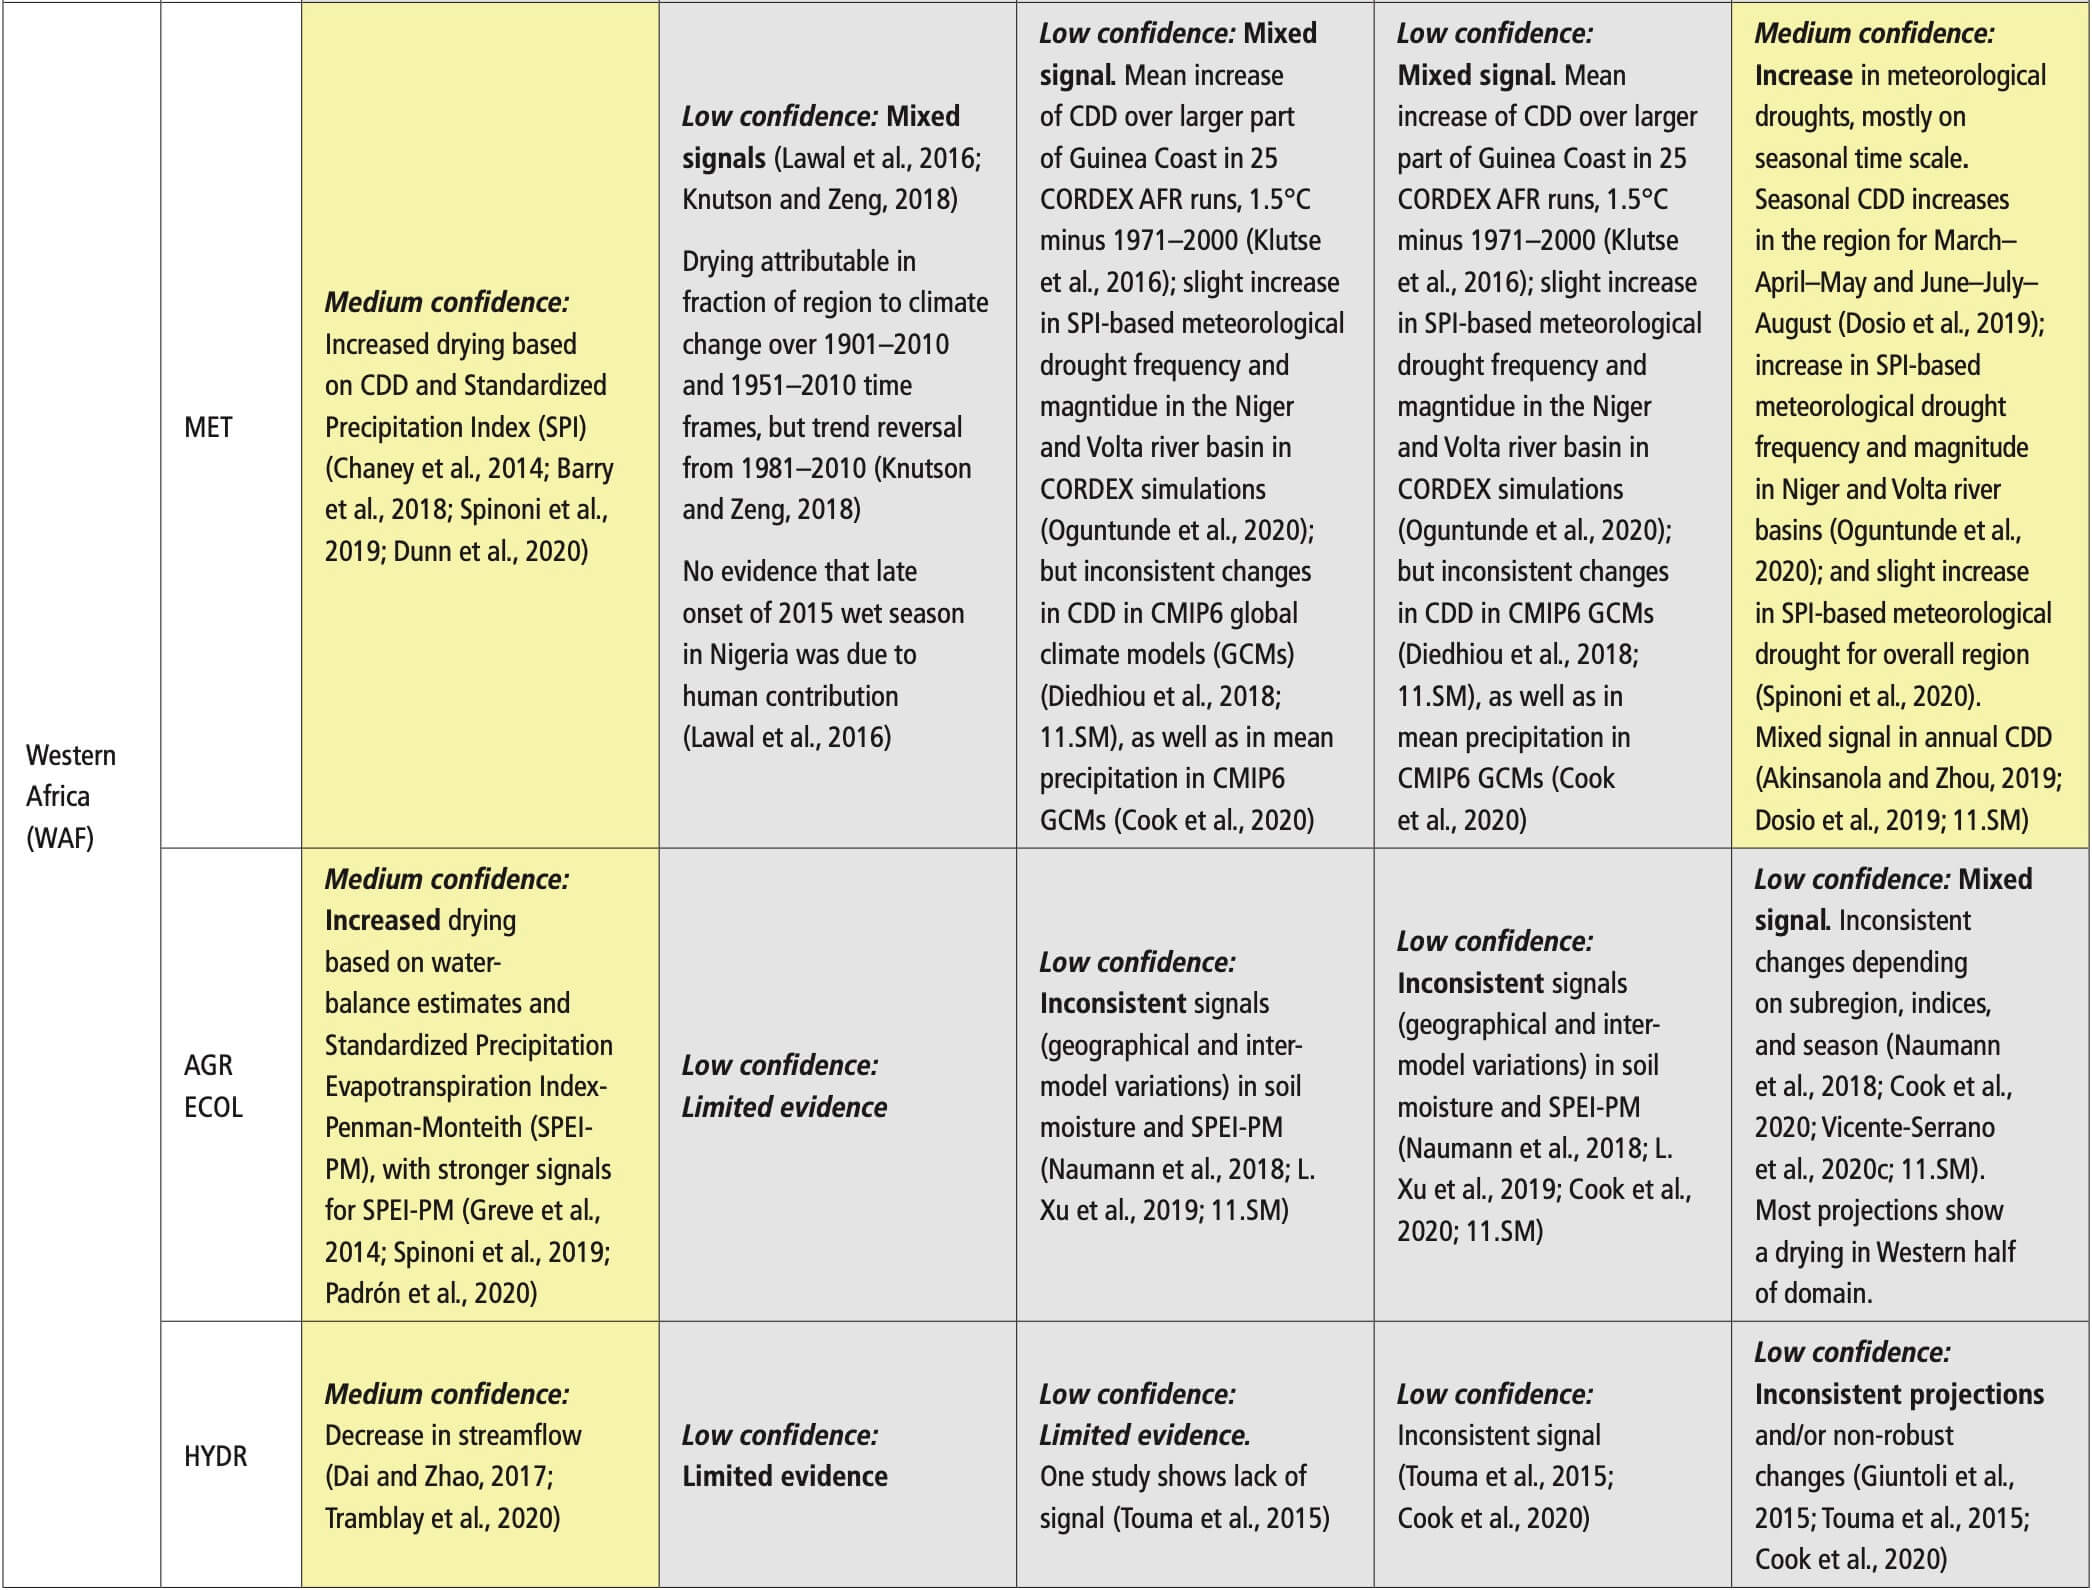
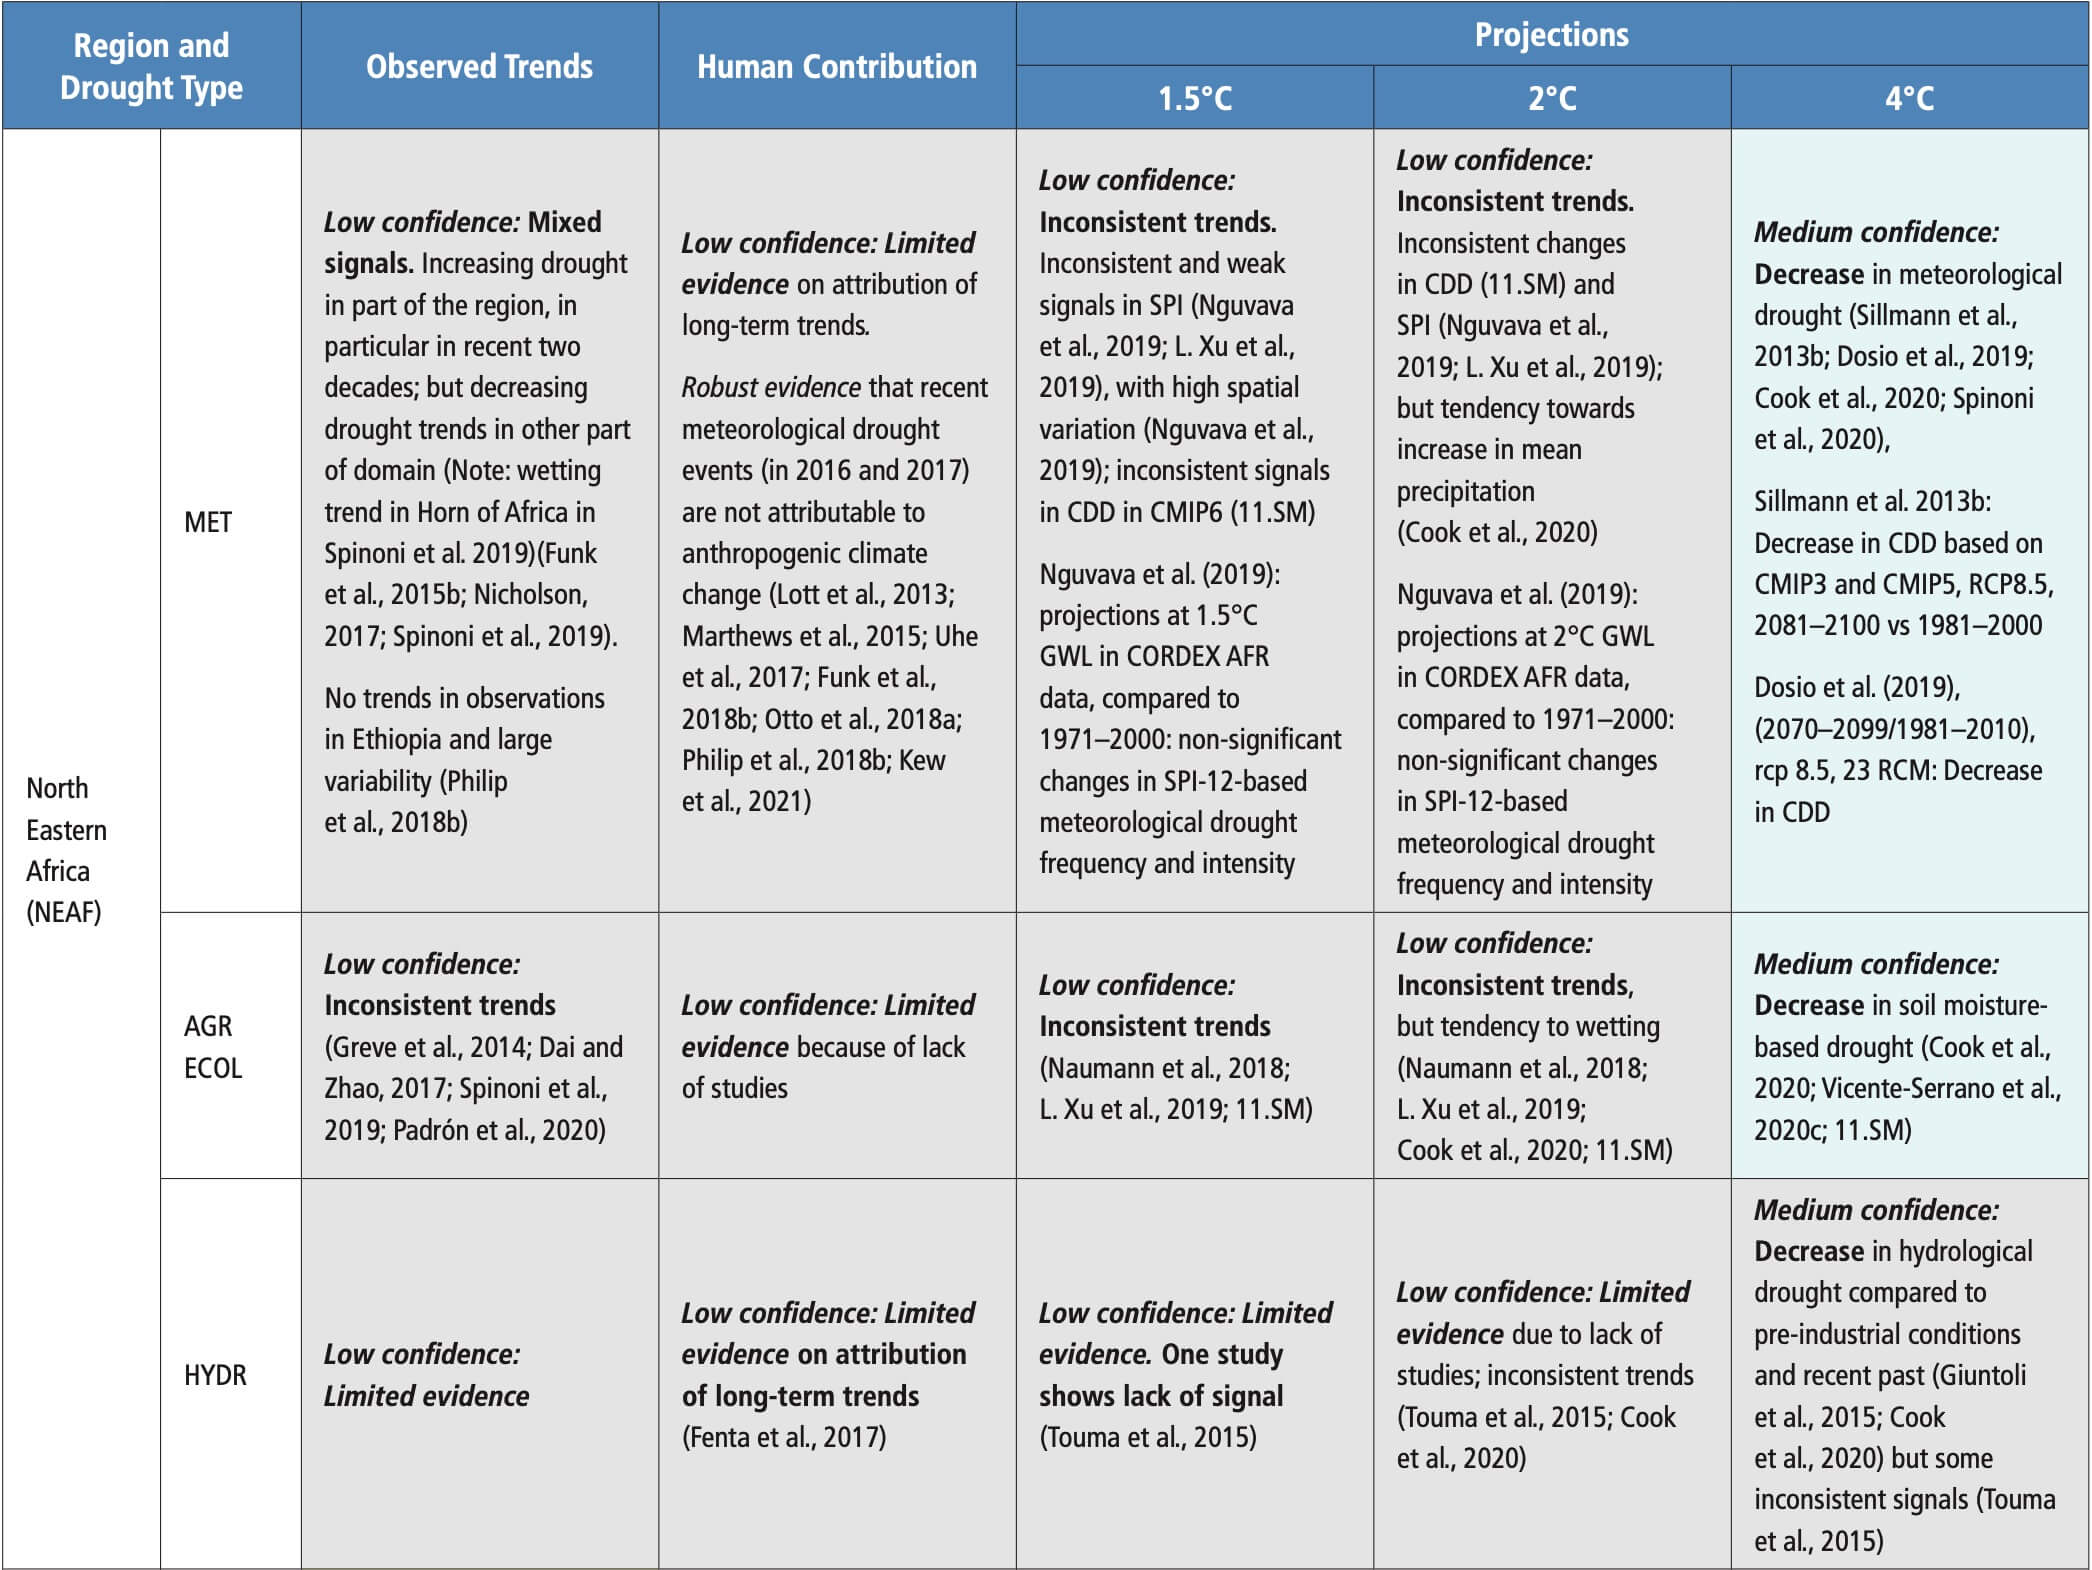
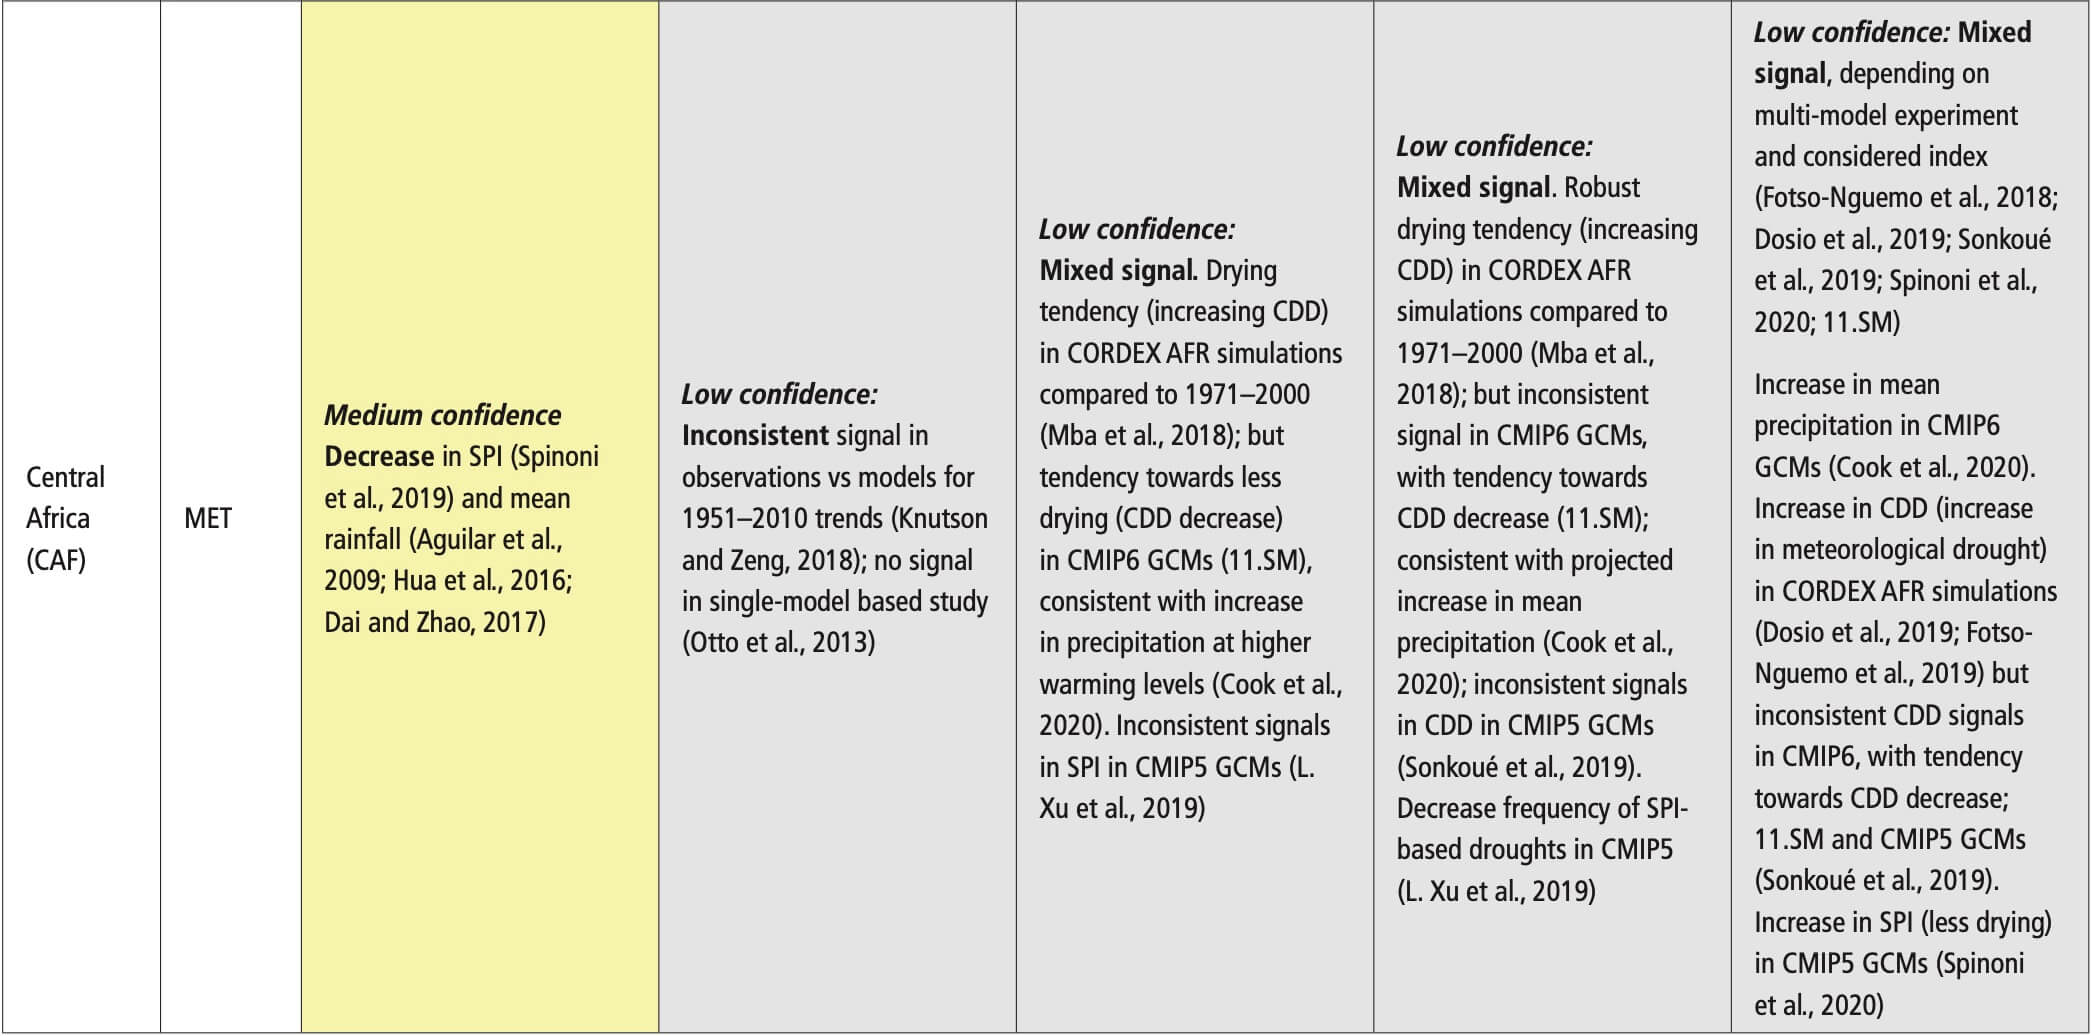
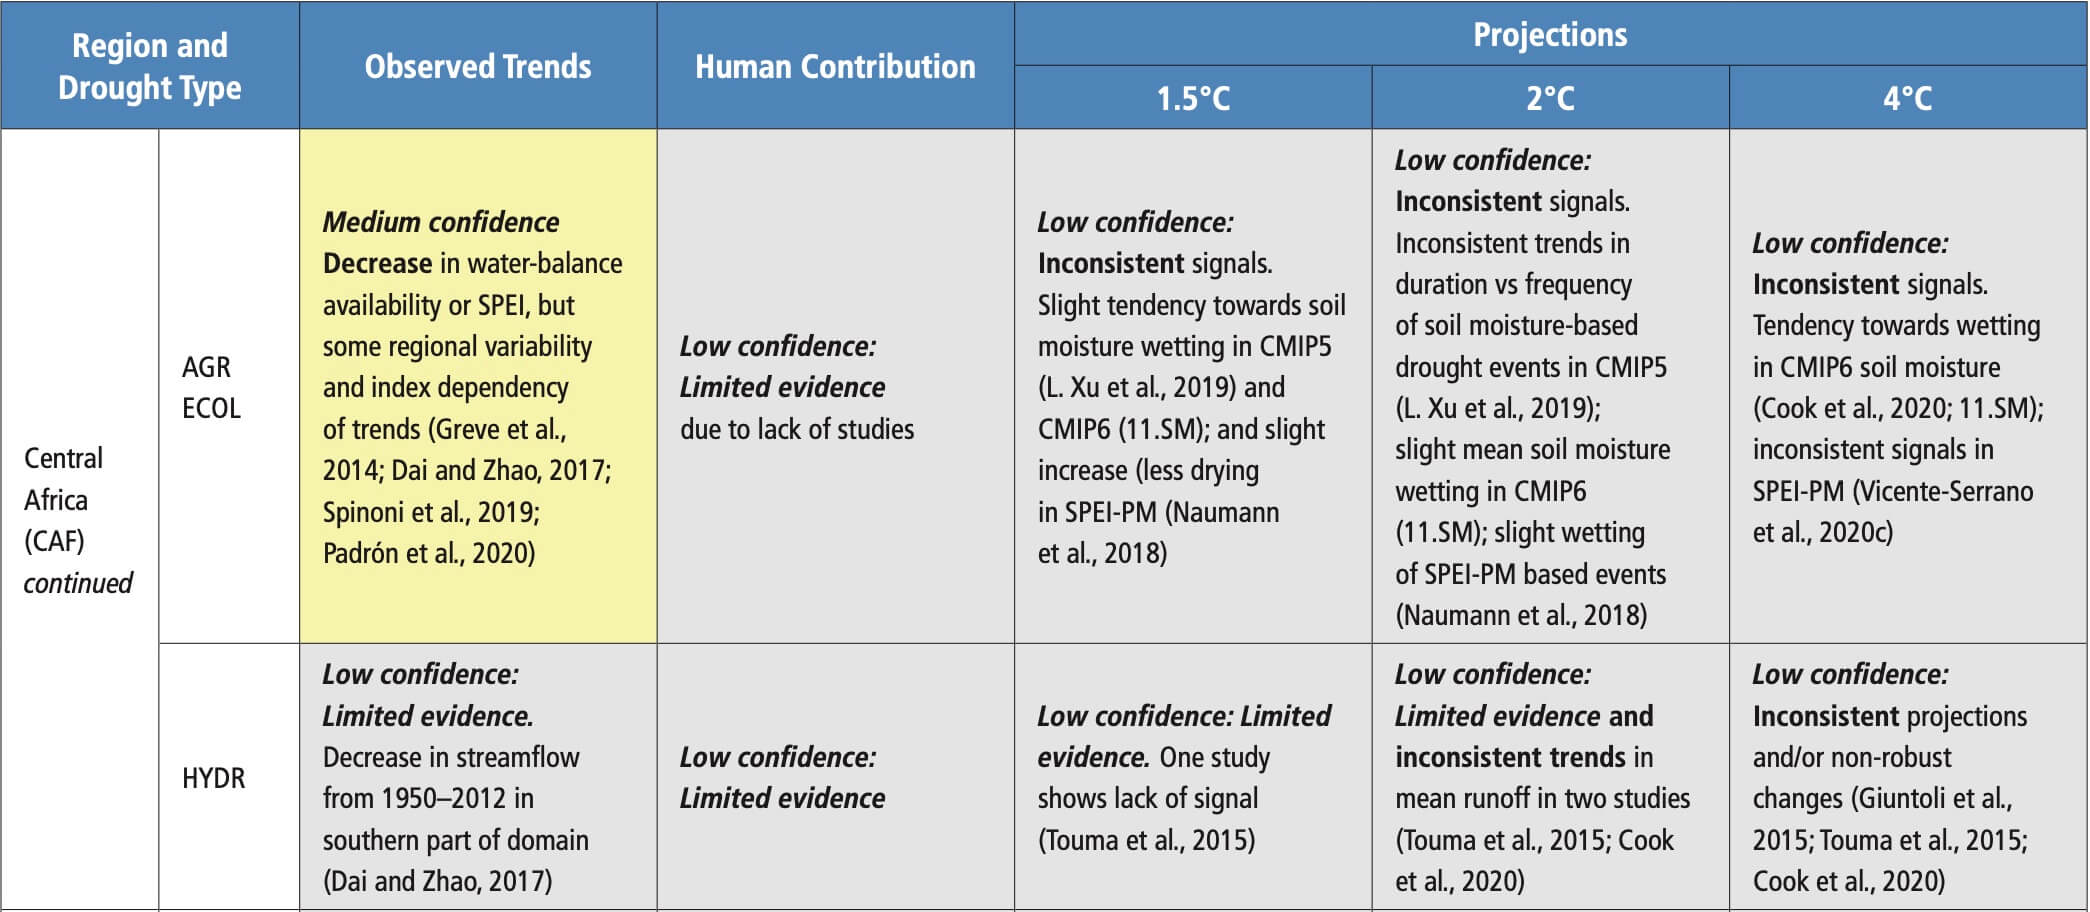
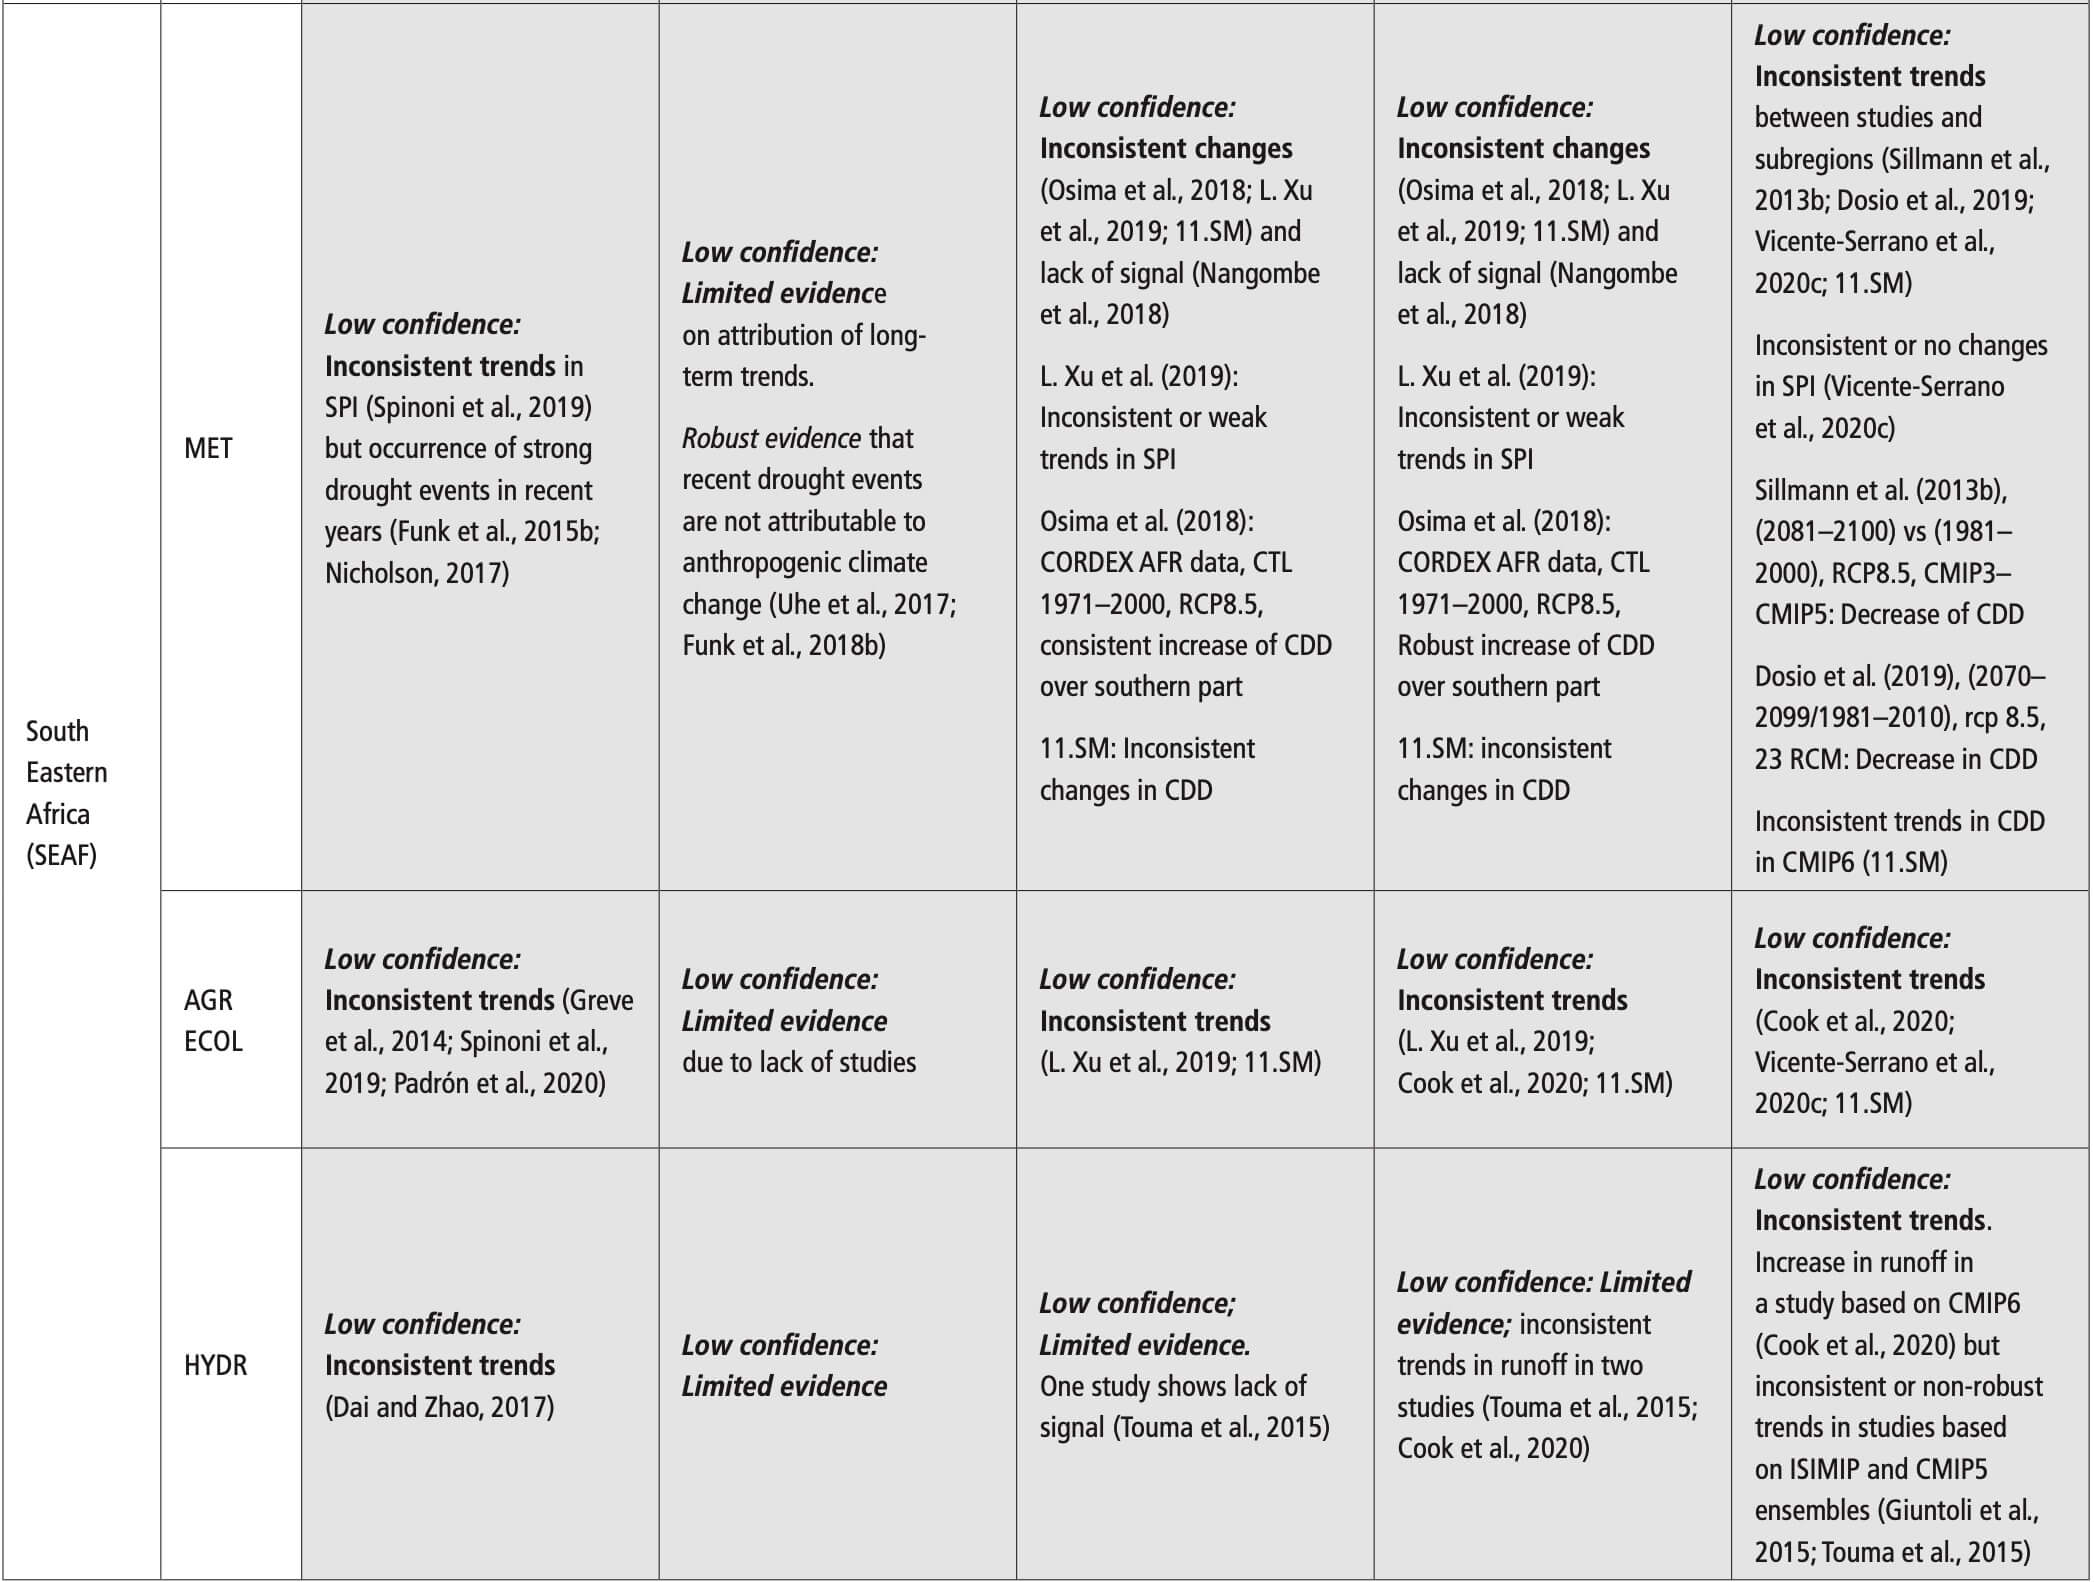
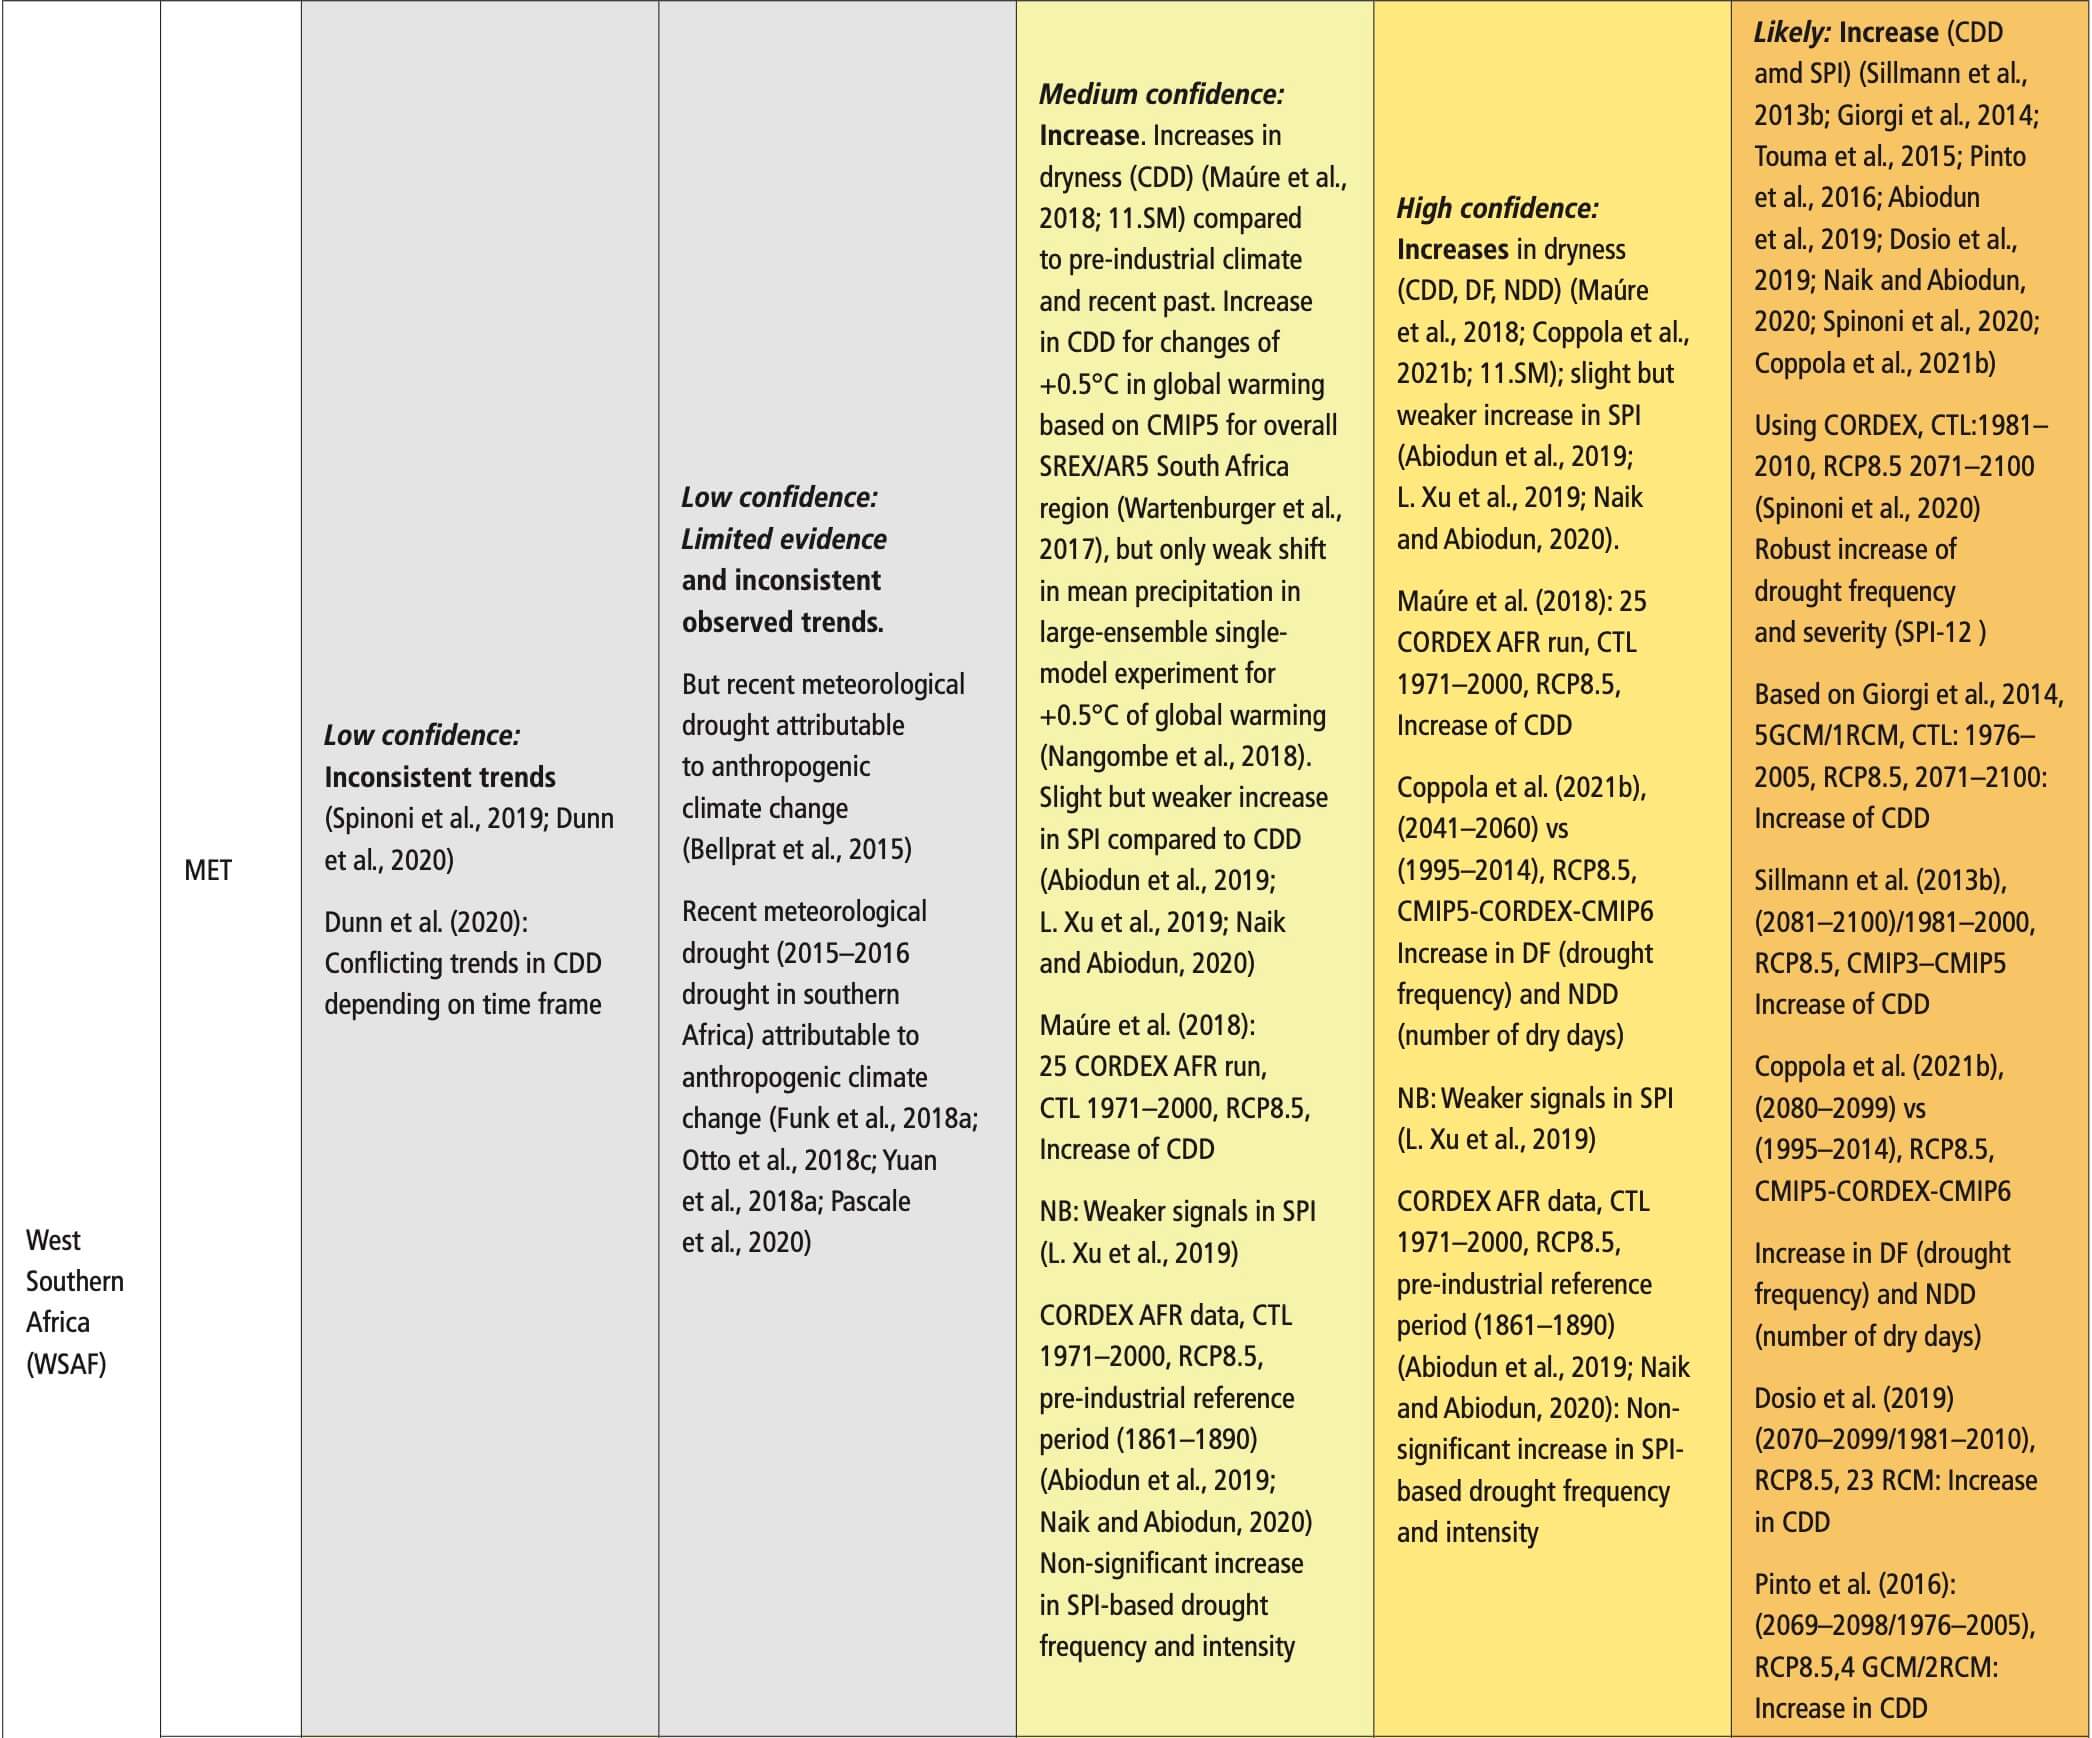
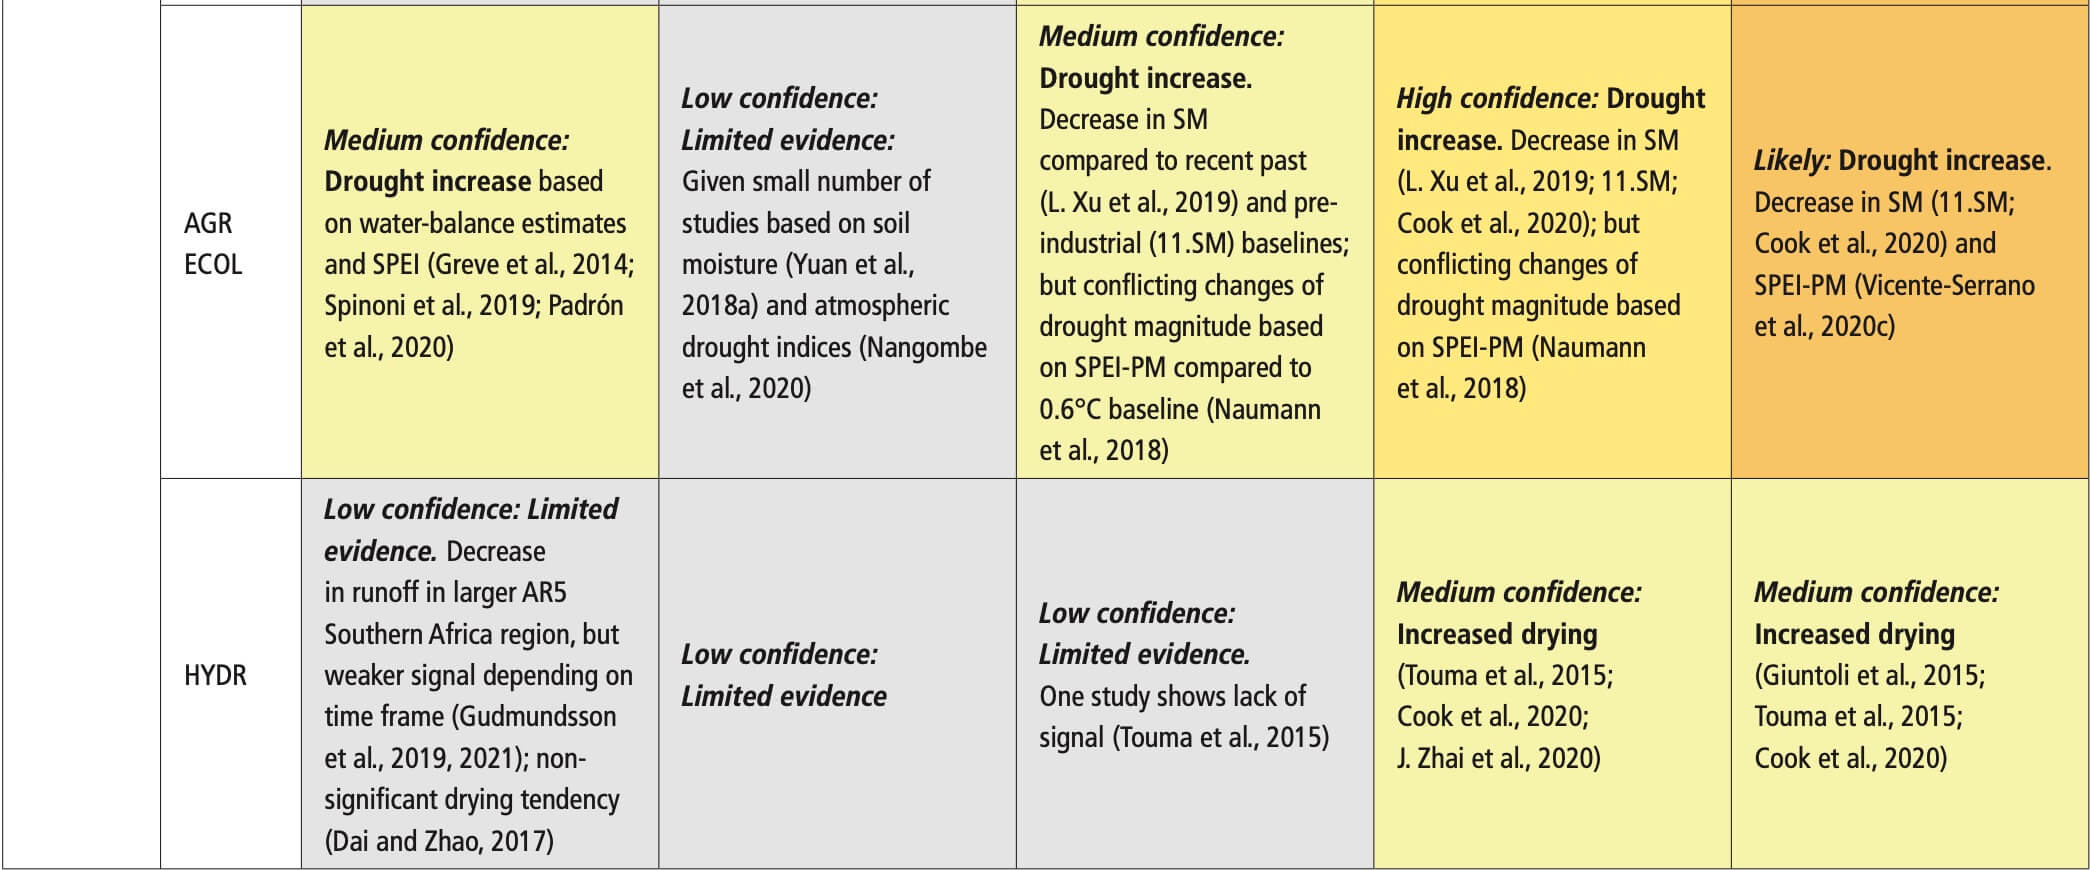
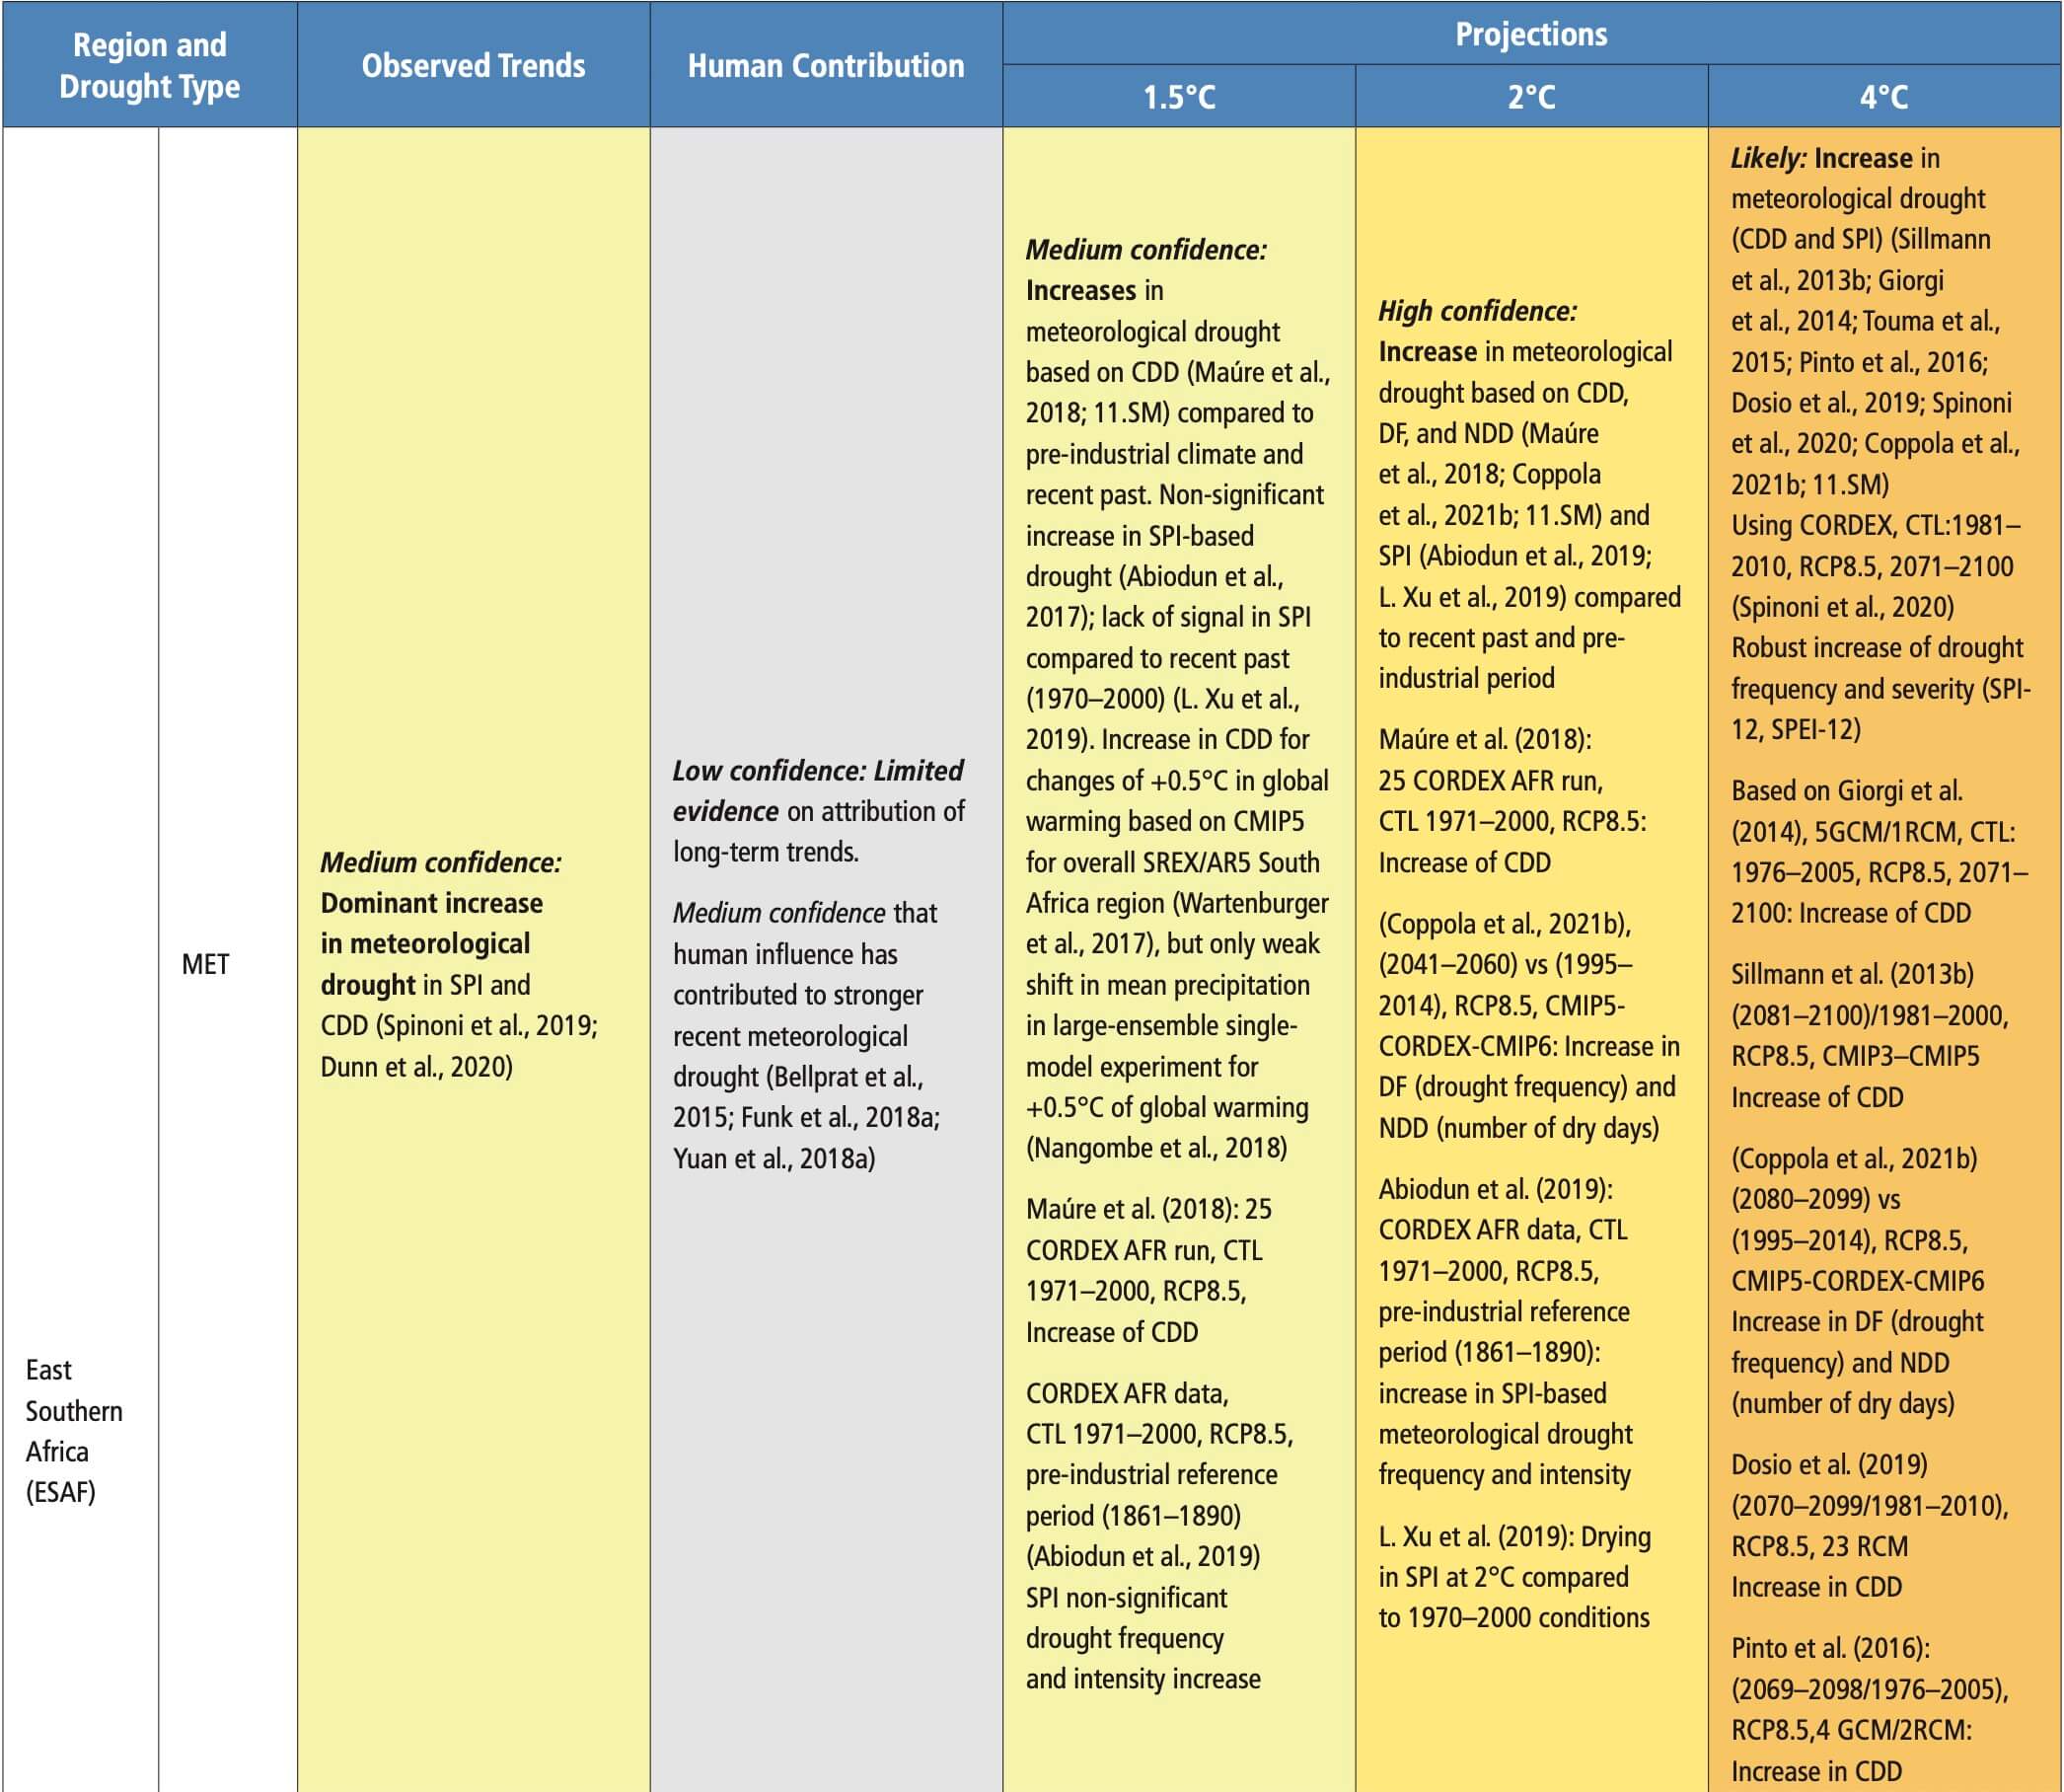
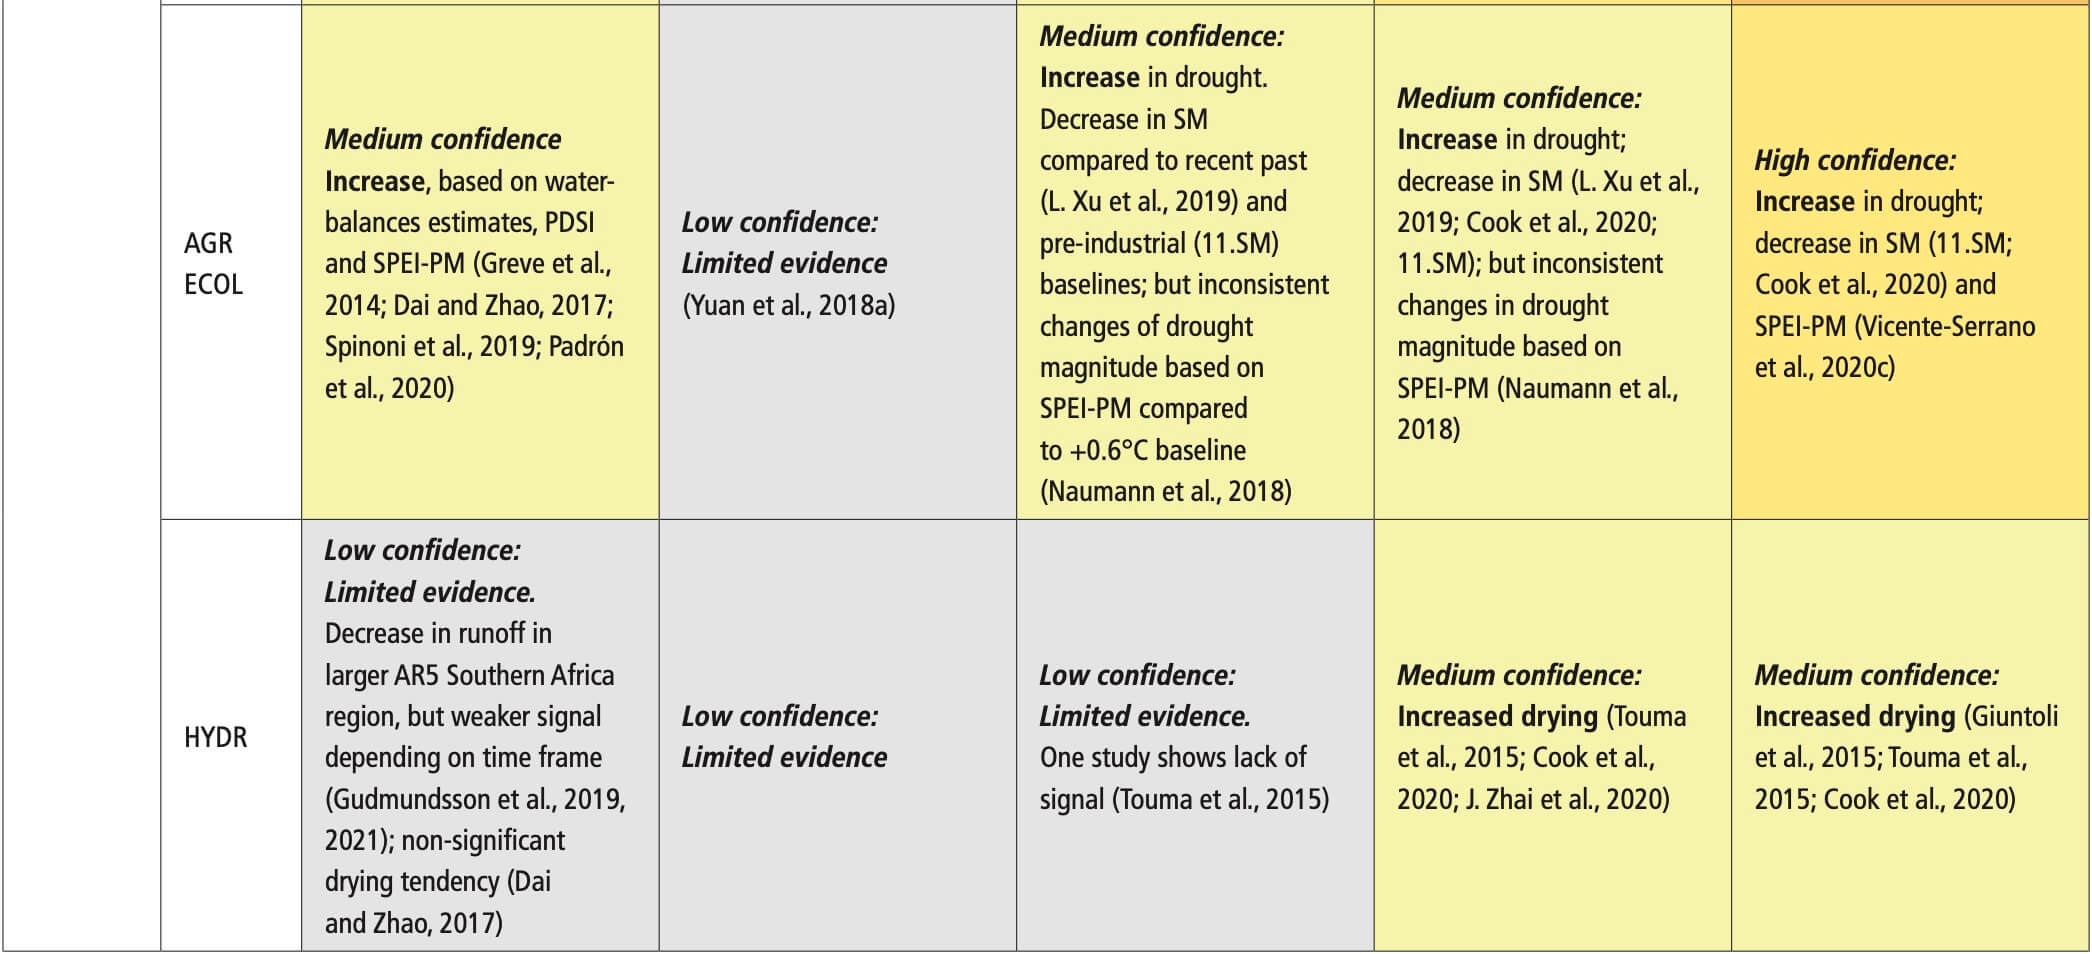
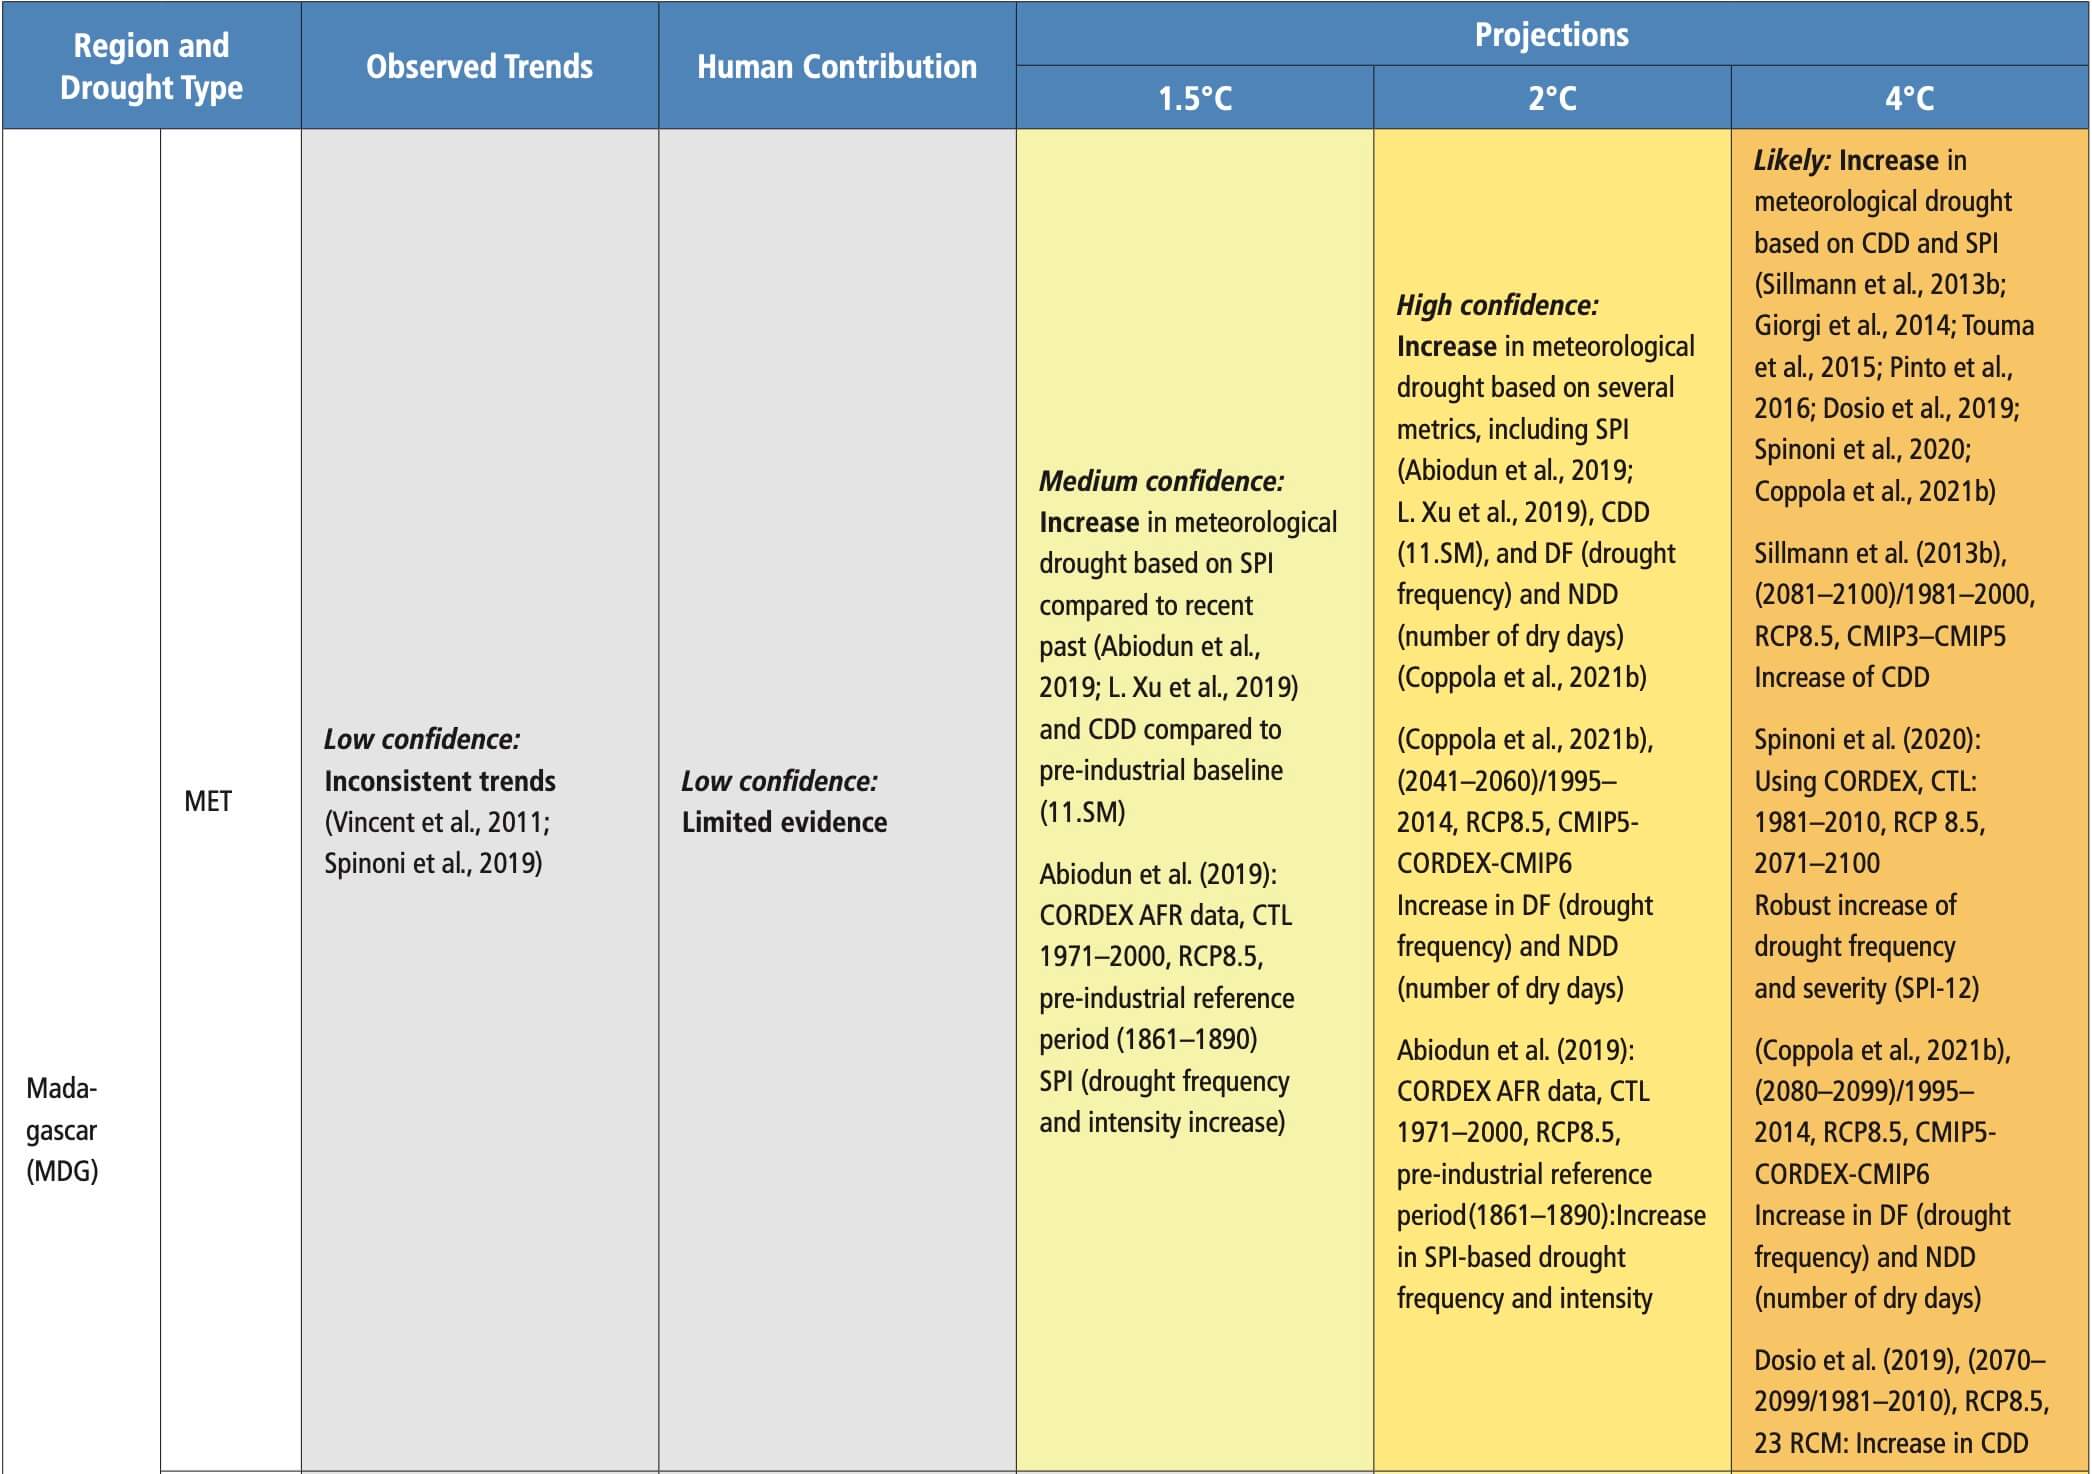
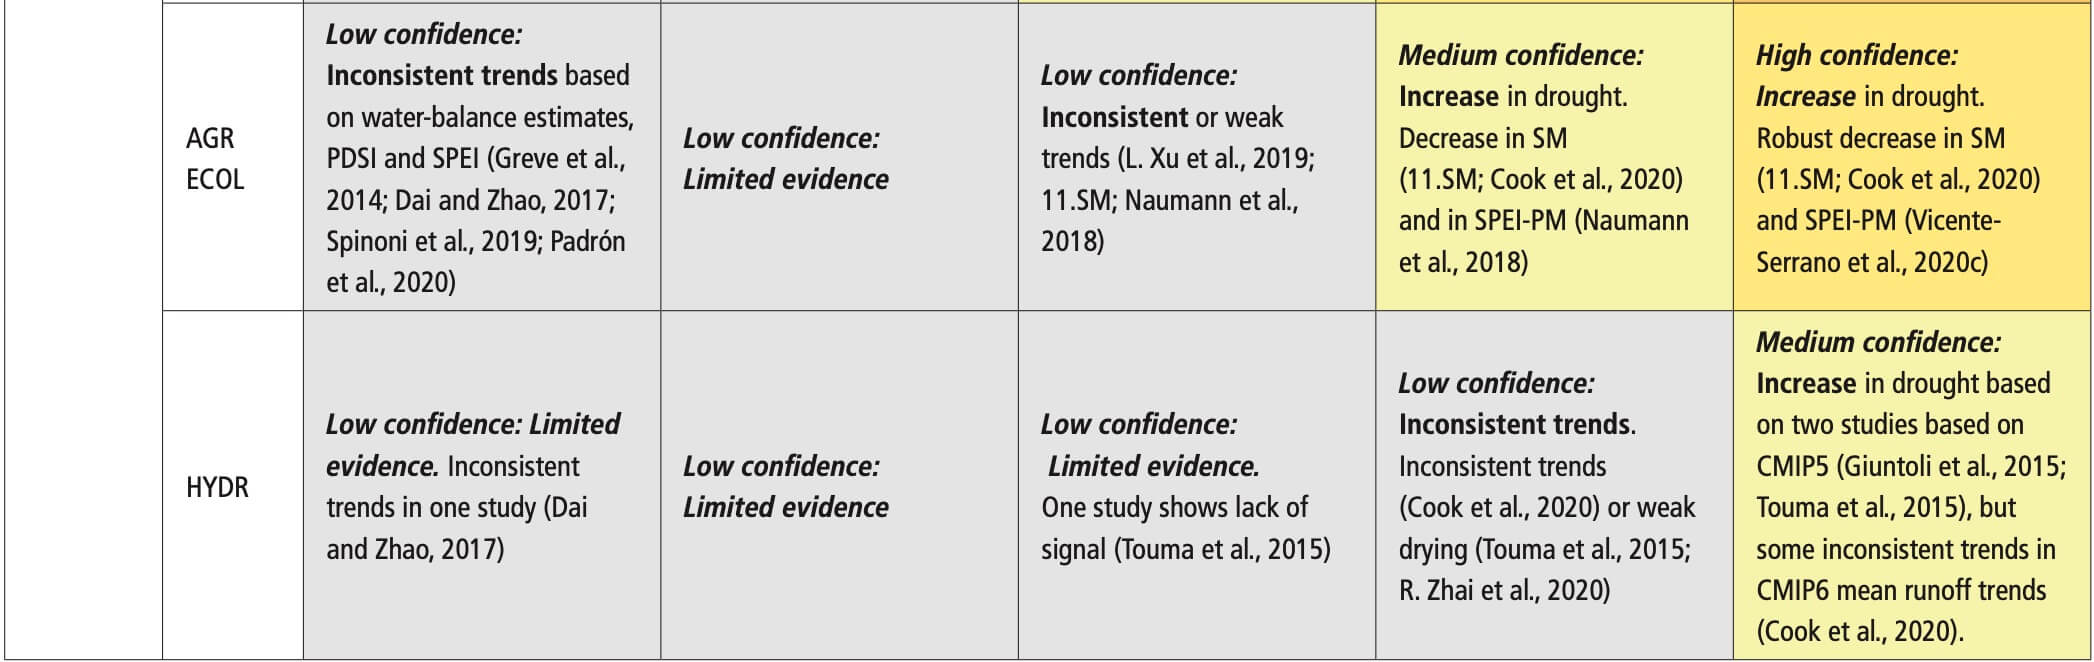 Table 11.7 | Observed trends, human contribution to observed trends, and projected changes at 1.5°C, 2°C and 4°C of global warming for temperature extremes in Asia, subdivided by AR6 regions. See Sections 11.9.1 and 11.9.2 for details.
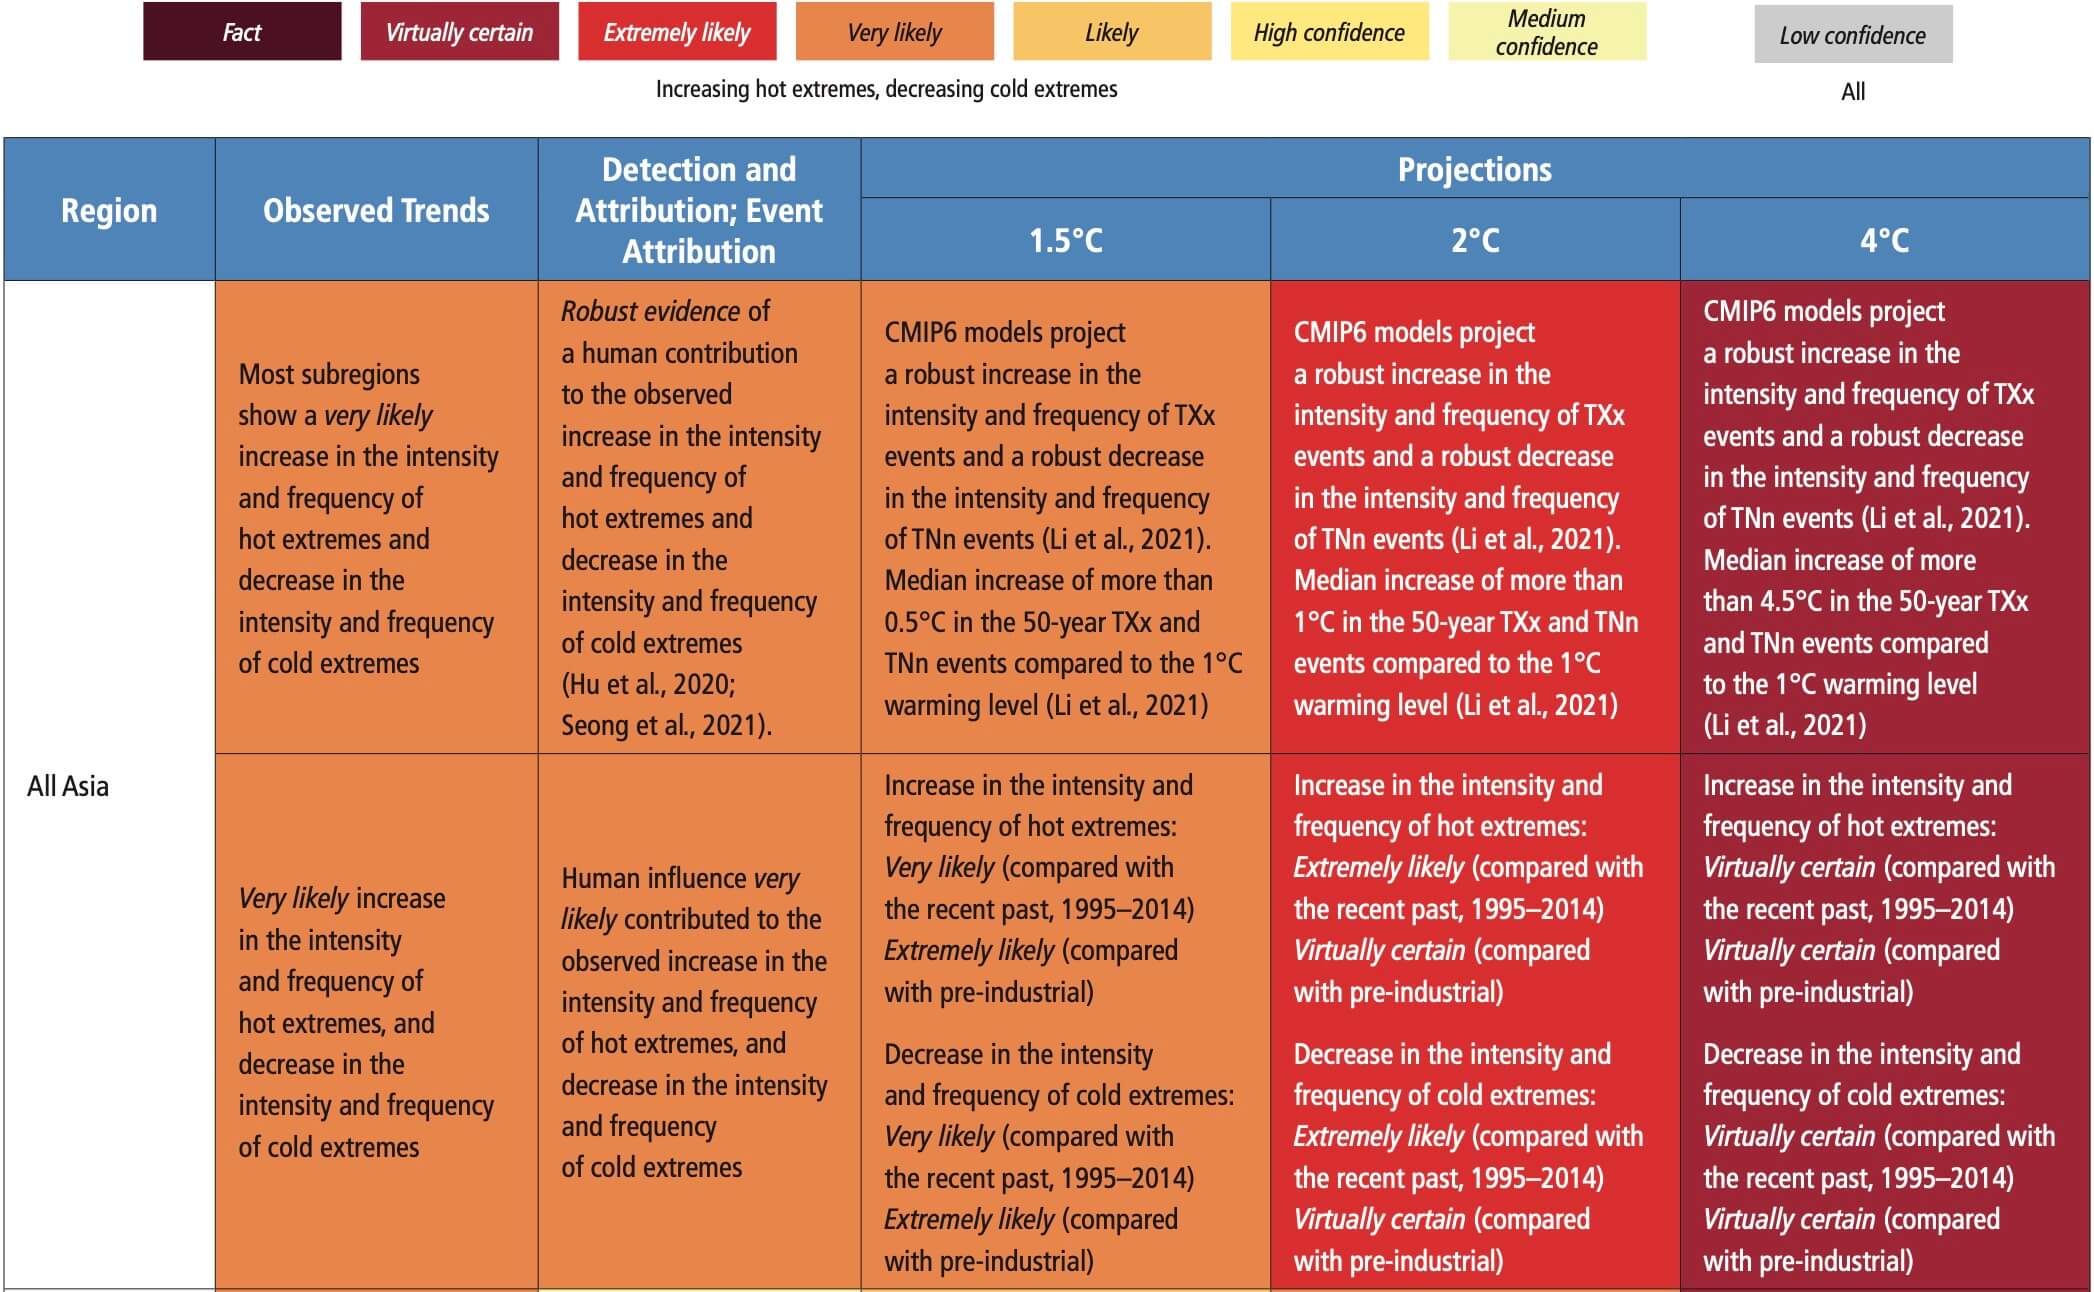
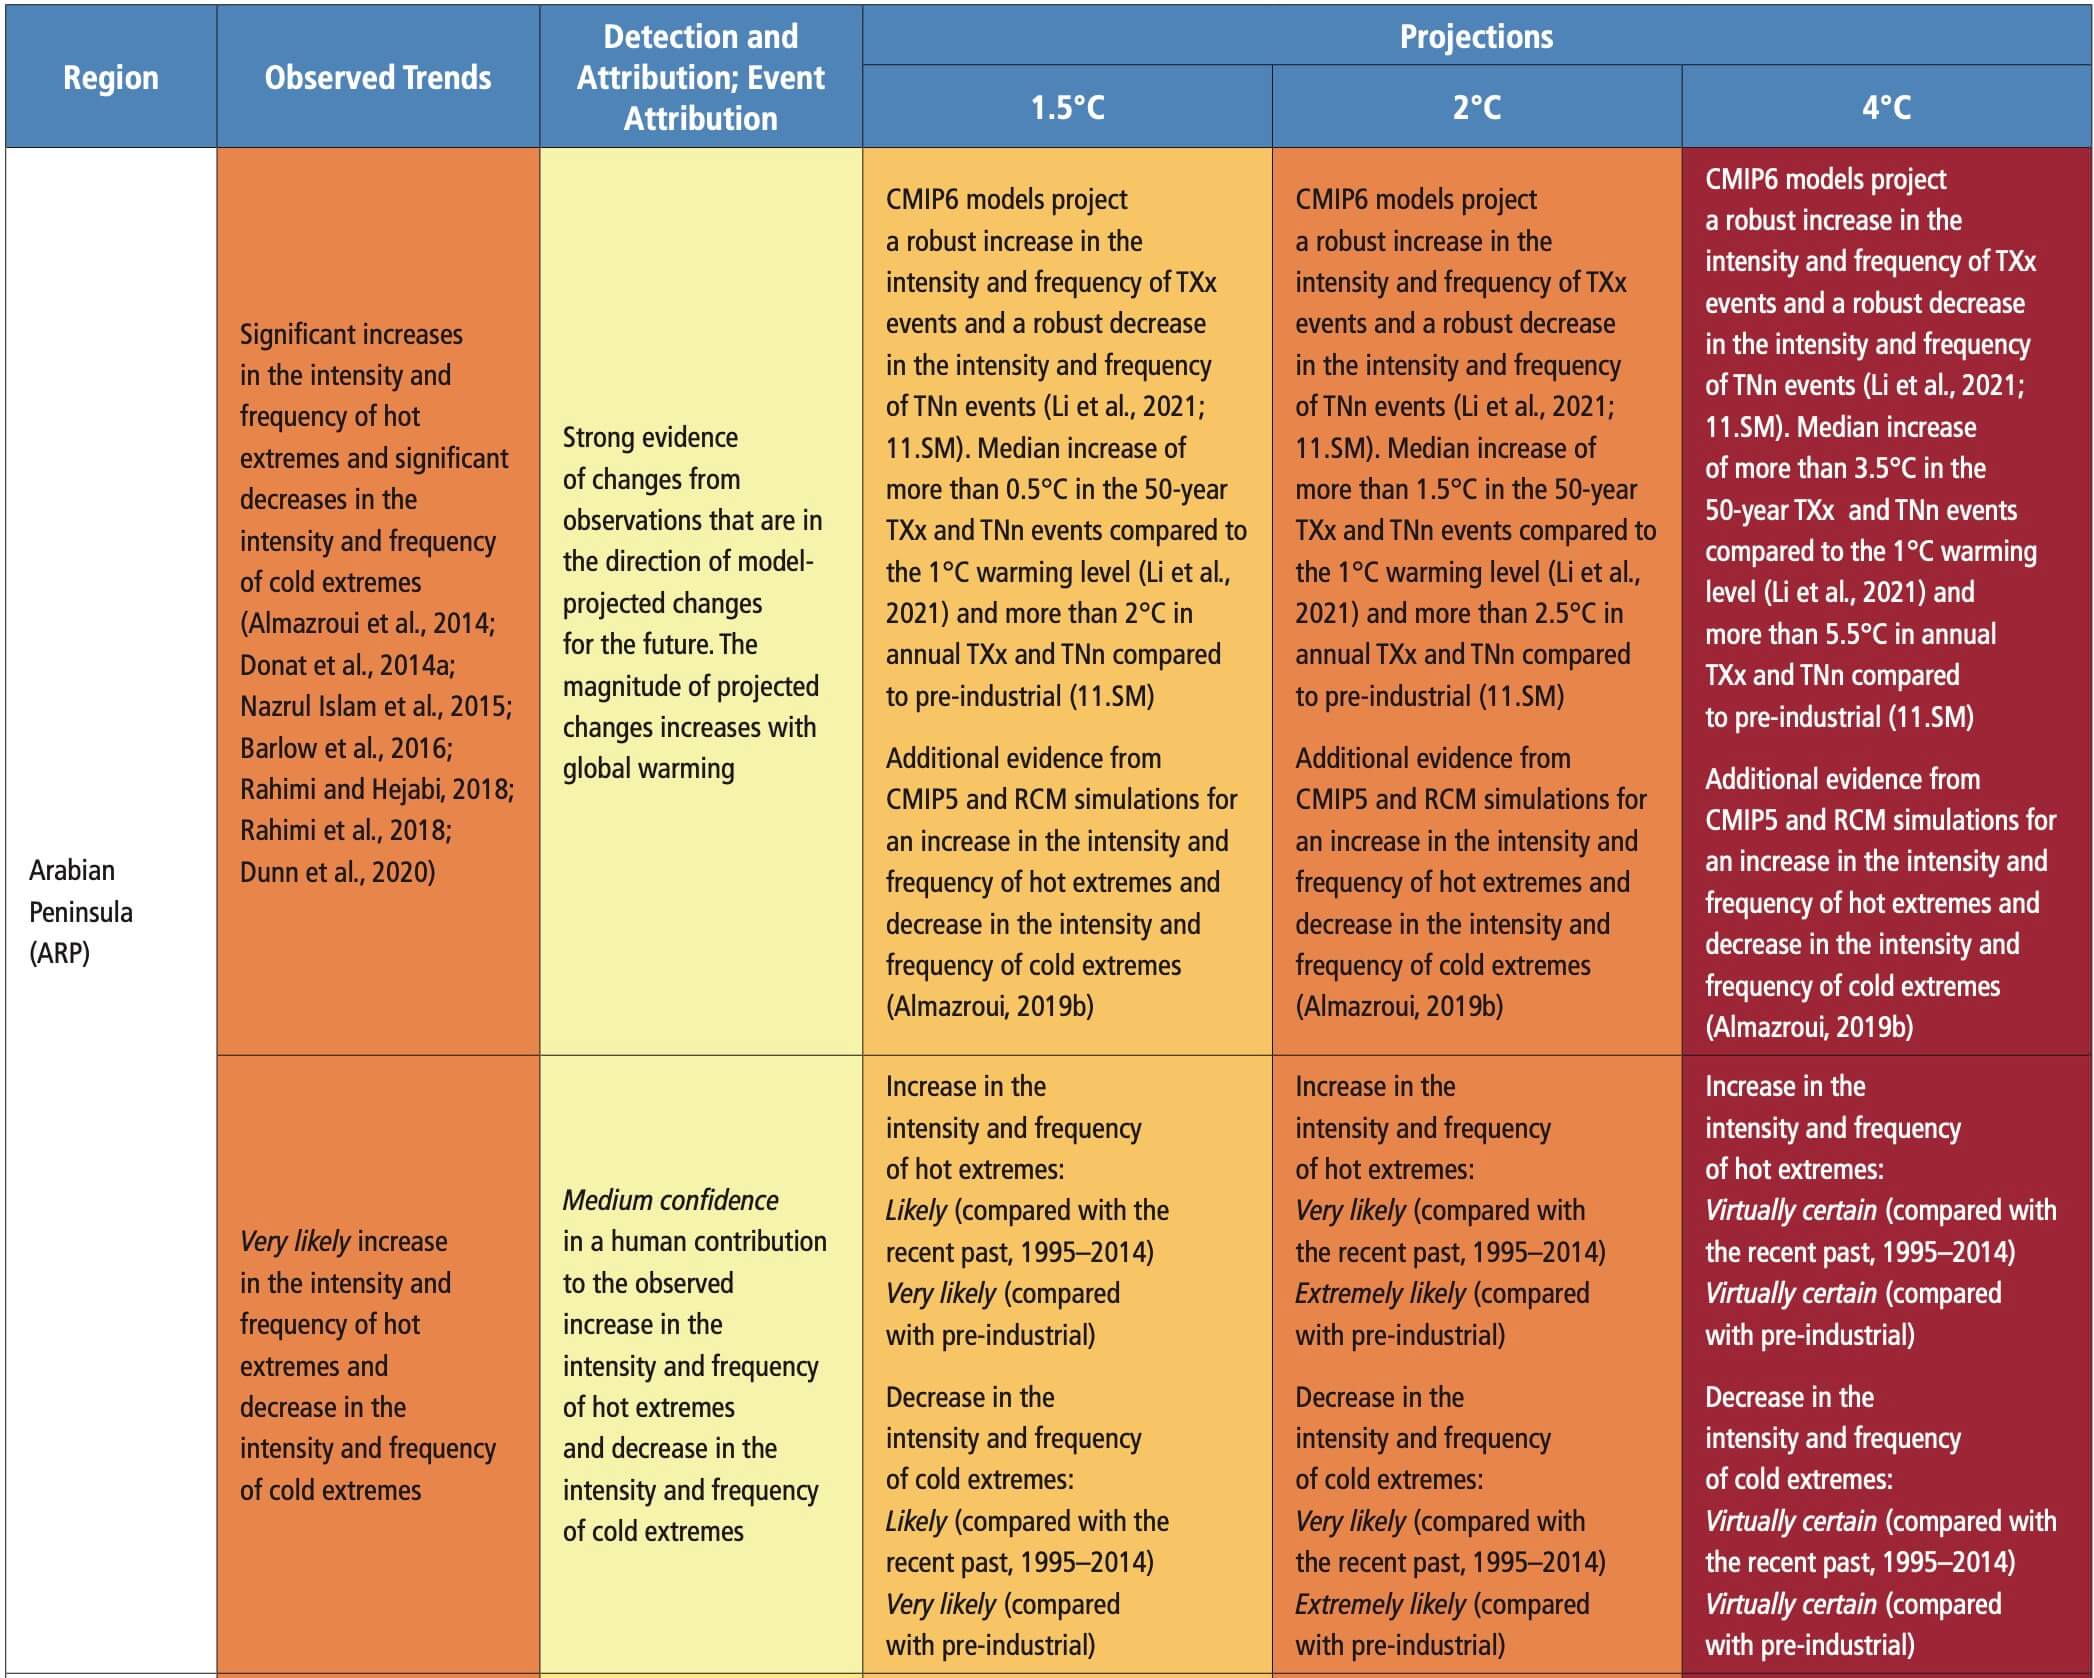
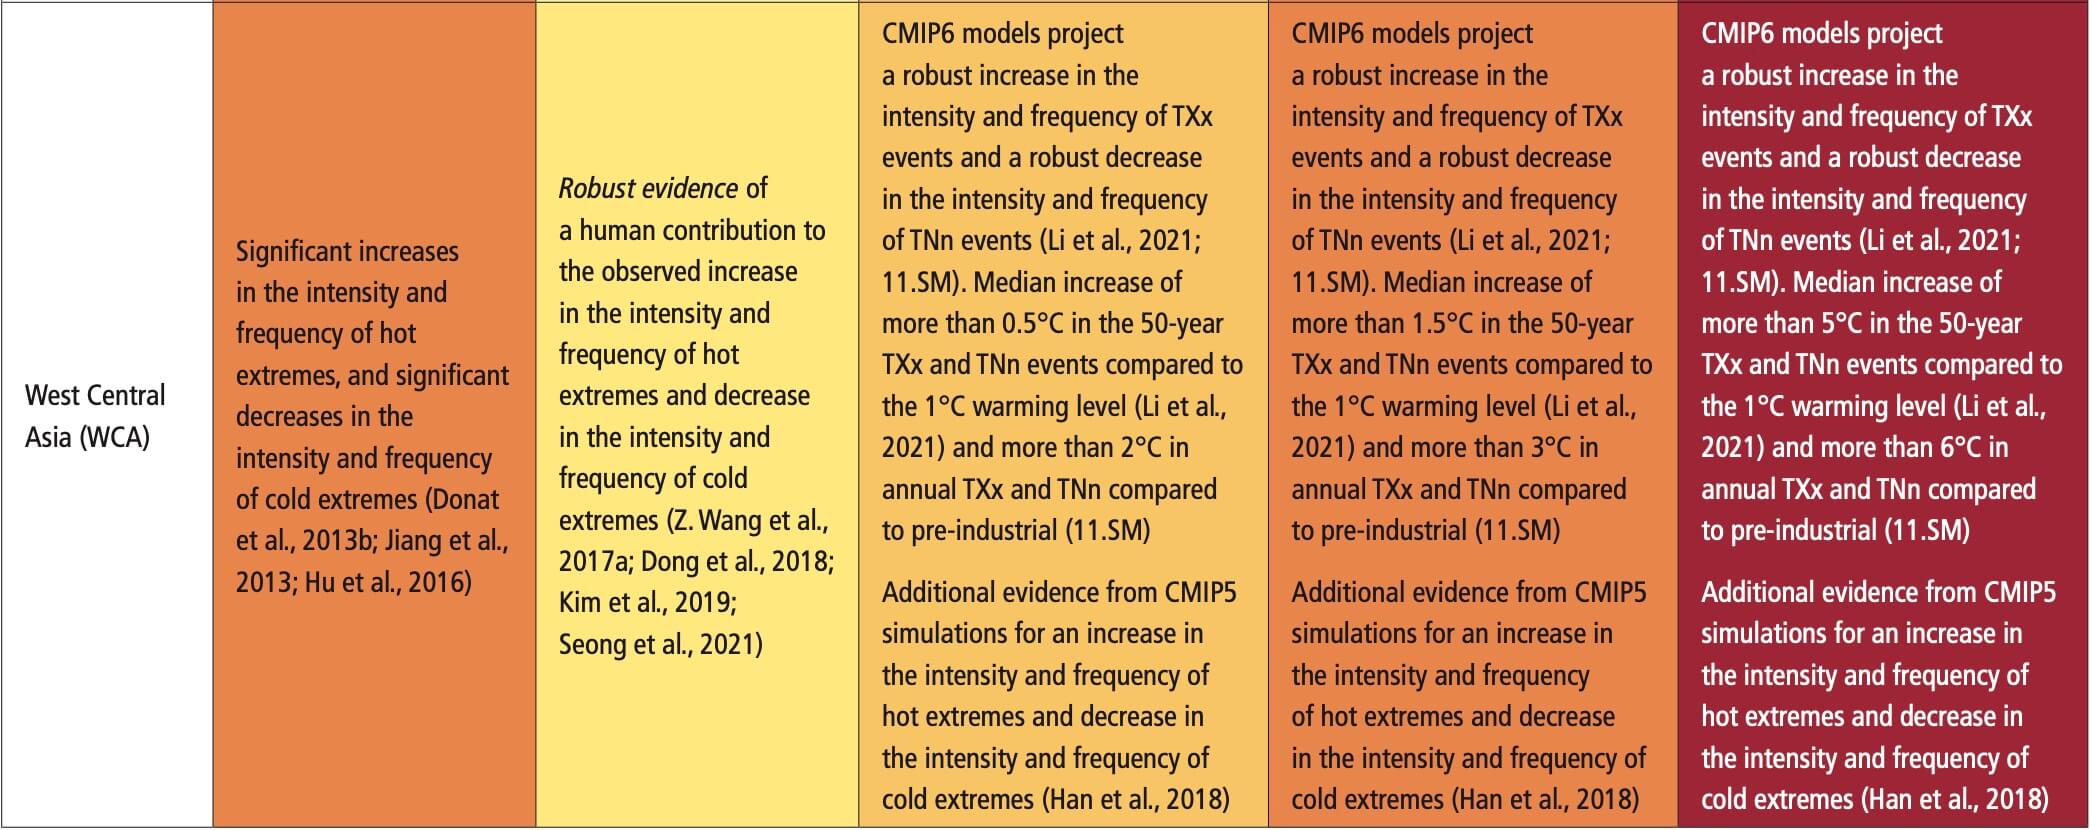
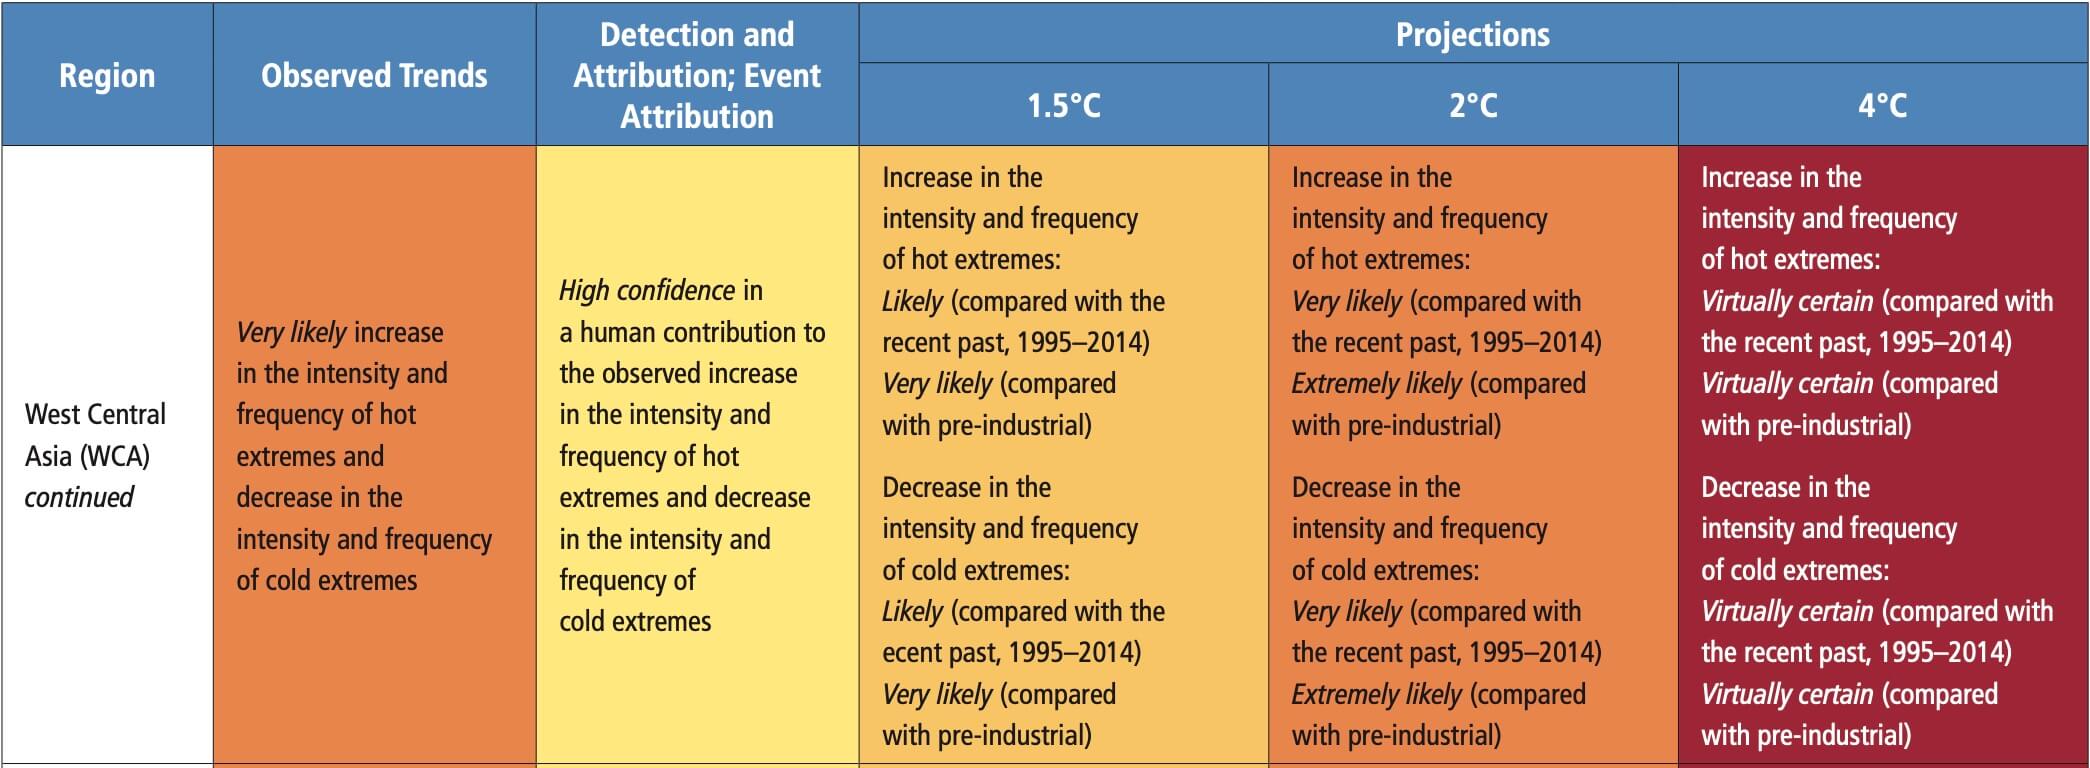
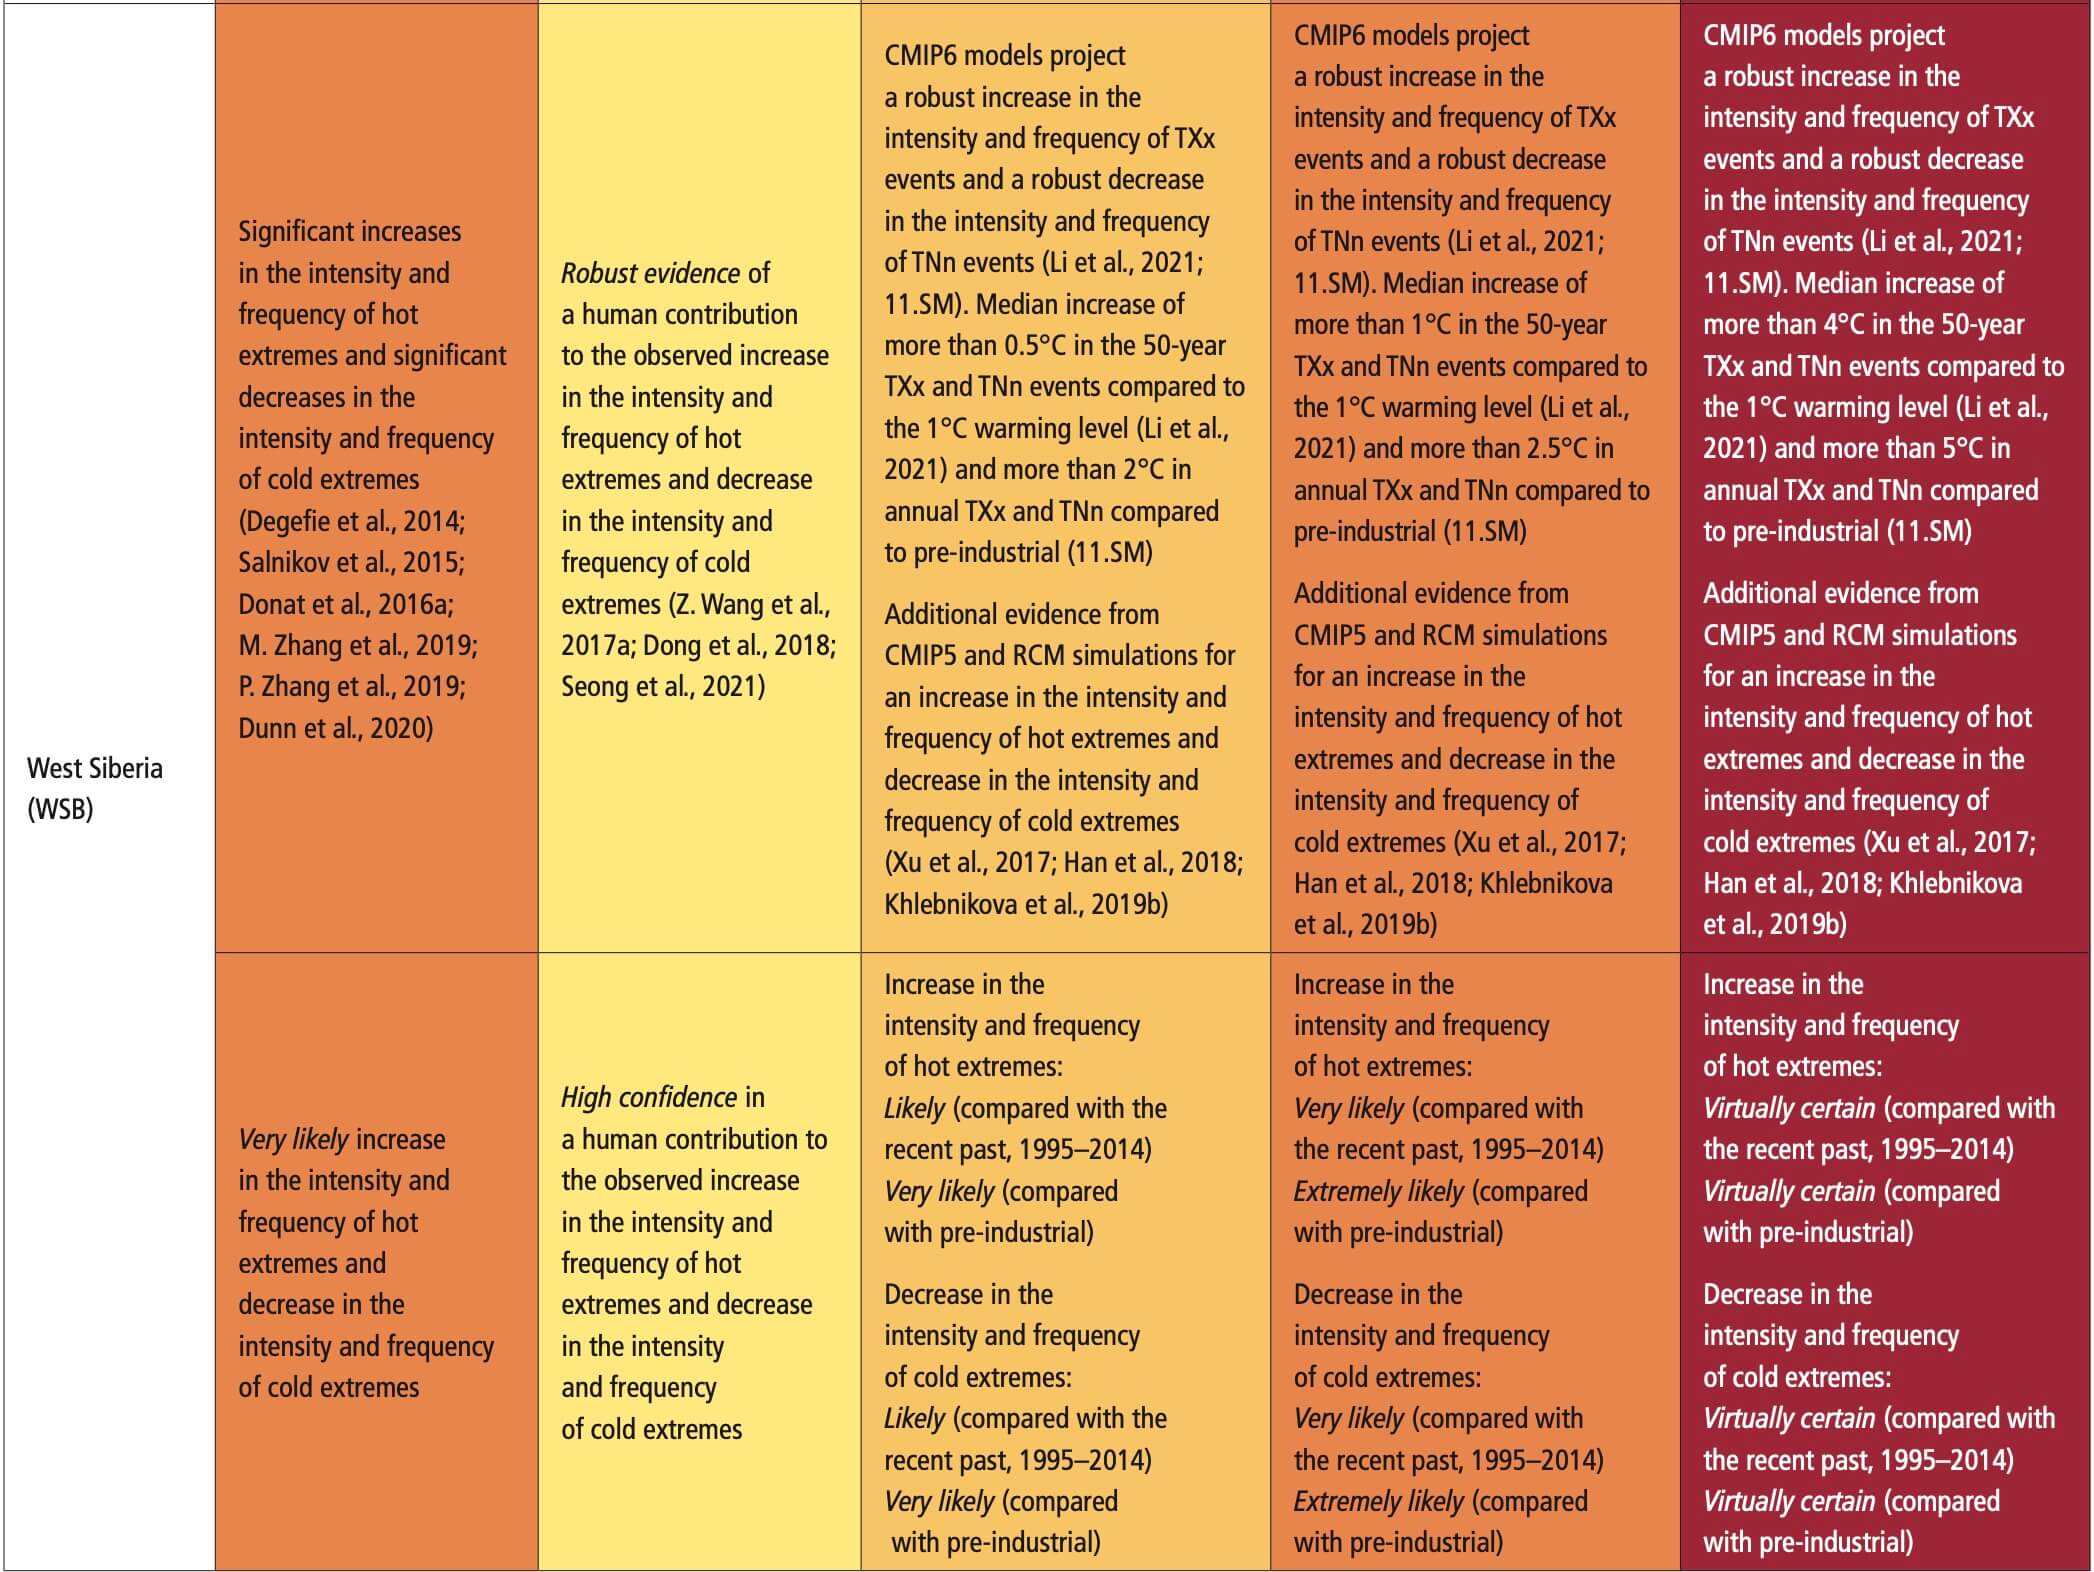
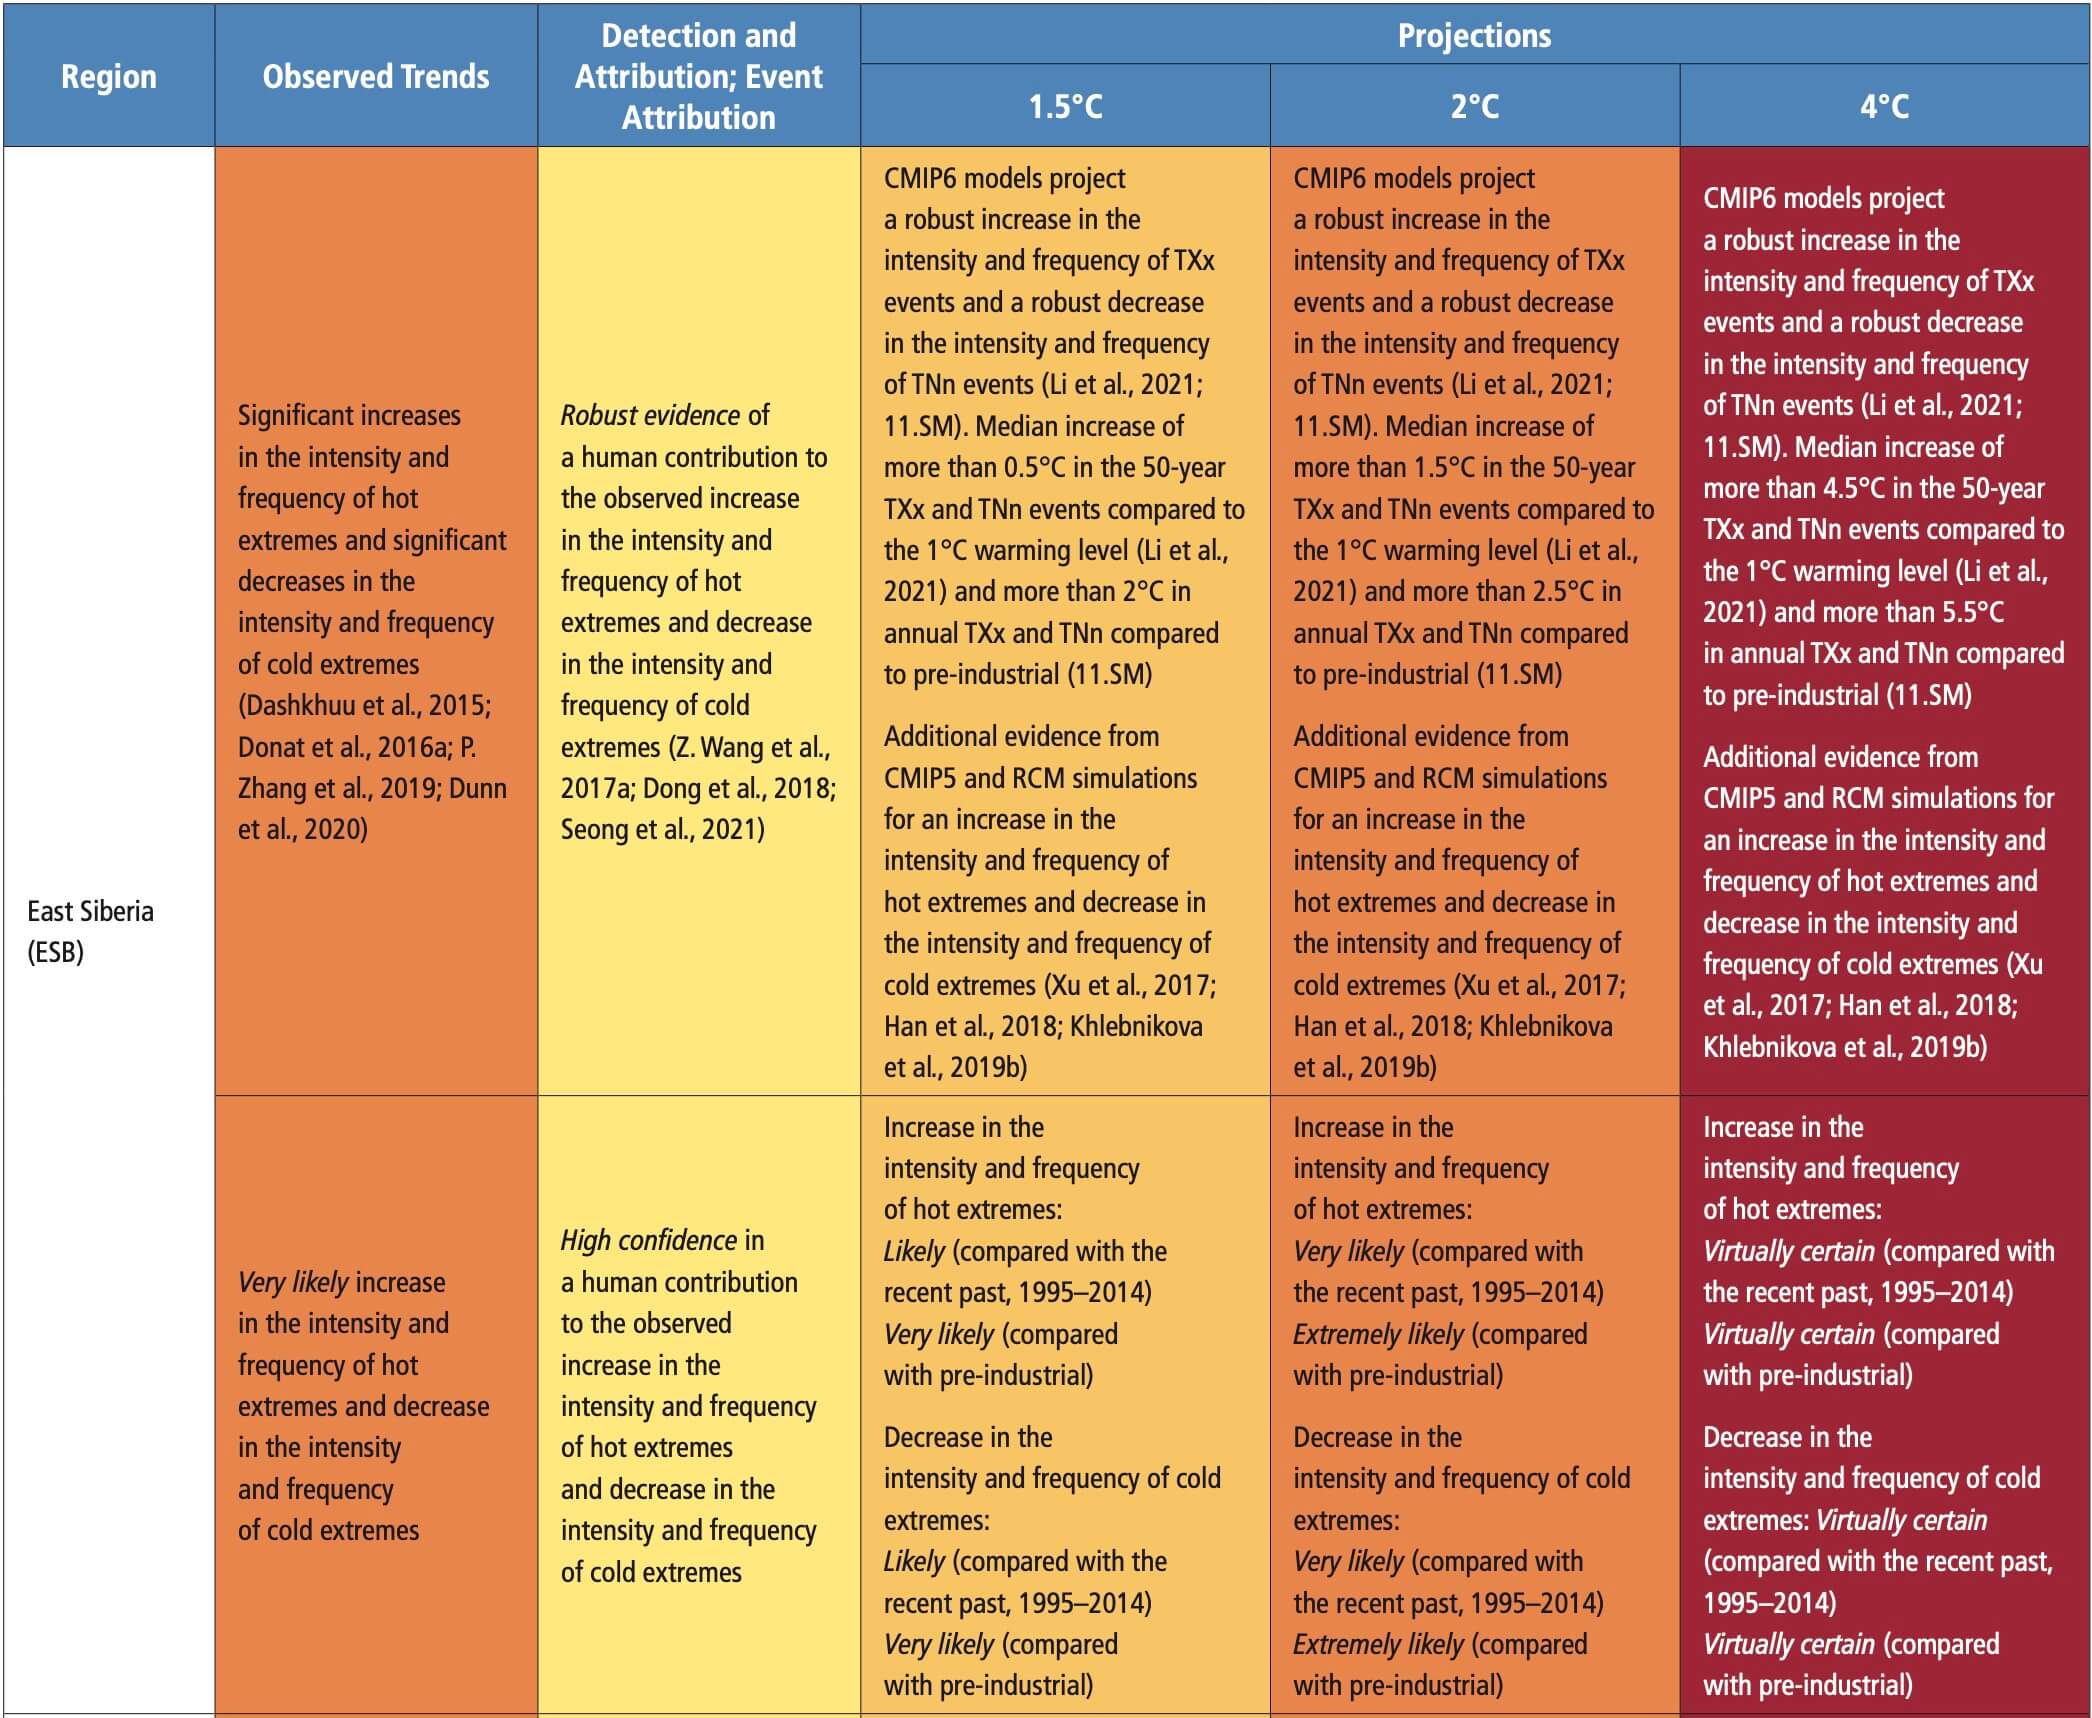
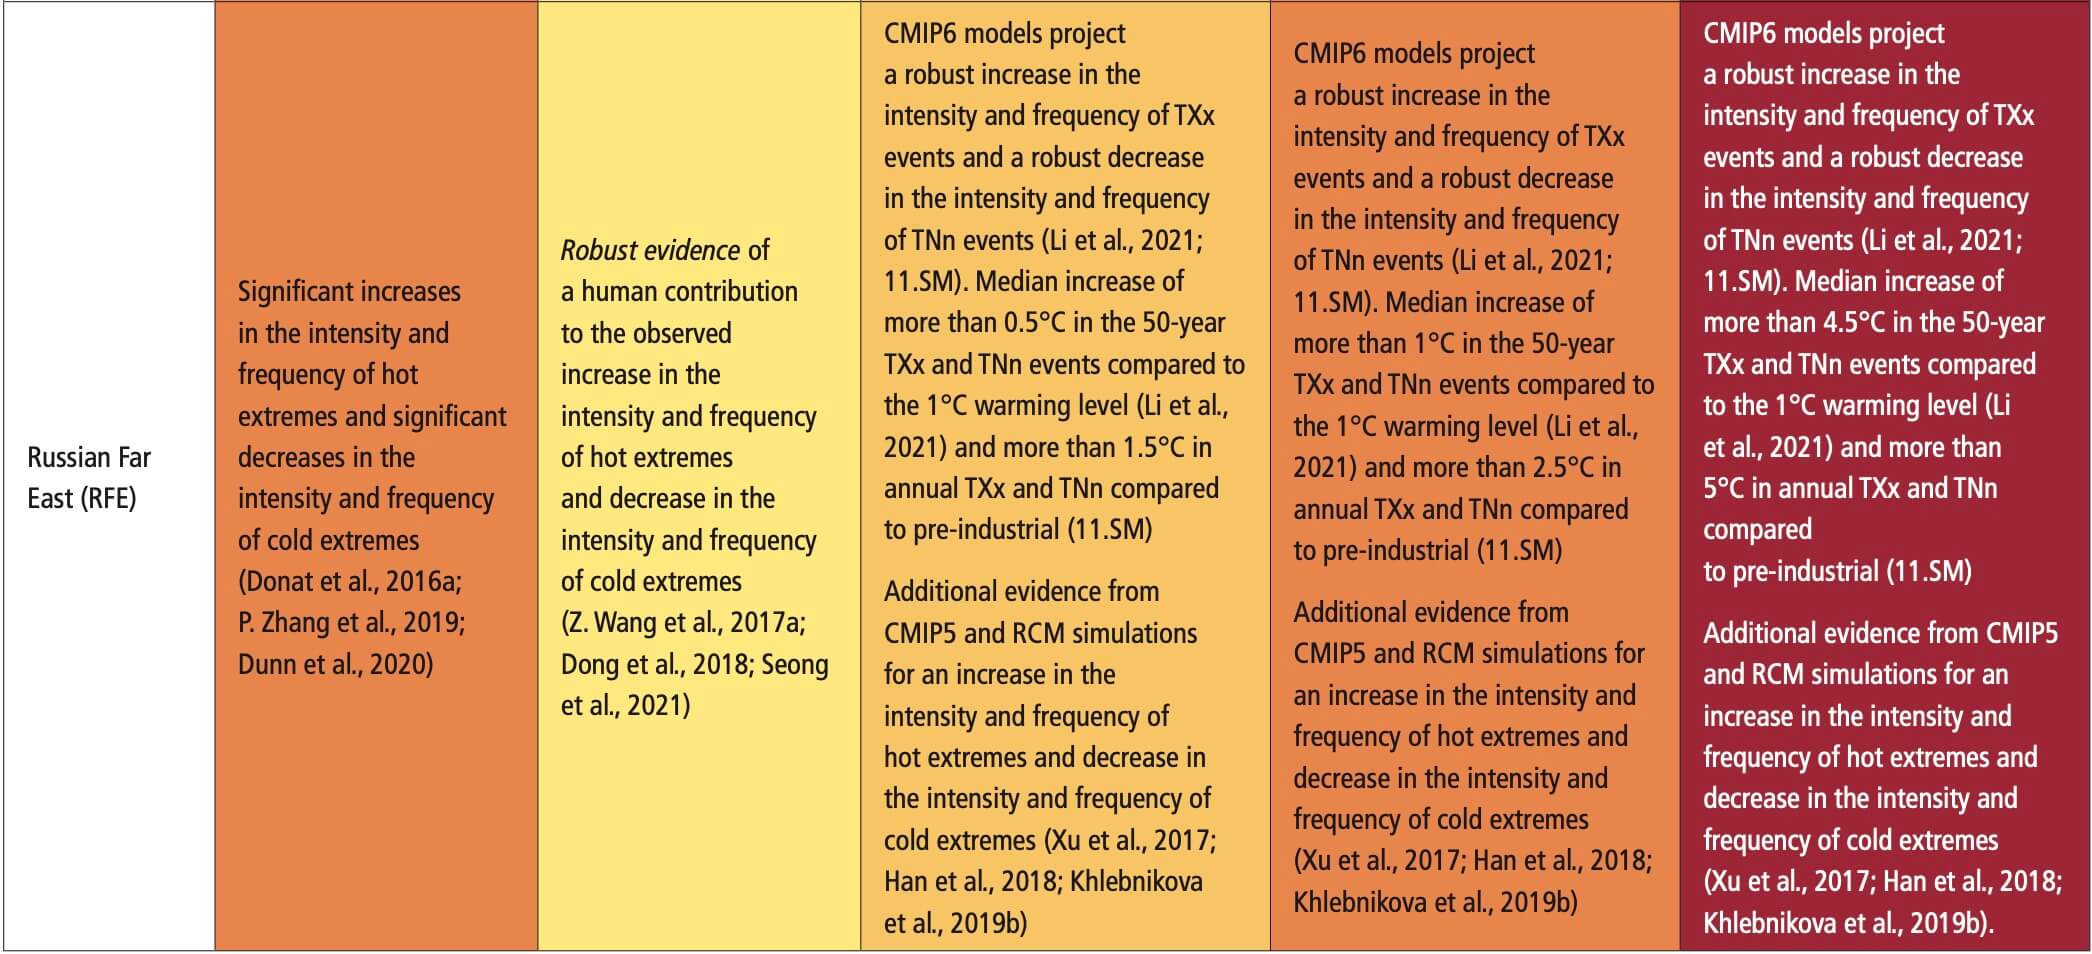
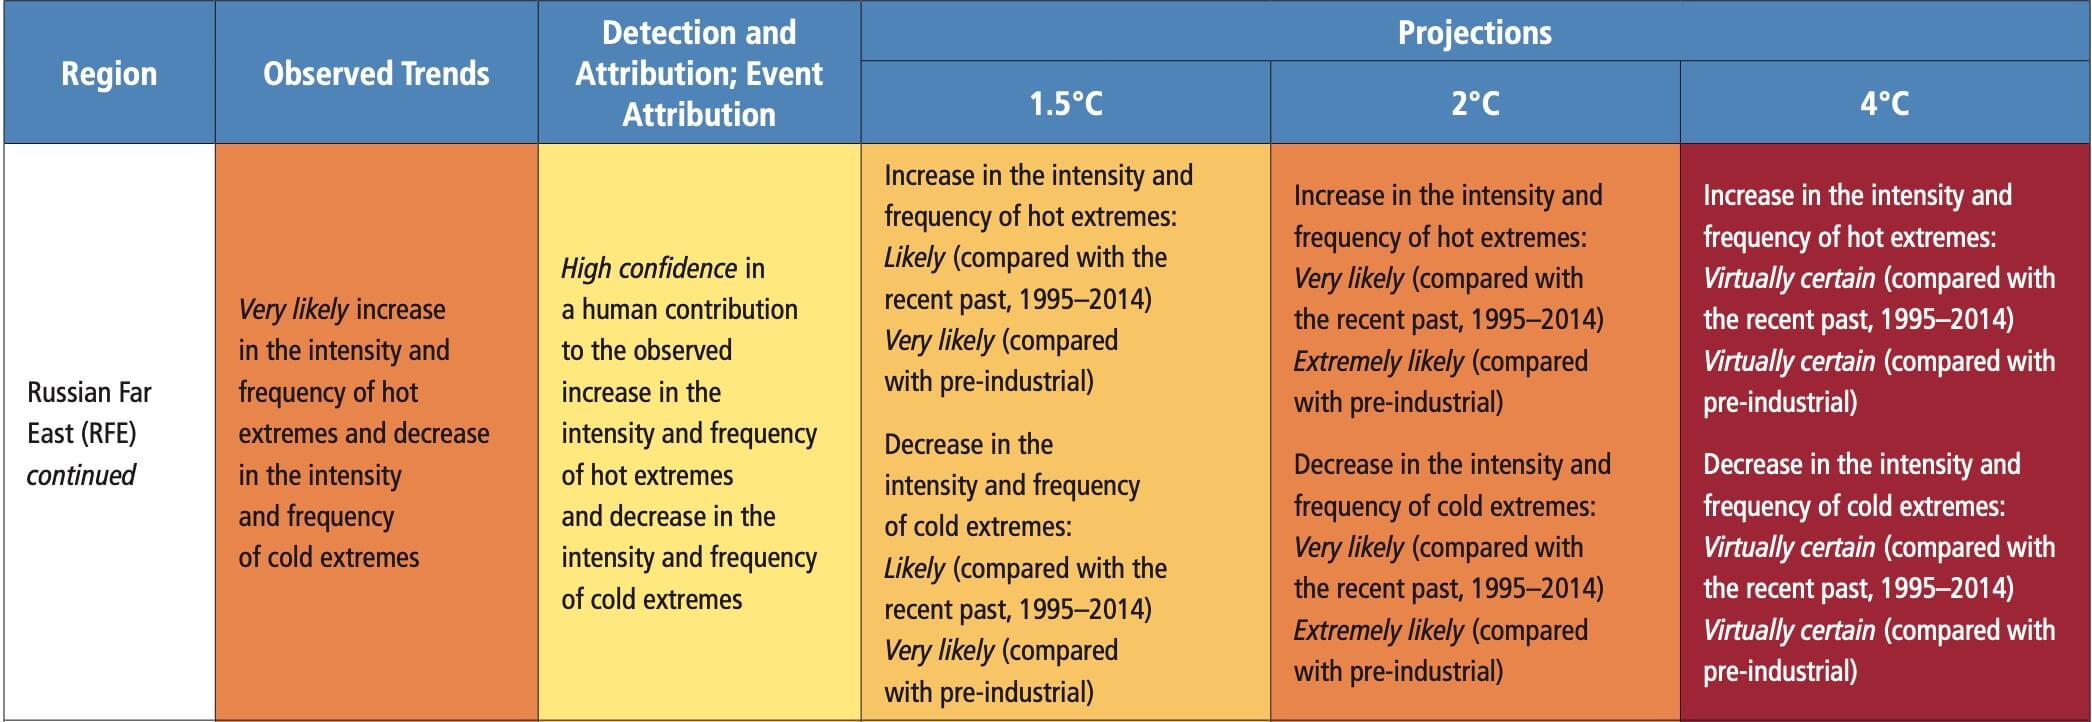
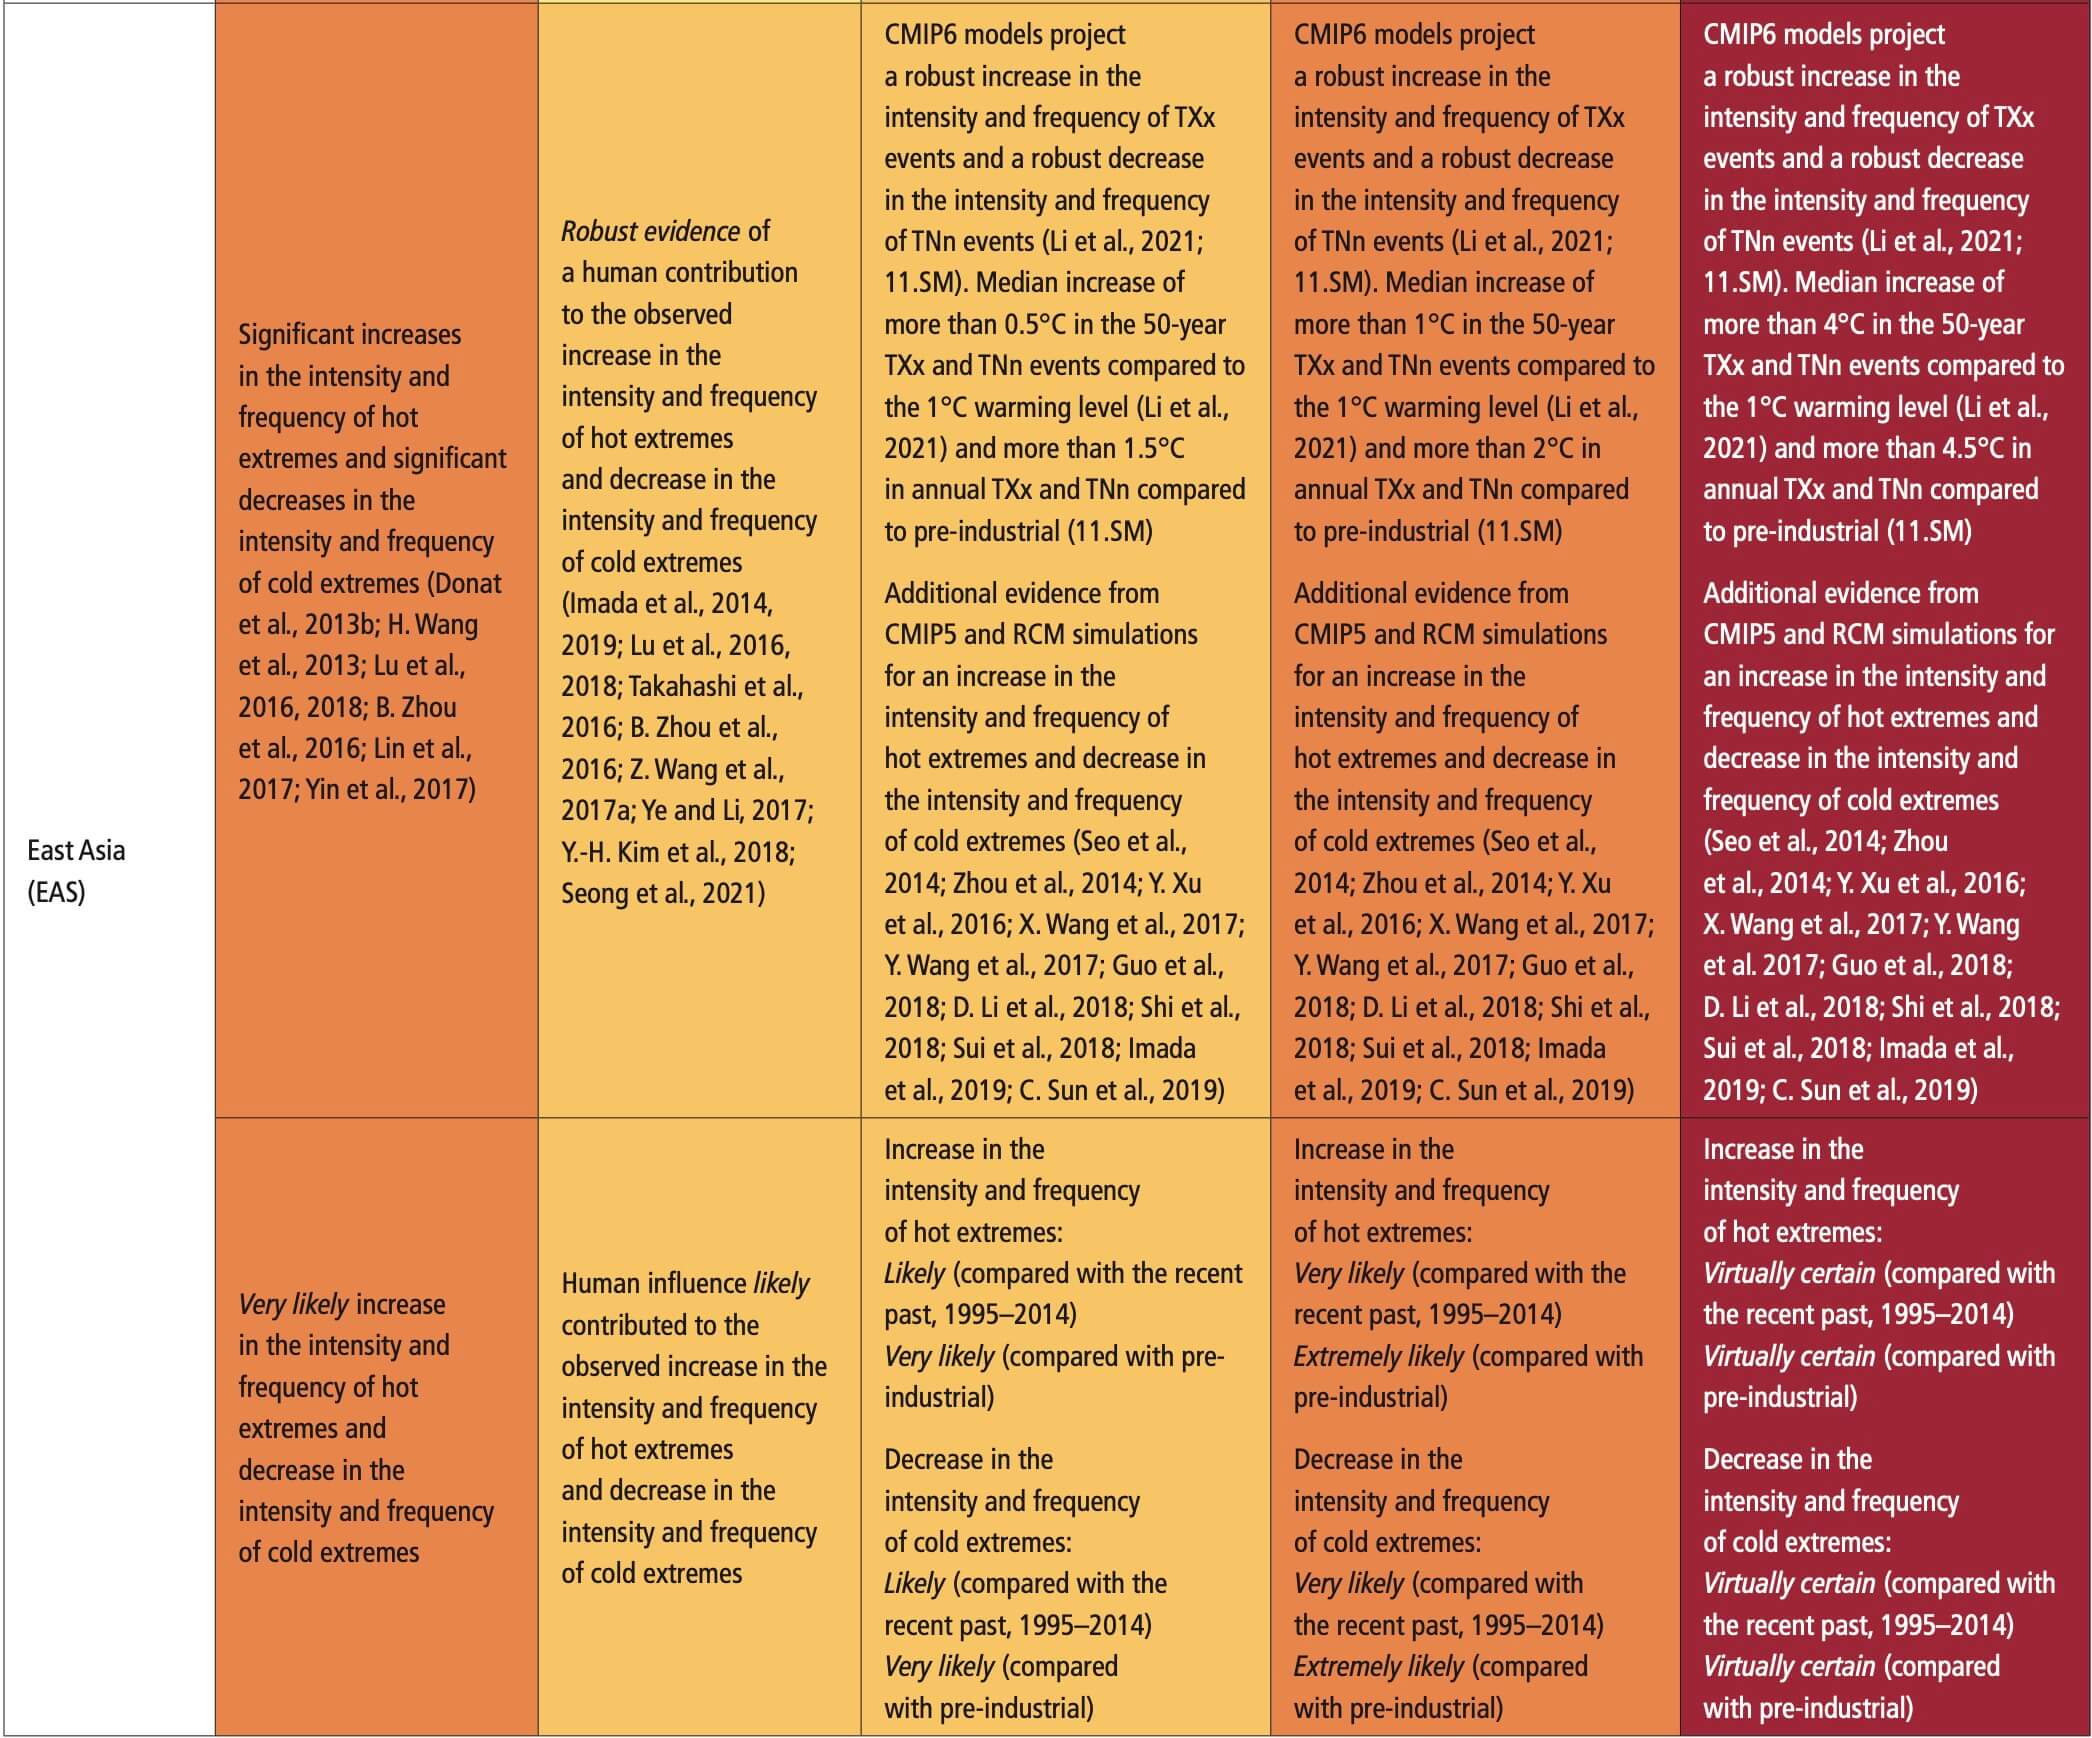
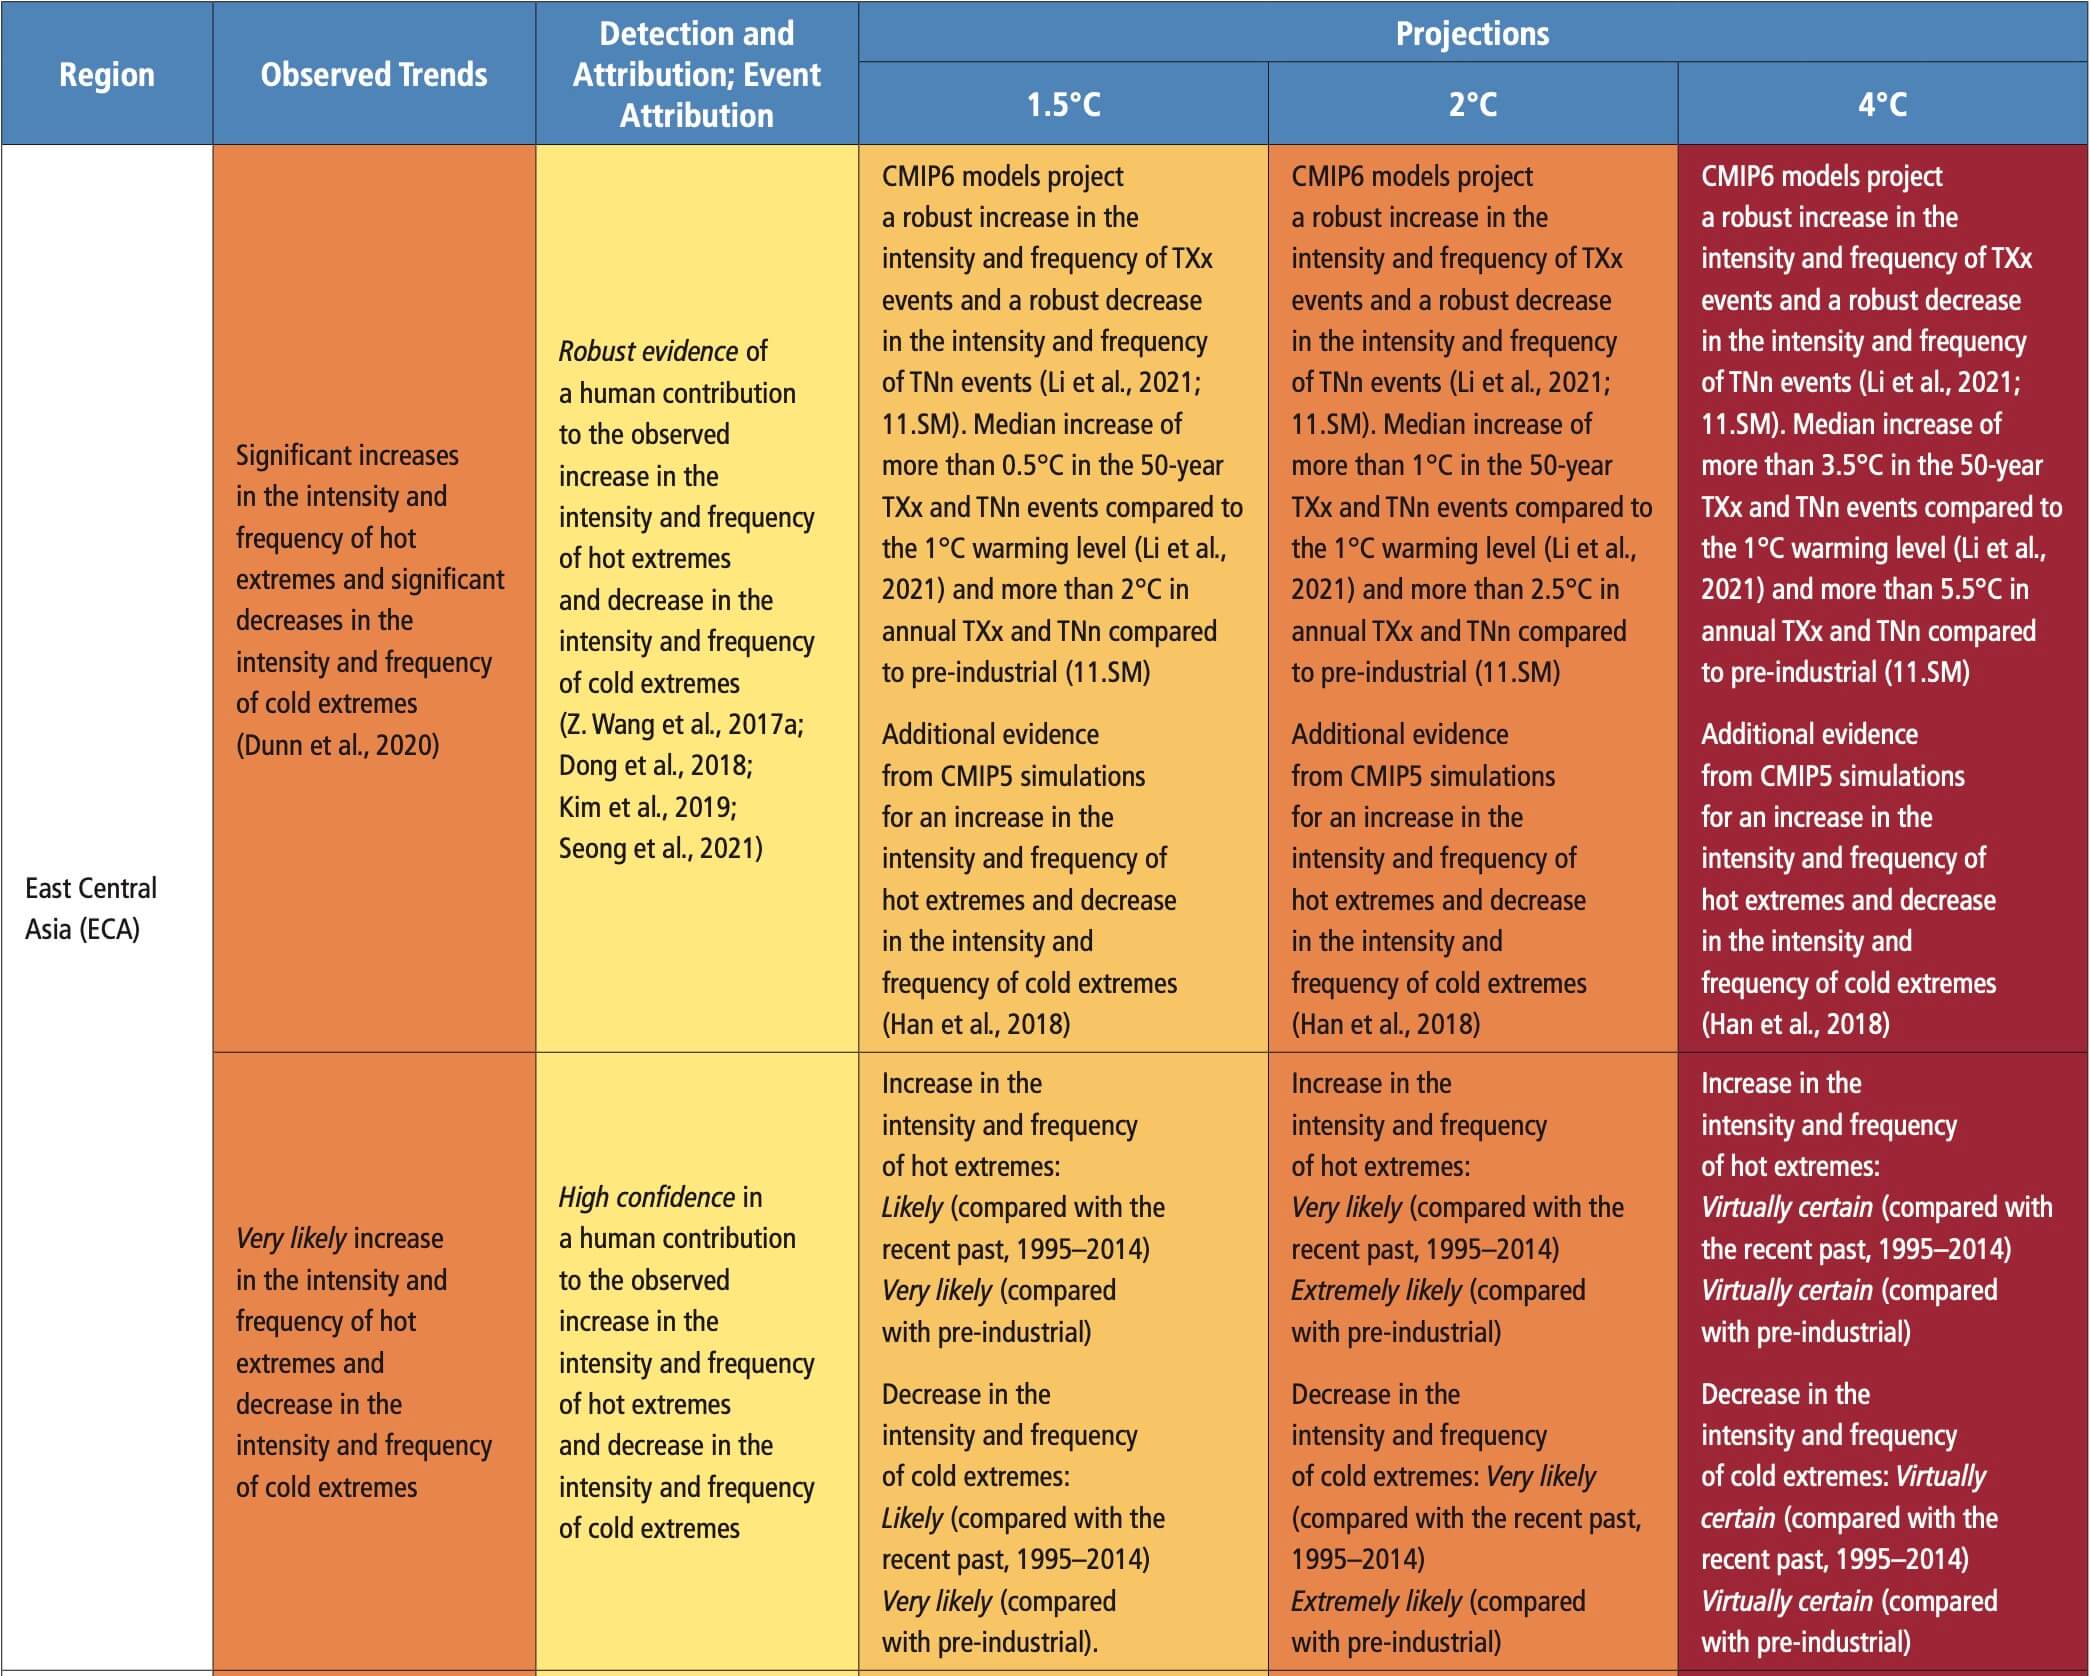
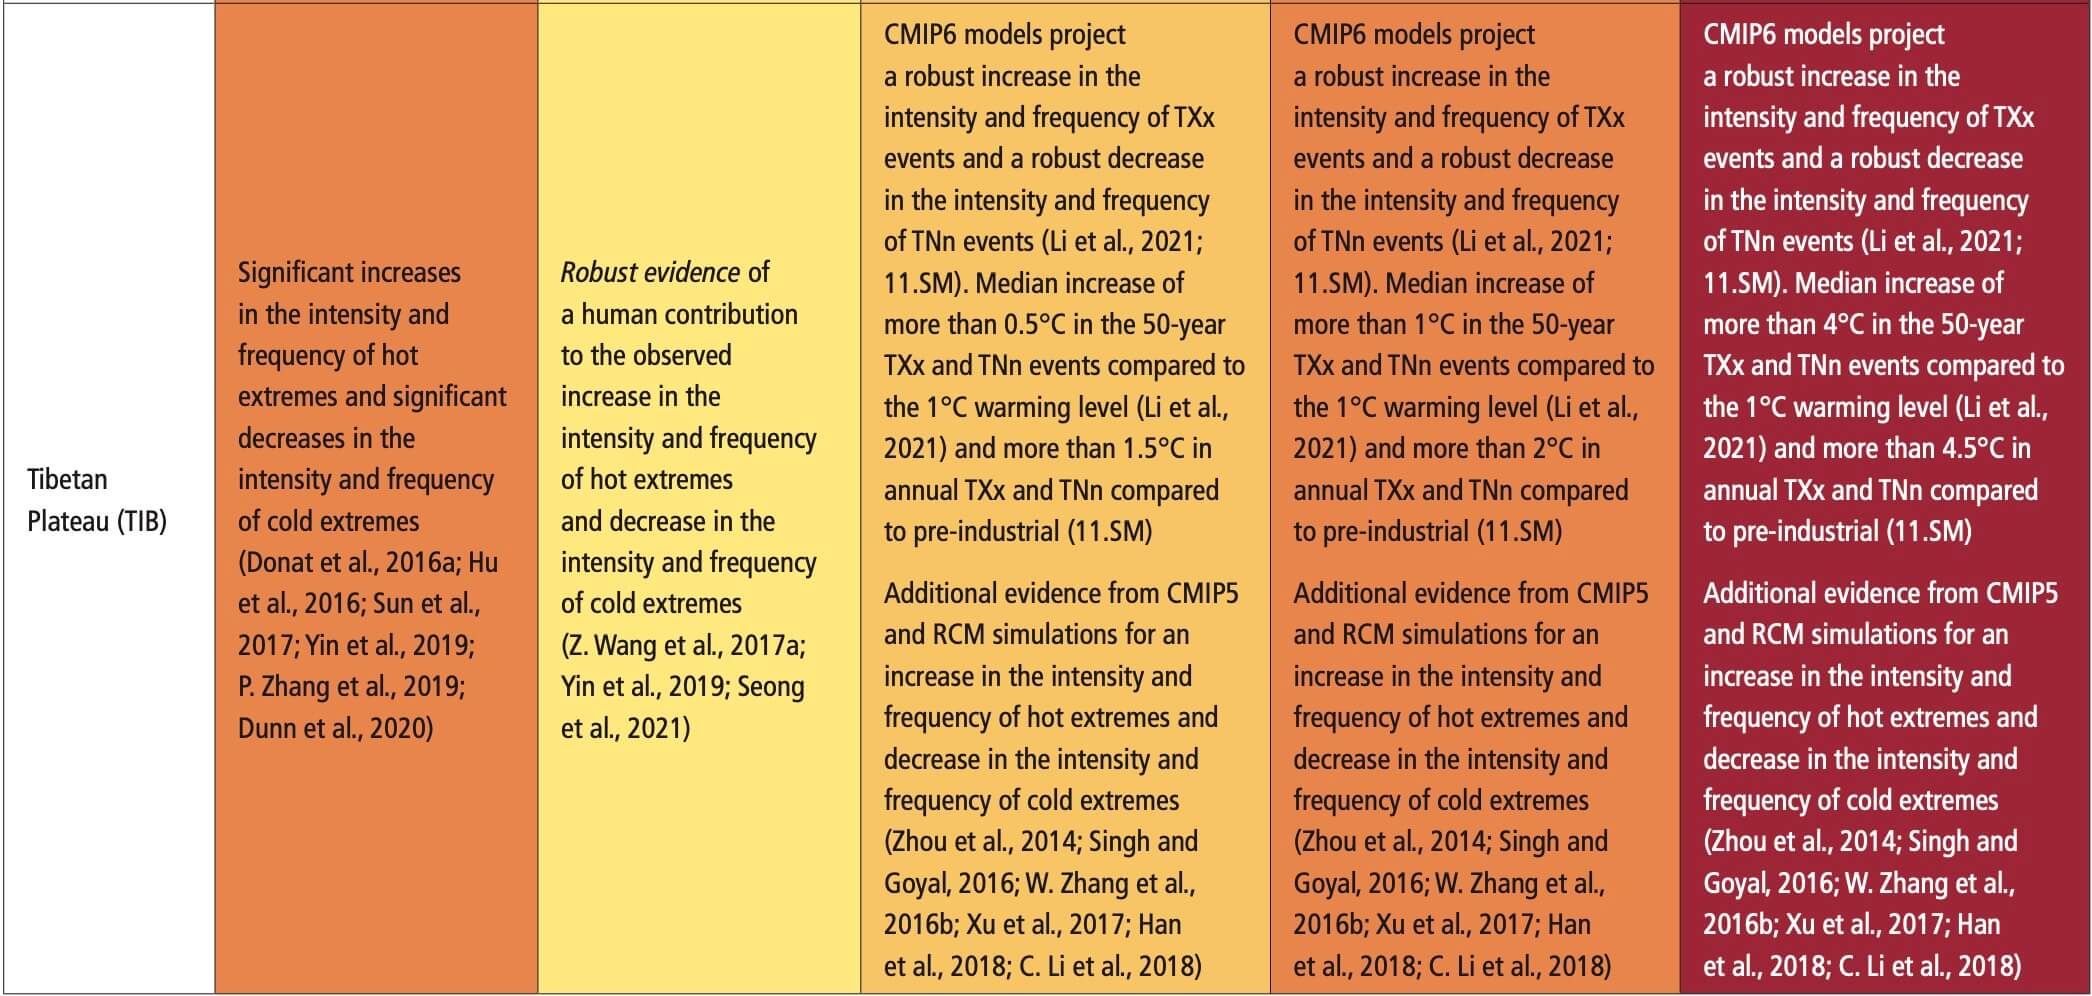
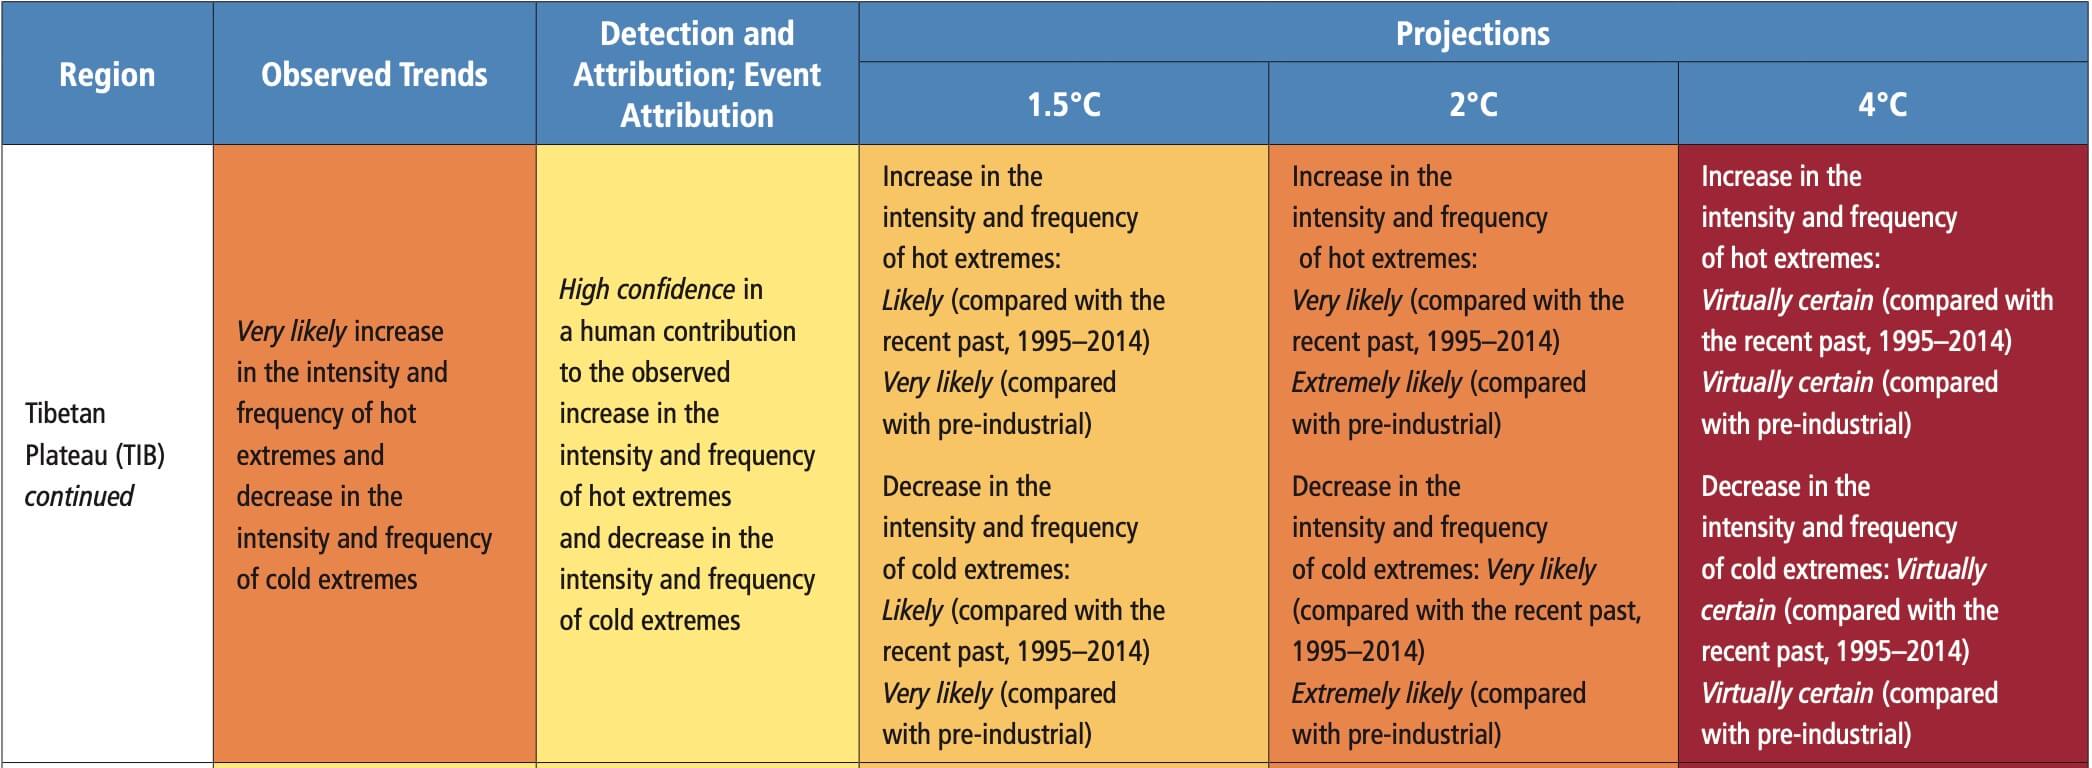
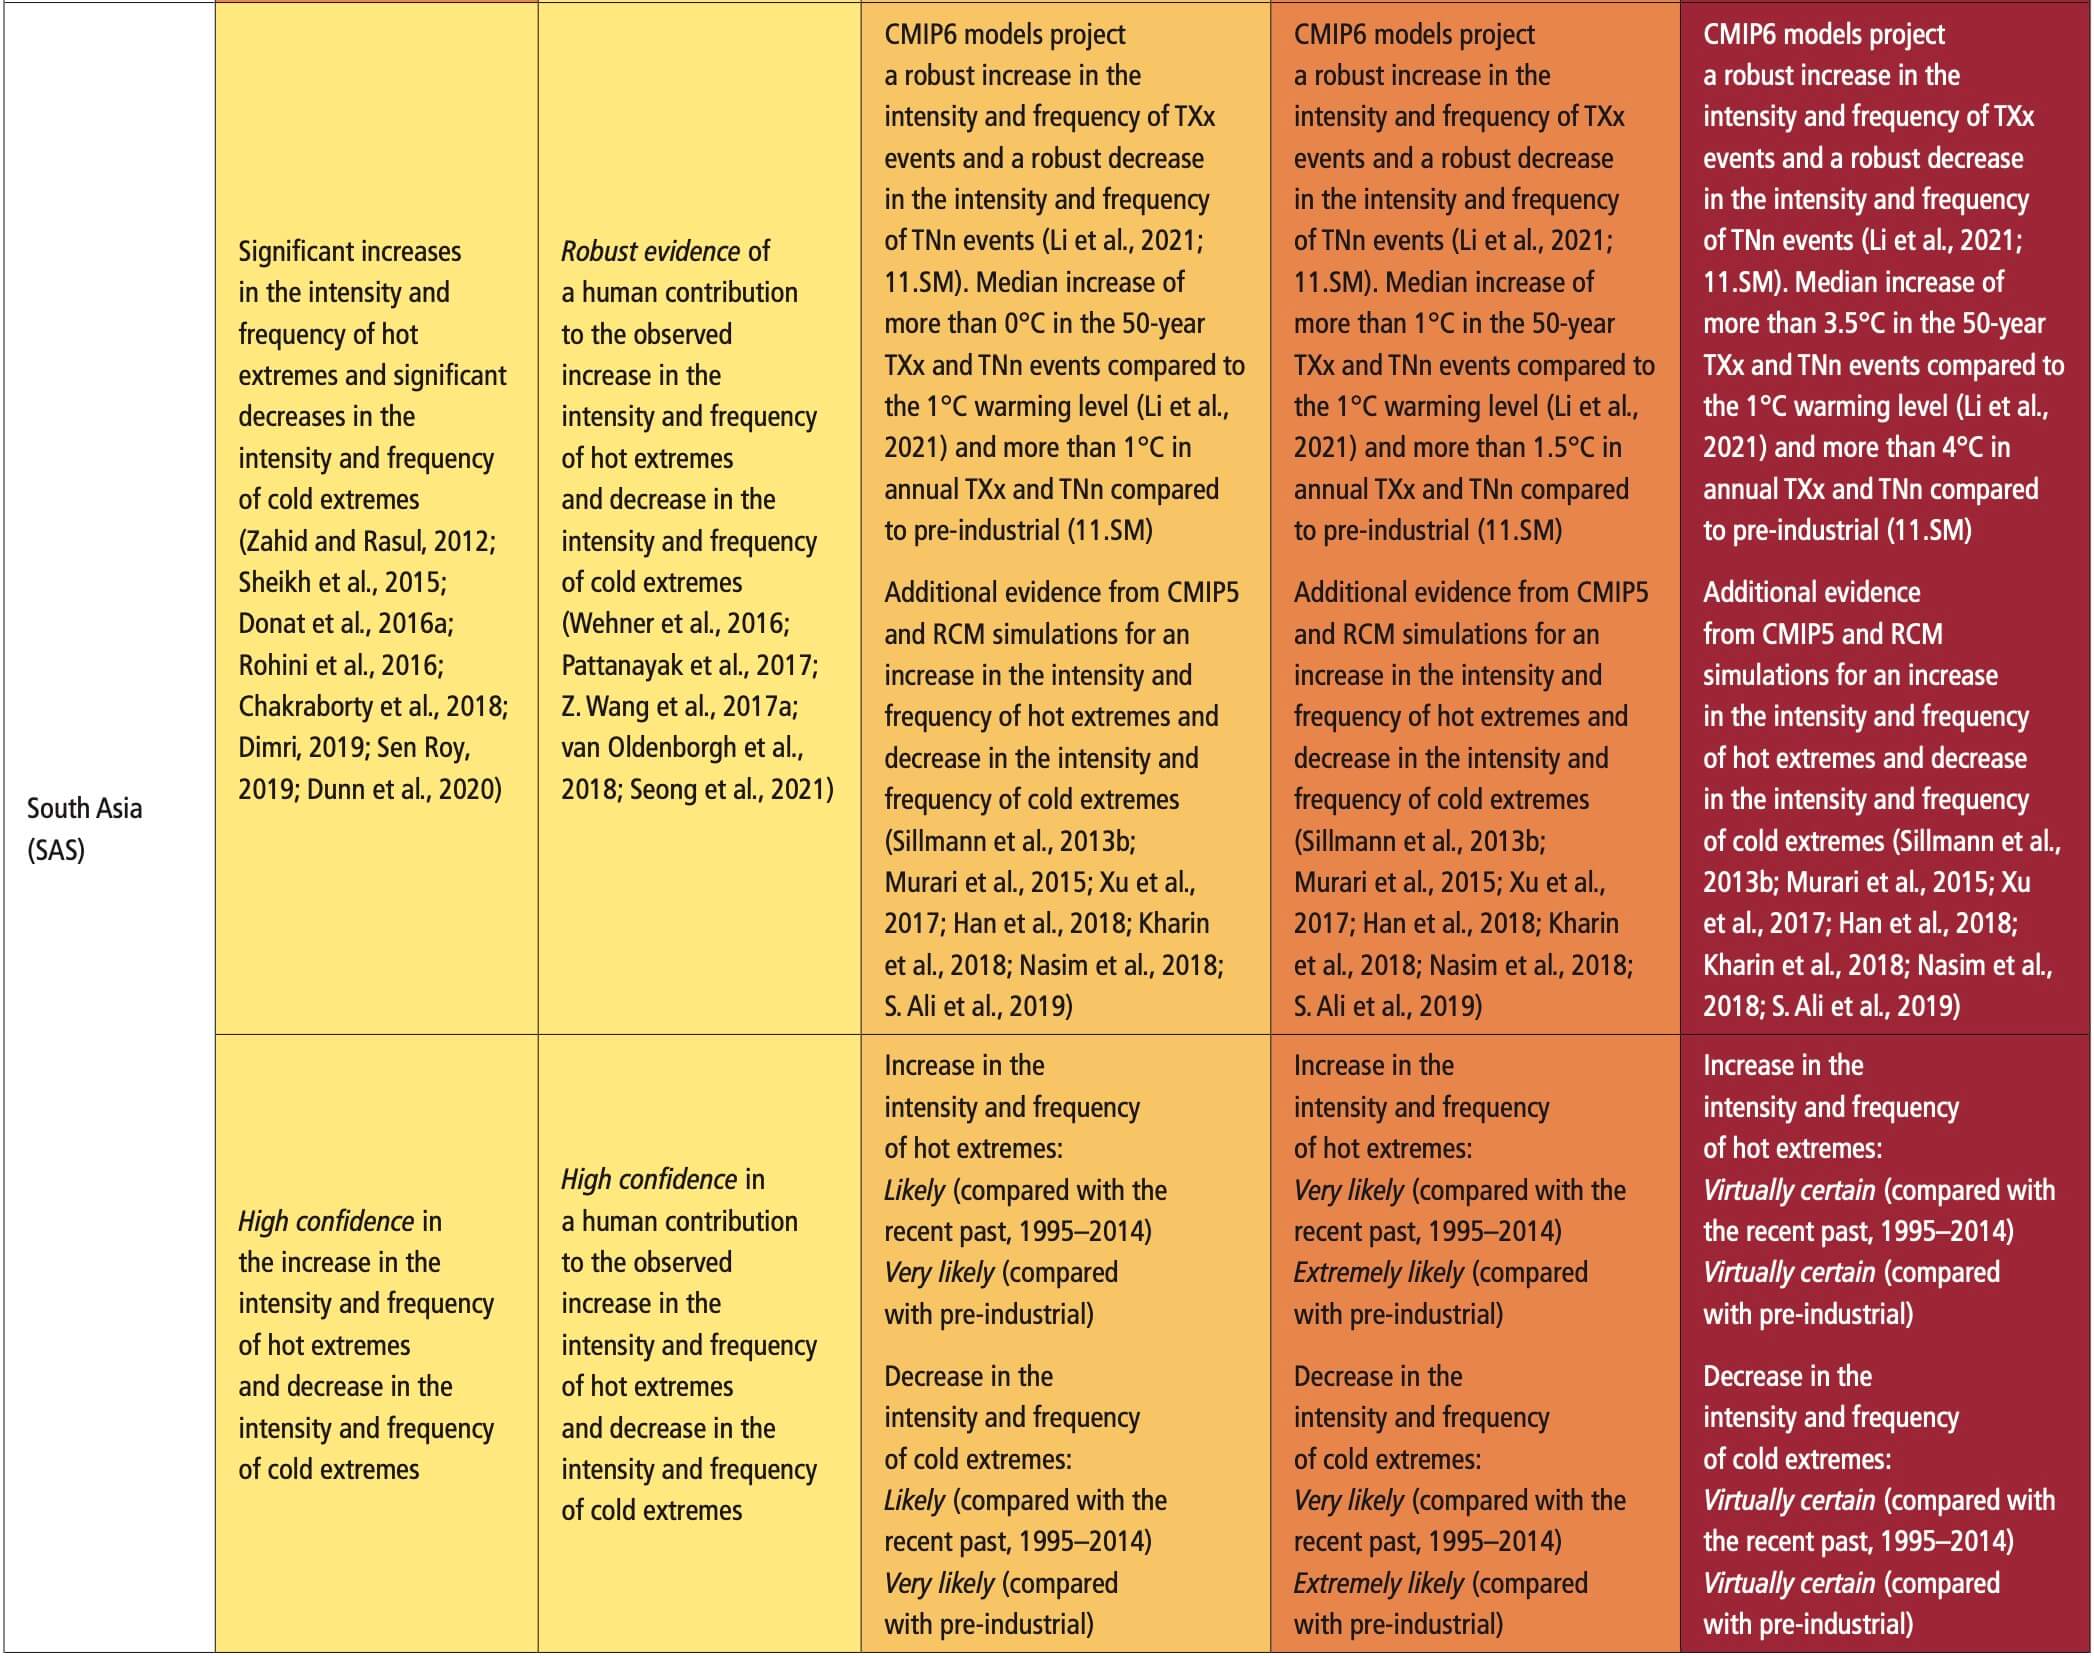
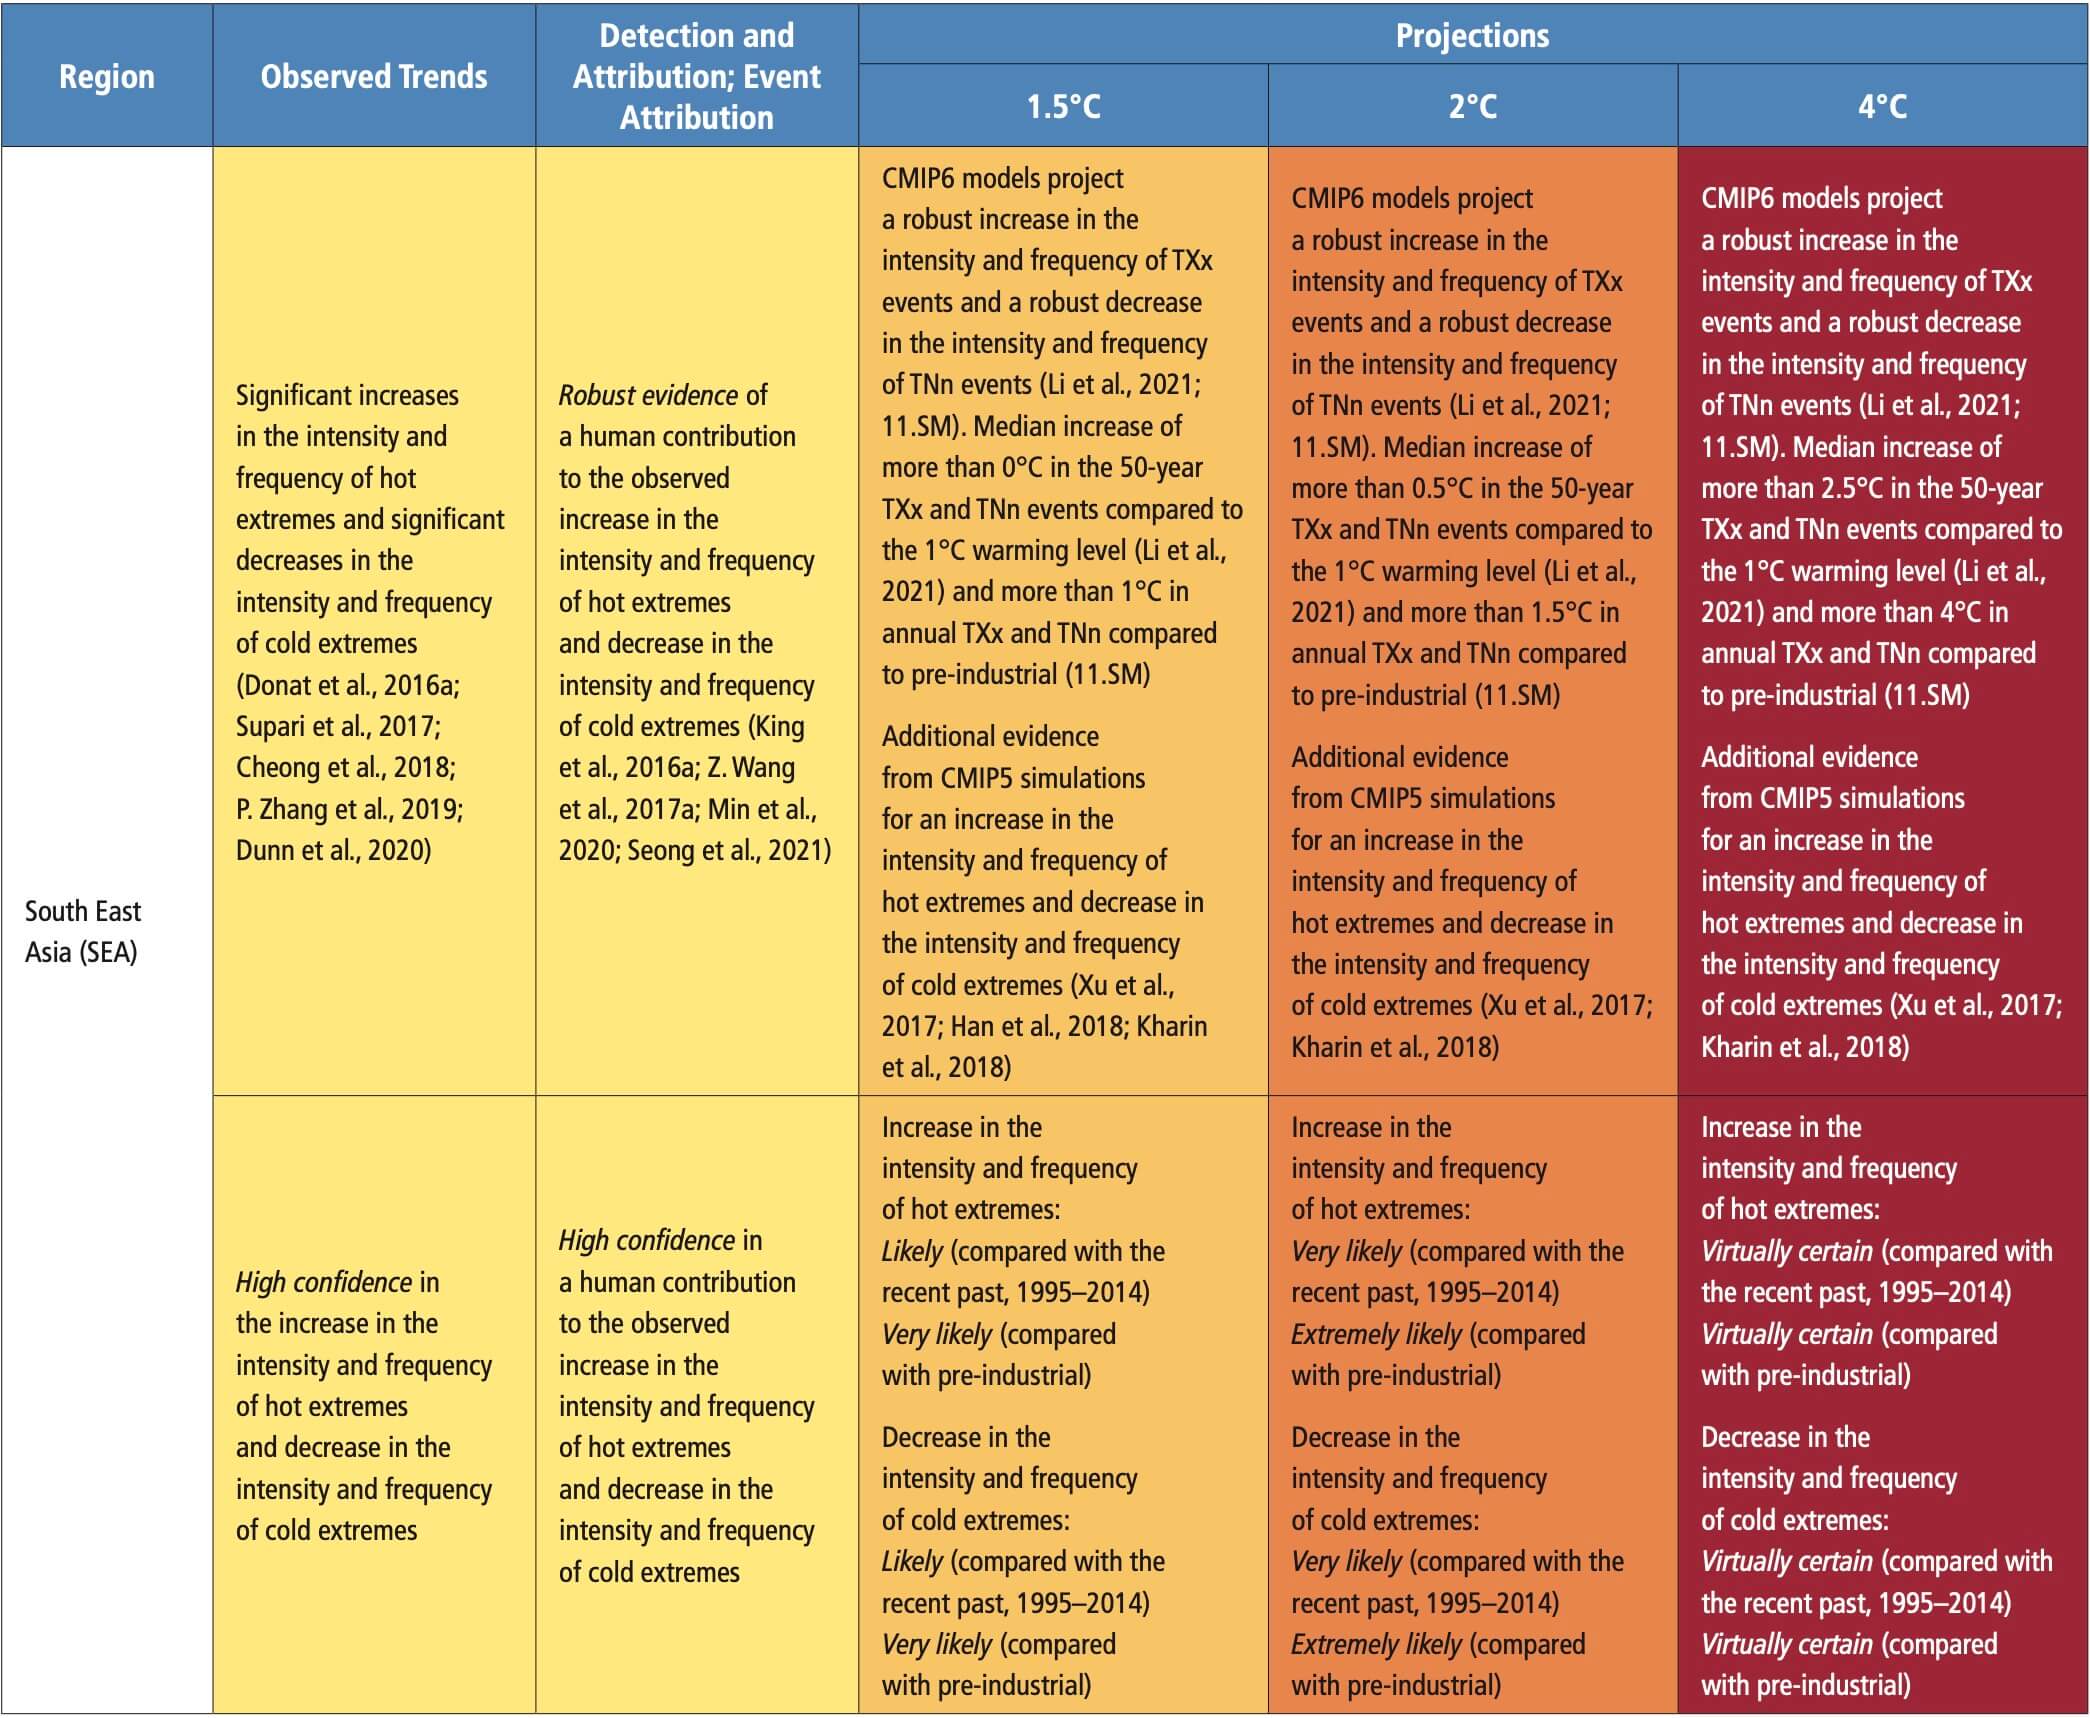 Table 11.8 | Observed trends, human contribution to observed trends, and projected changes at 1.5°C, 2°C and 4°C of global warming for heavy precipitation in Asia, subdivided by AR6 regions. See Sections 11.9.1 and 11.9.3 for details.
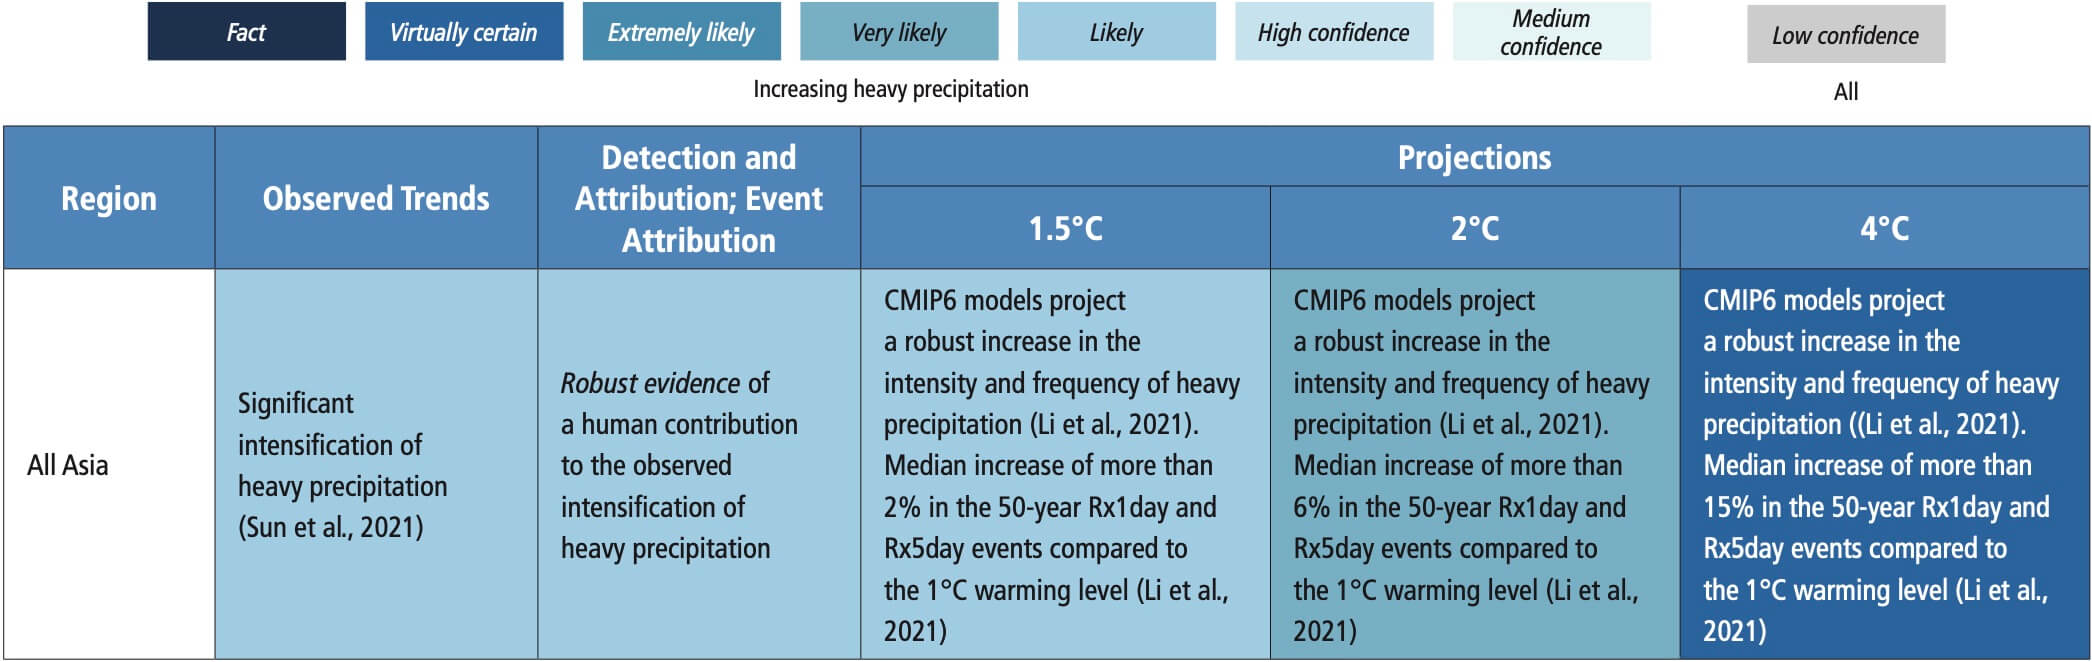
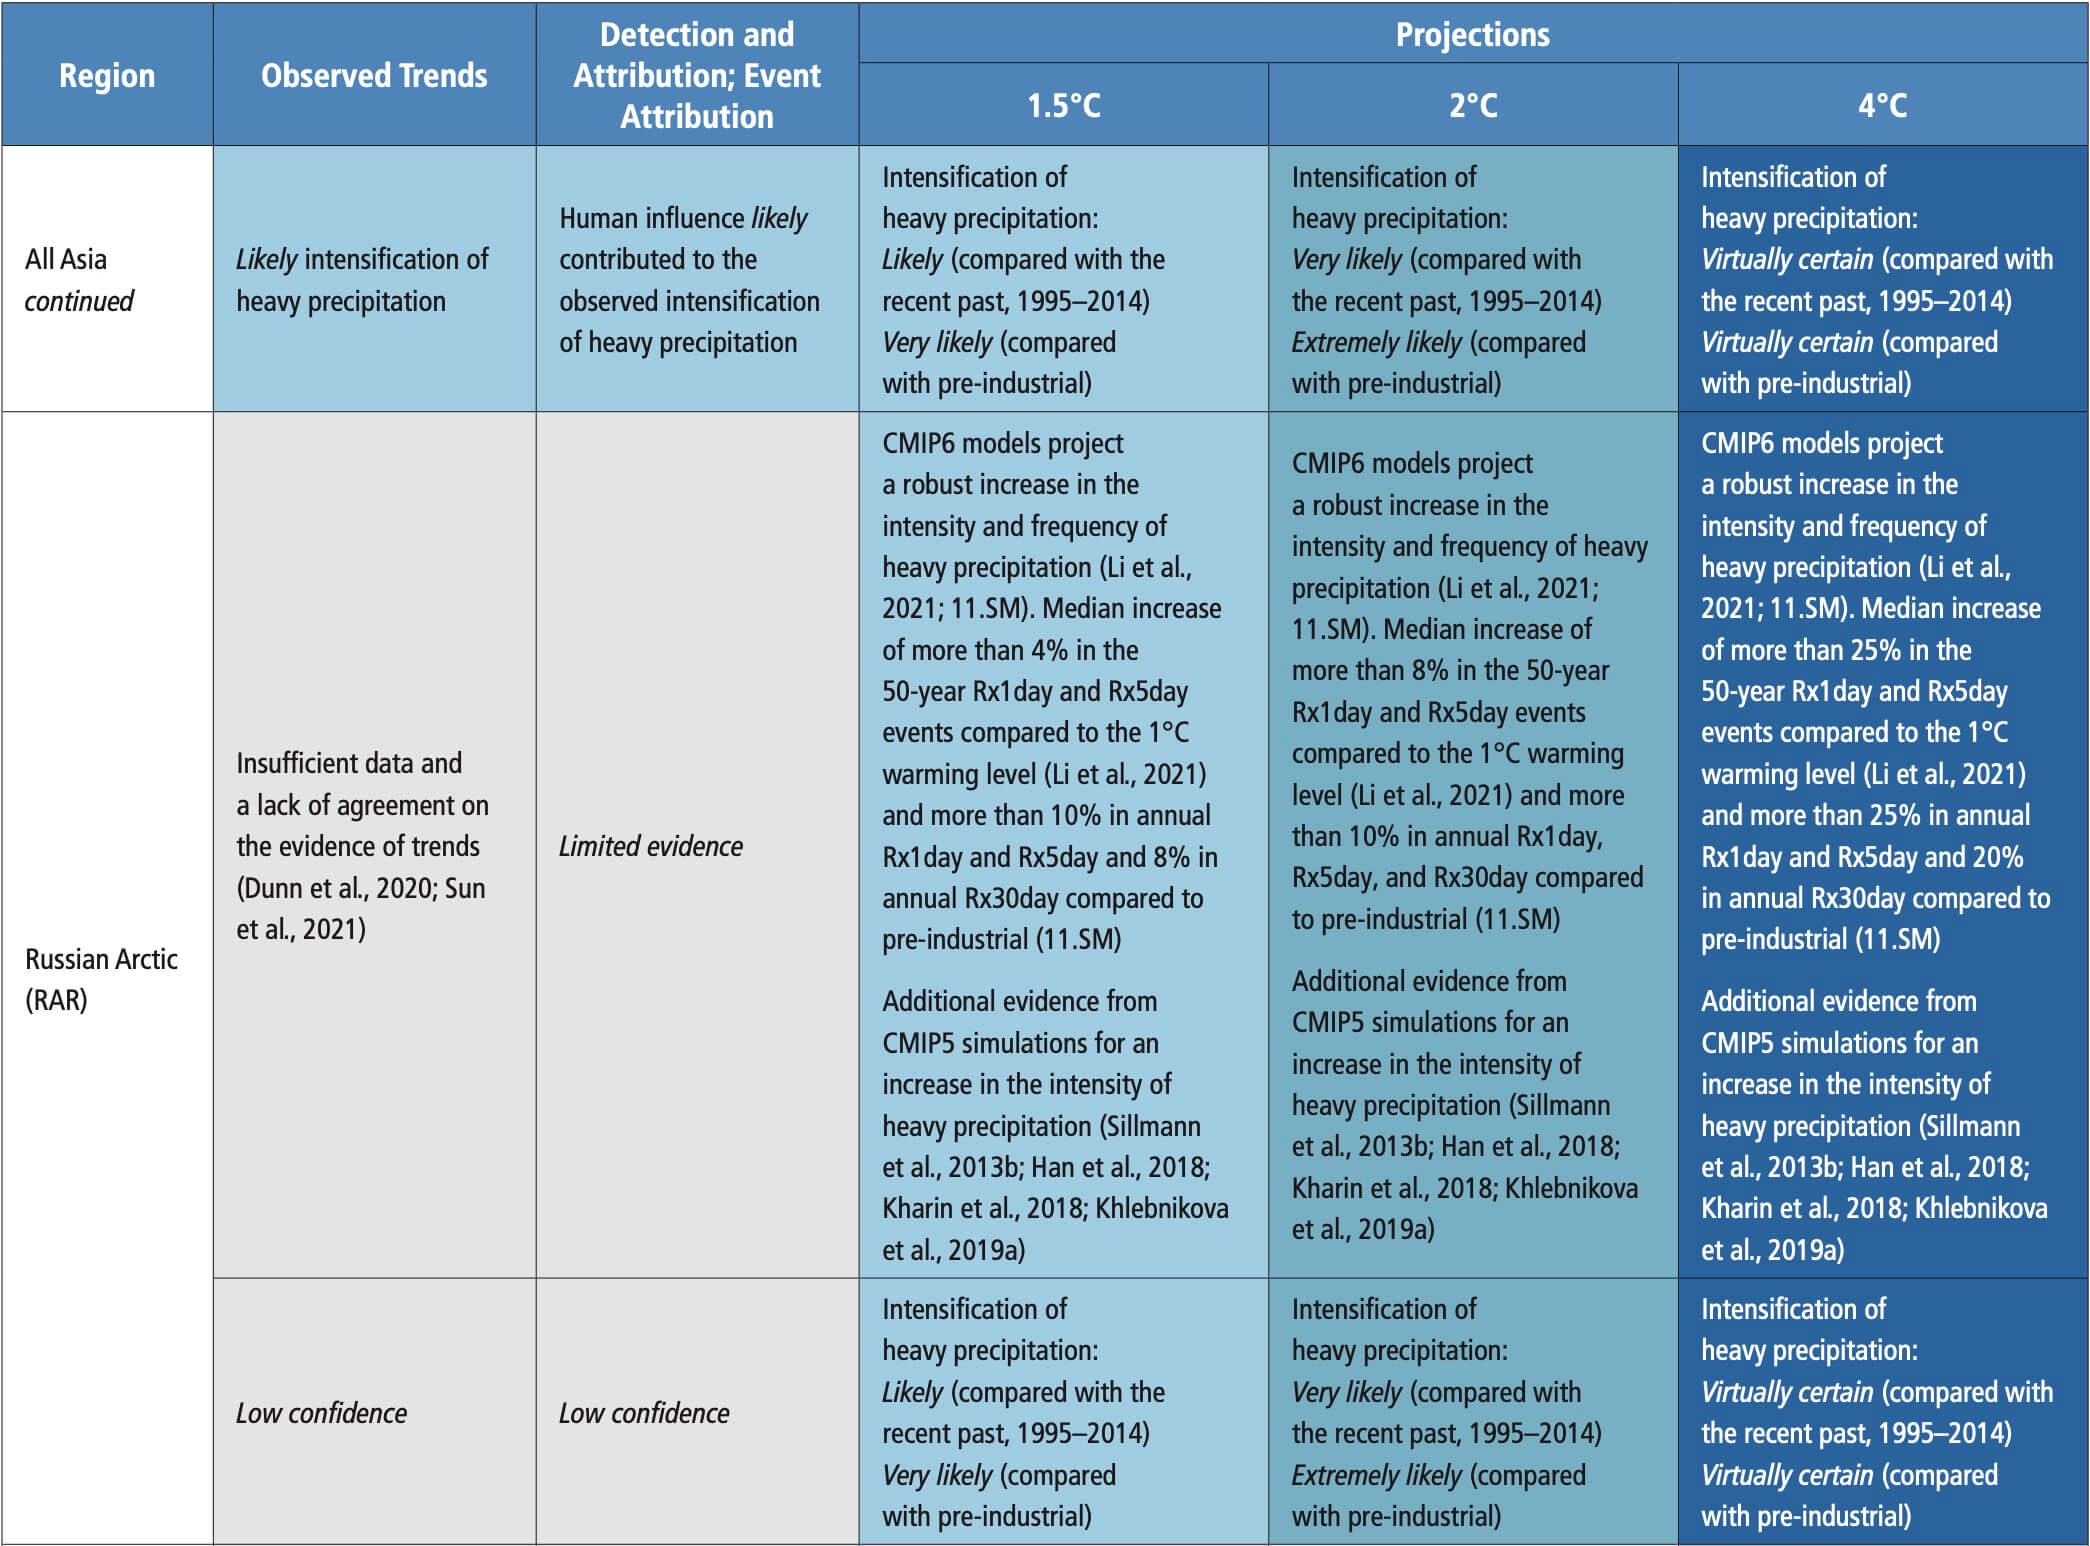
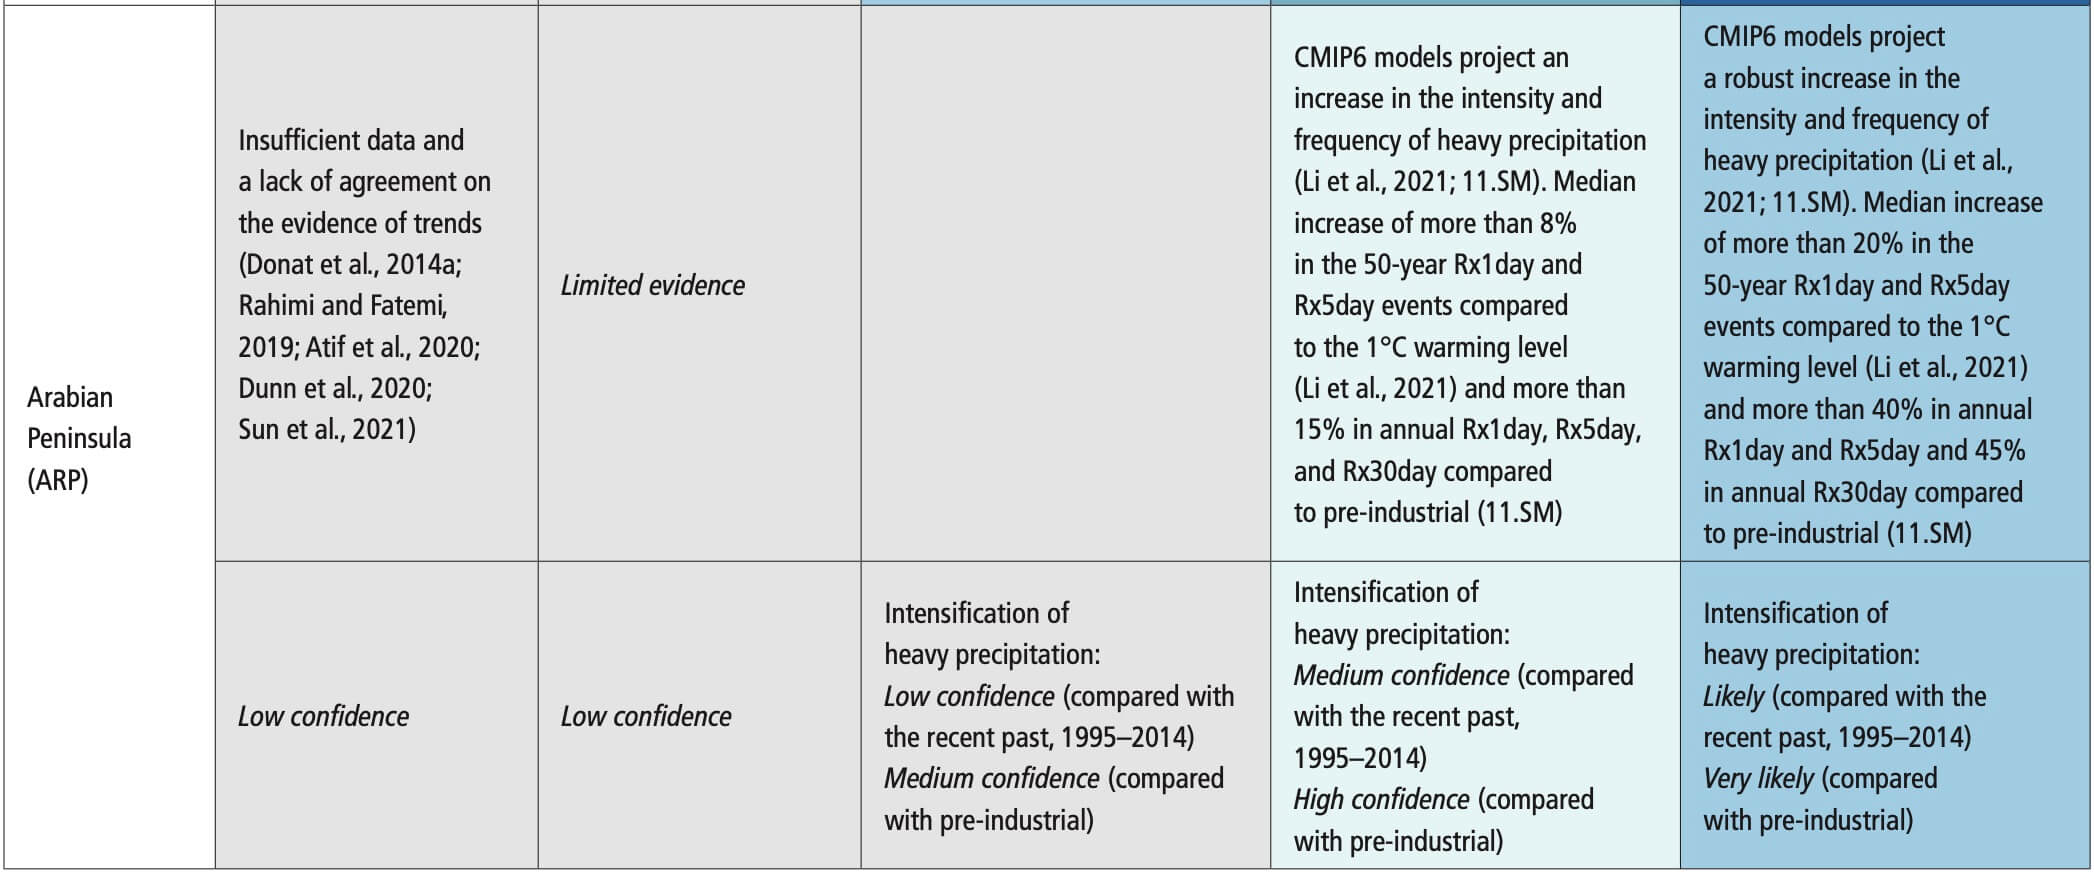
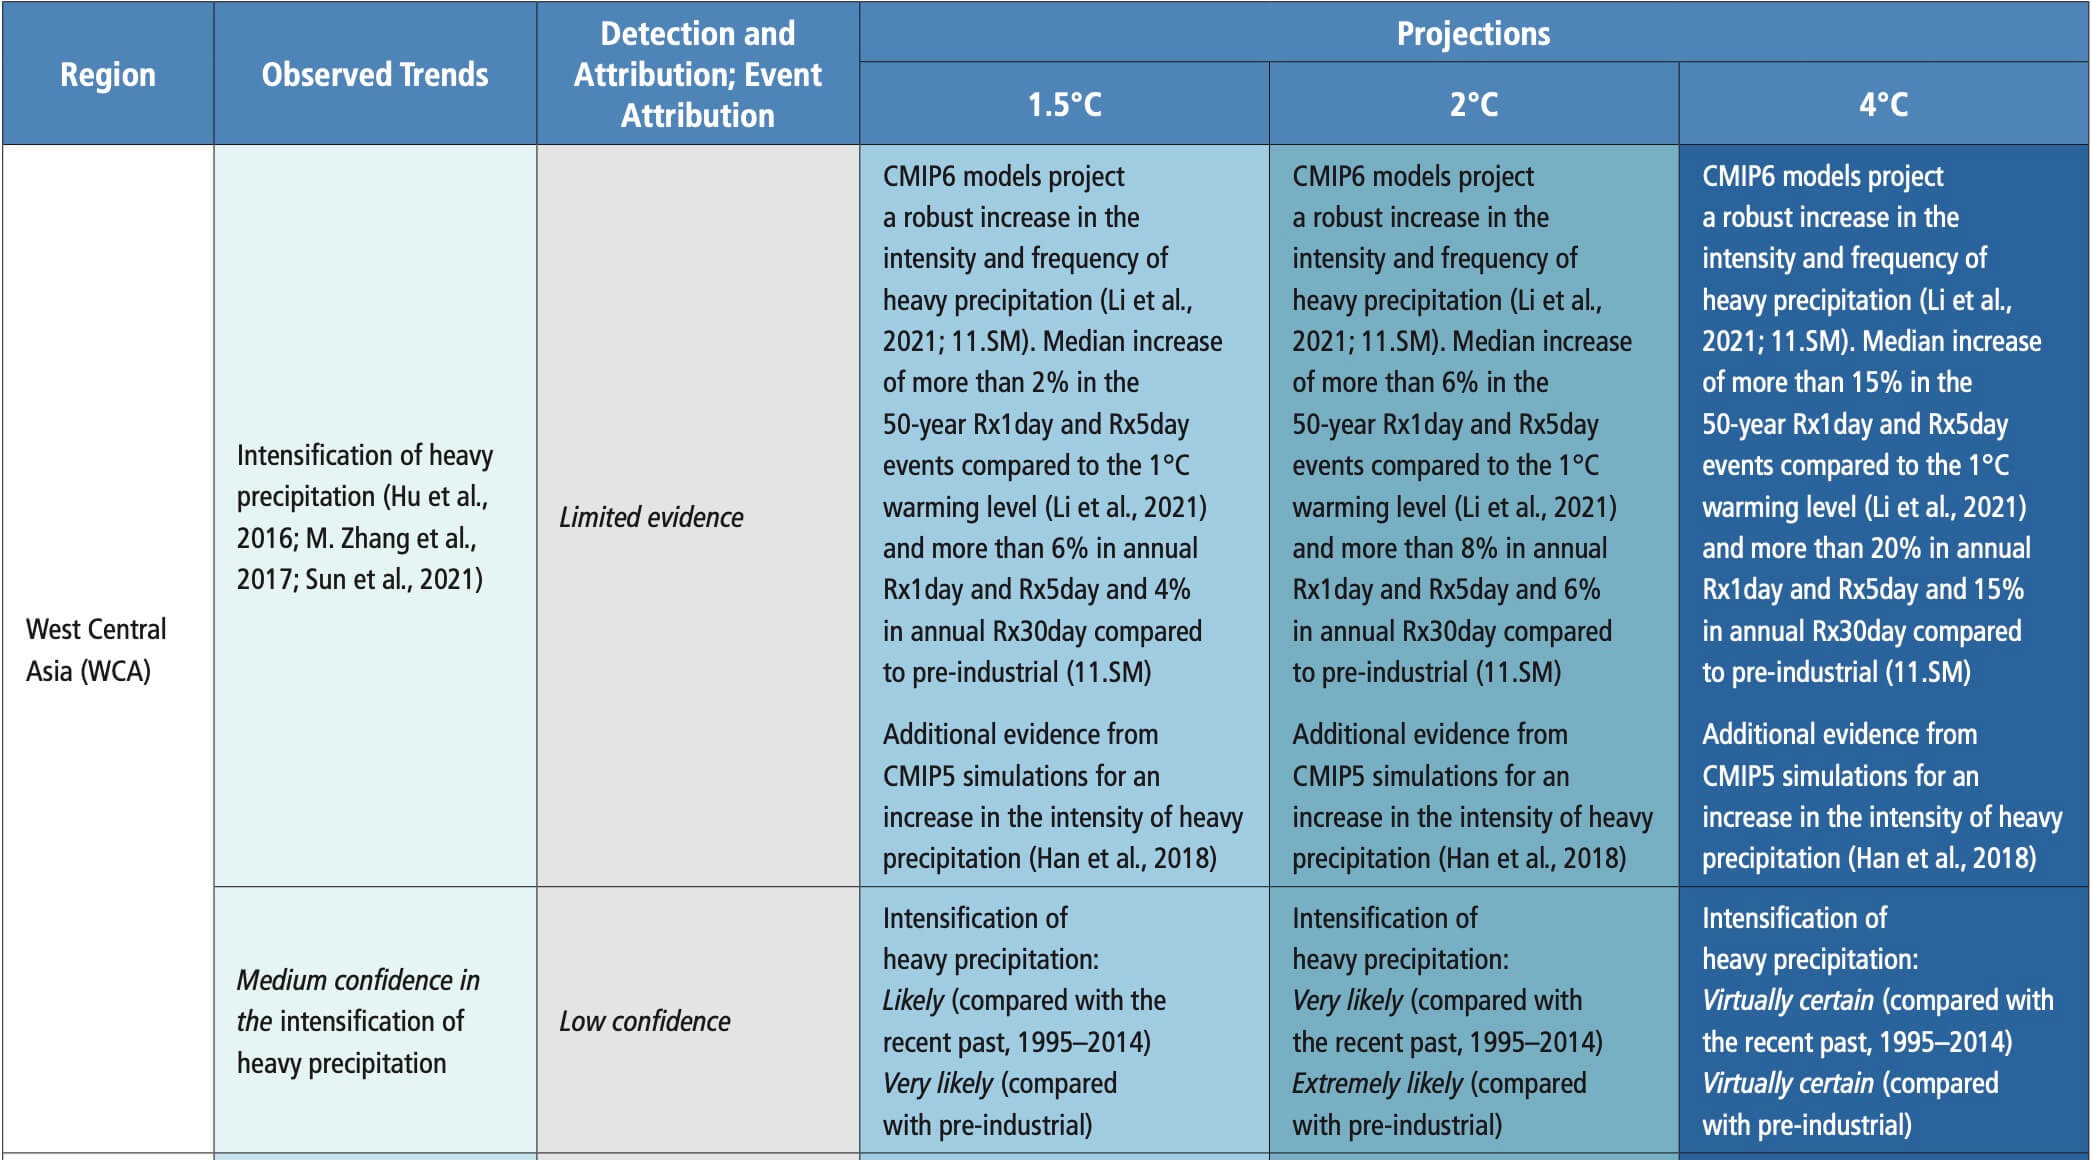
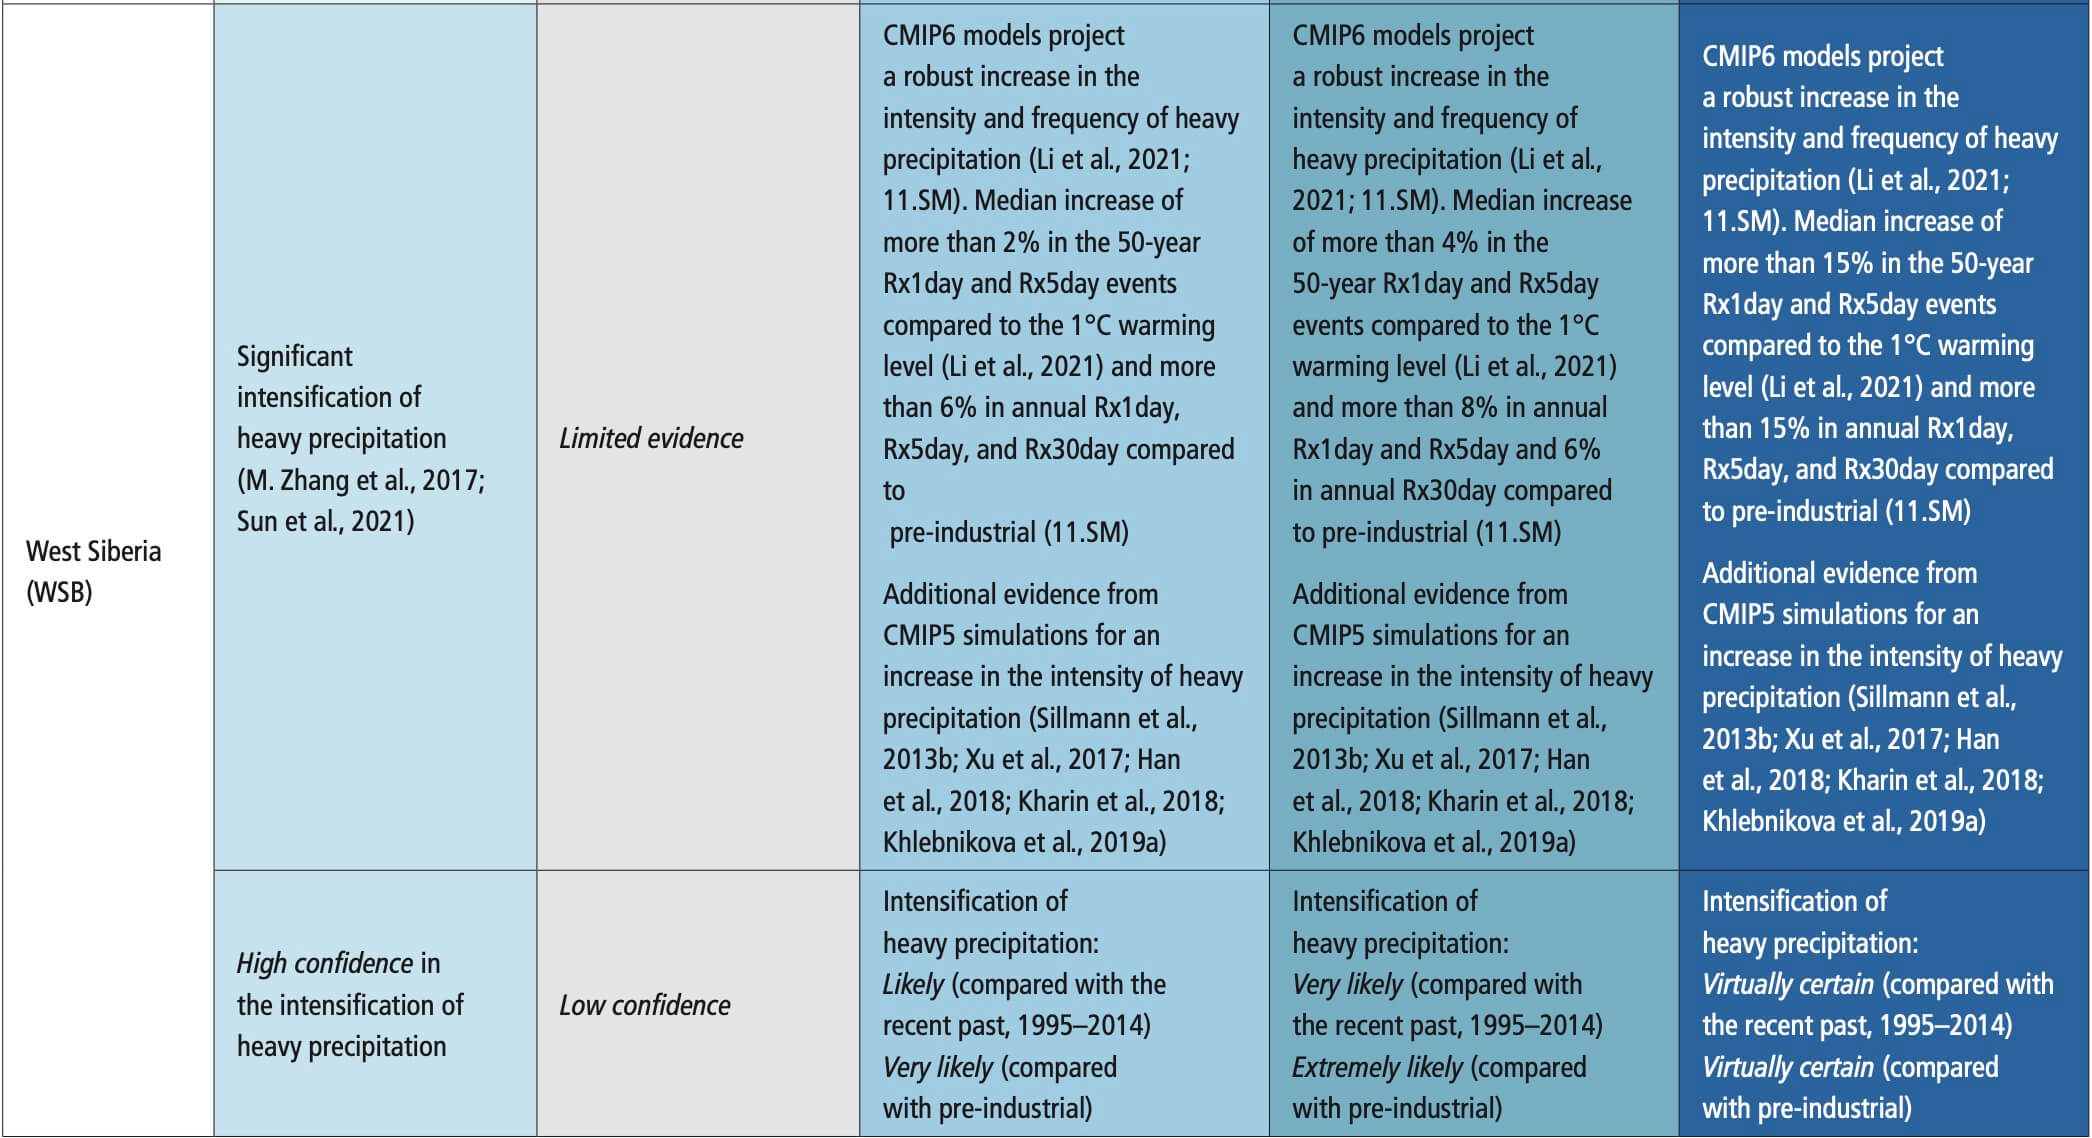
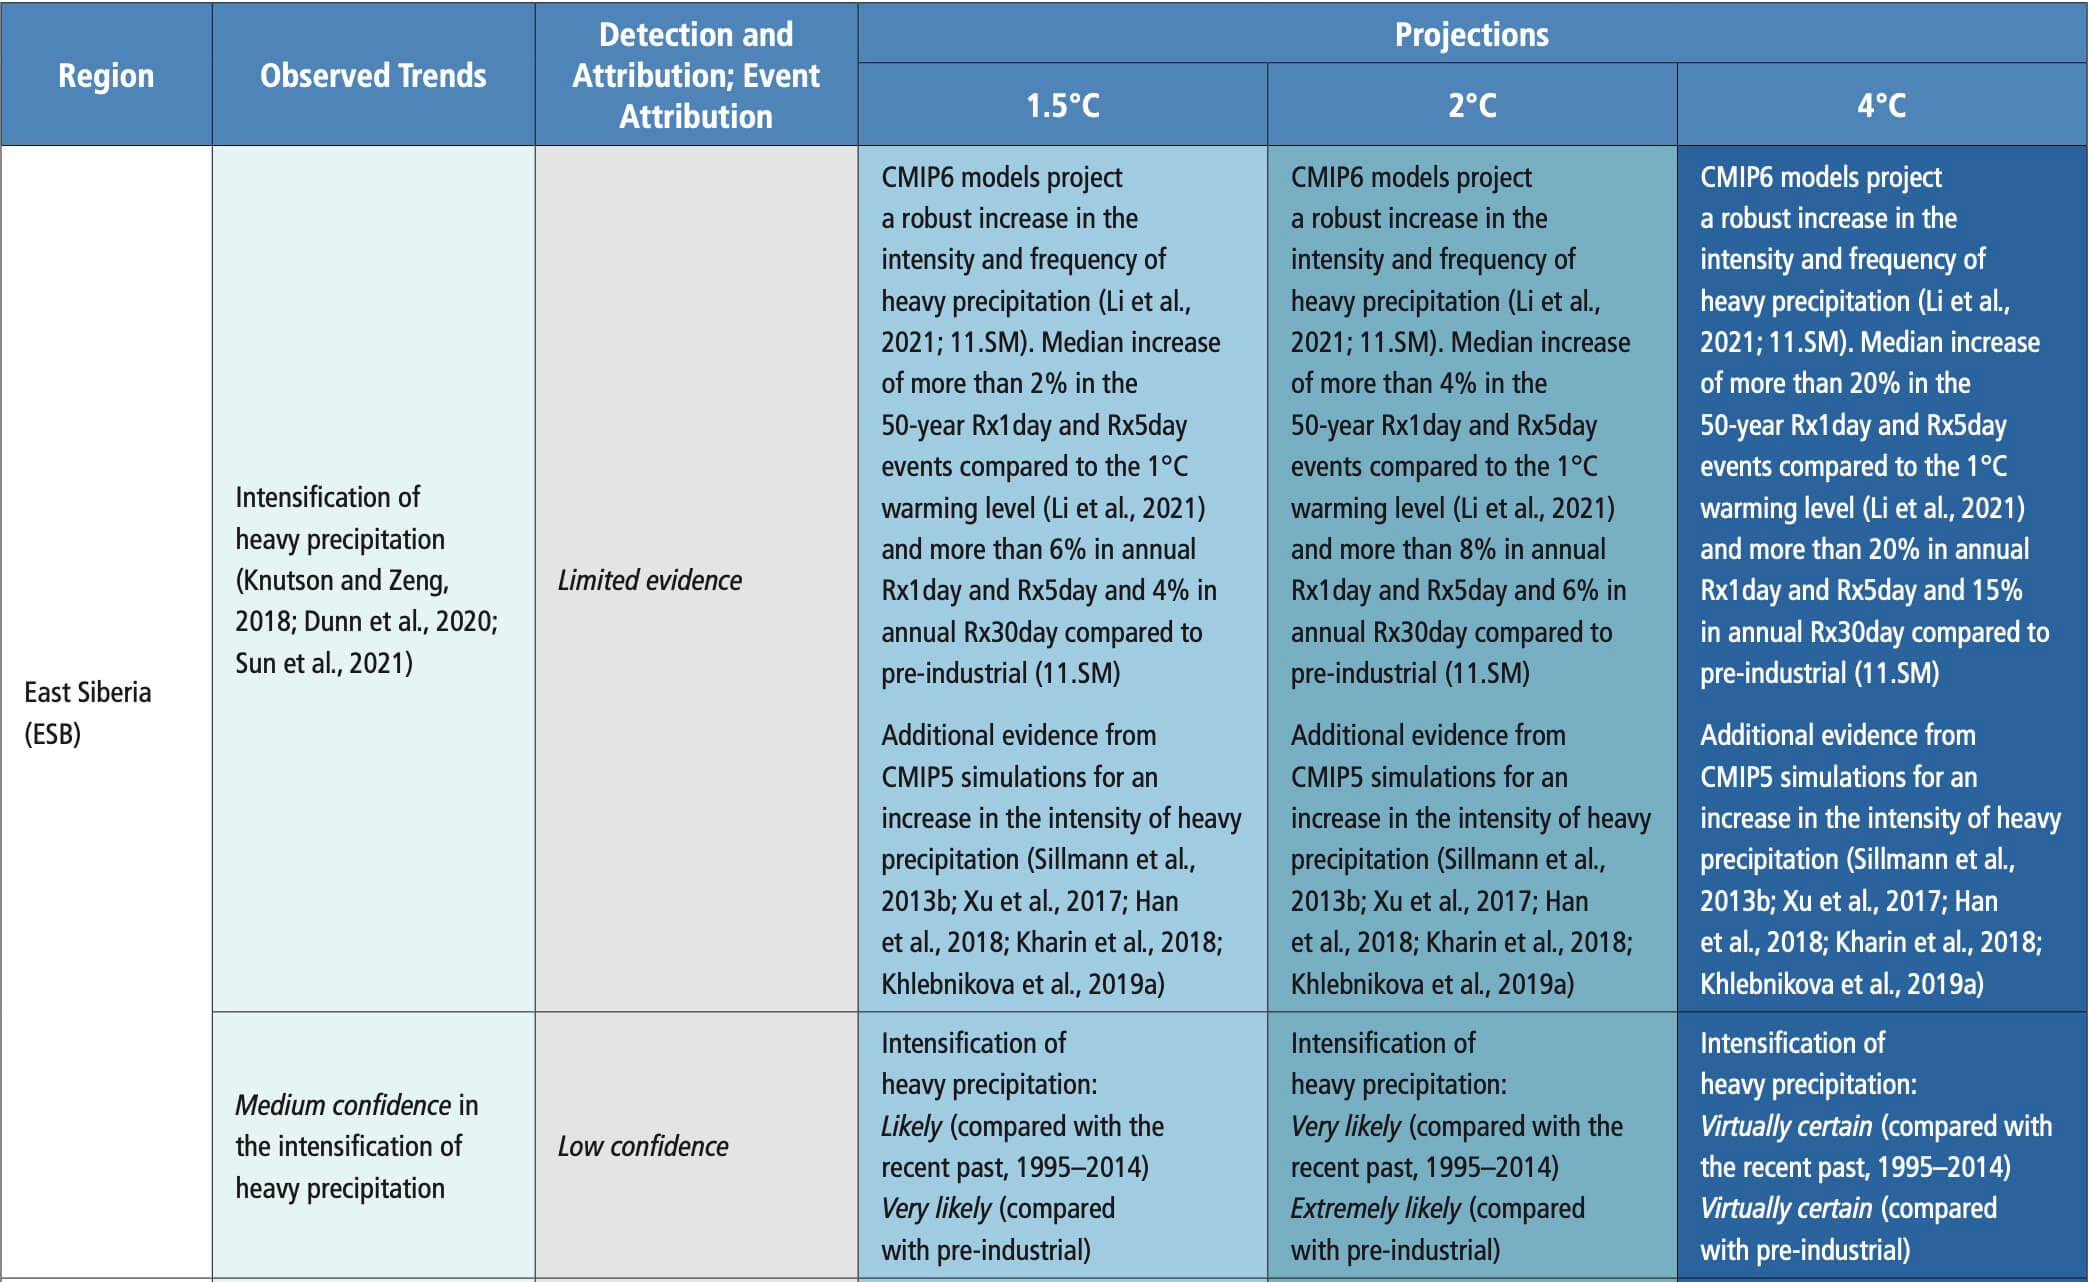
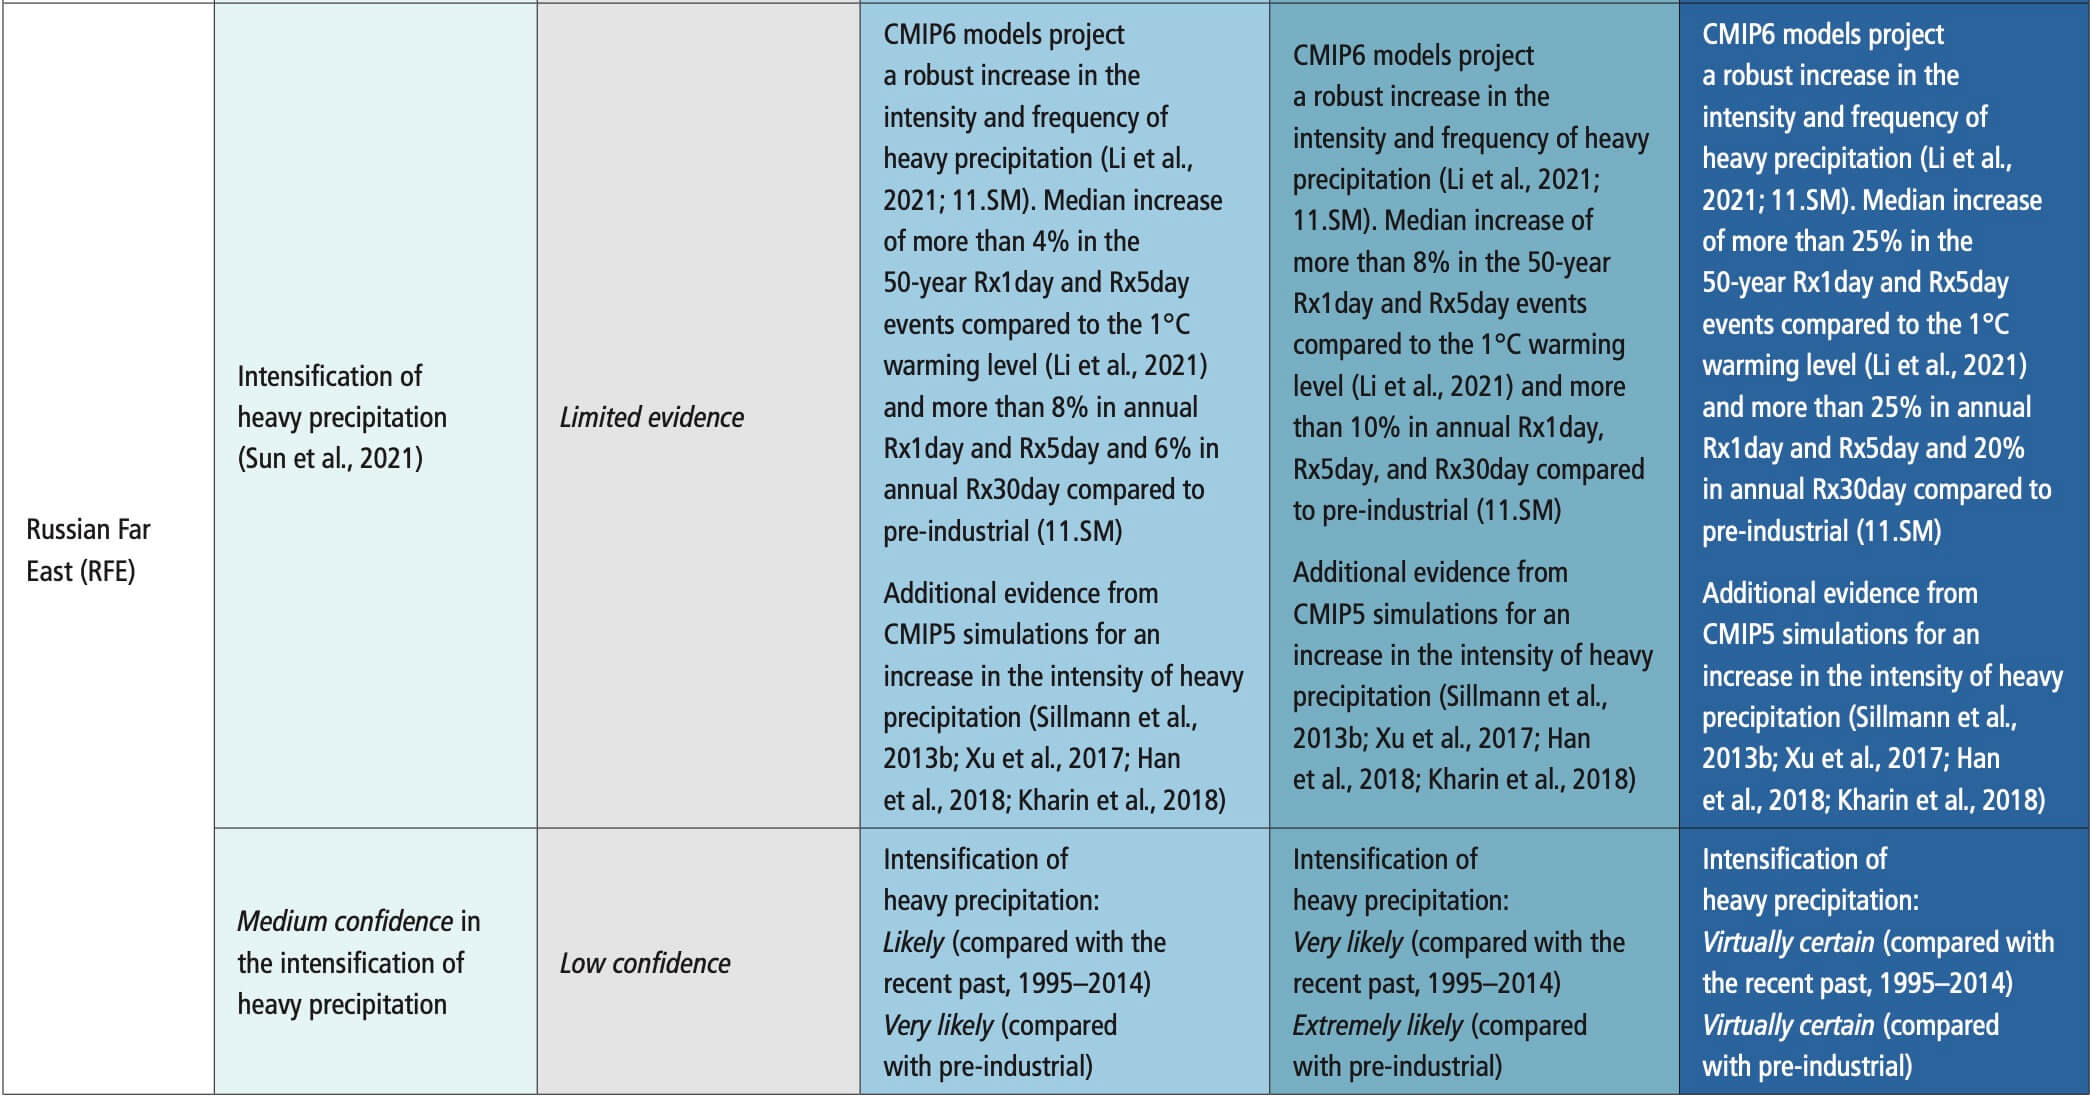
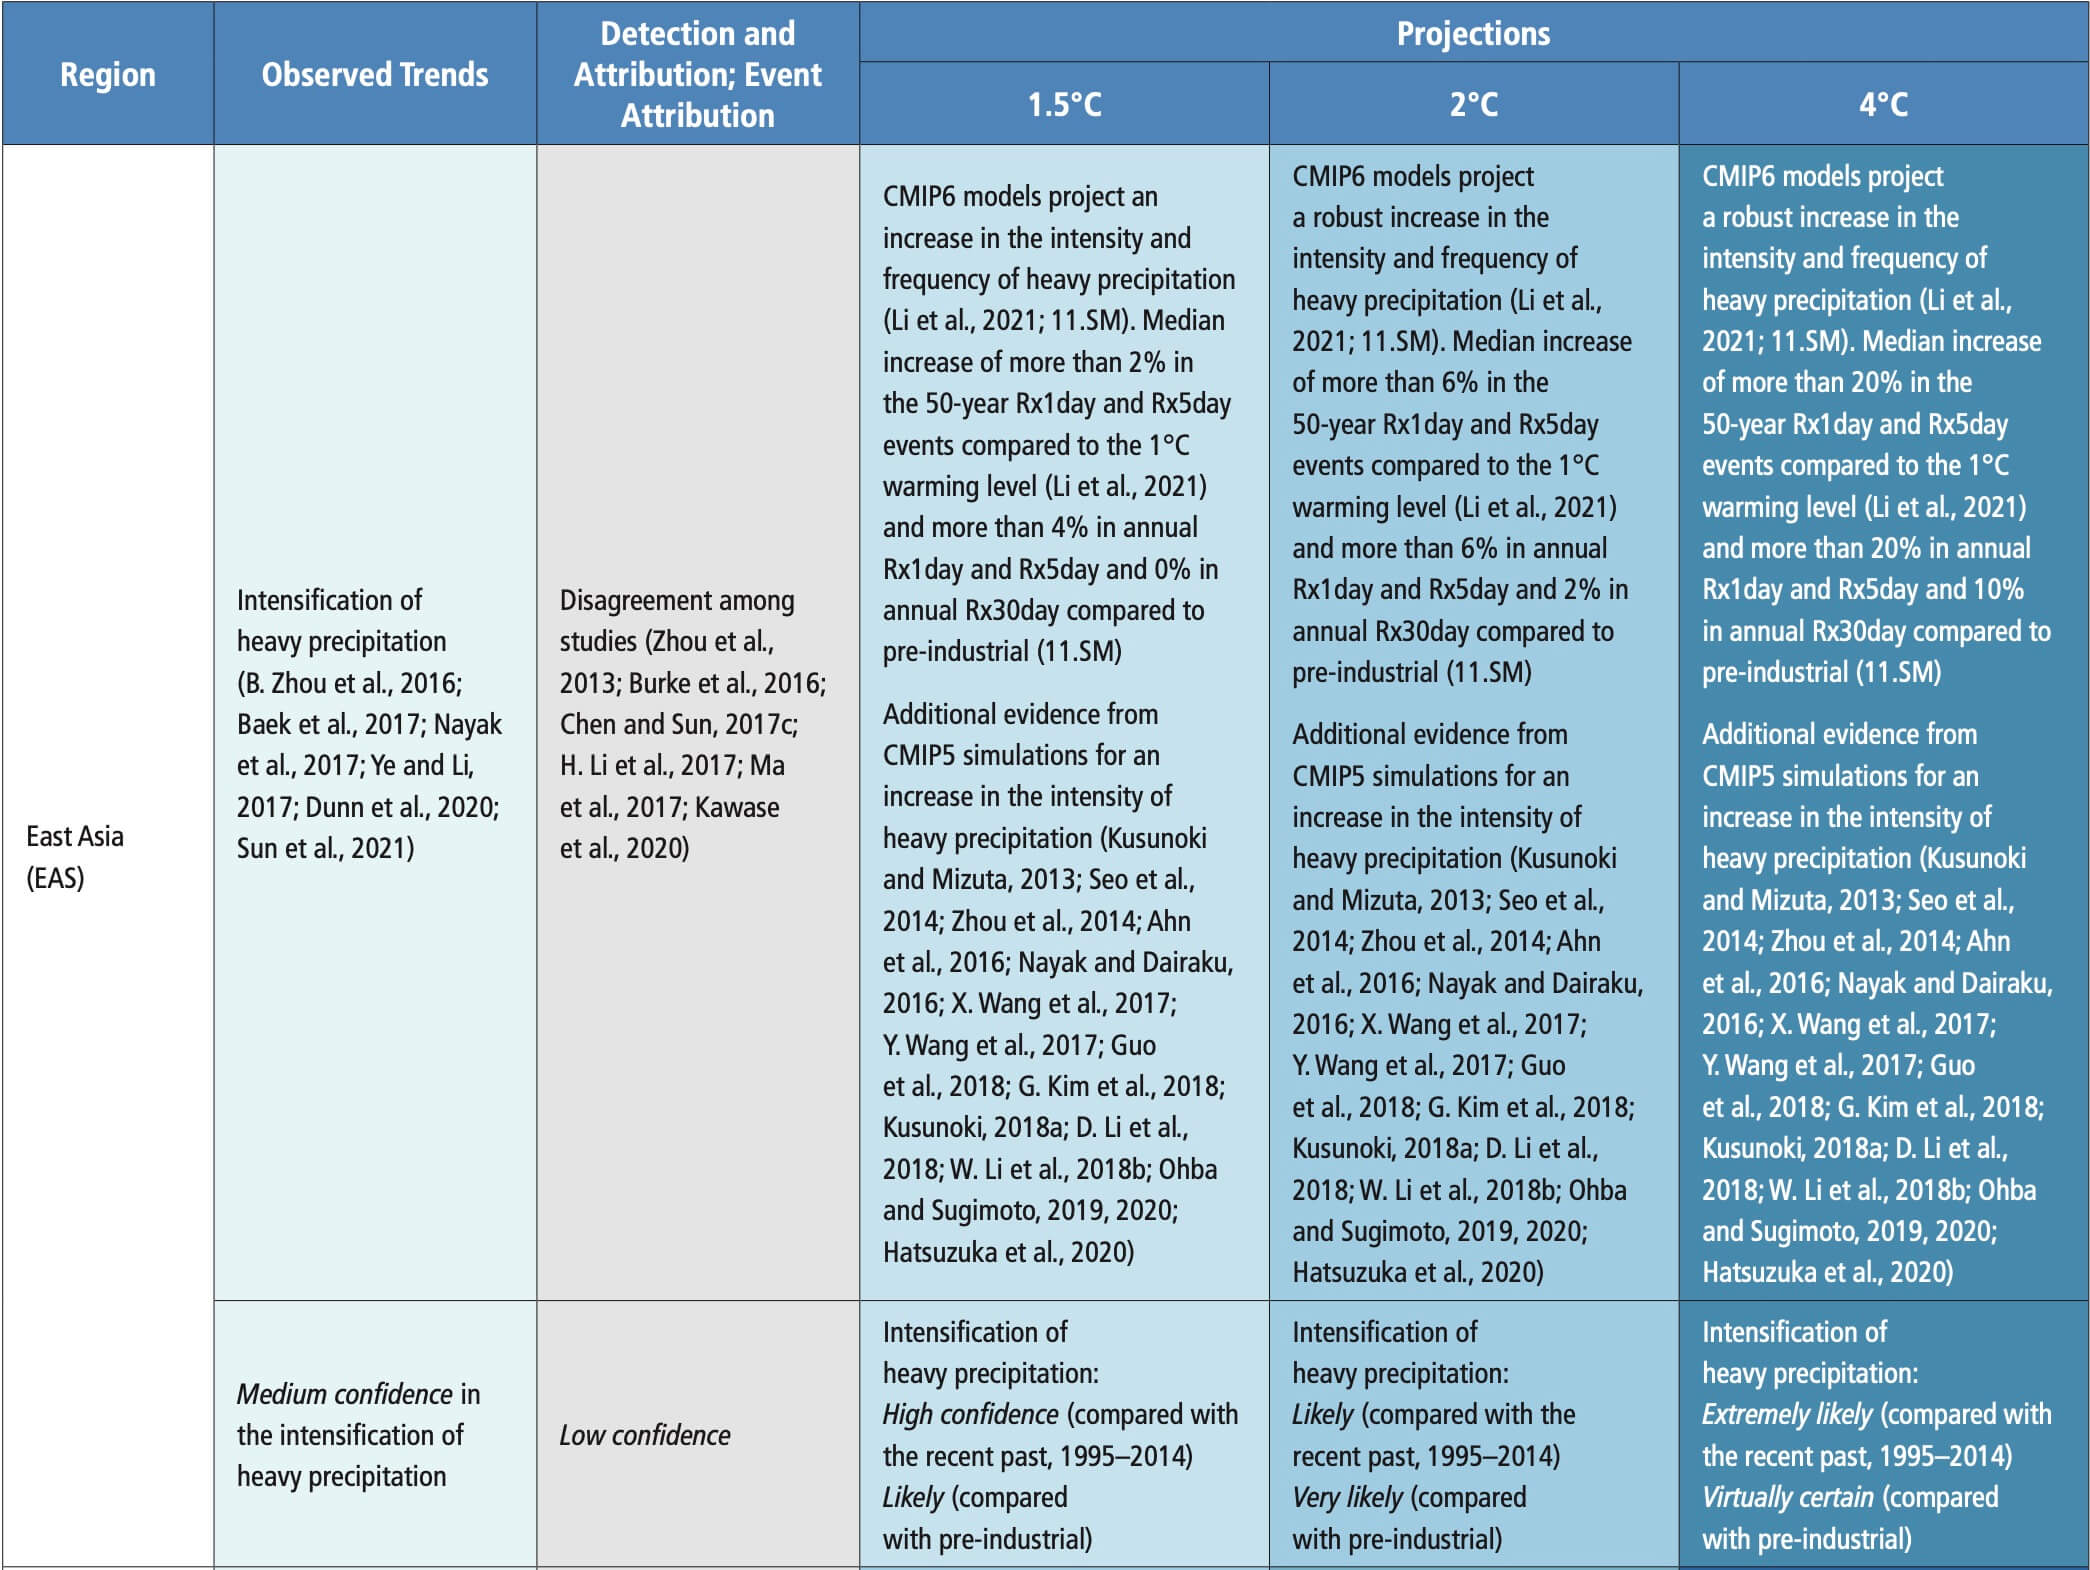
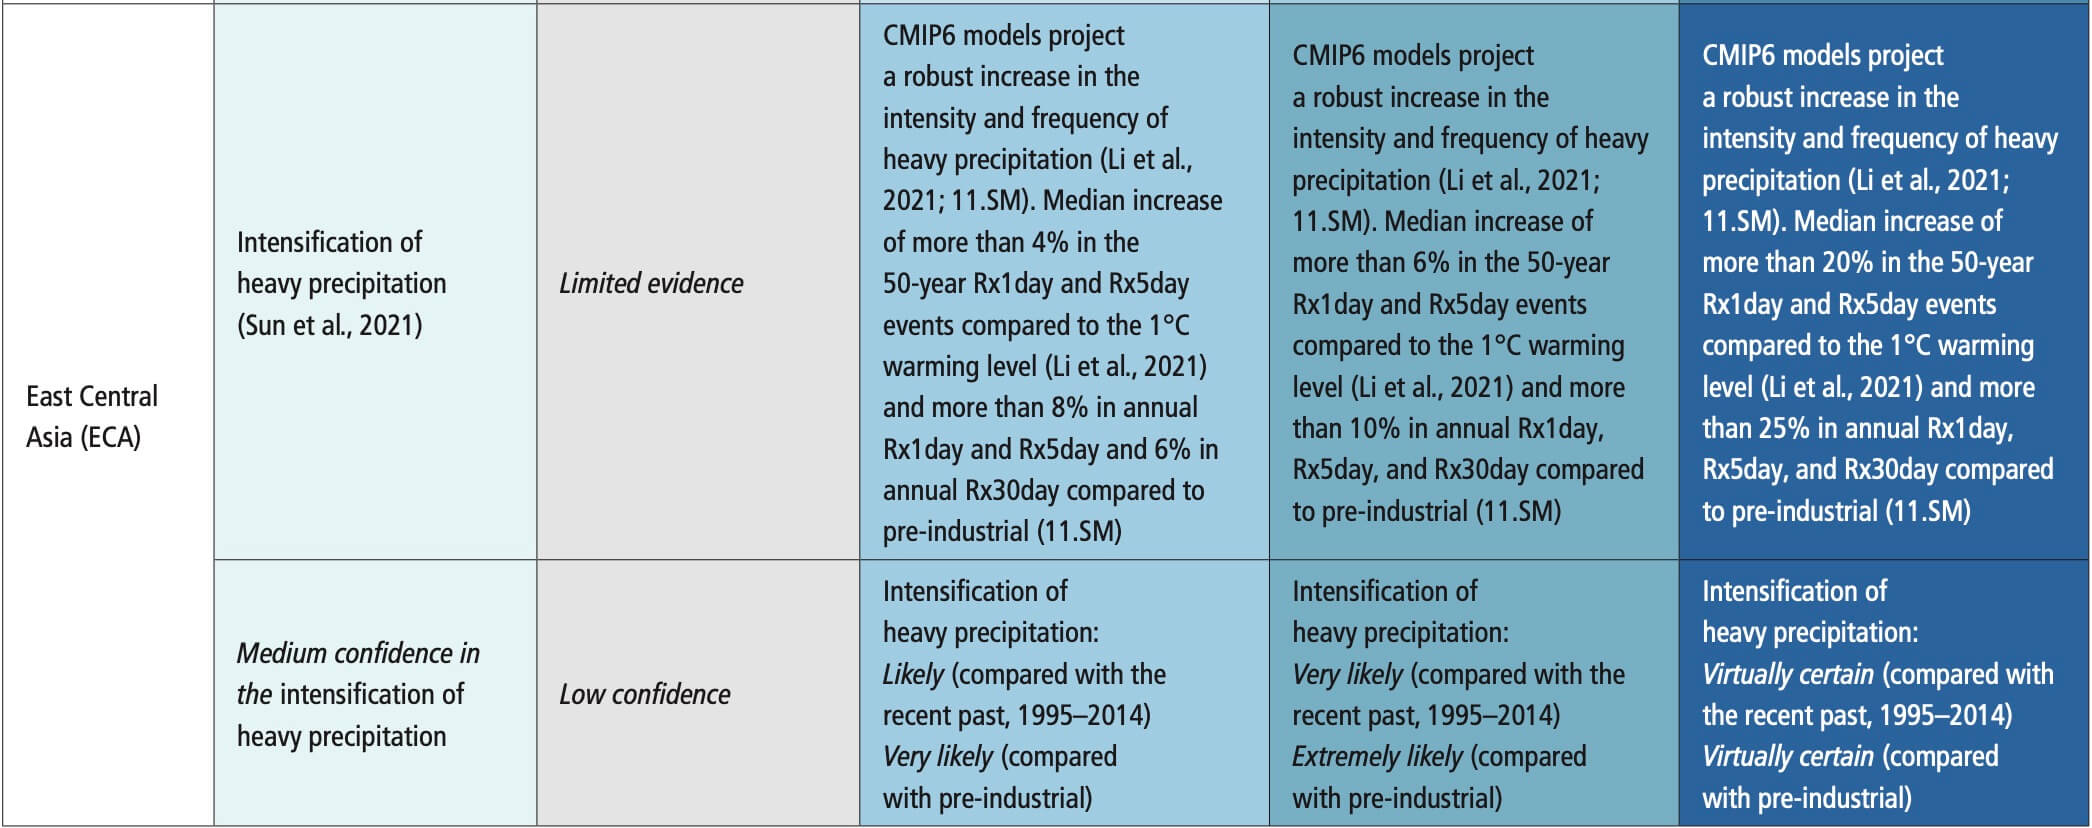
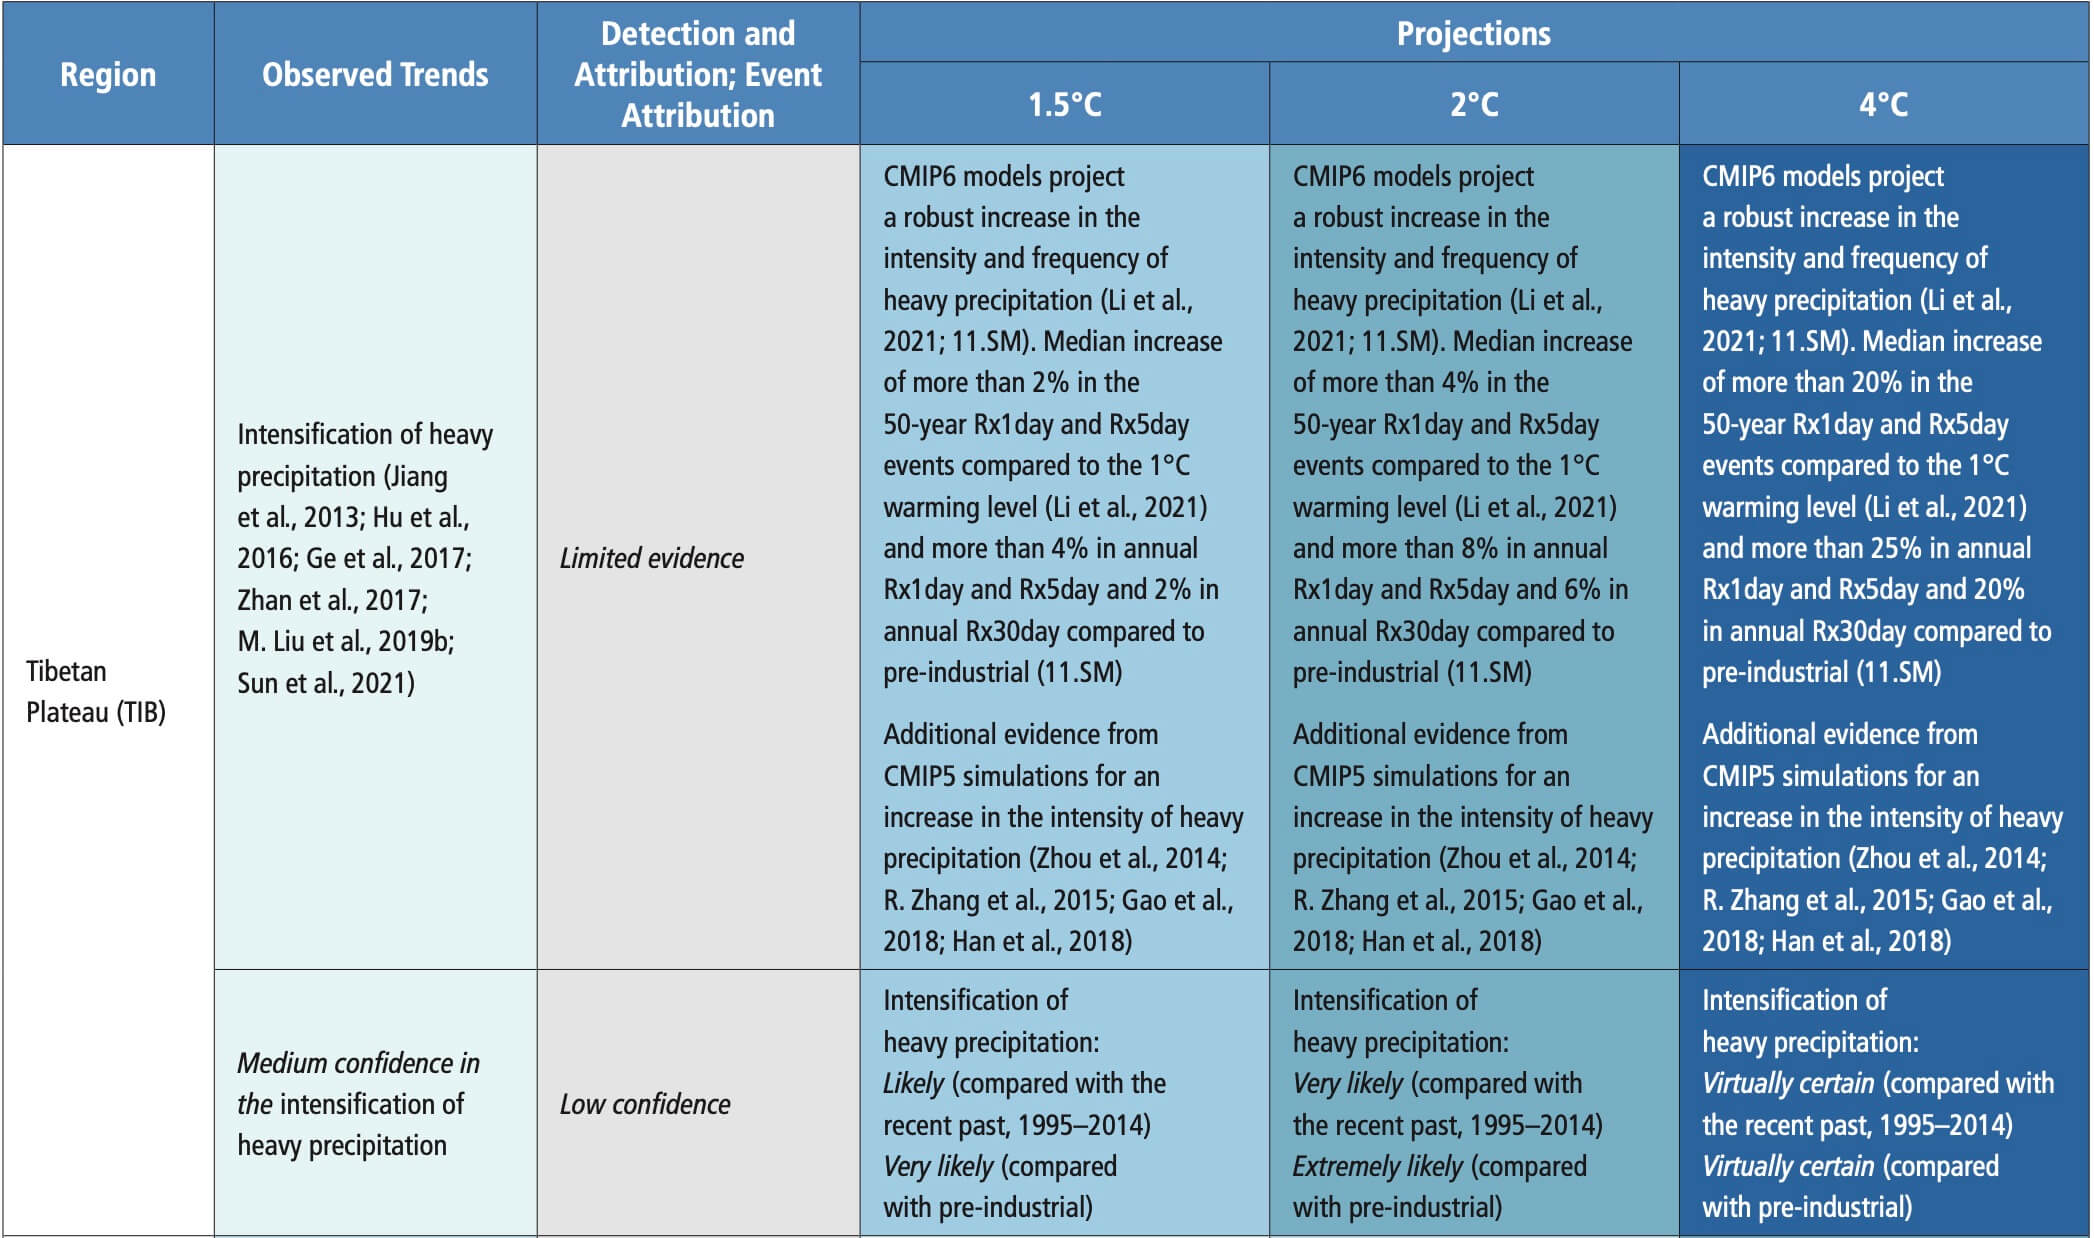
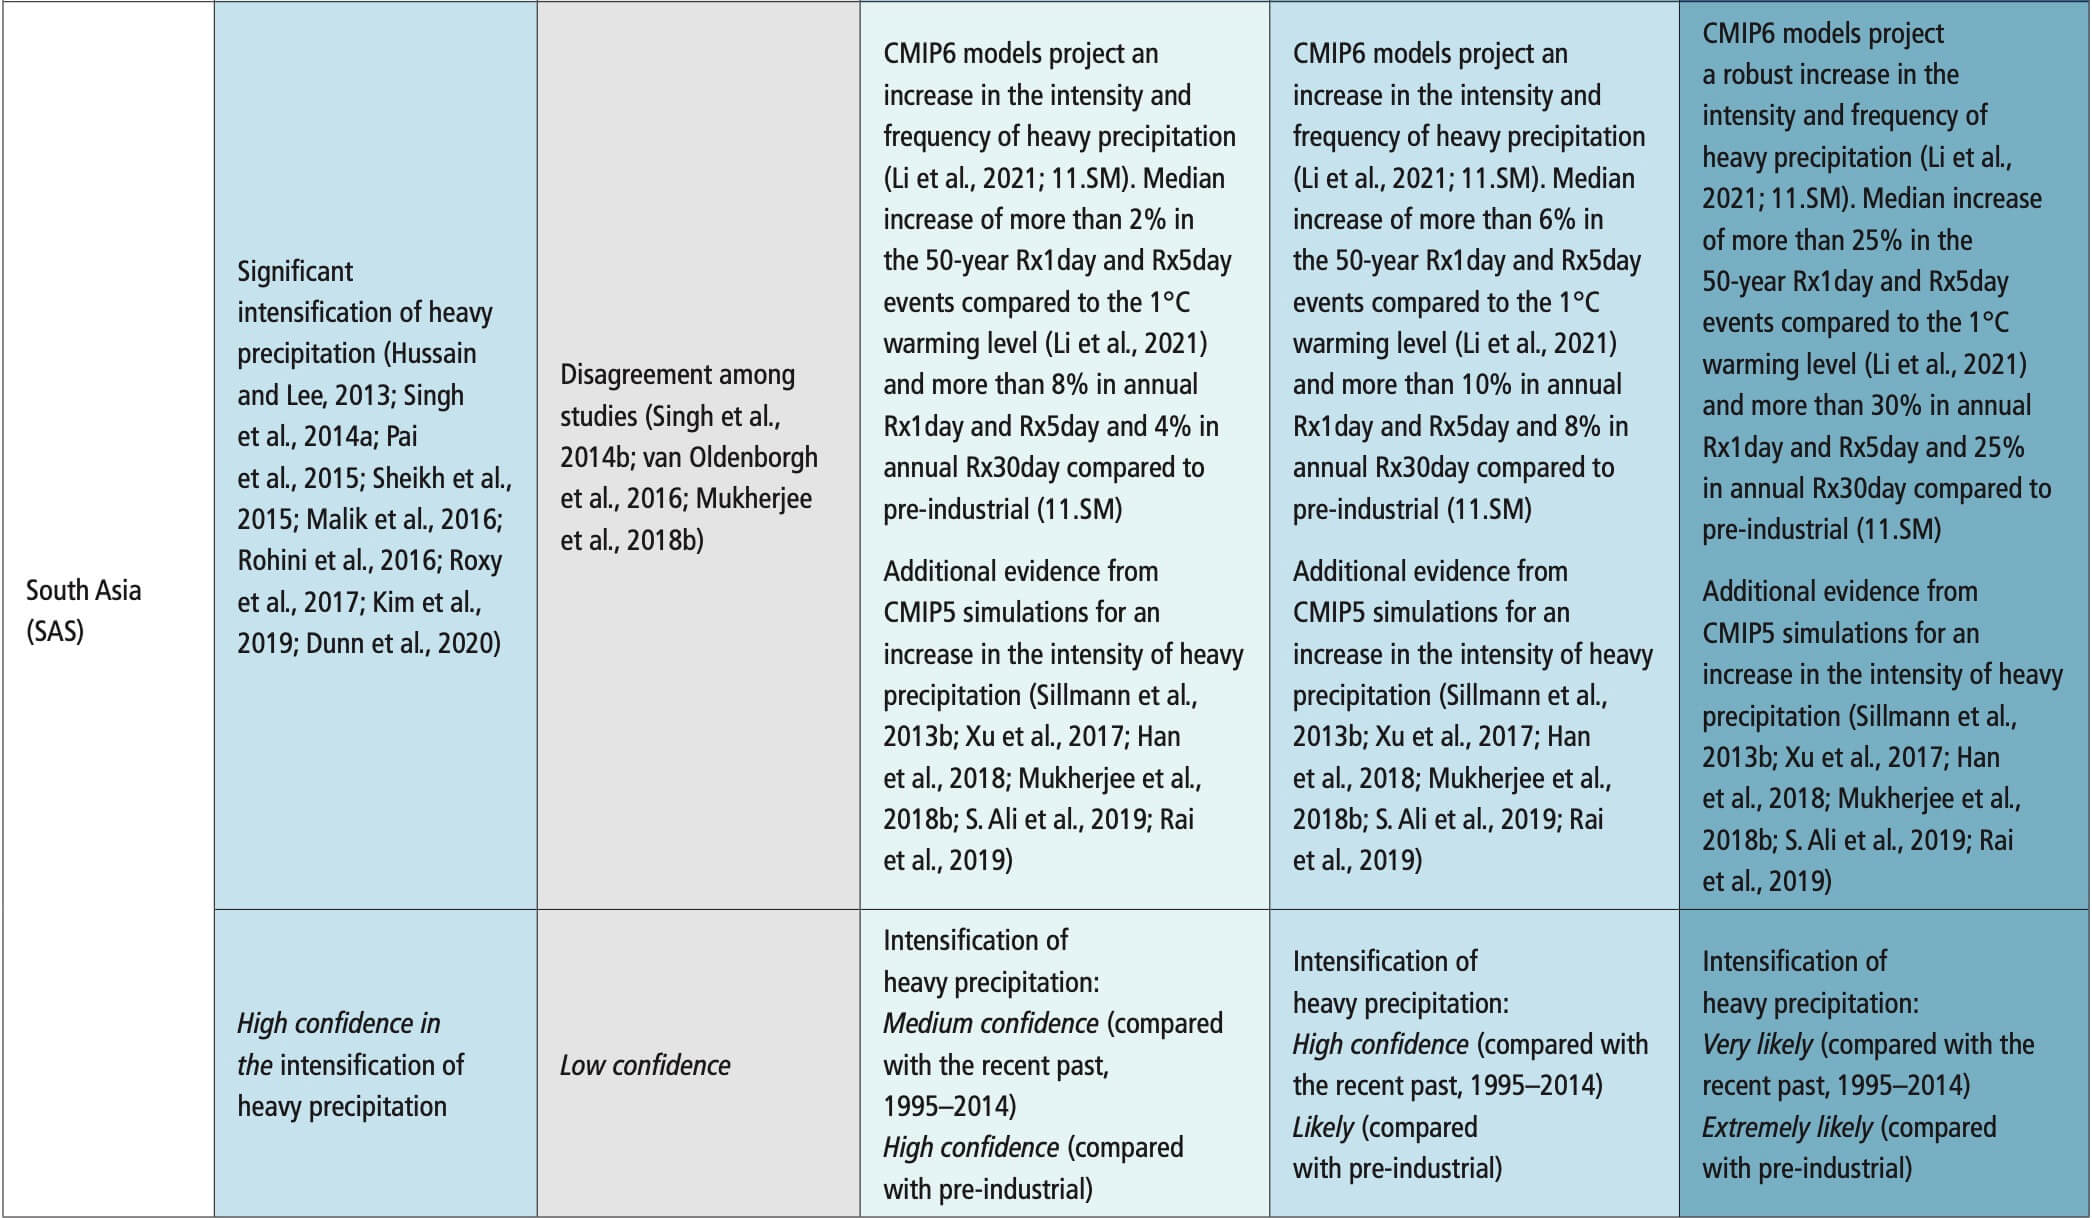
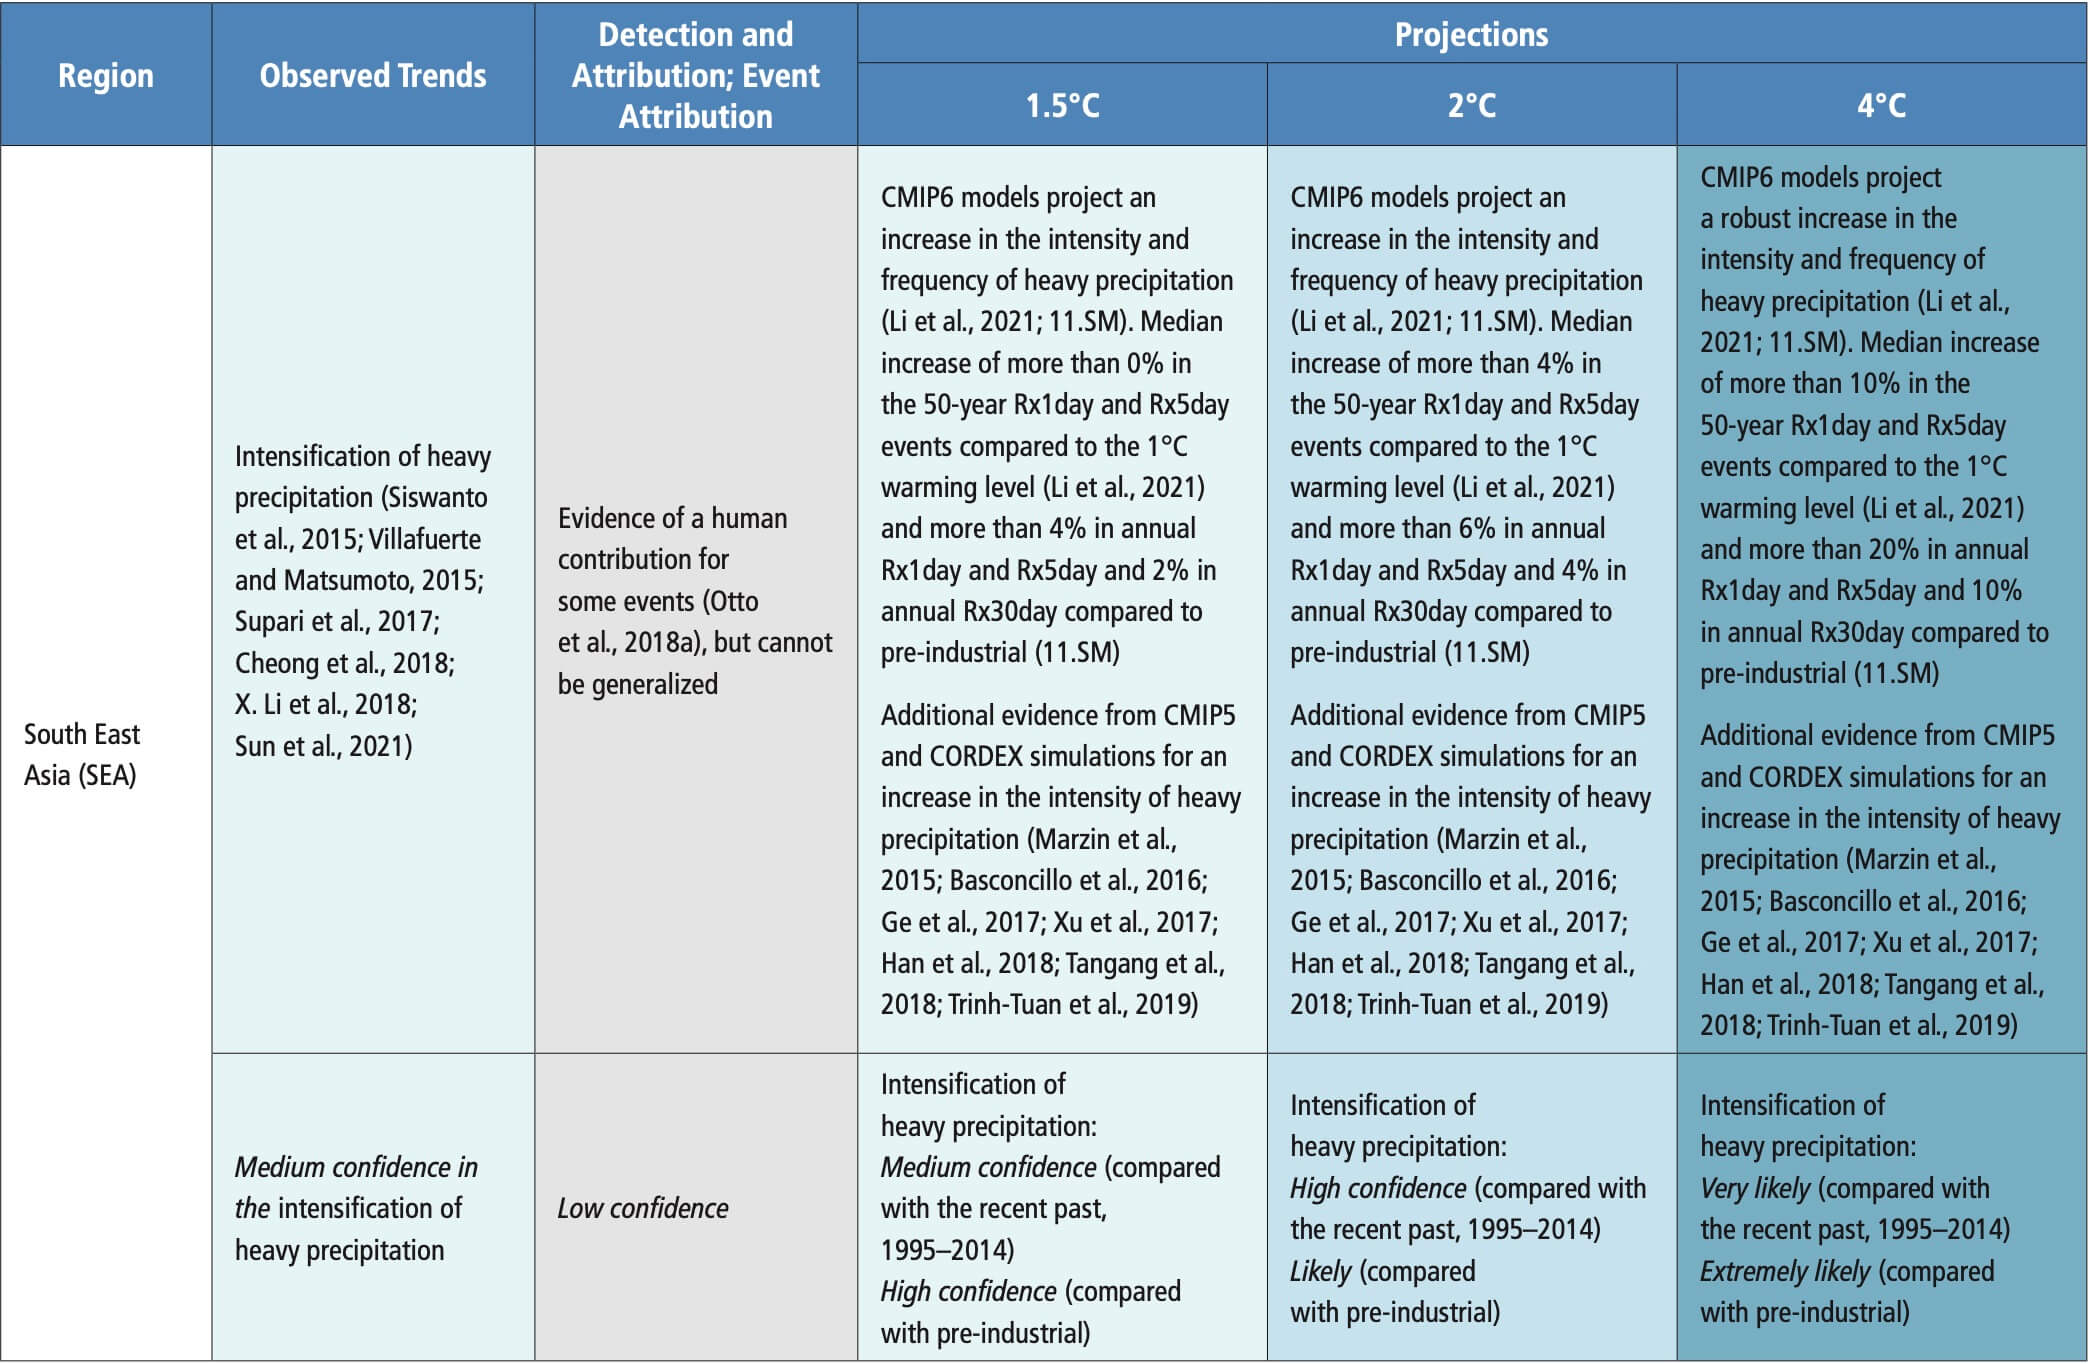 Table 11.9 | Observed trends, human contribution to observed trends, and projected changes at 1.5°C, 2°C and 4°C of global warming for meteorological droughts (MET), agricultural and ecological droughts (AGR/ECOL), and hydrological droughts (HYDR) in Asia, subdivided by AR6 regions. See Sections 11.9.1 and 11.9.4 for details.
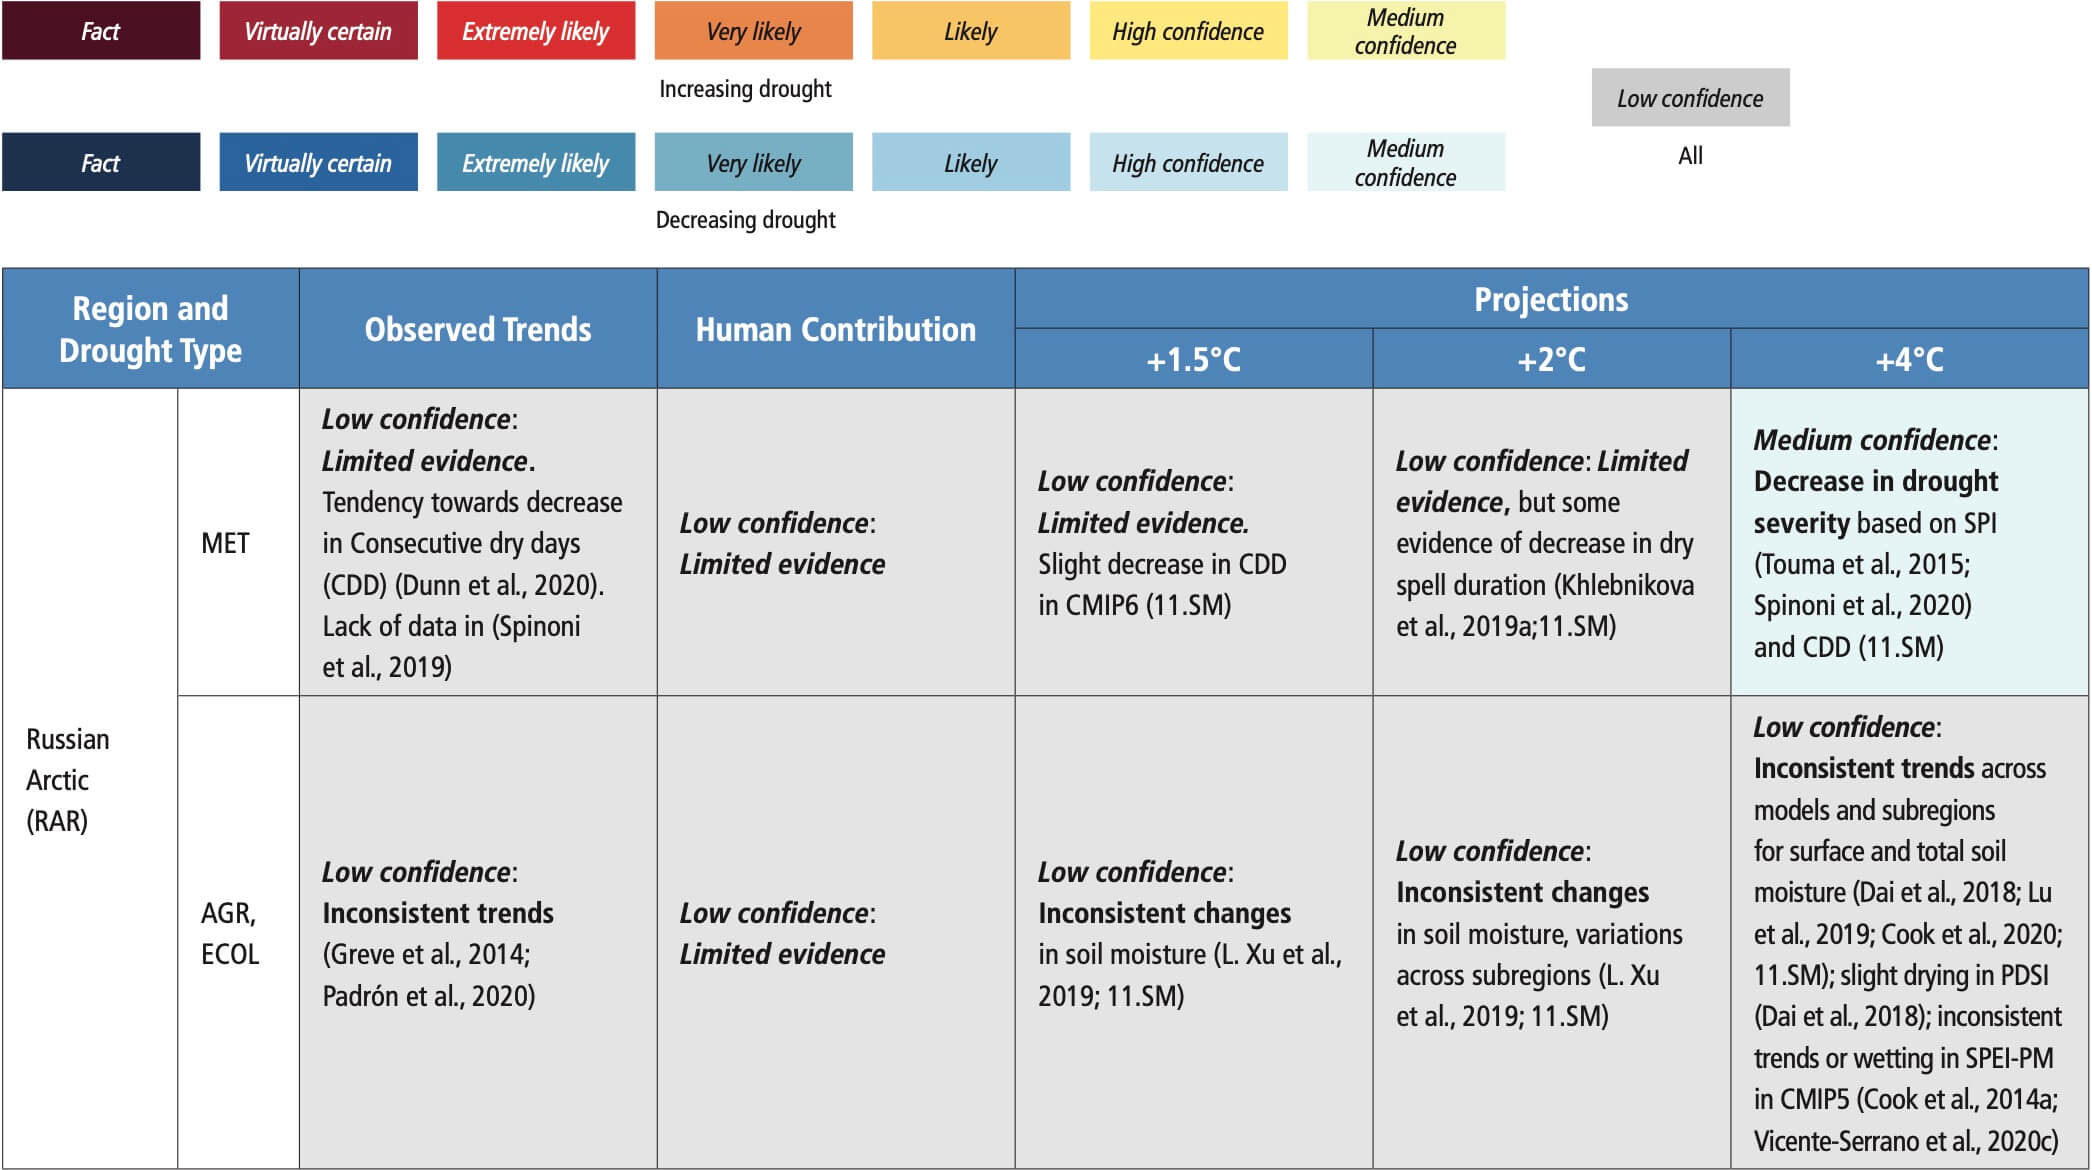
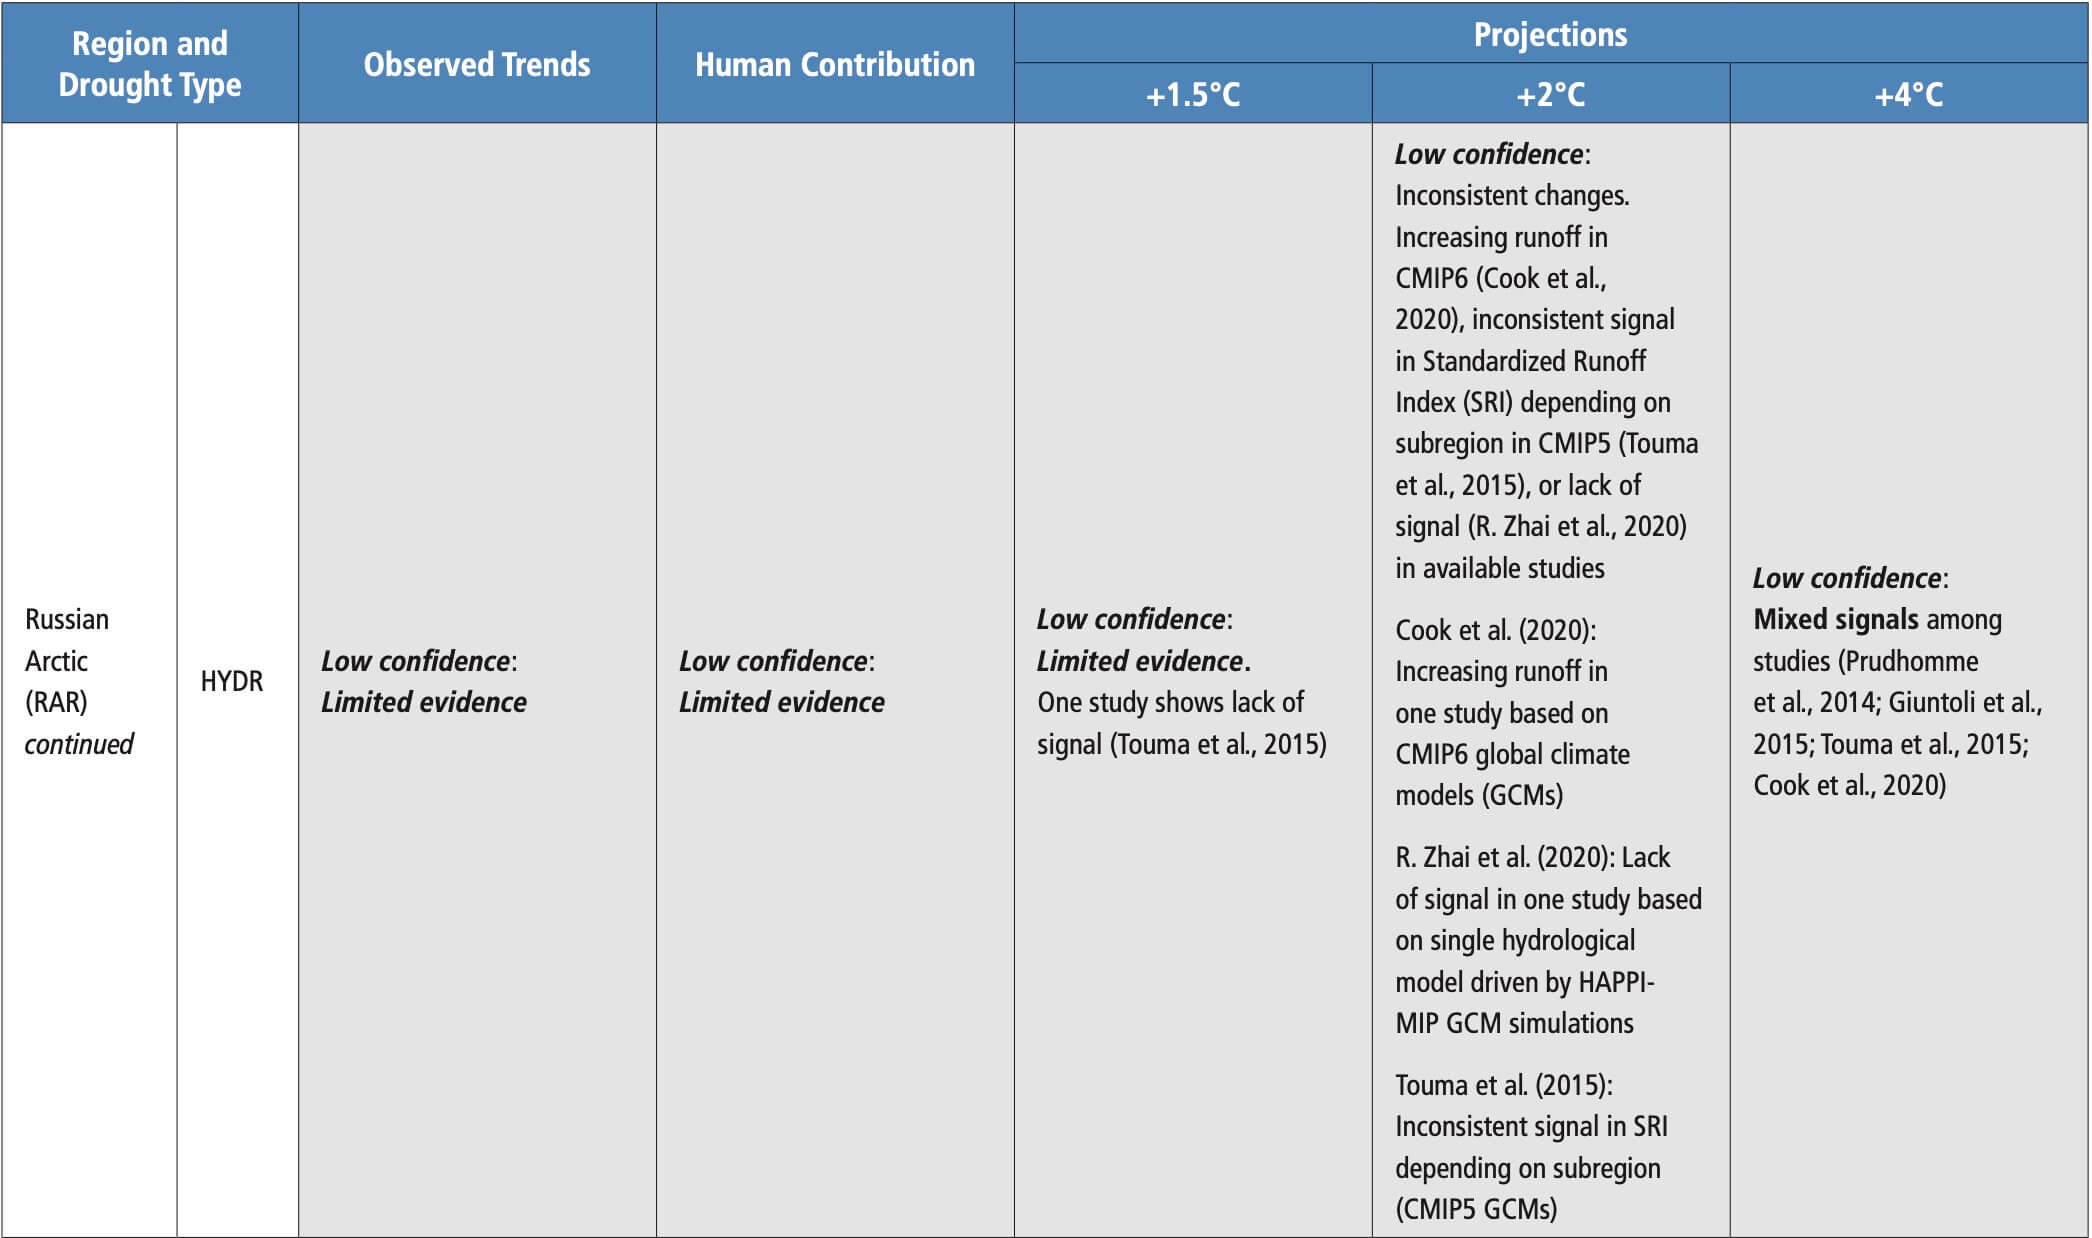
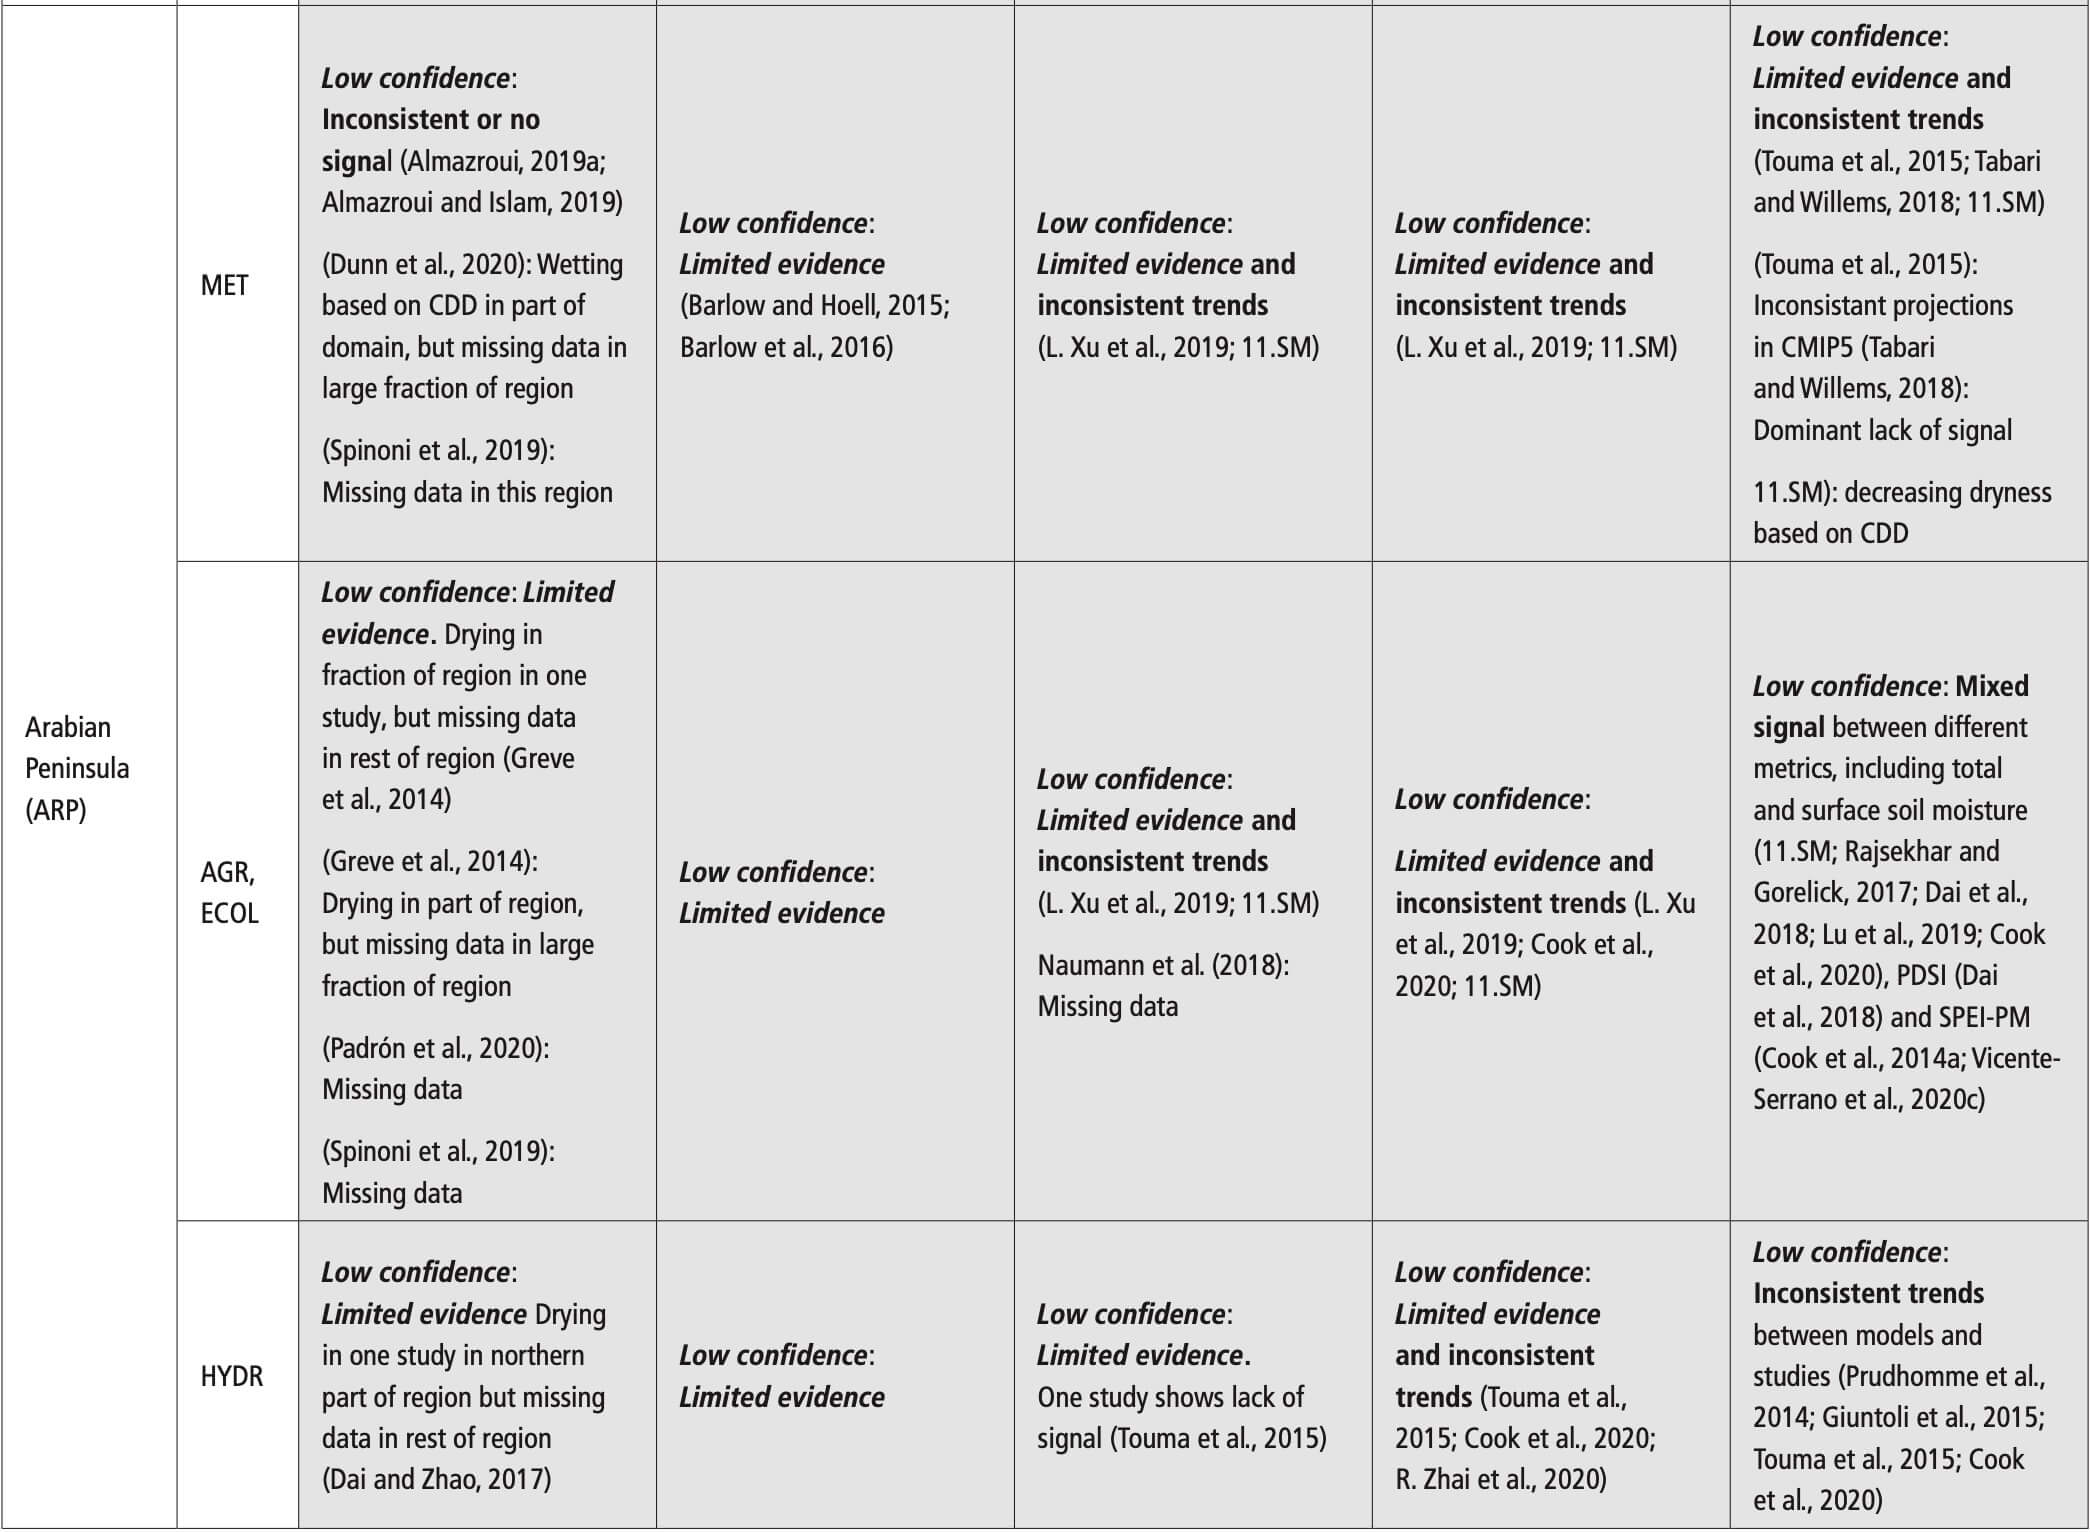
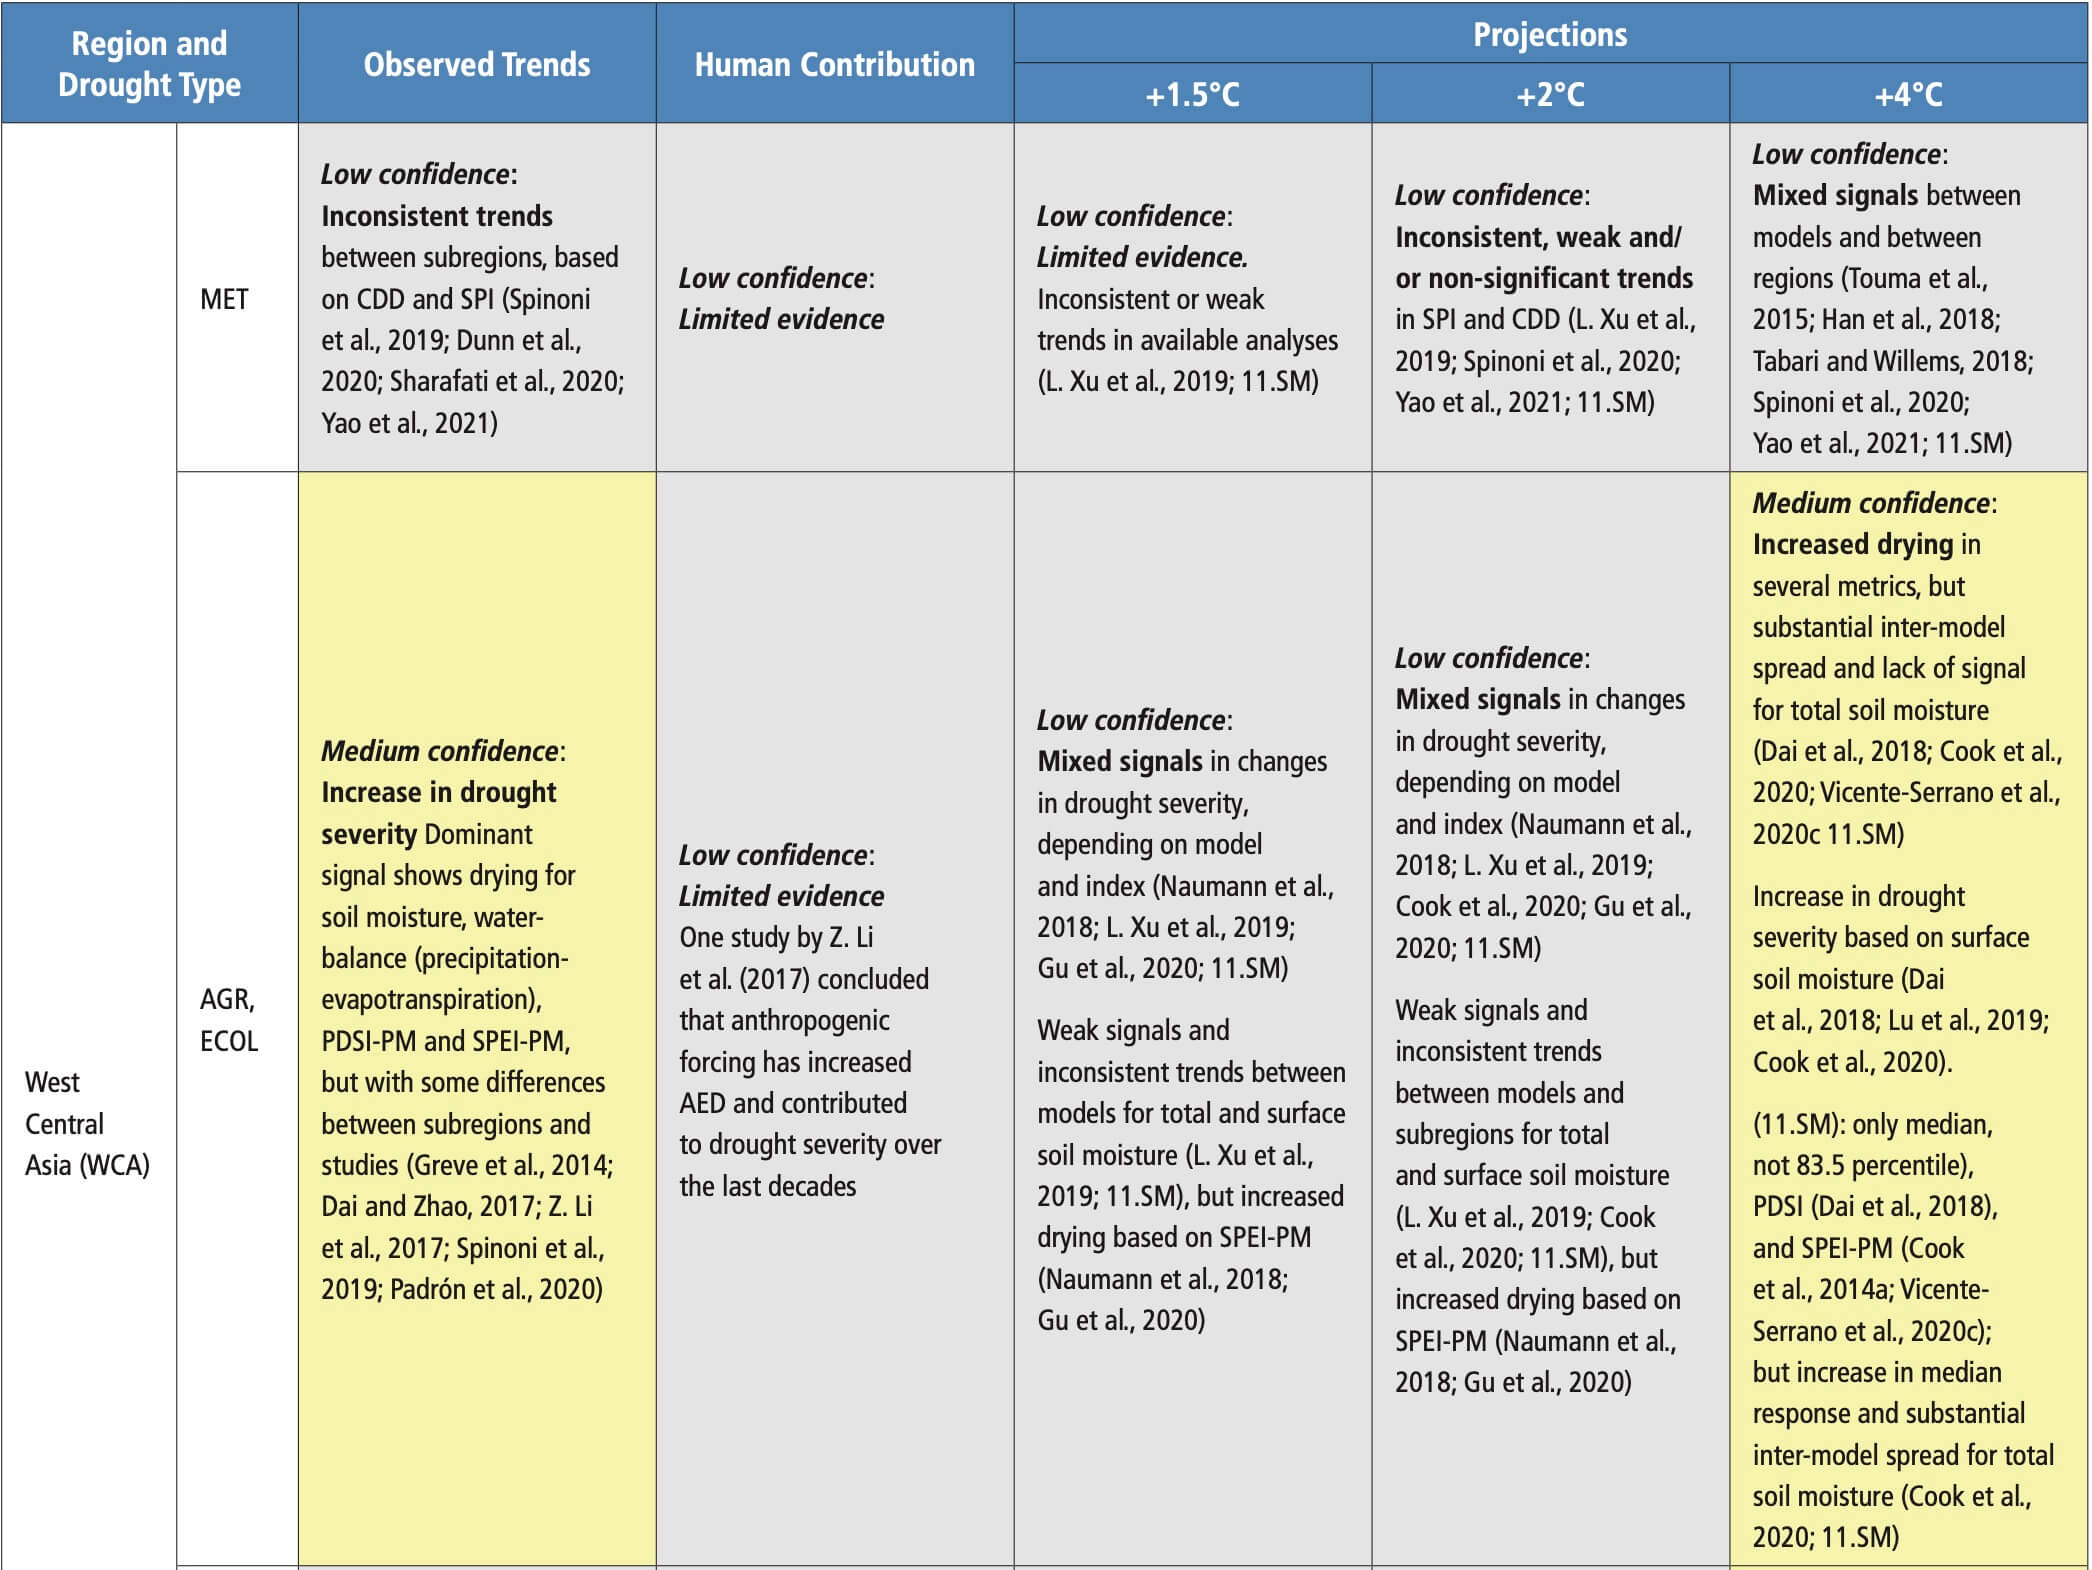
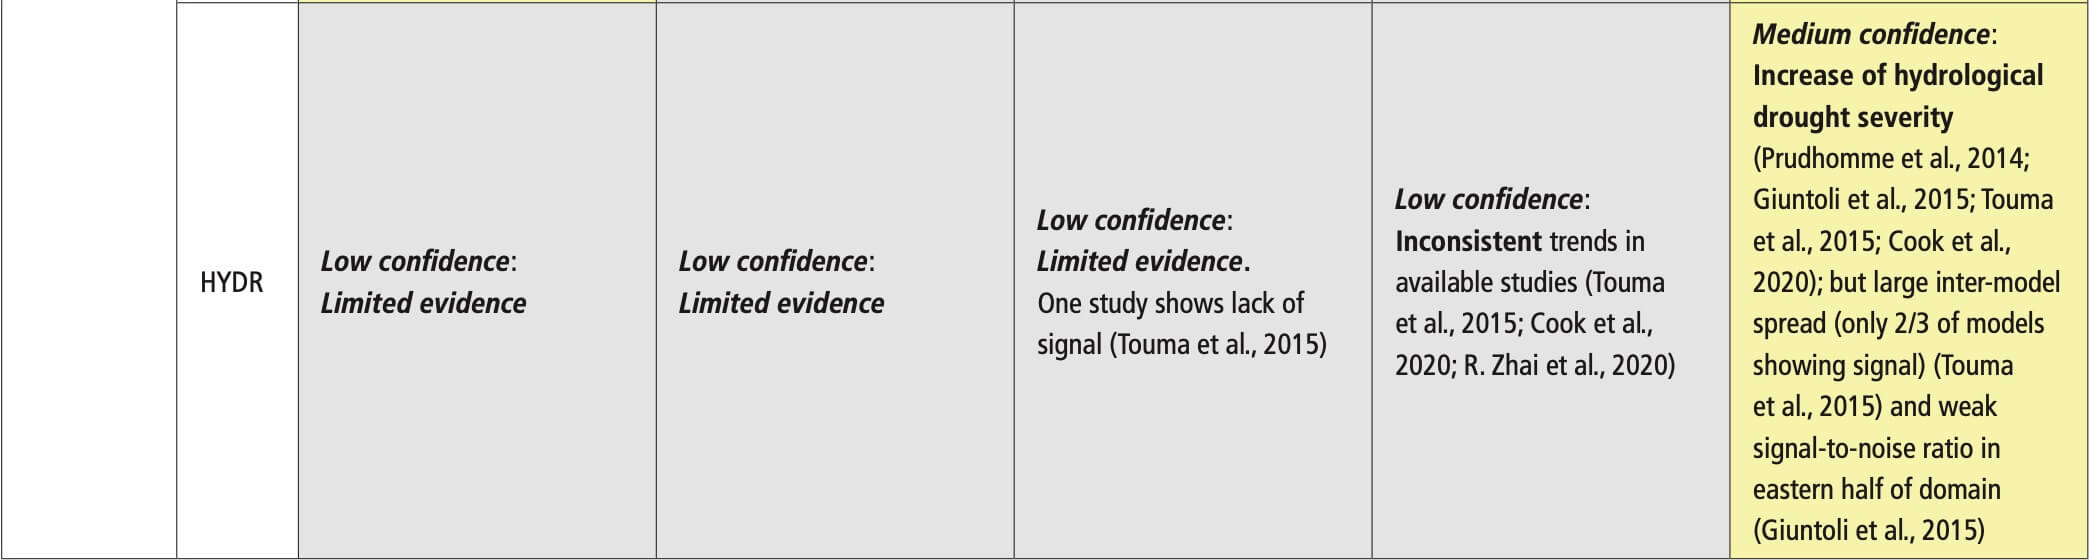
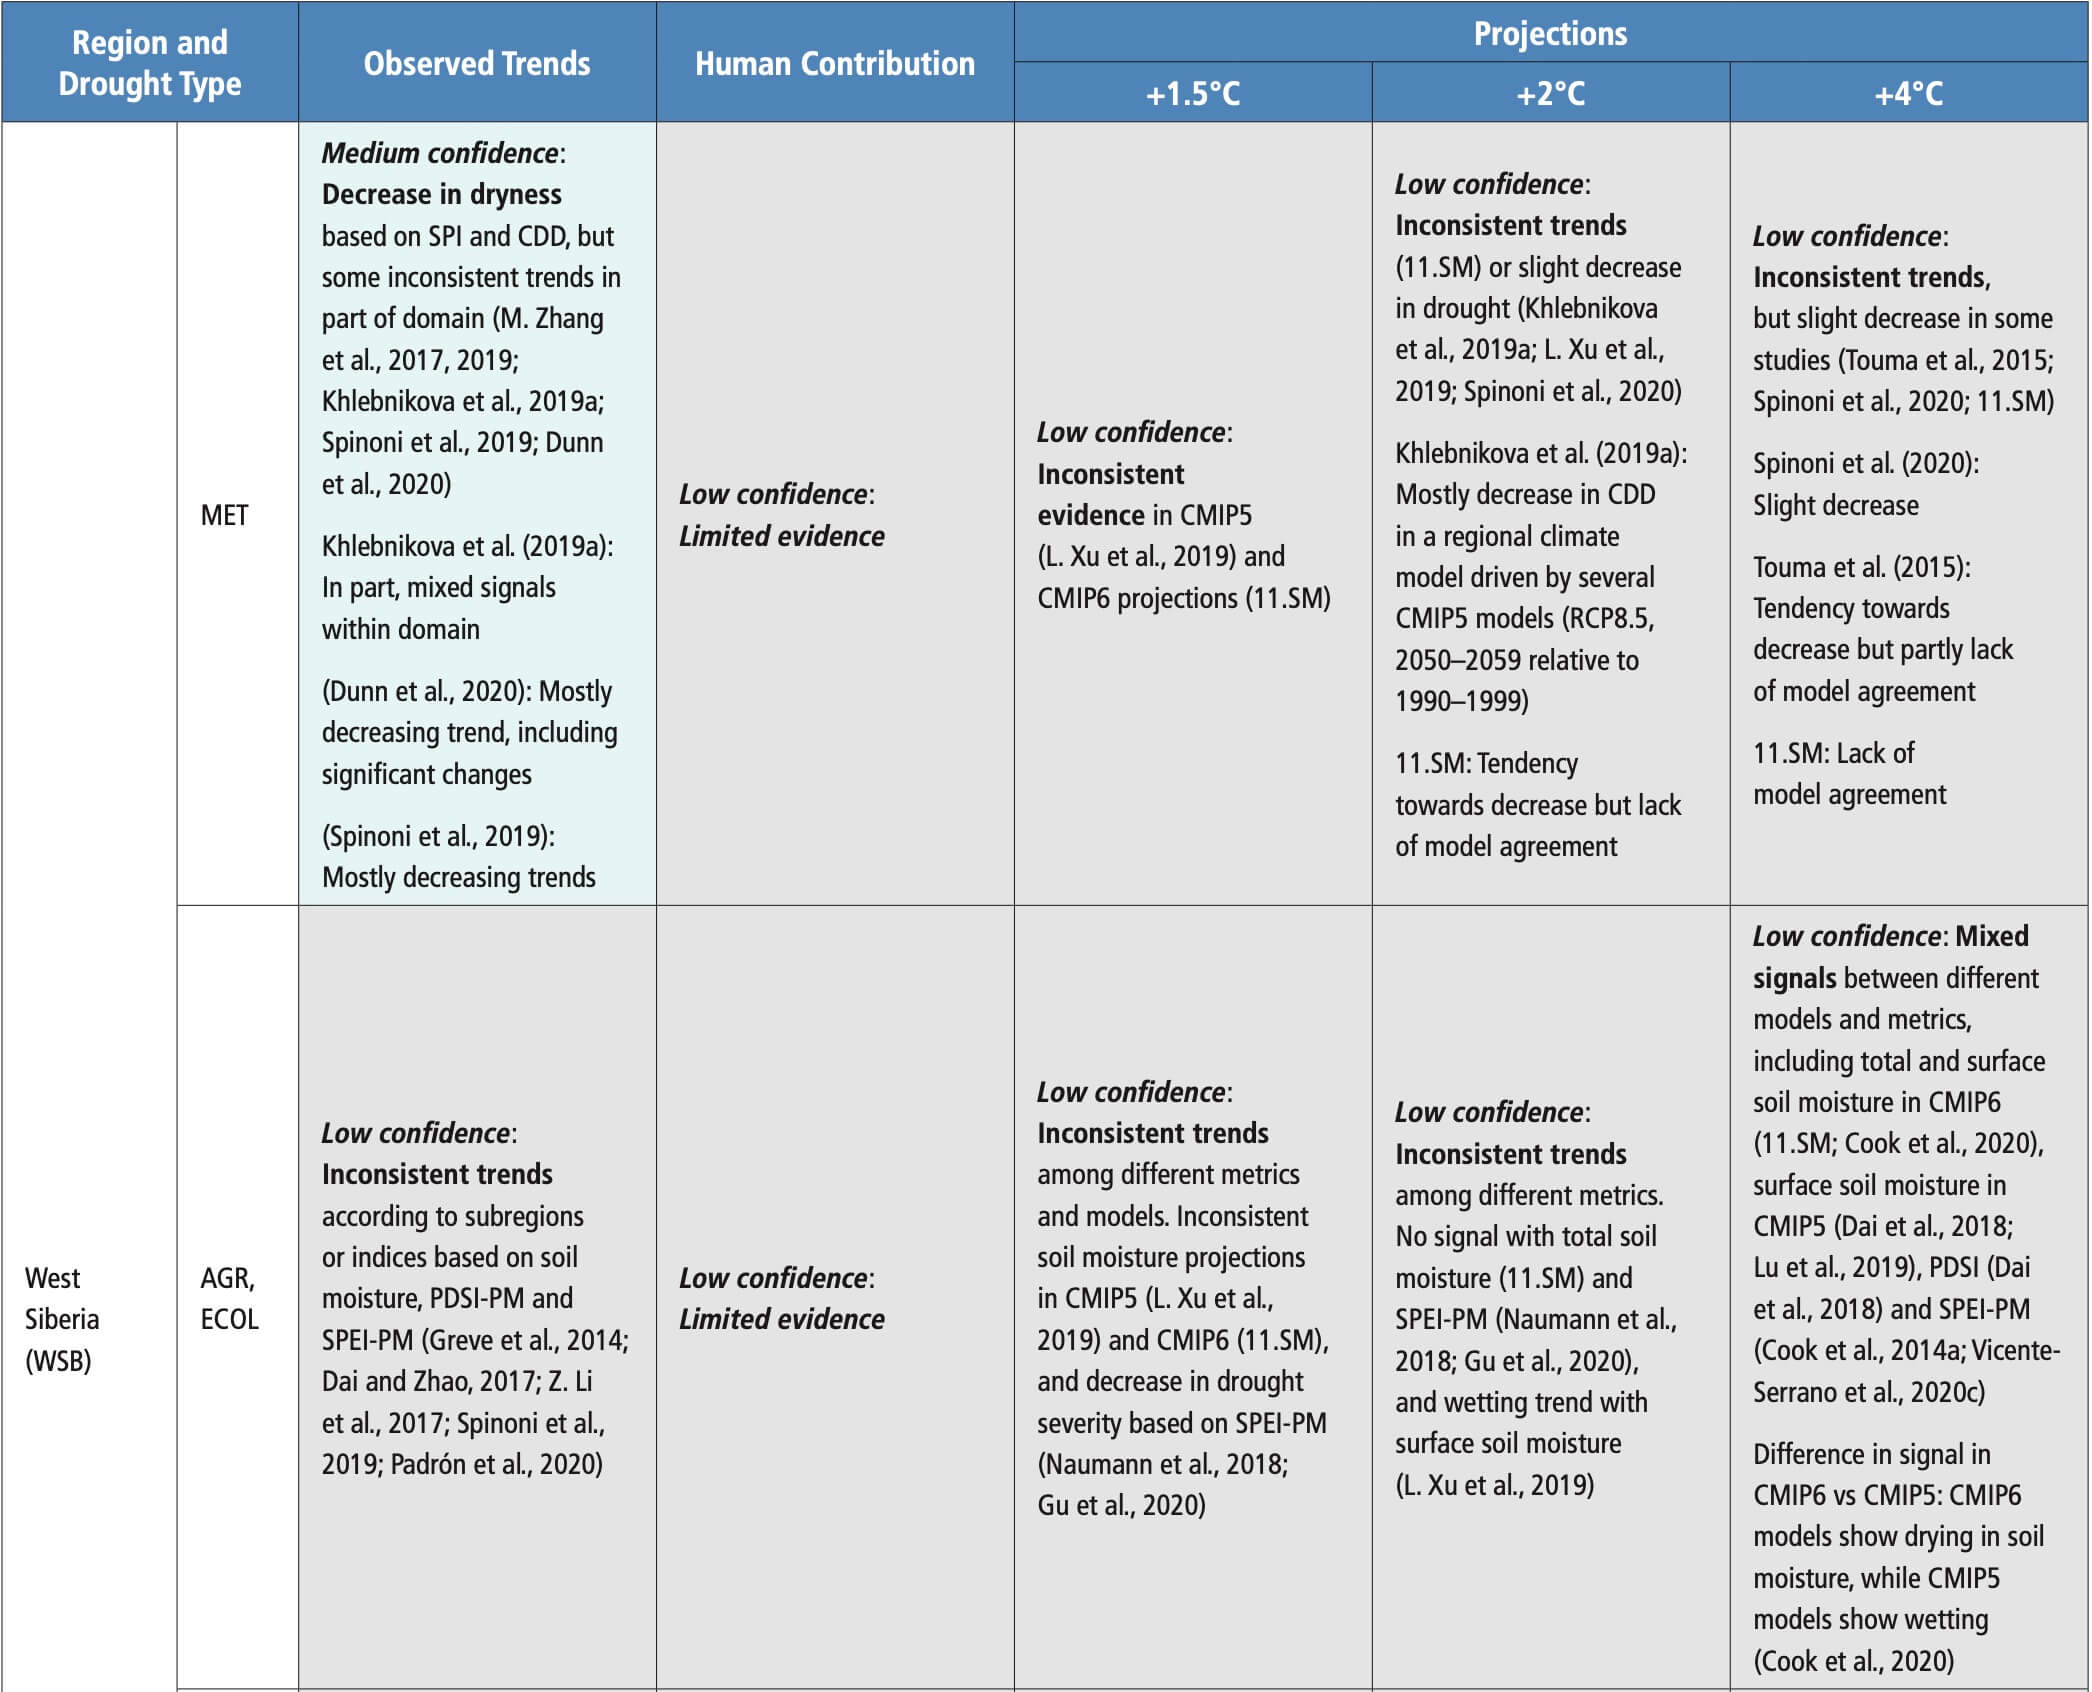
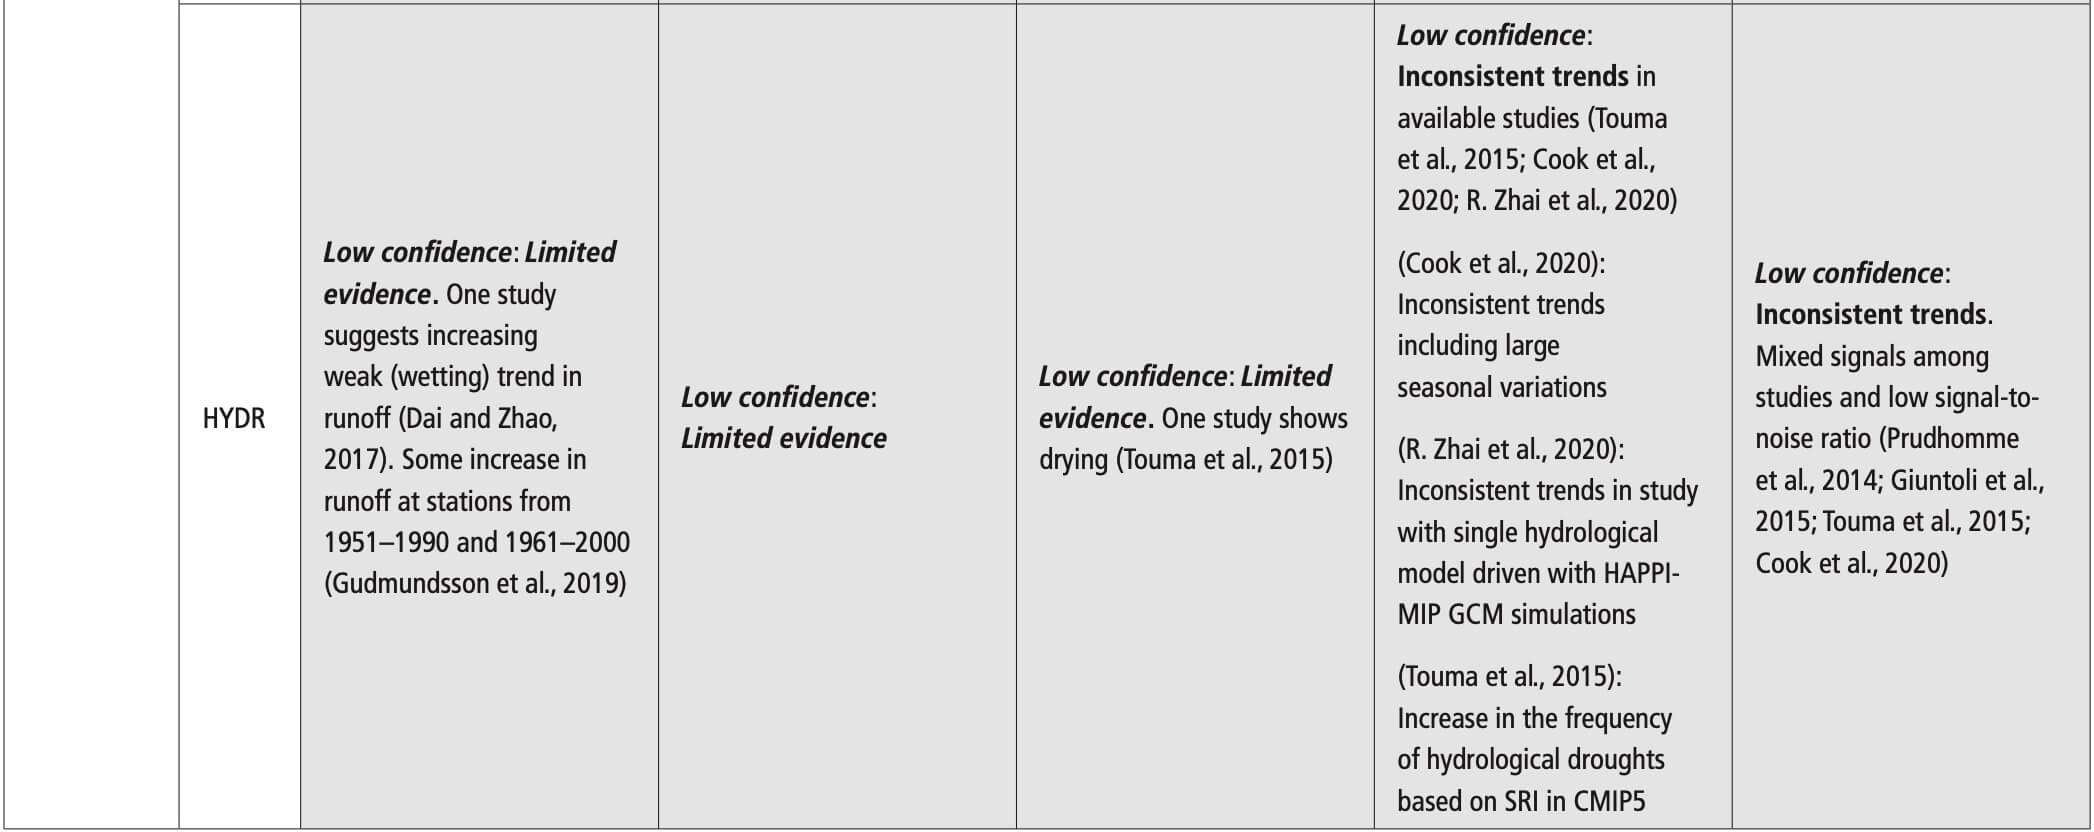
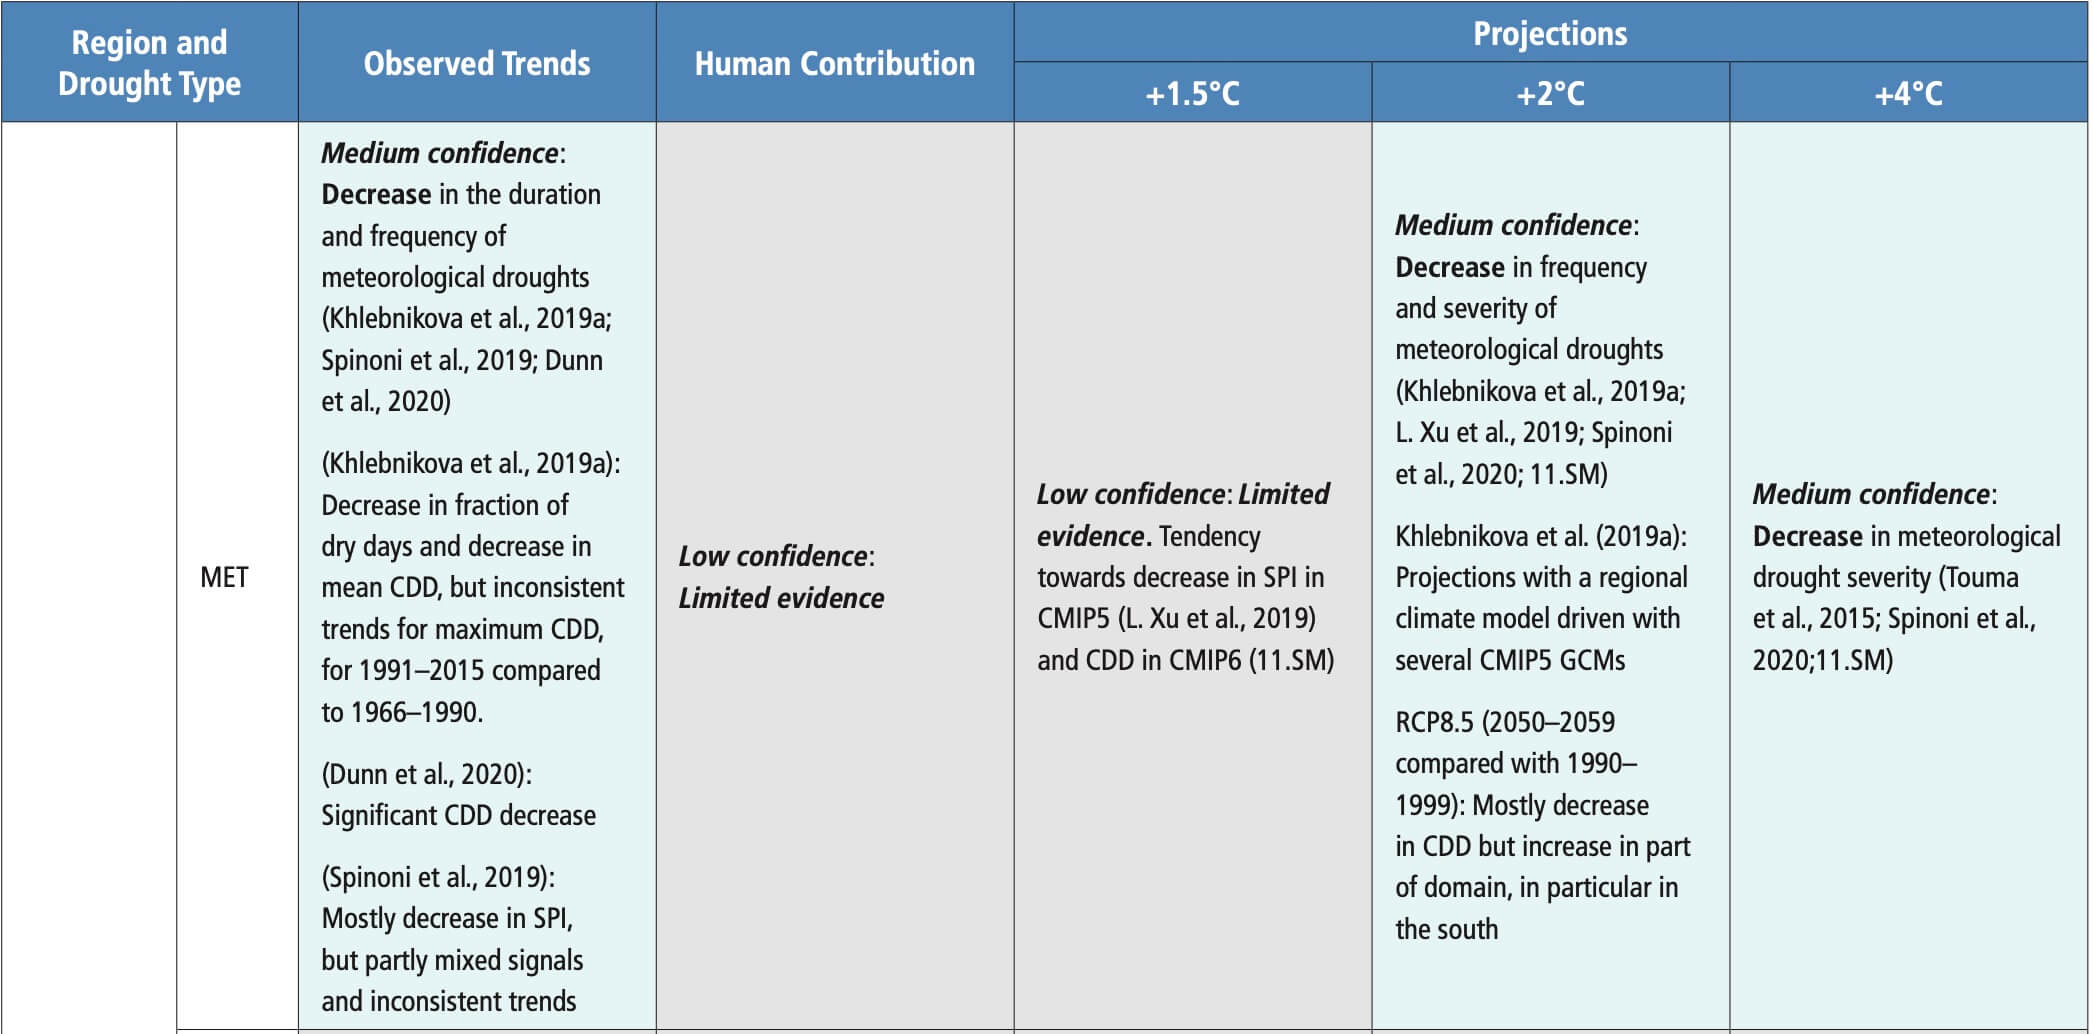
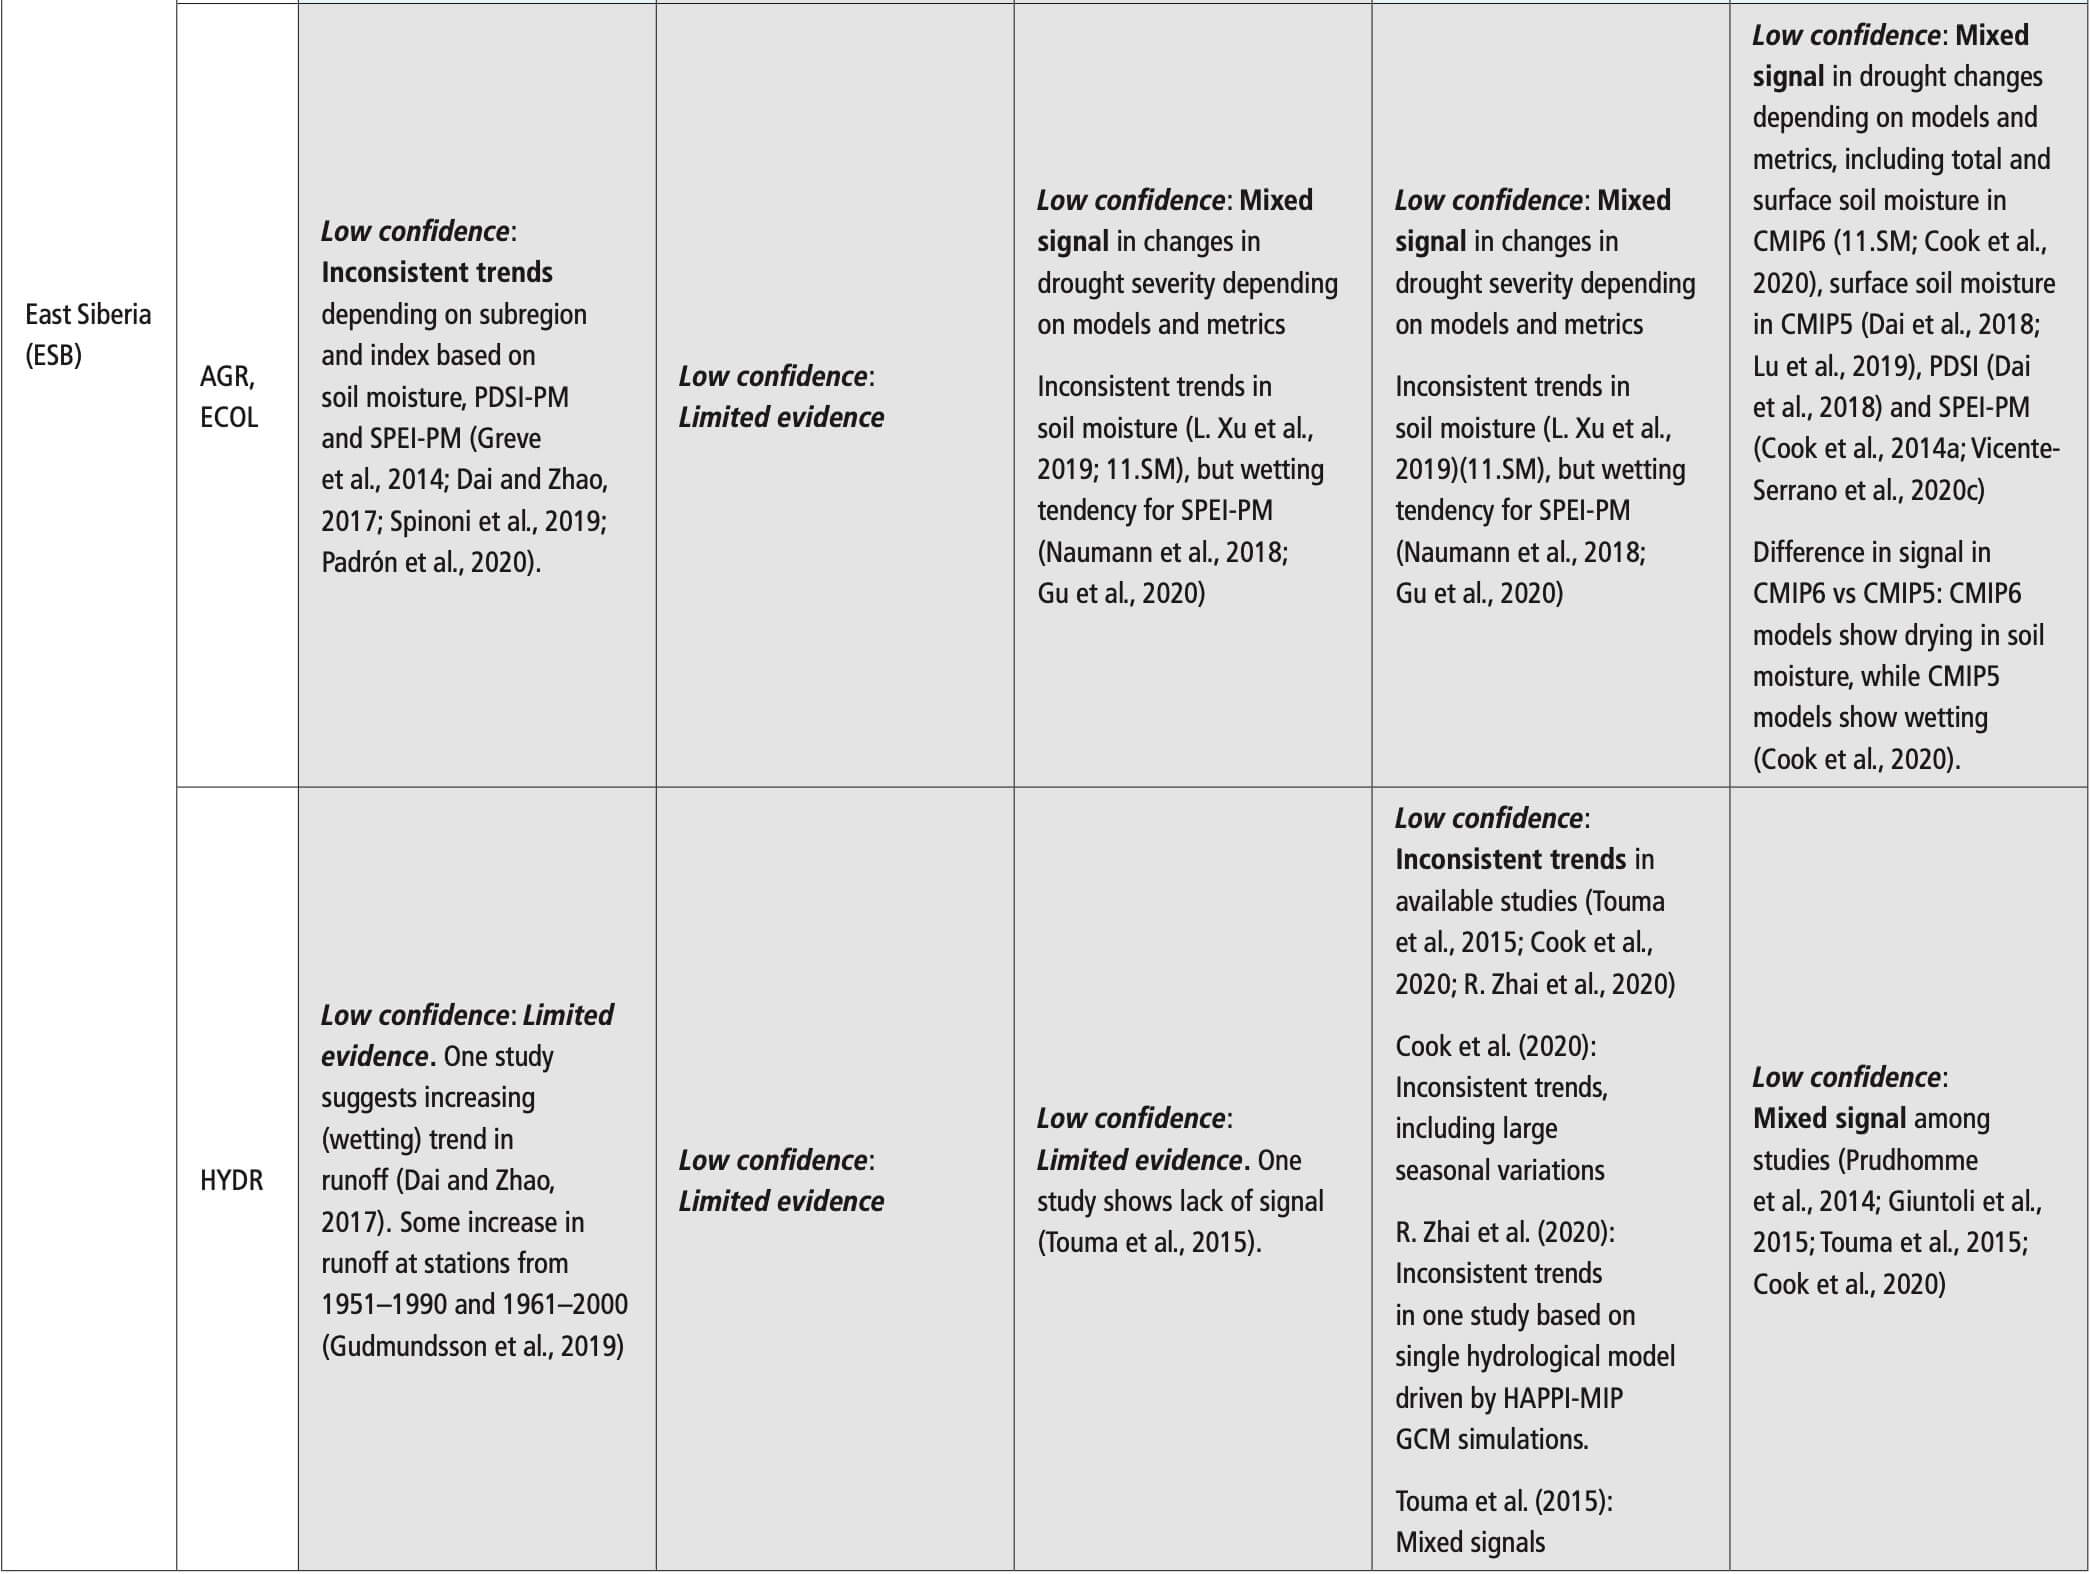
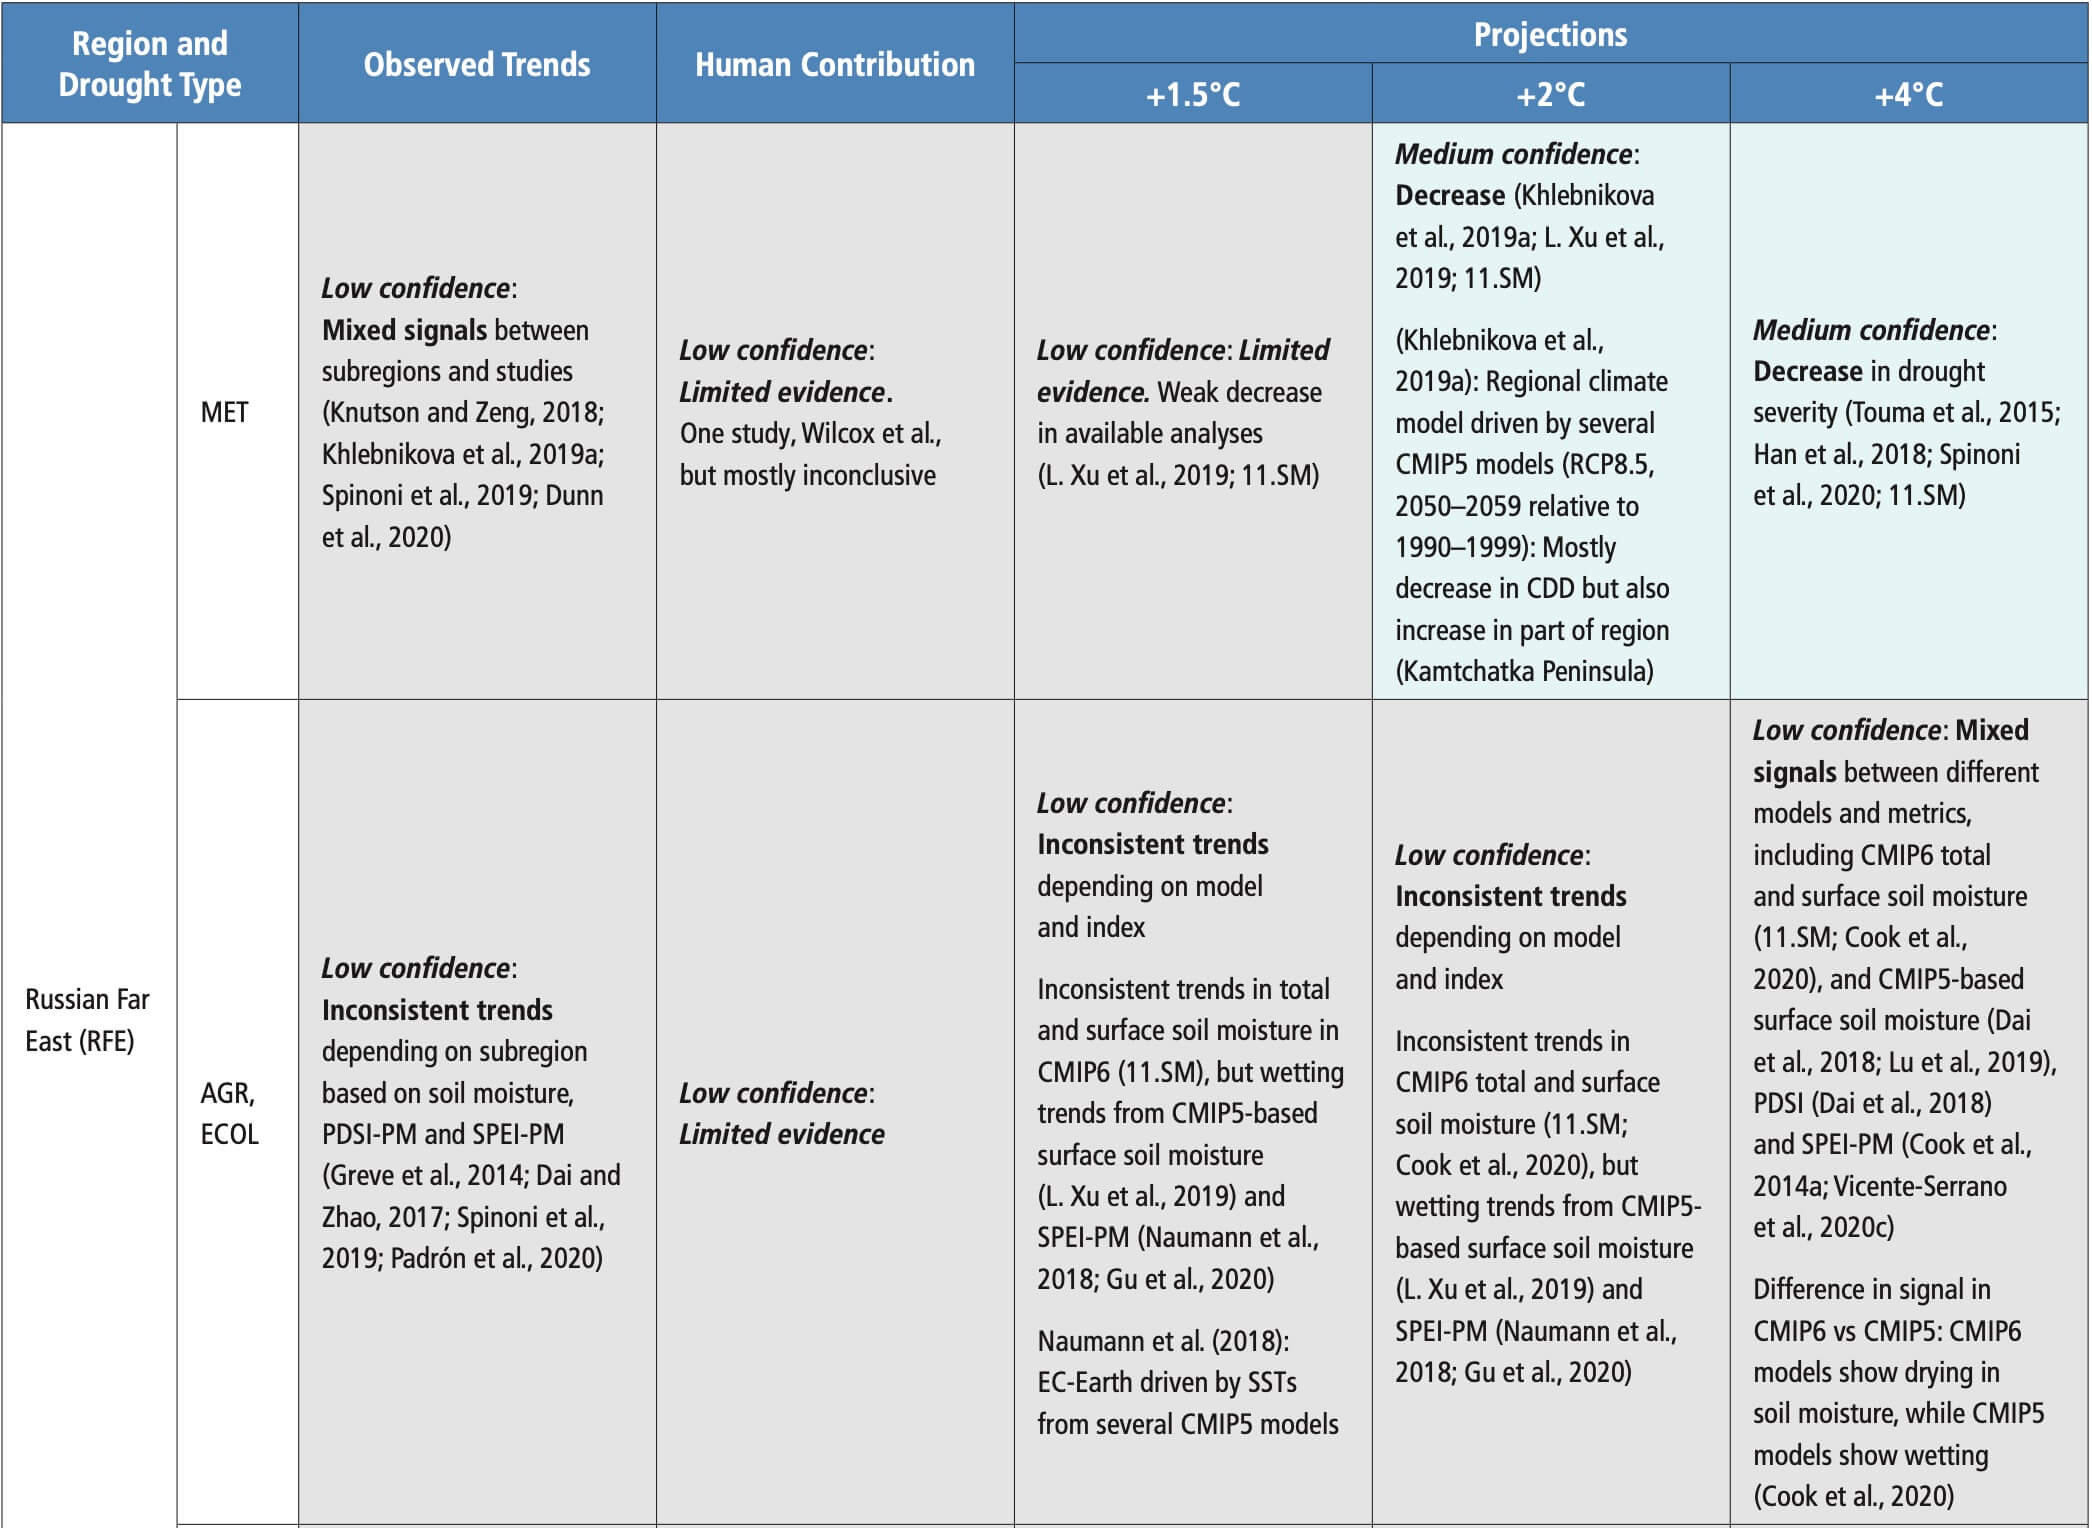
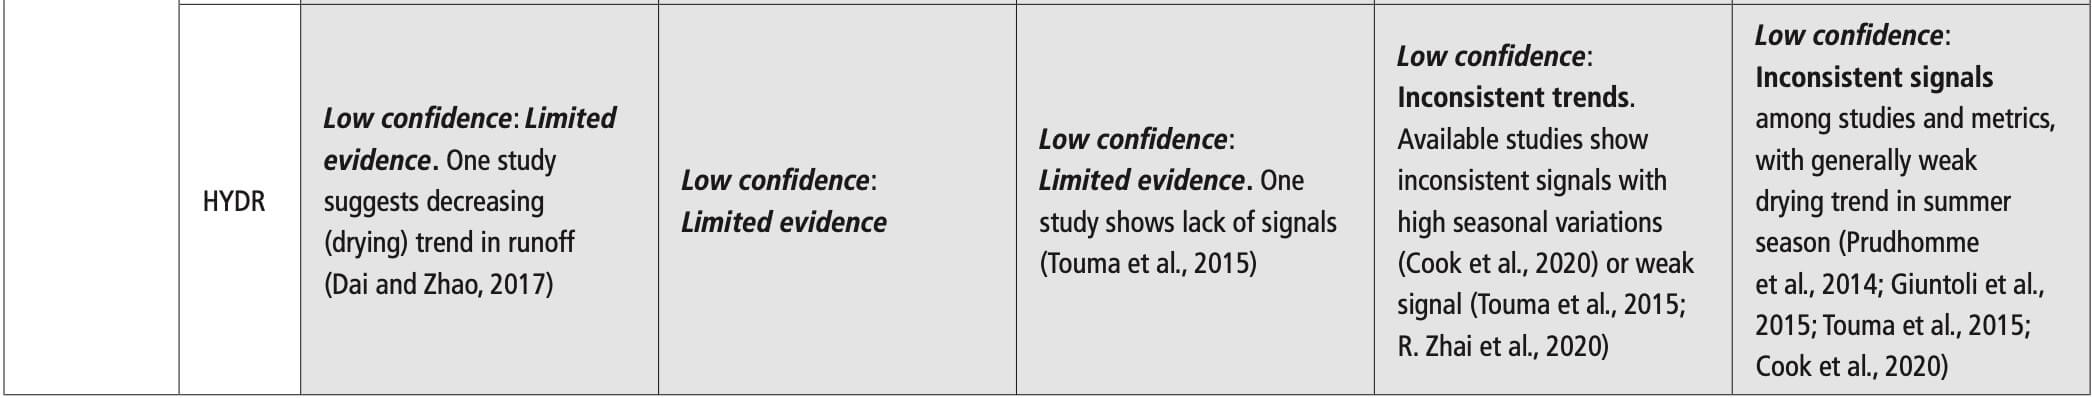
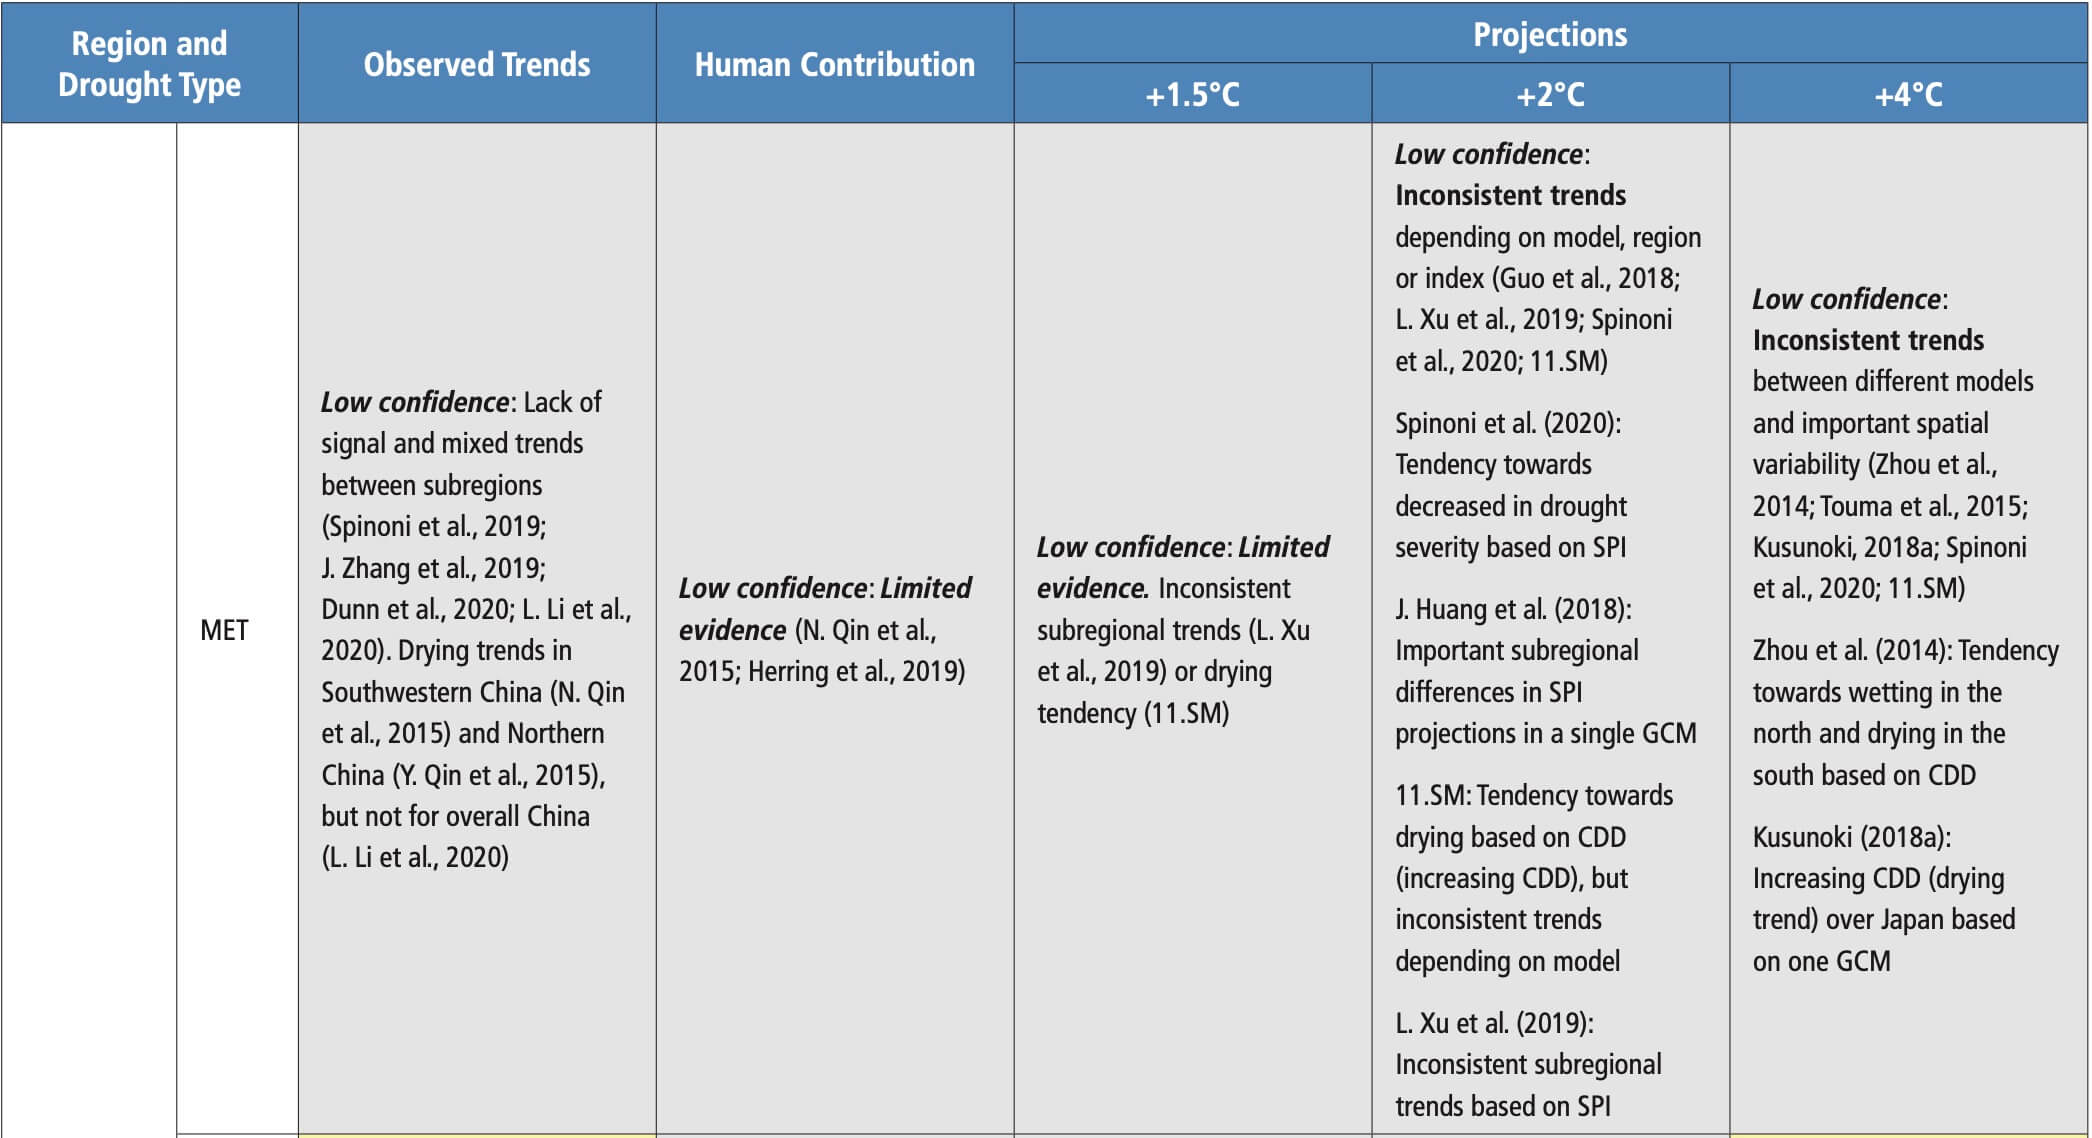
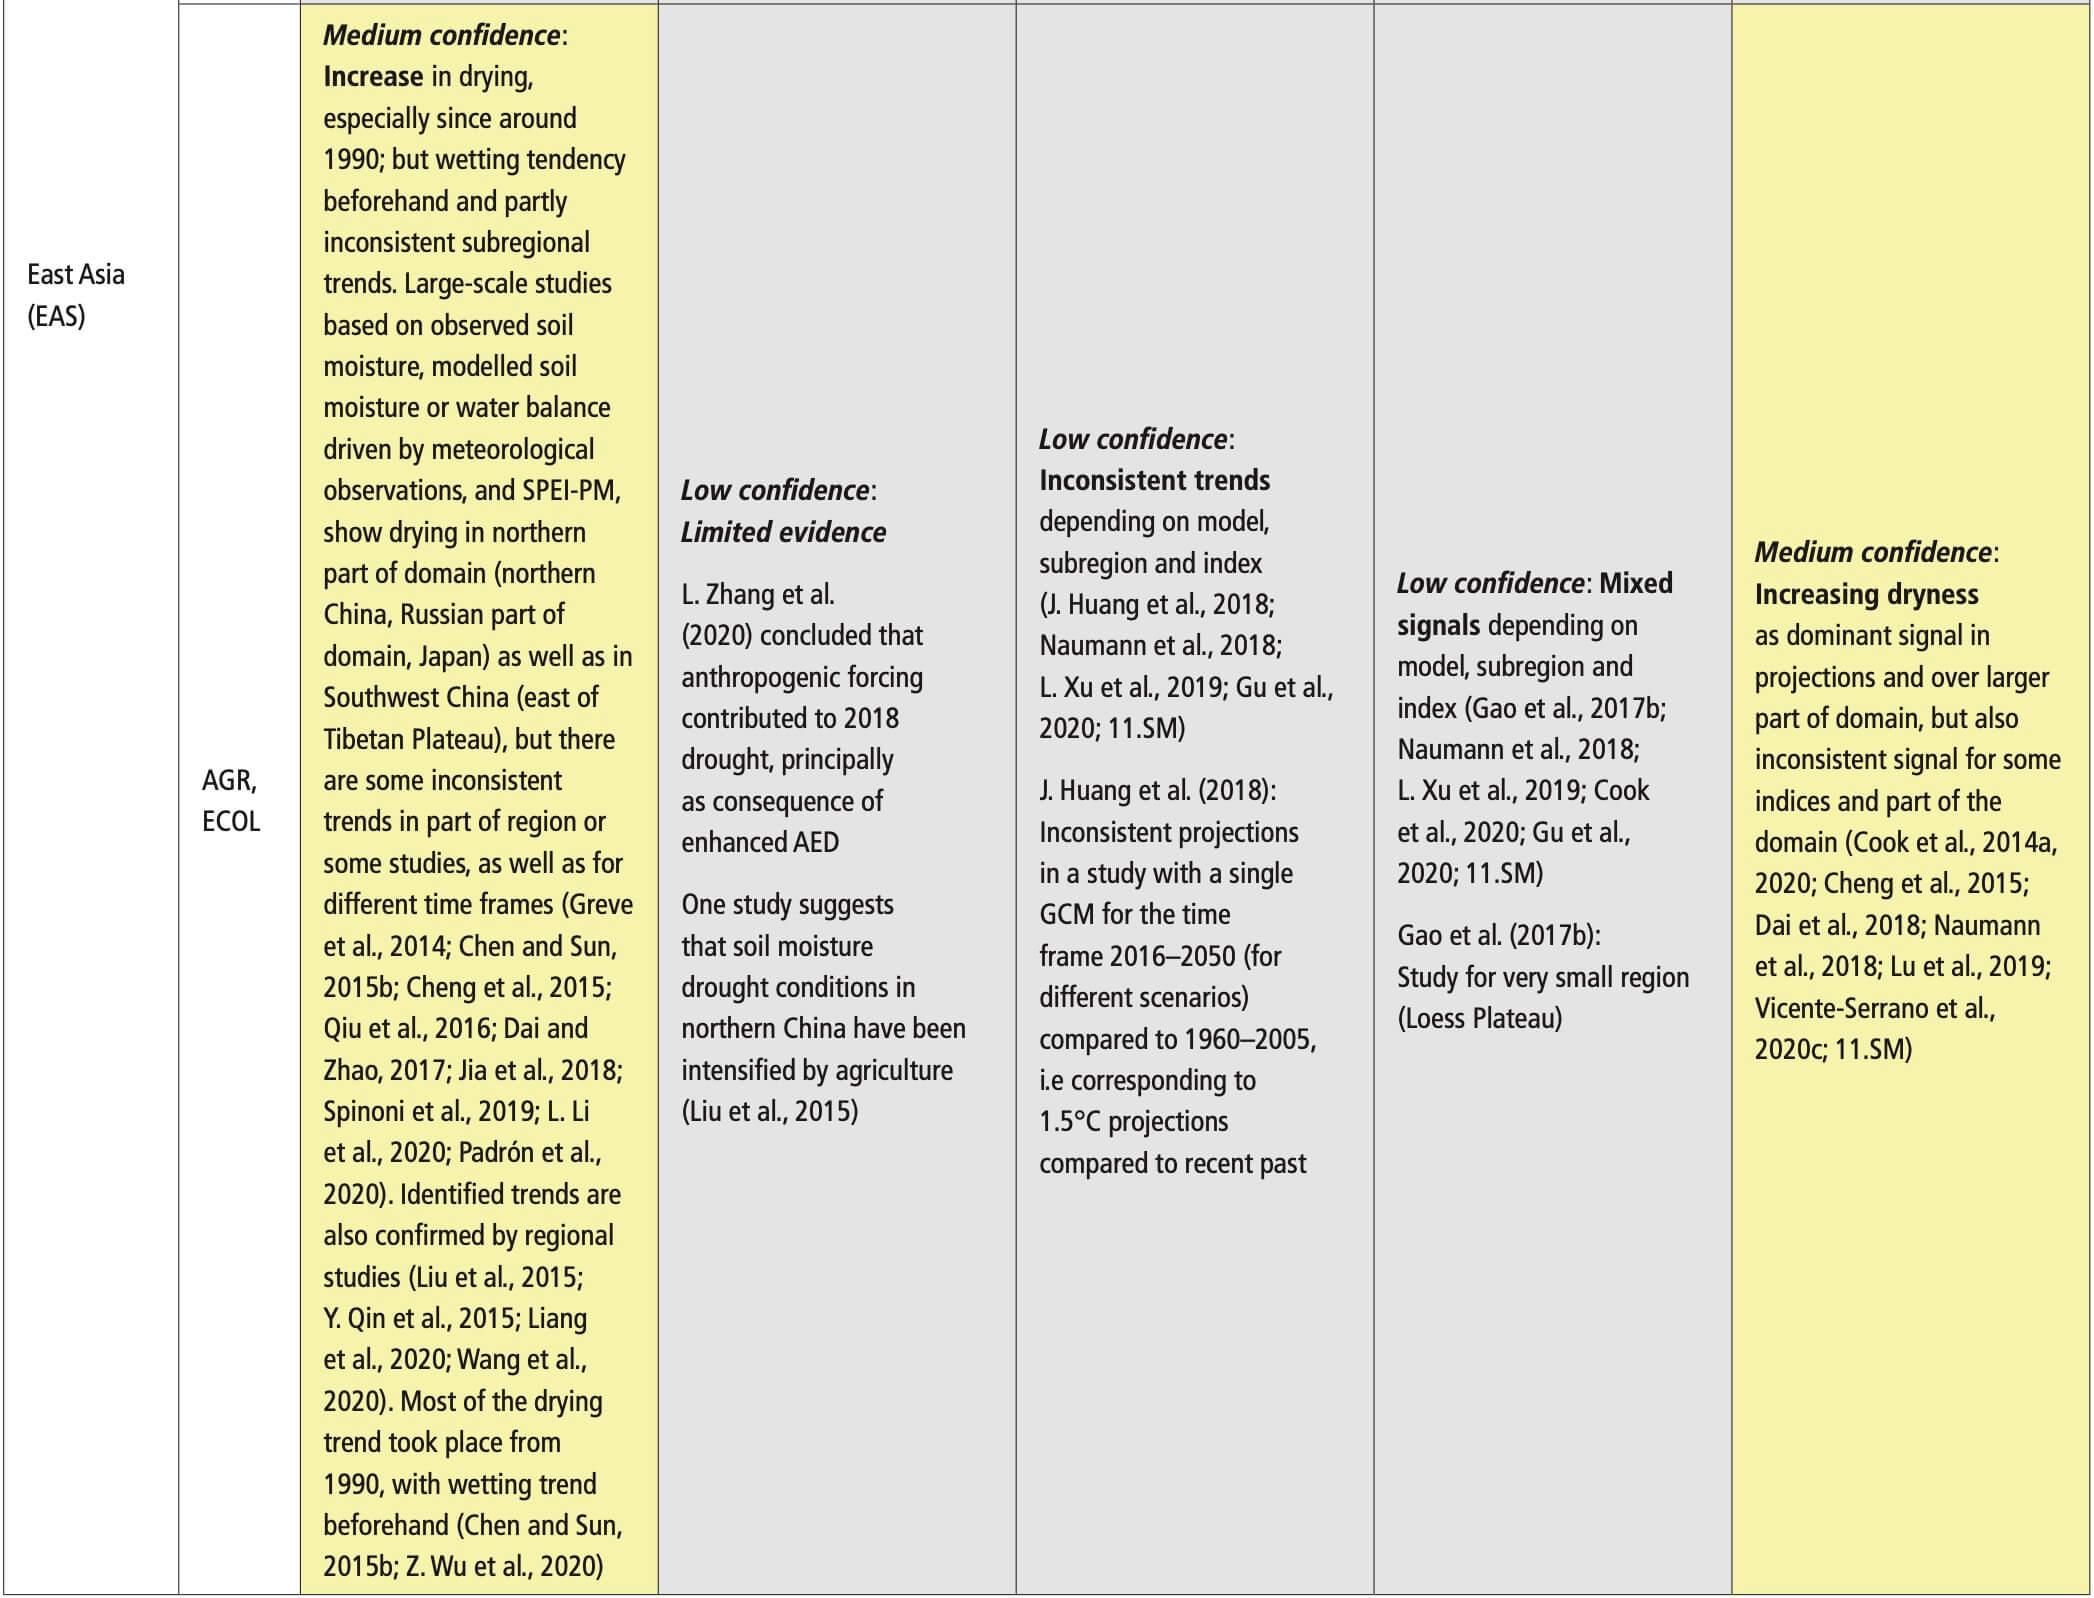
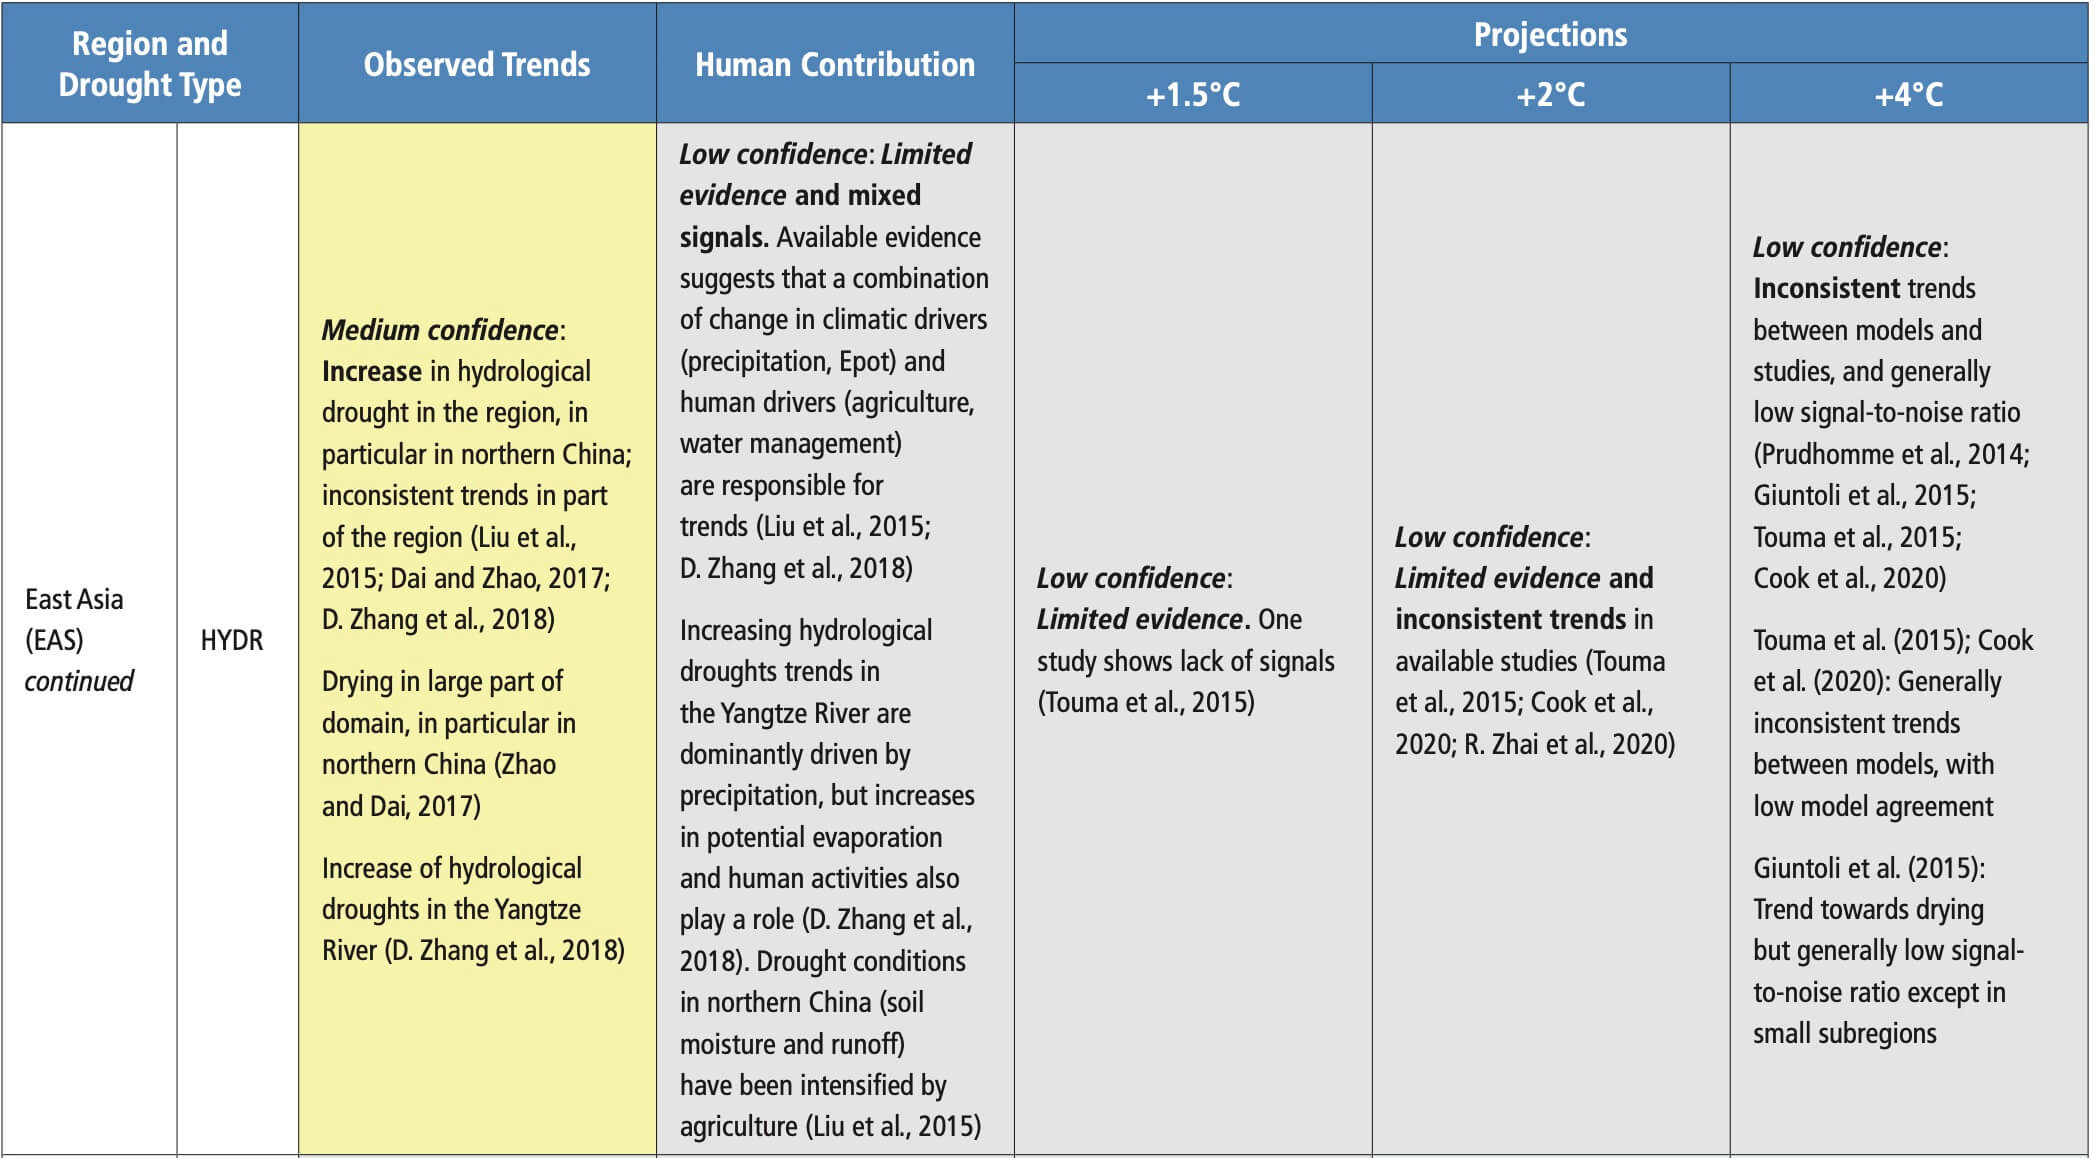
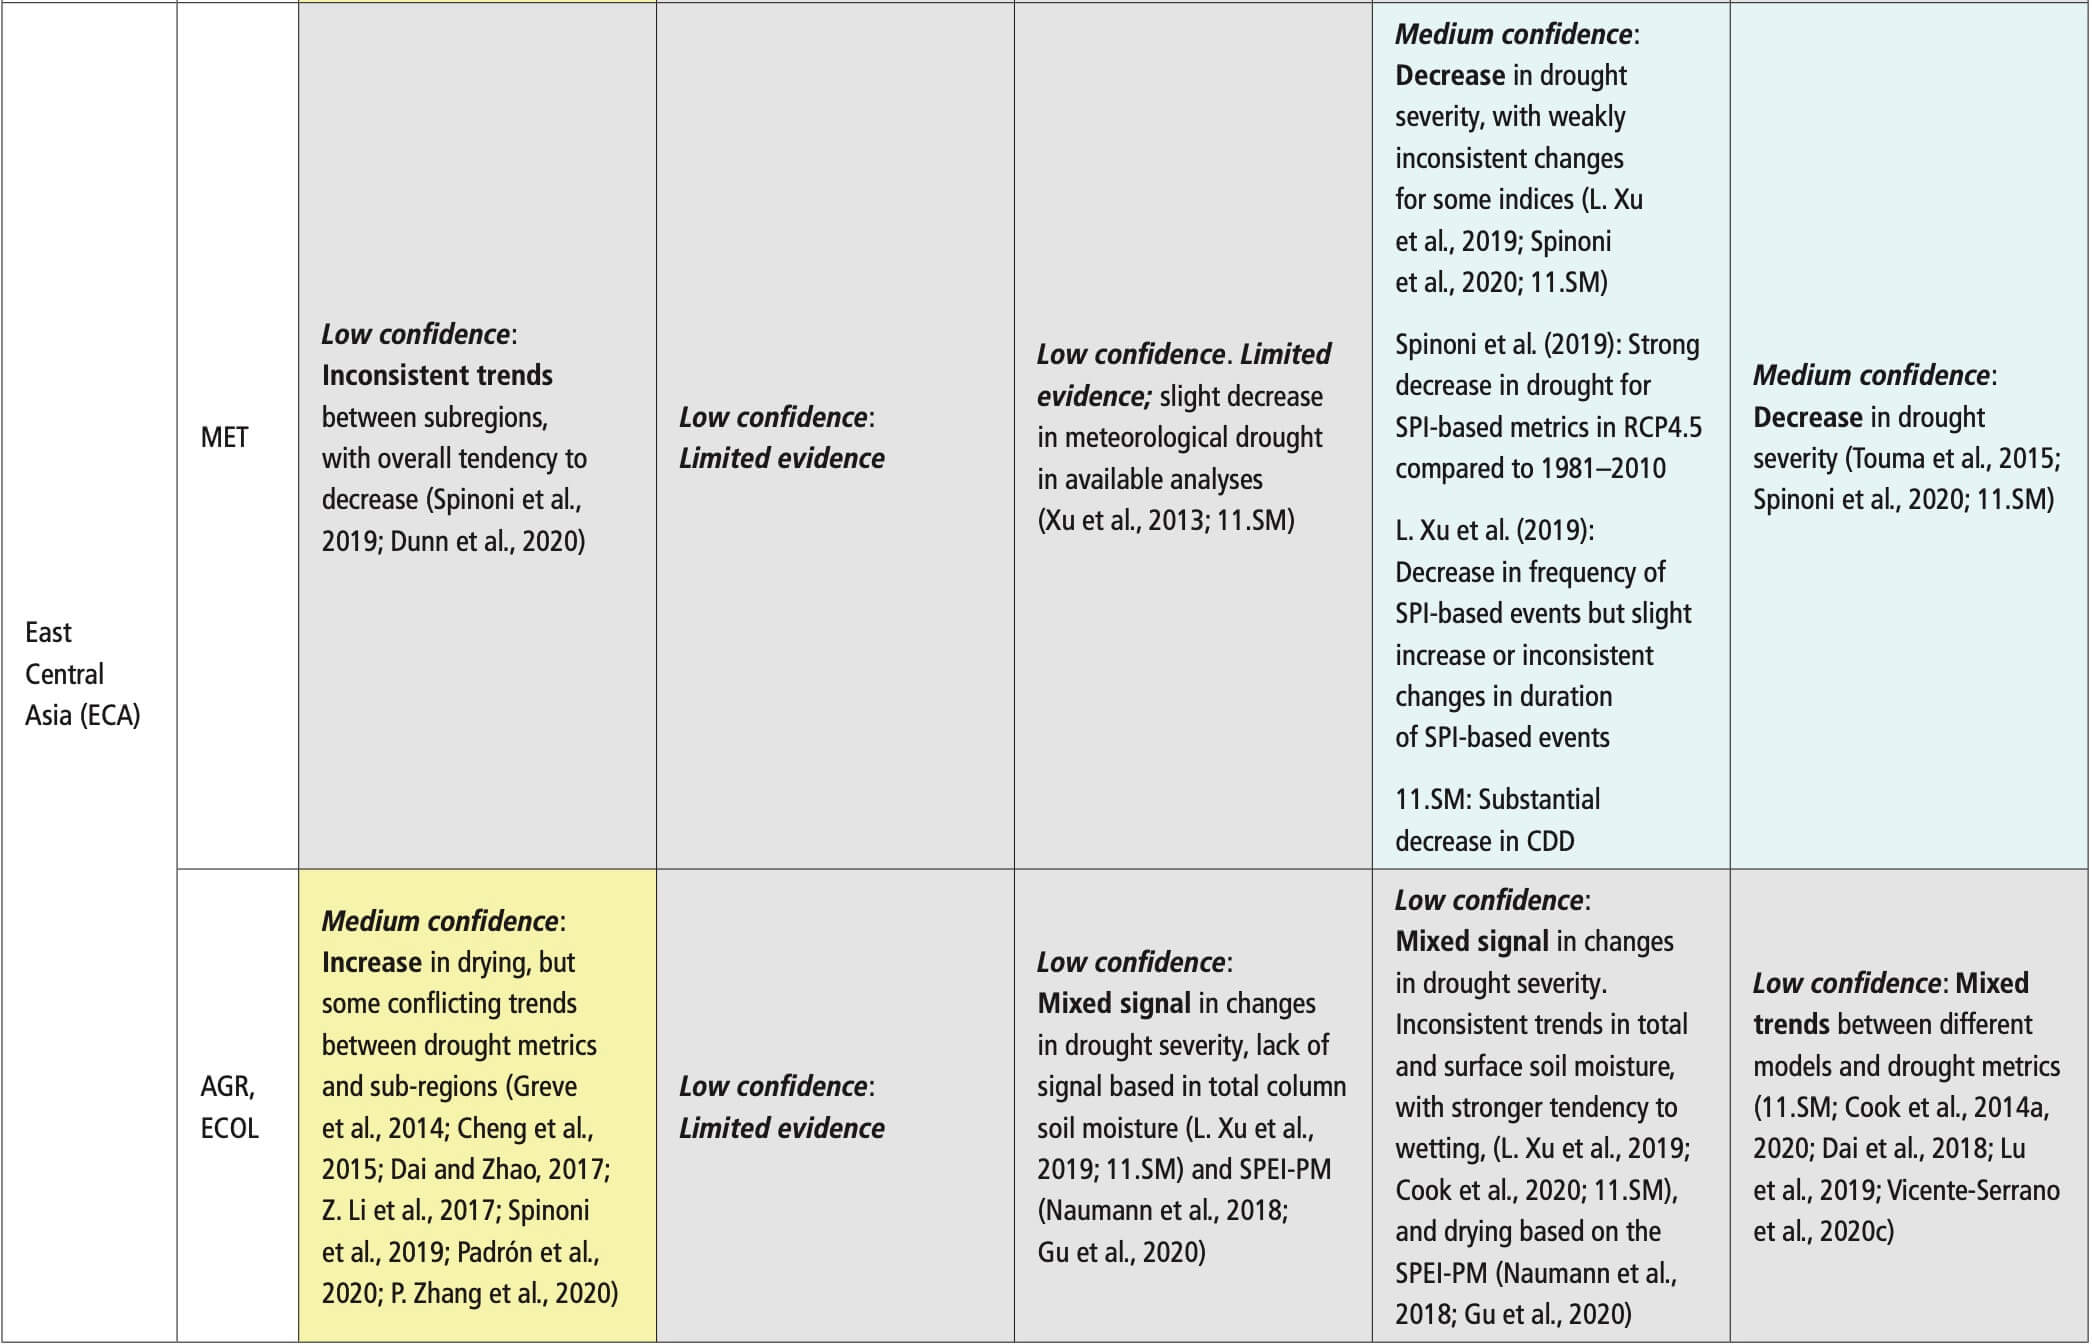
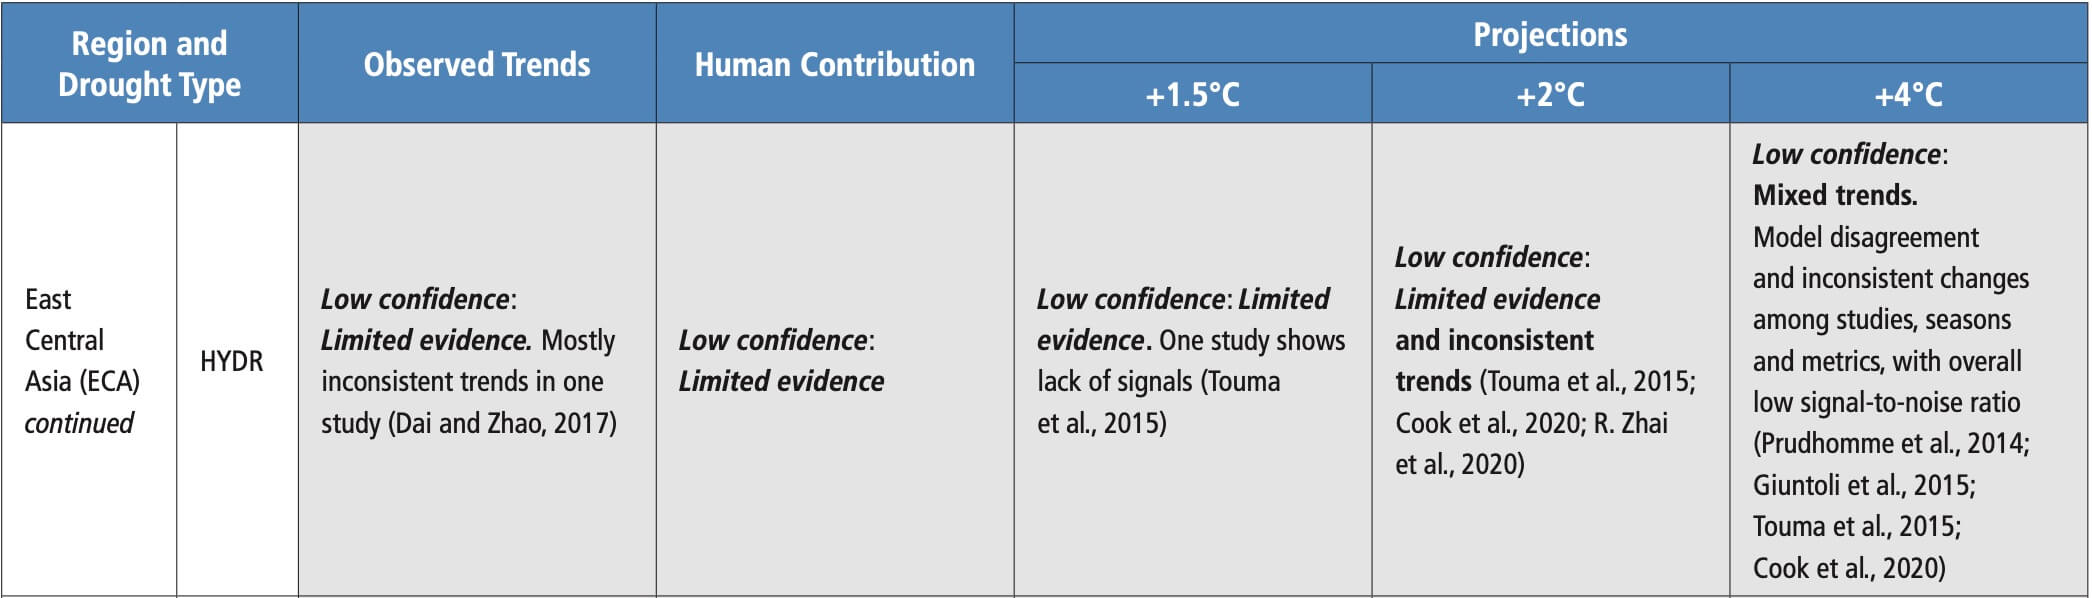
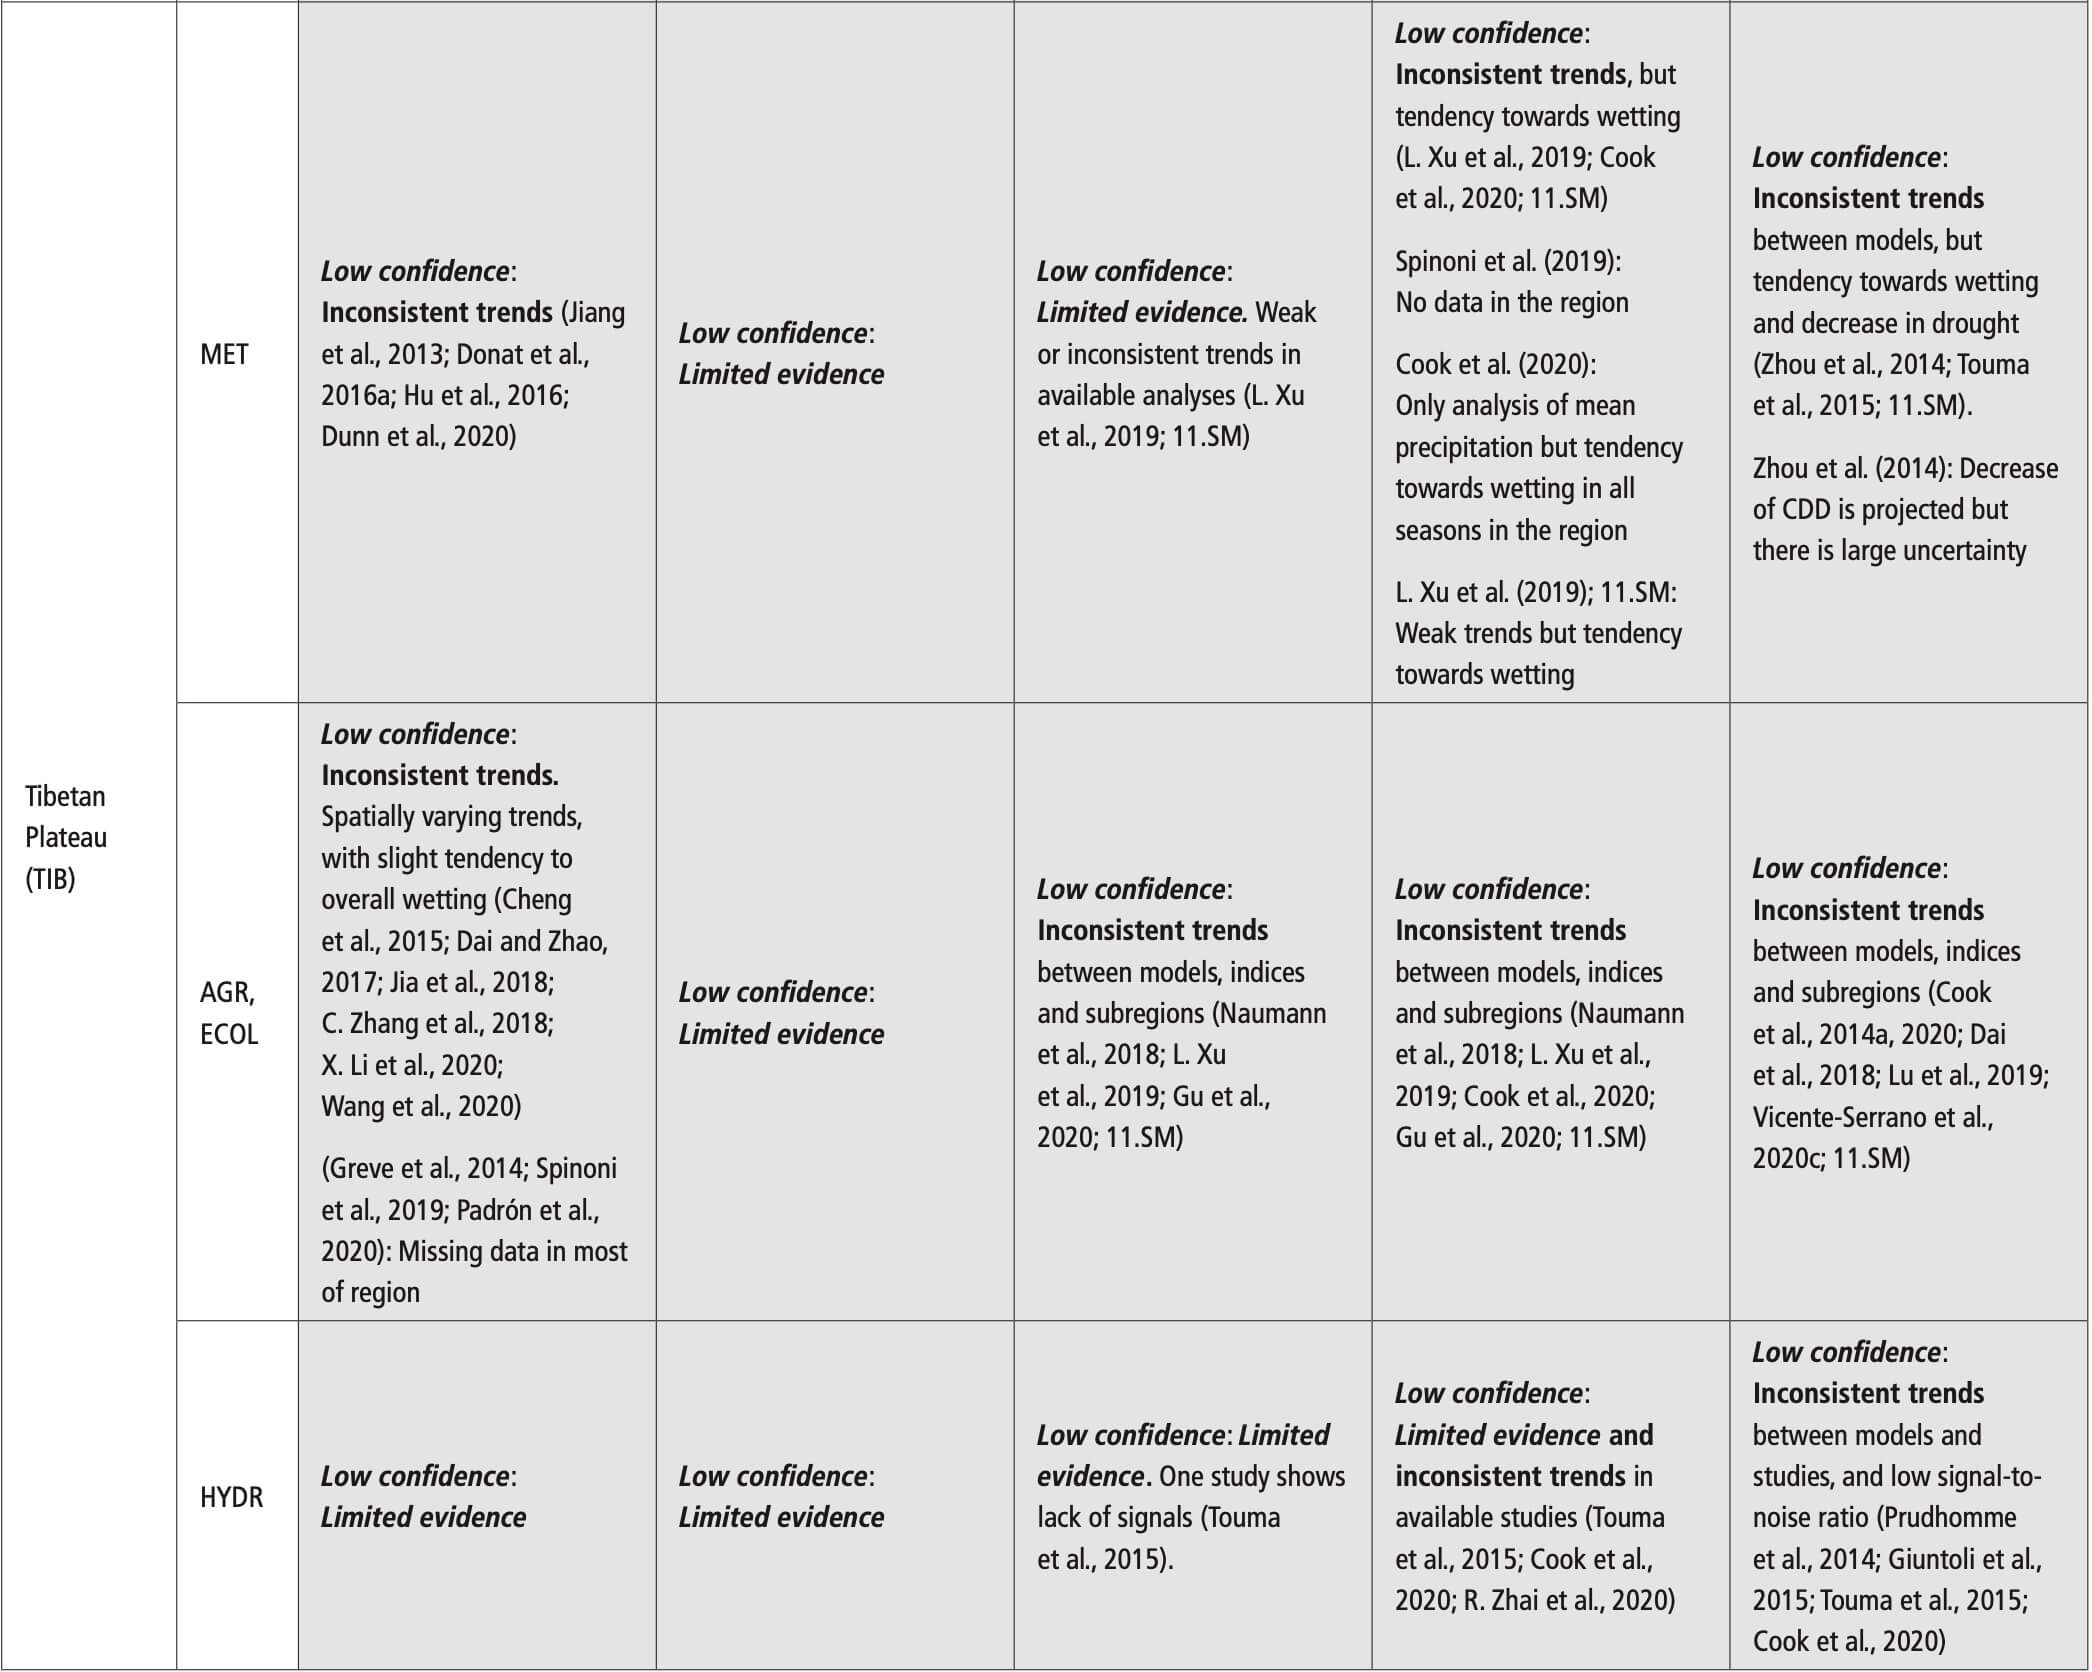
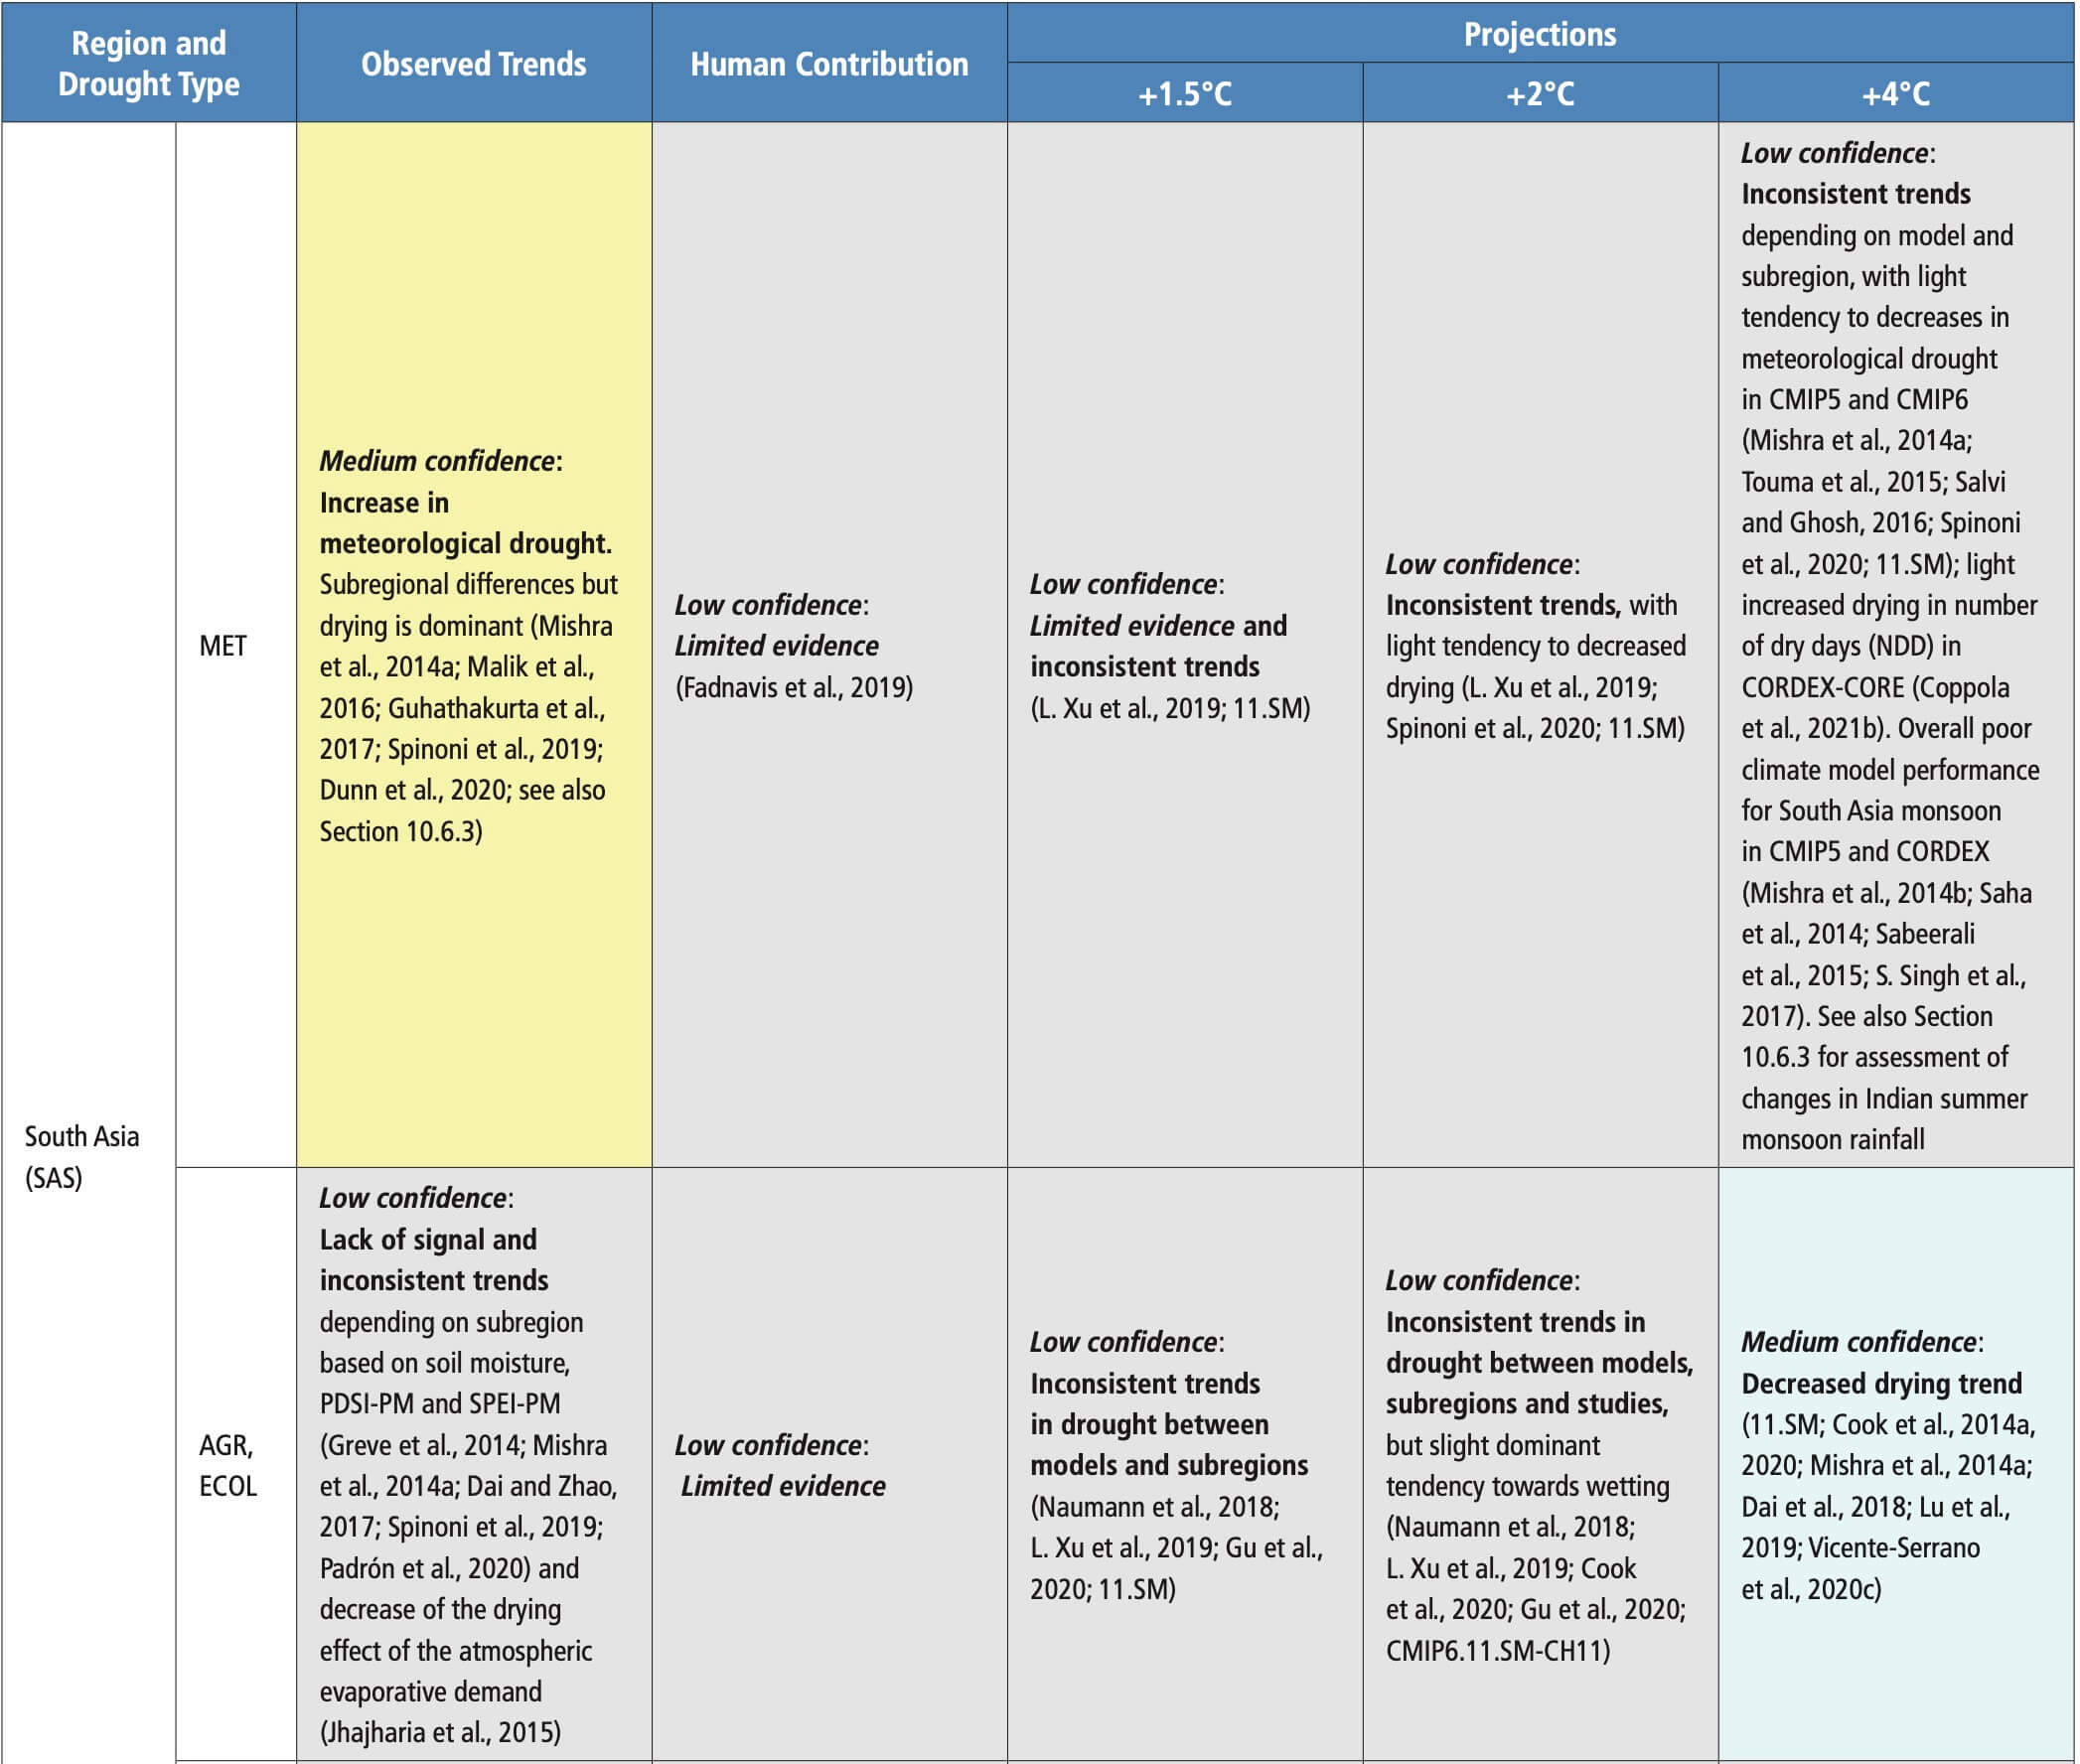
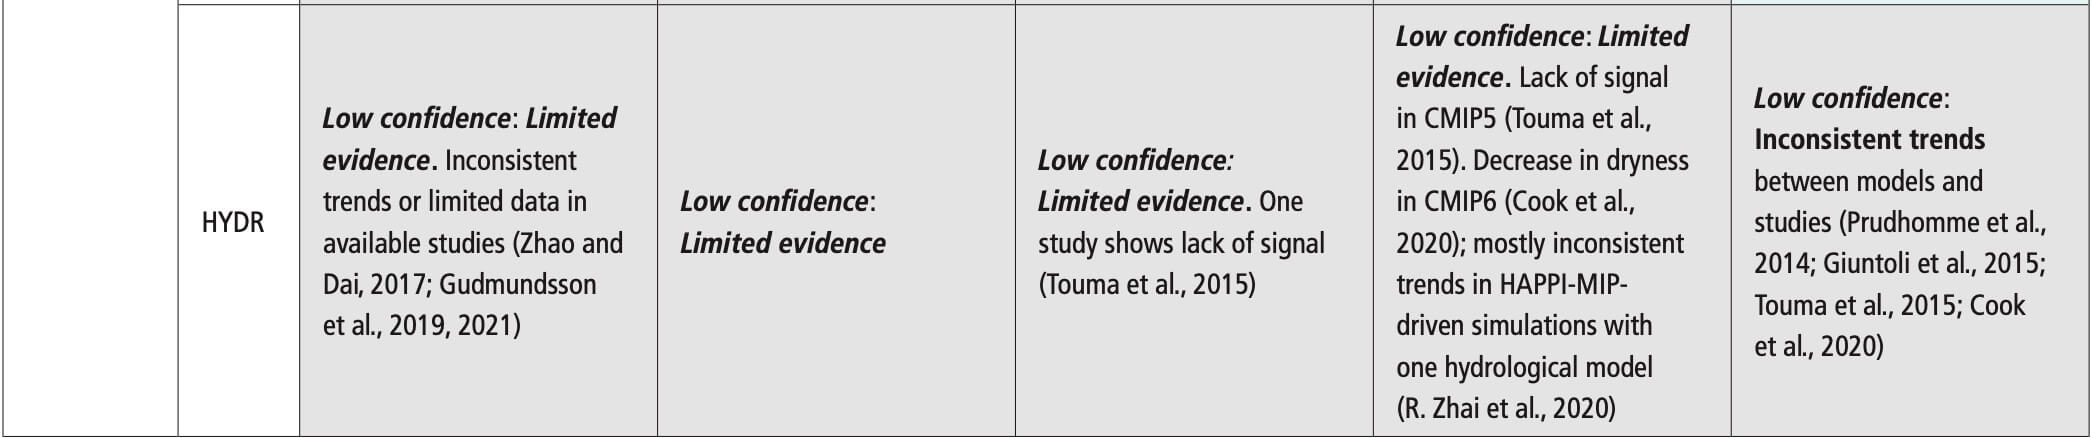
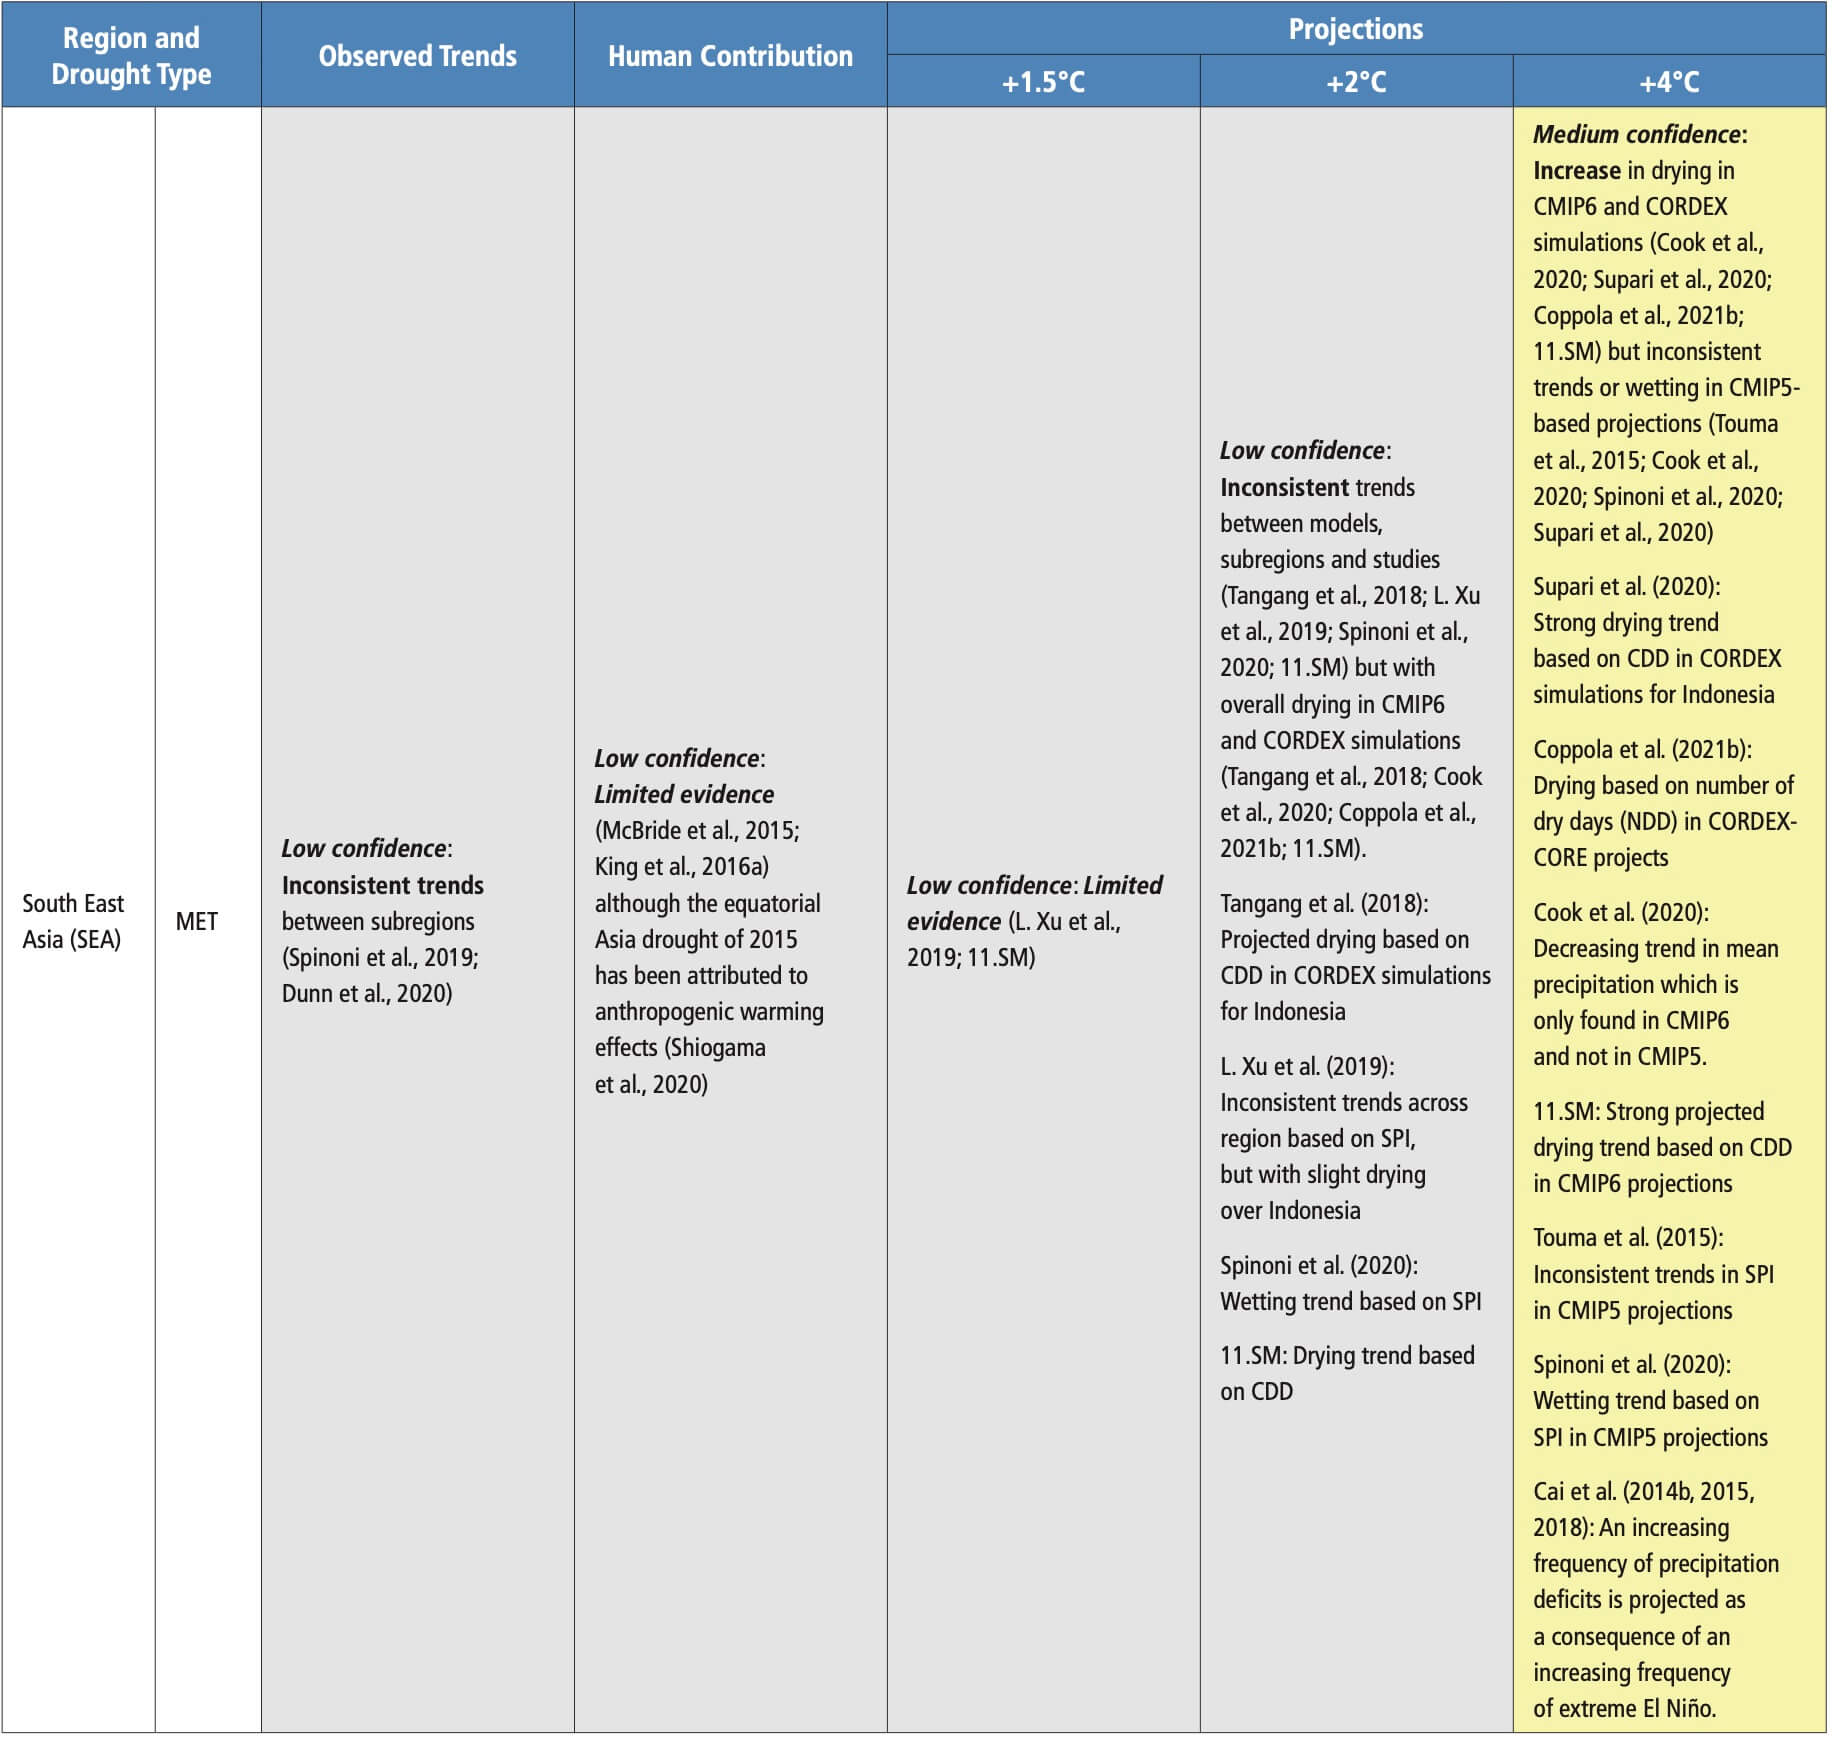
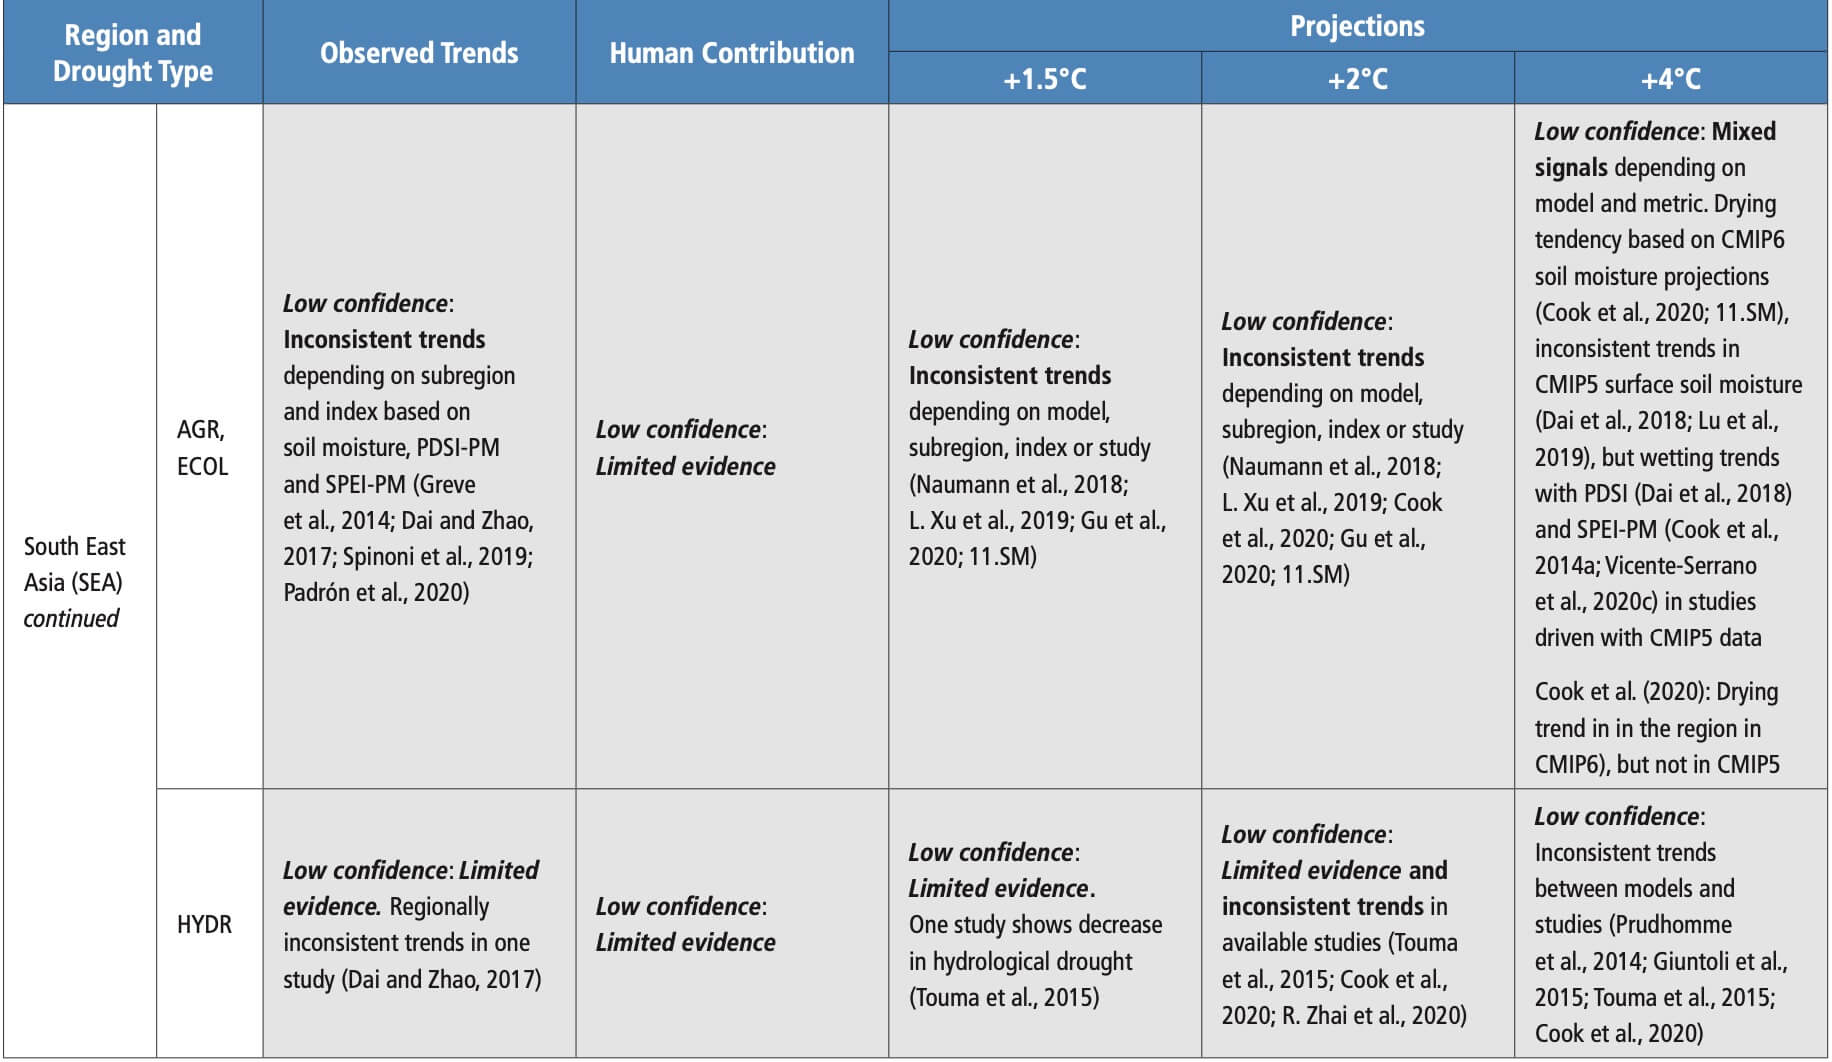 Table 11.10 | Observed trends, human contribution to observed trends, and projected changes at 1.5°C, 2°C and 4°C of global warming for temperature extremes in Australasia, subdivided by AR6 regions. See Sections 11.9.1 and 11.9.2 for details.
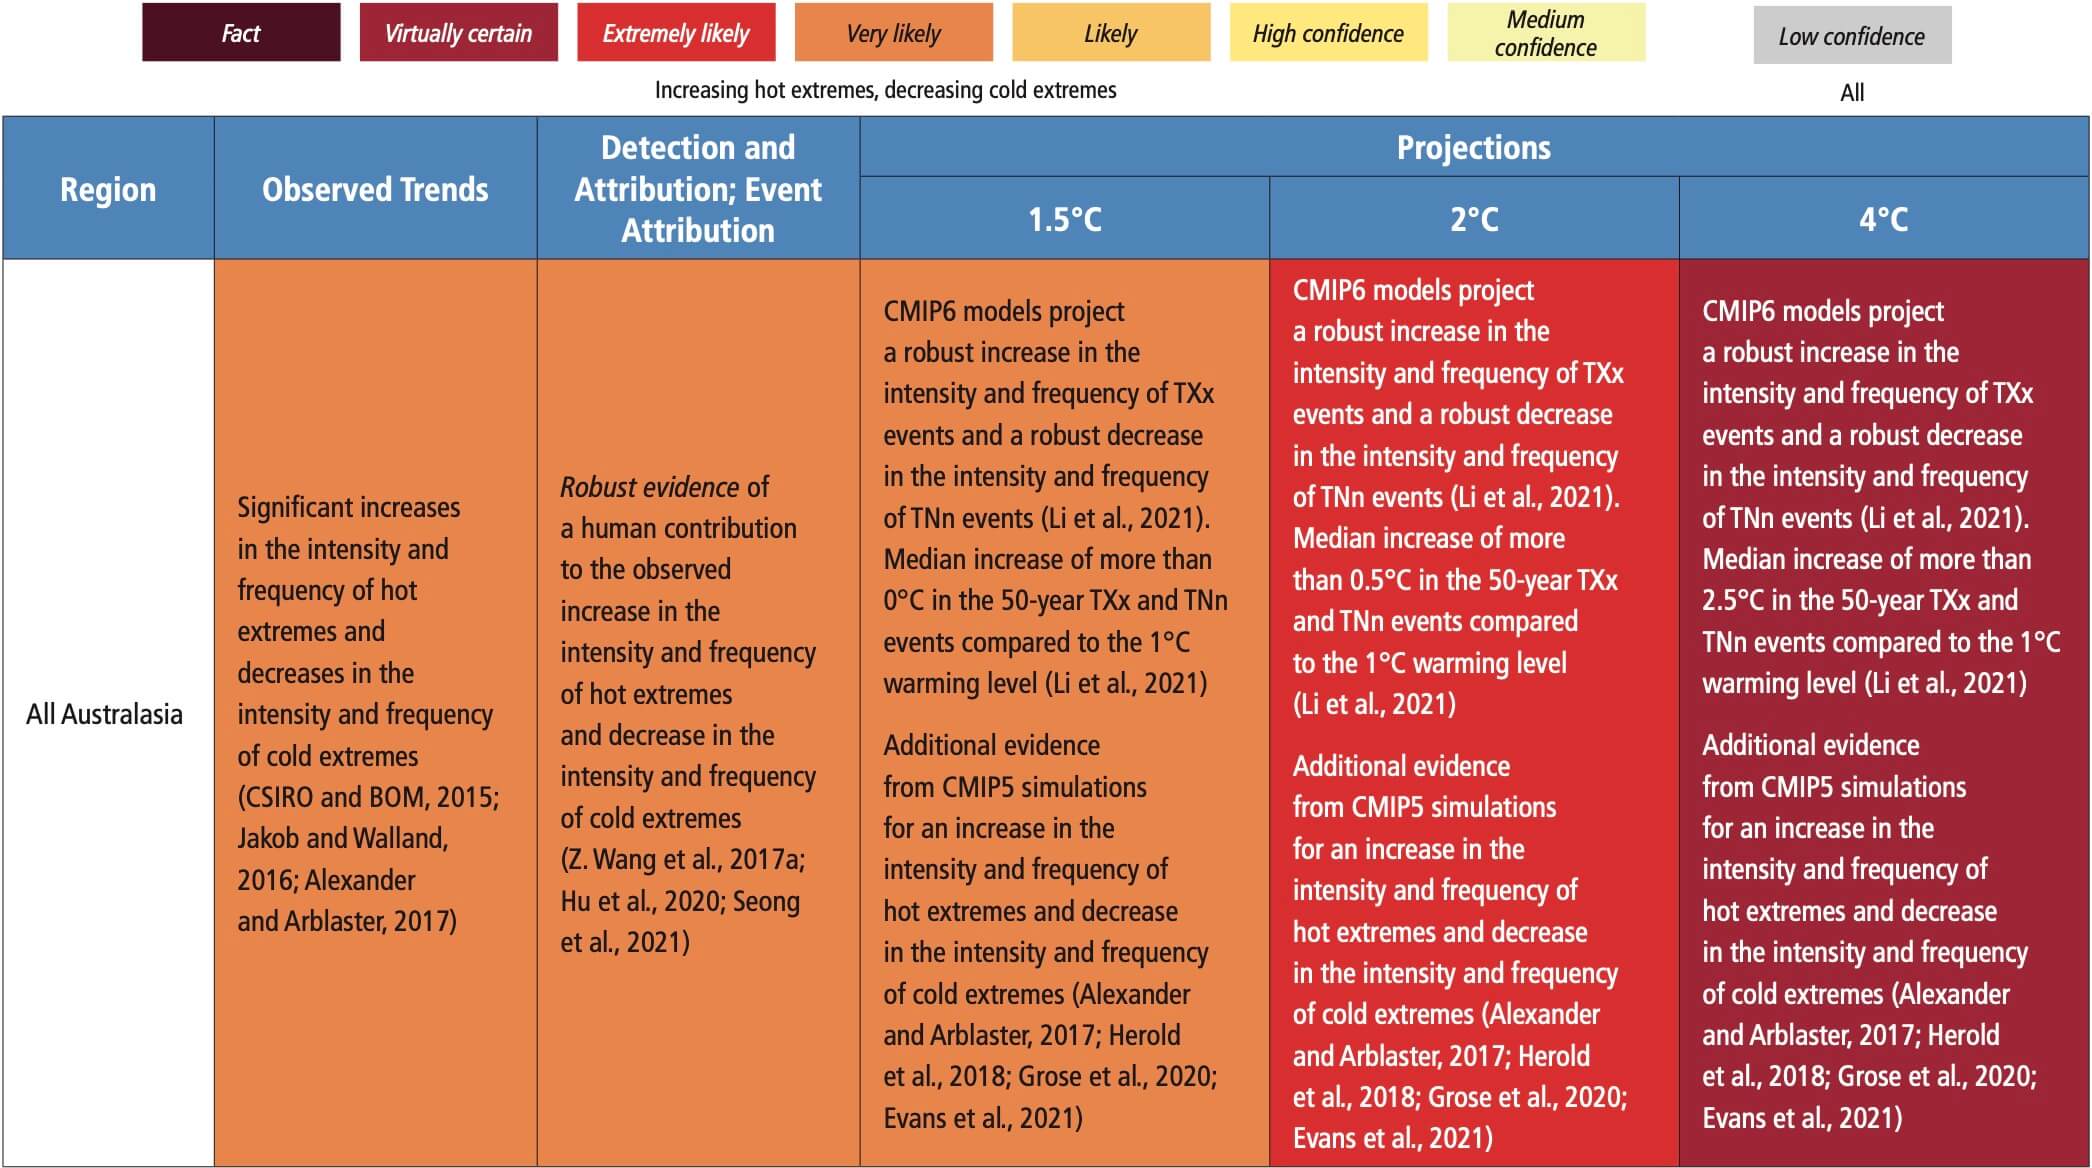
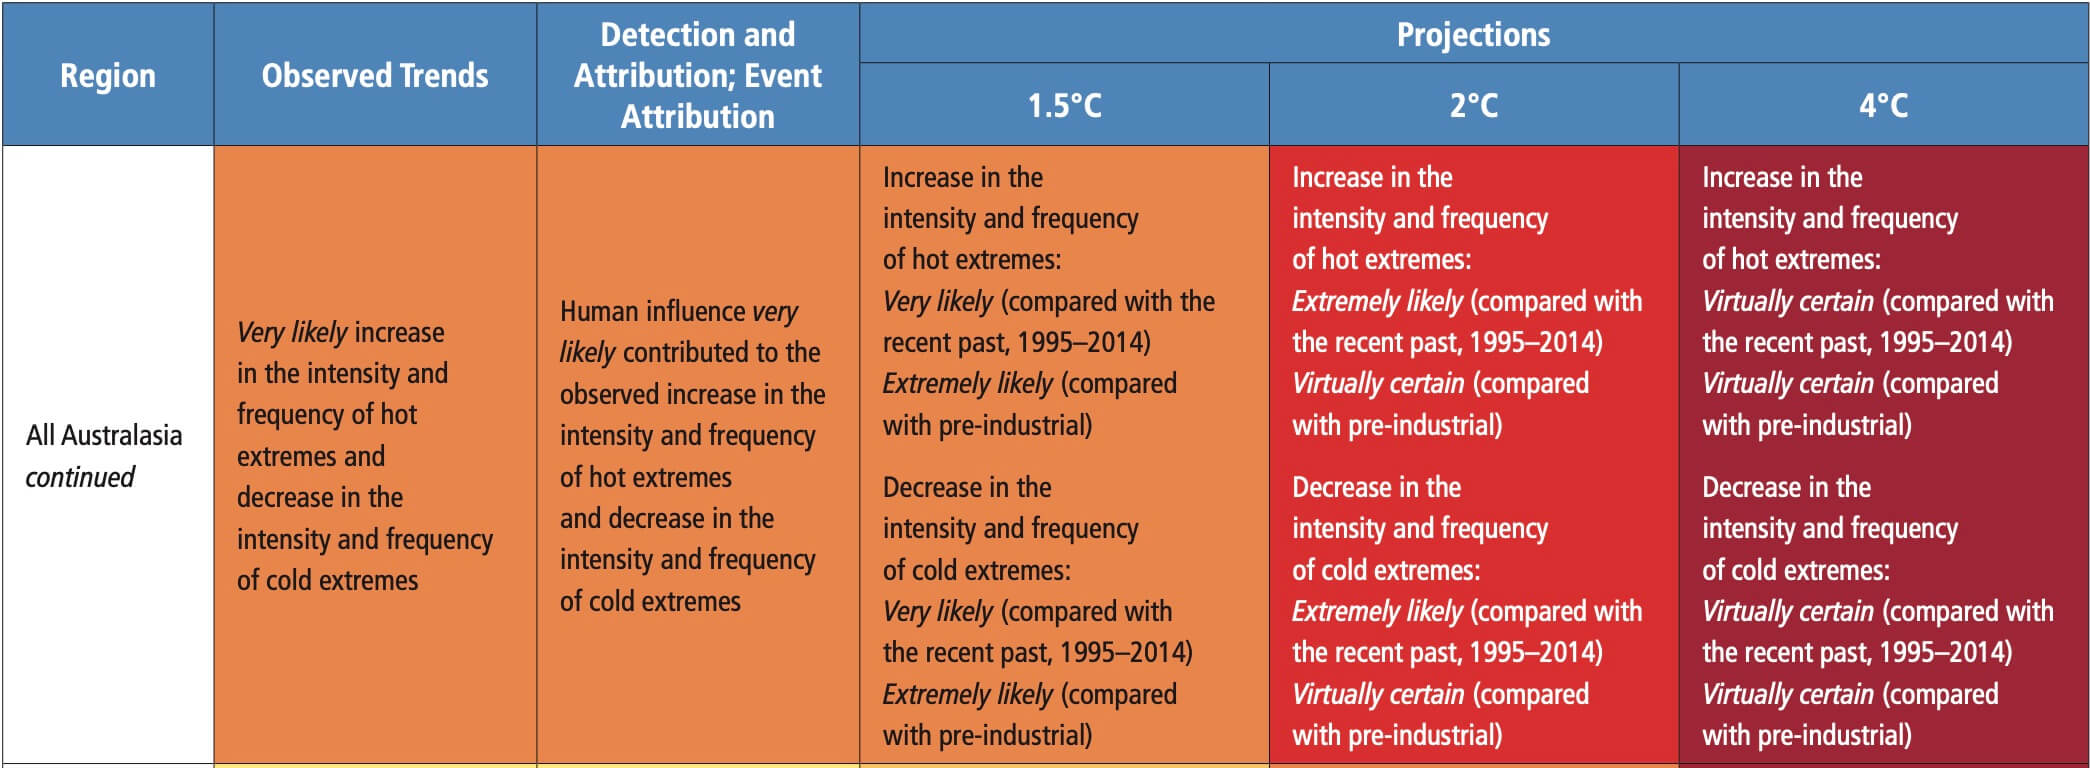
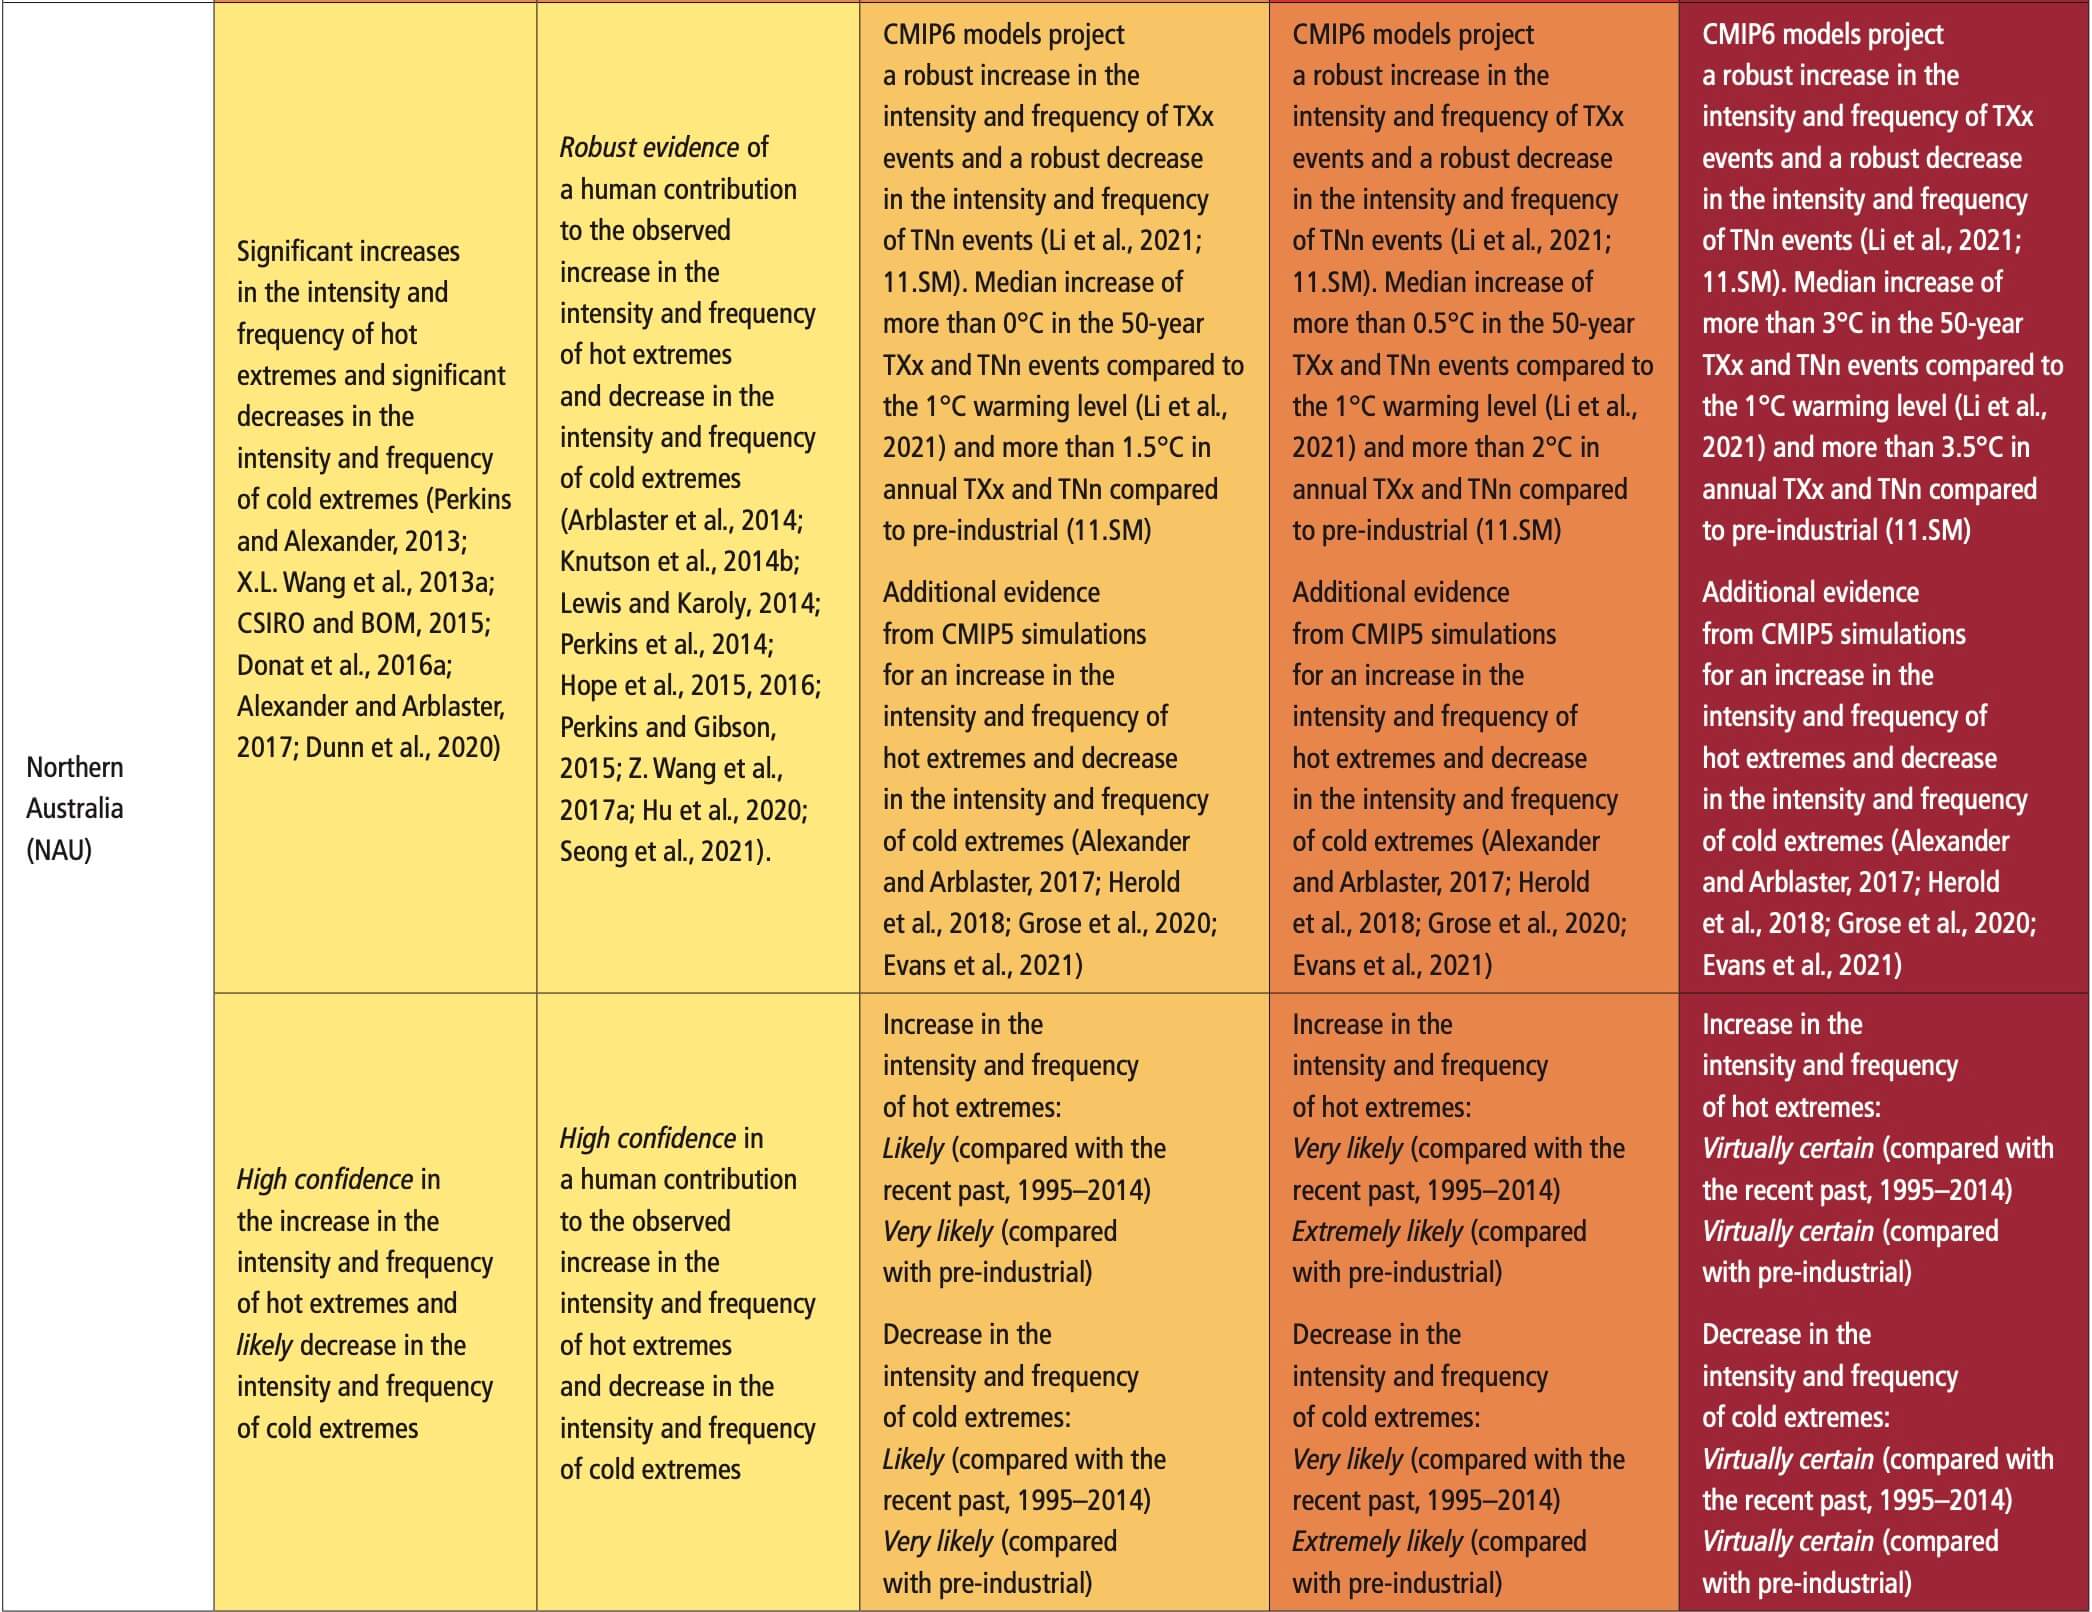
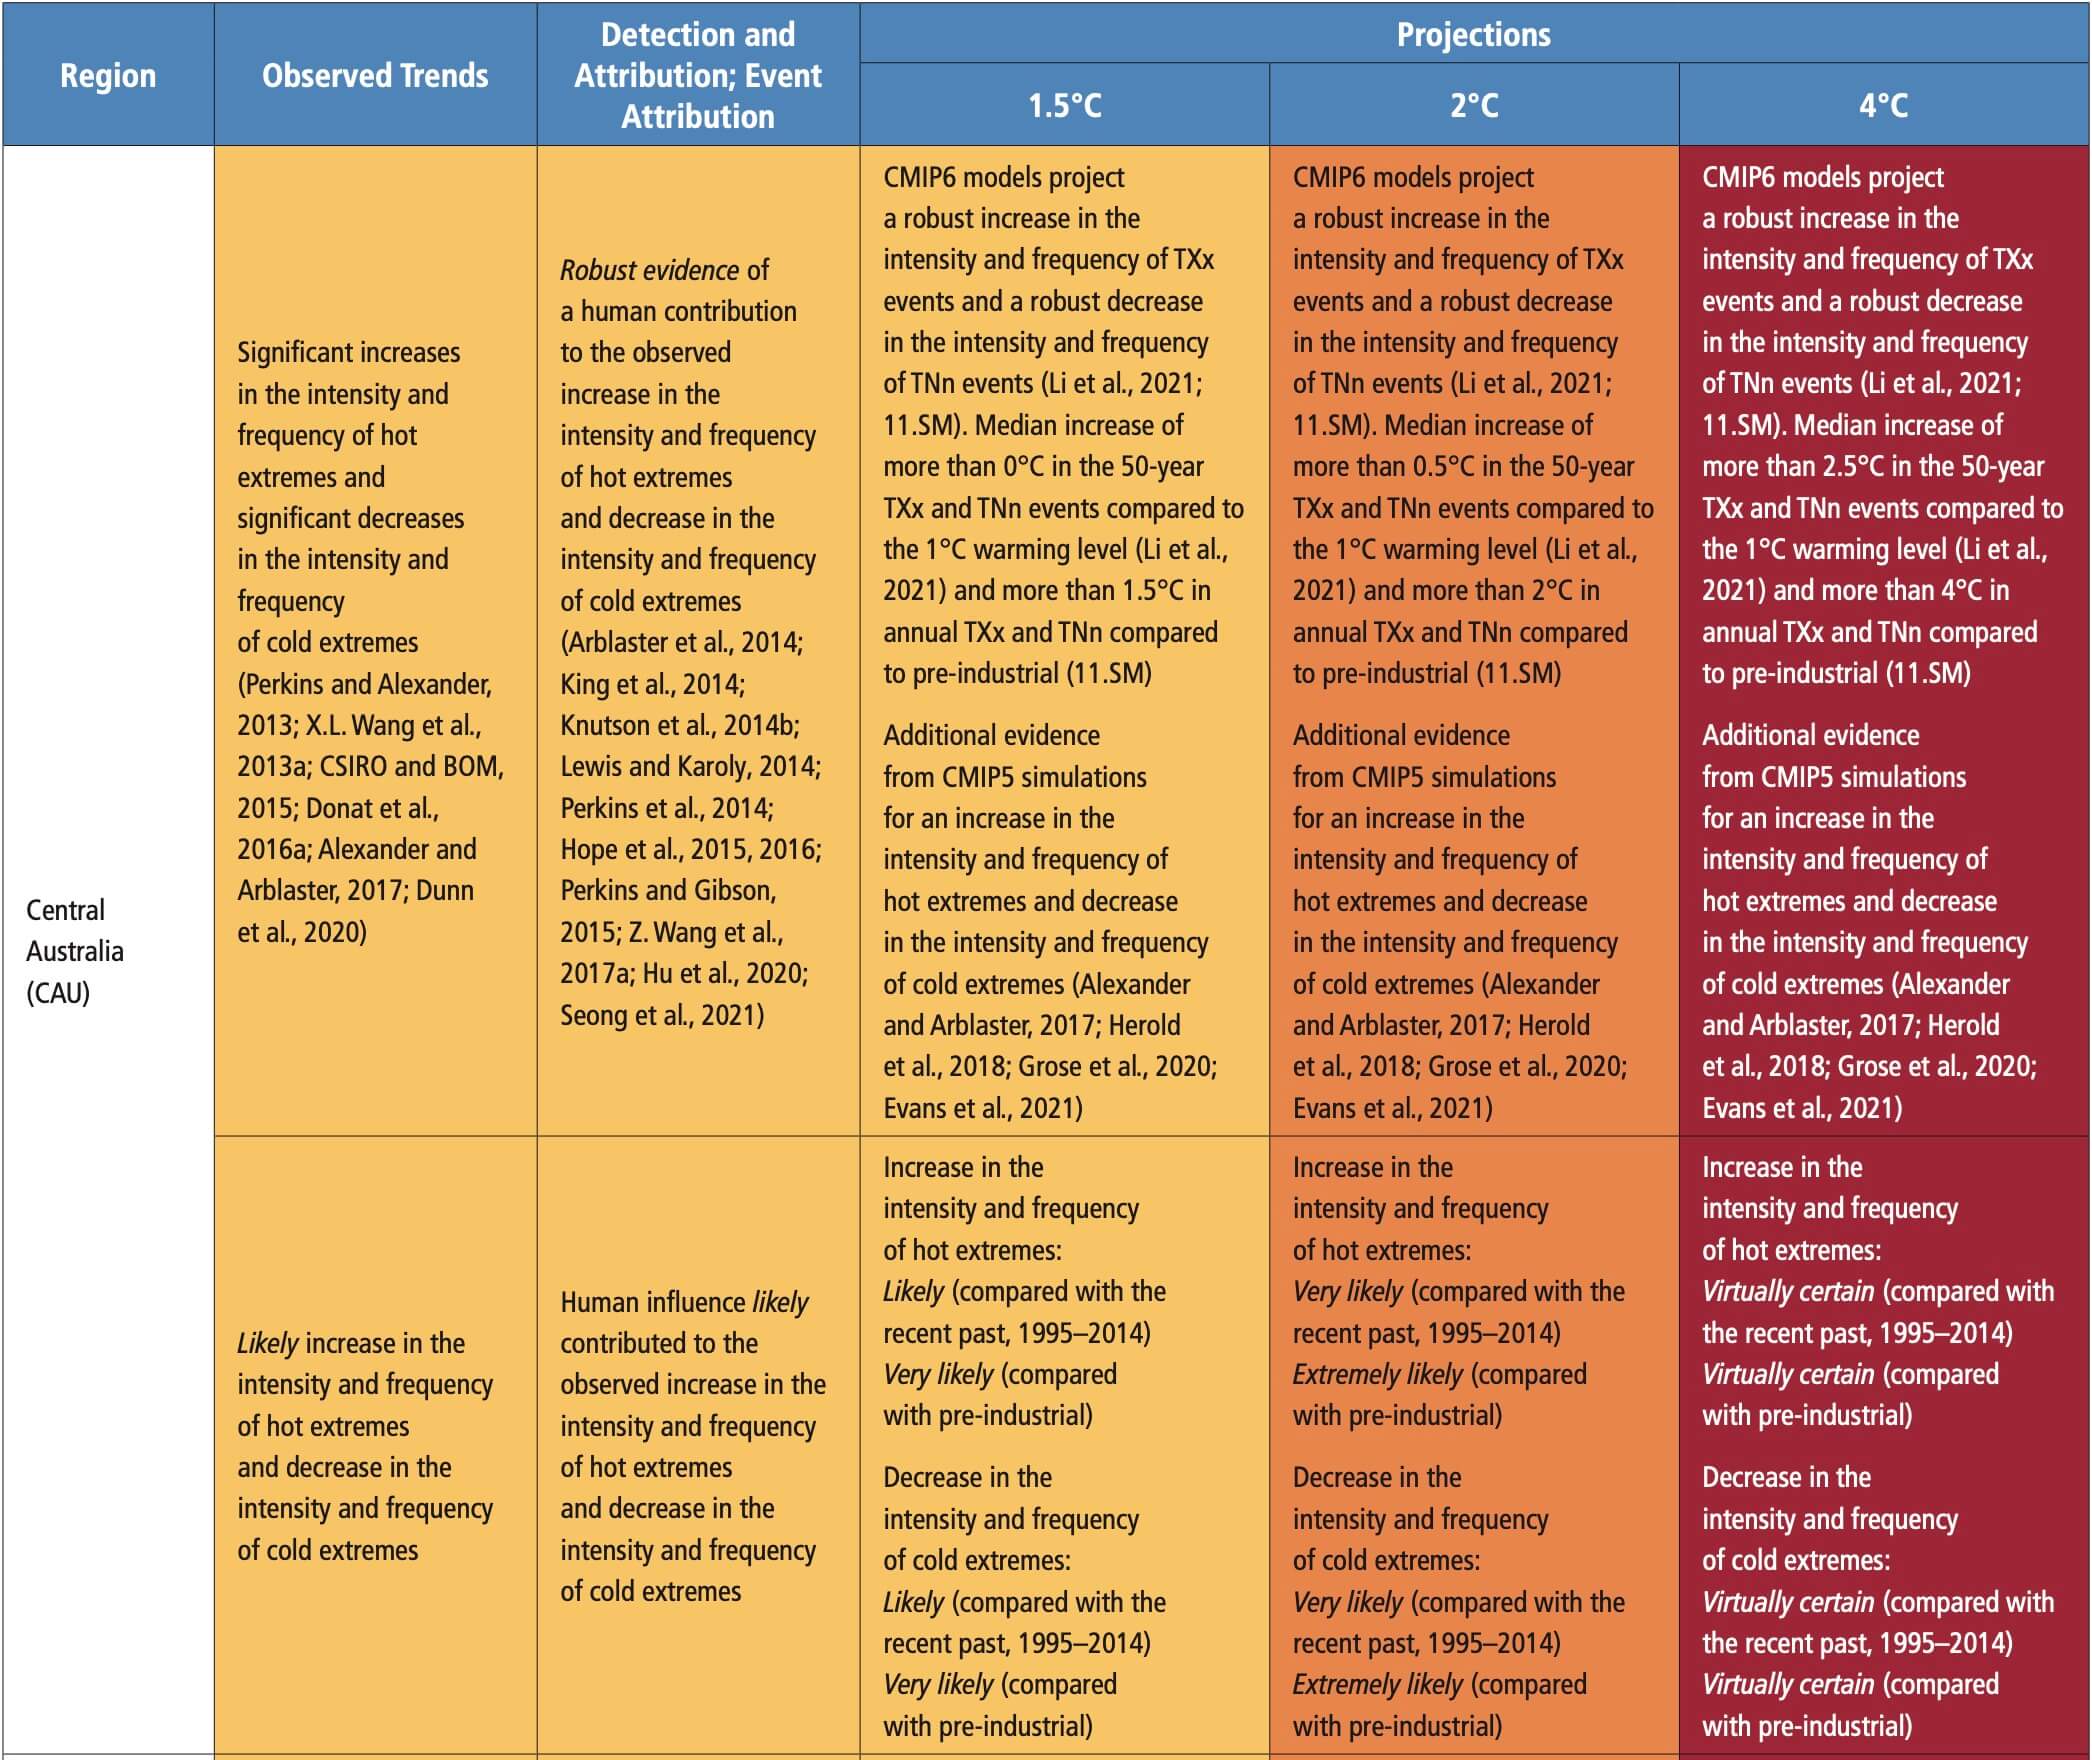
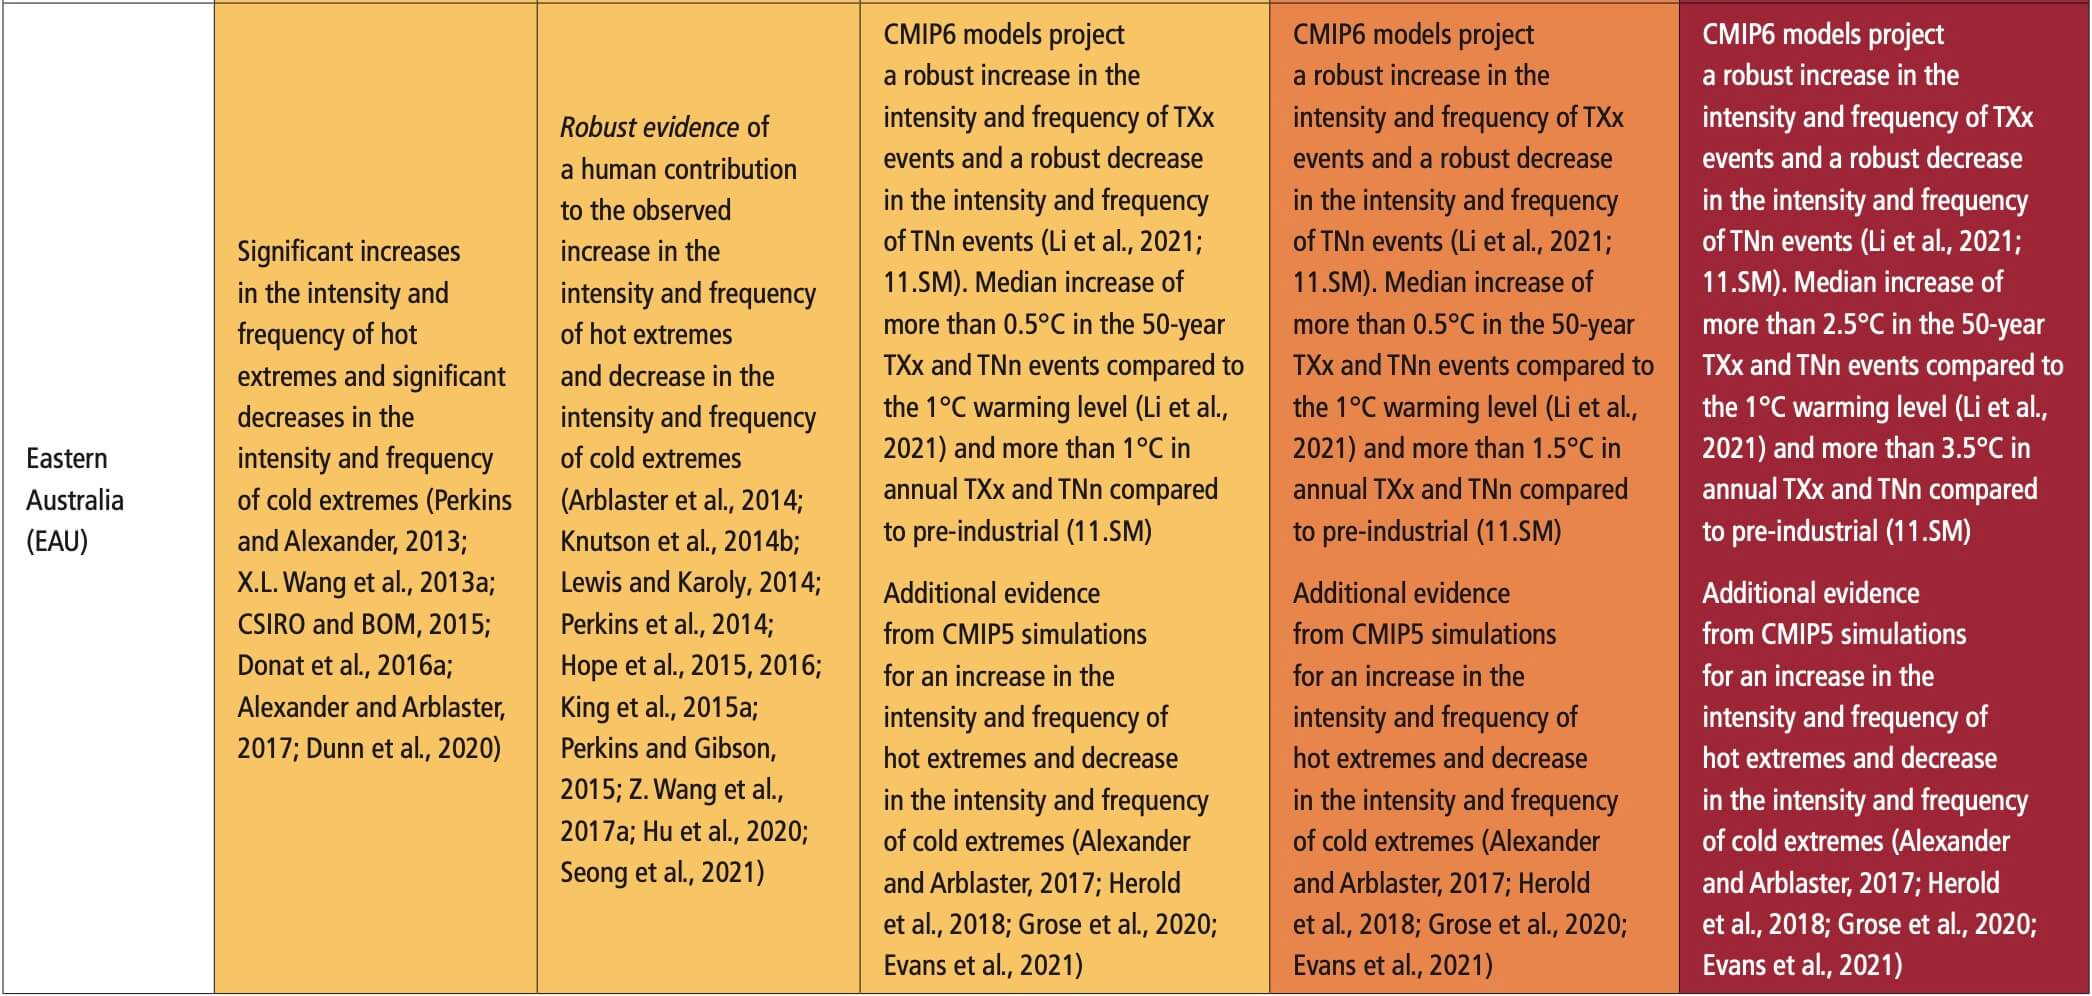
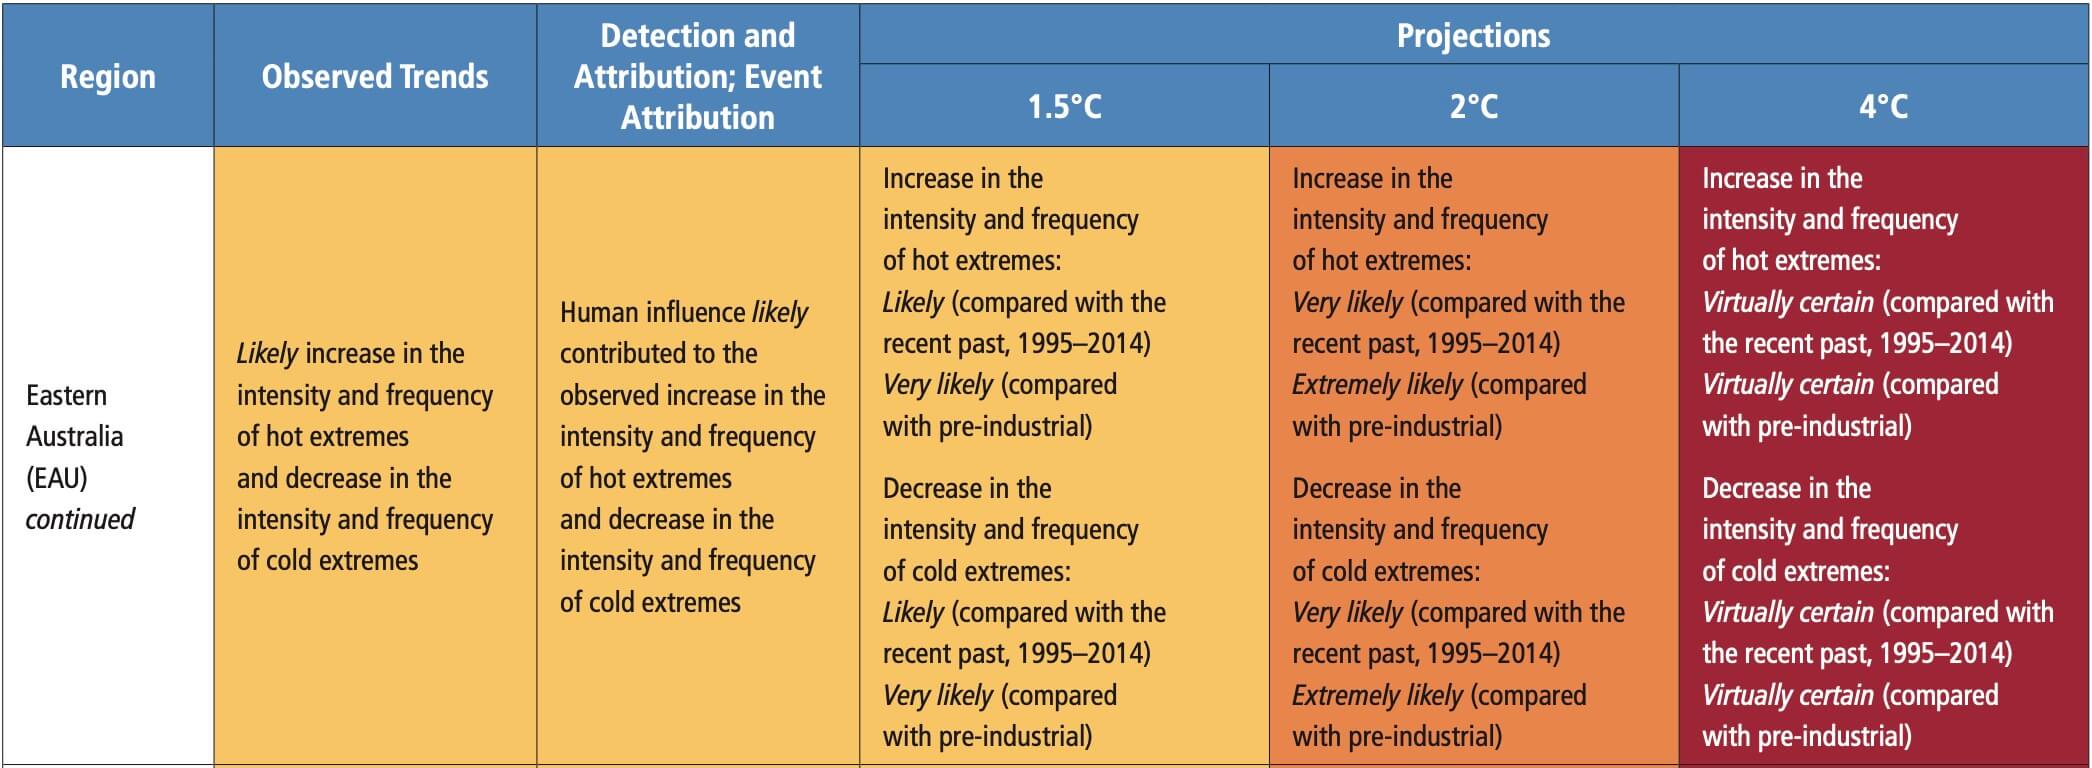
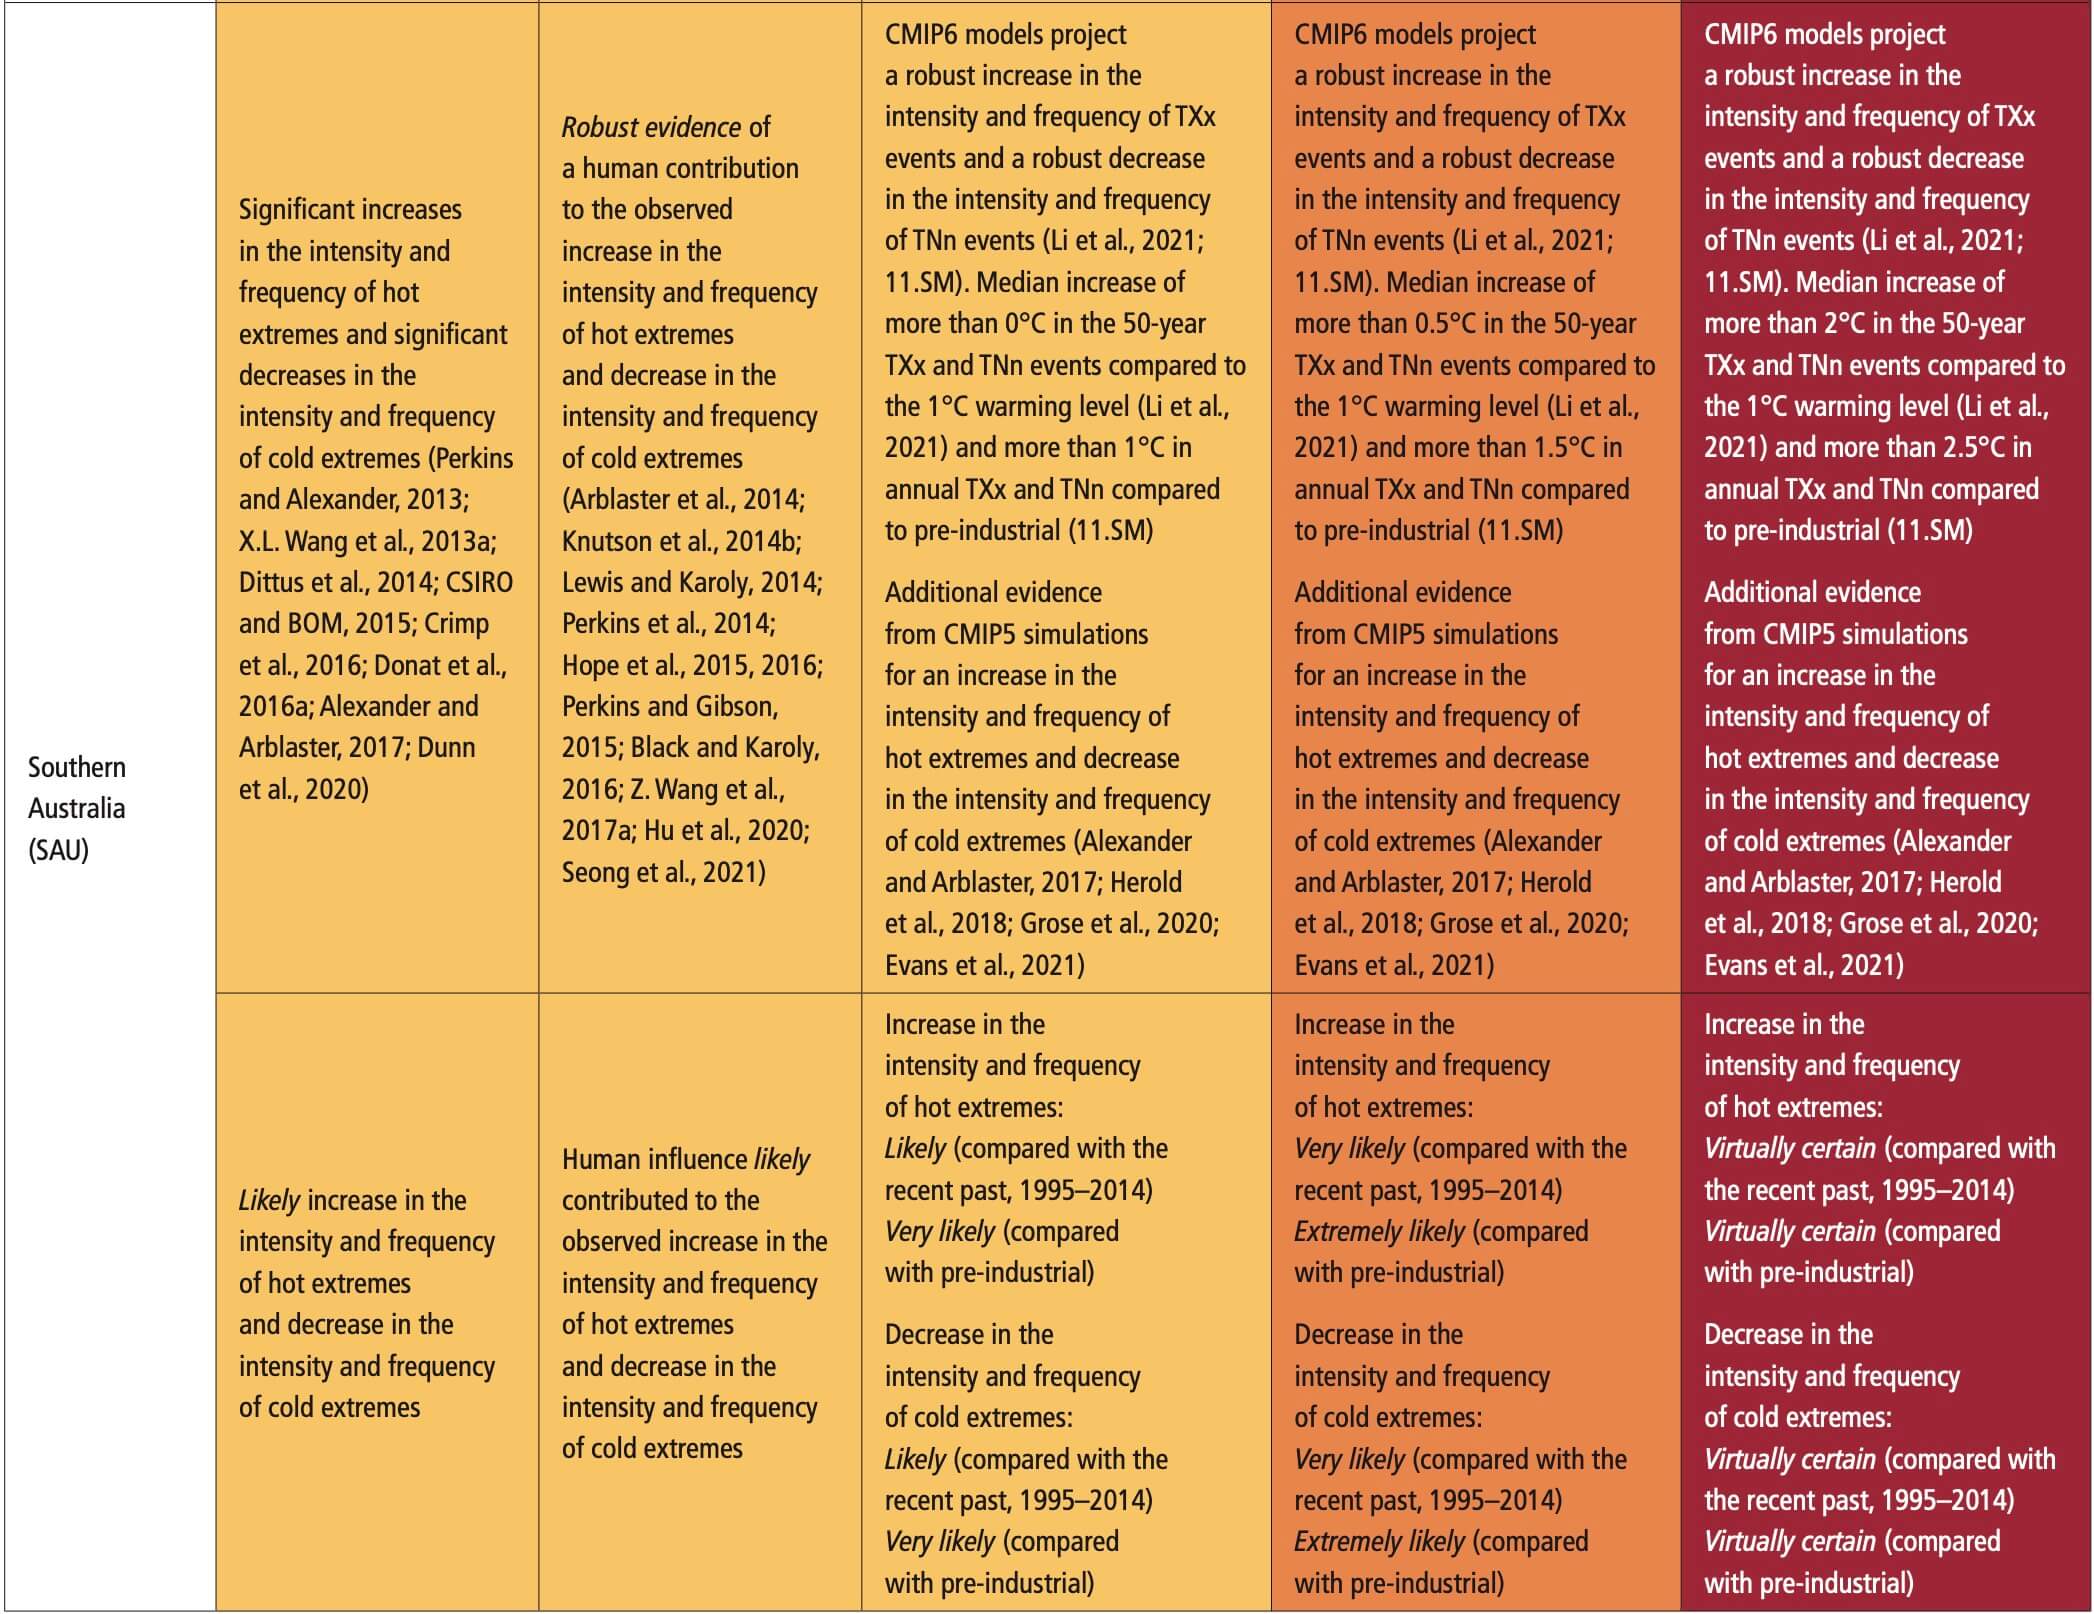
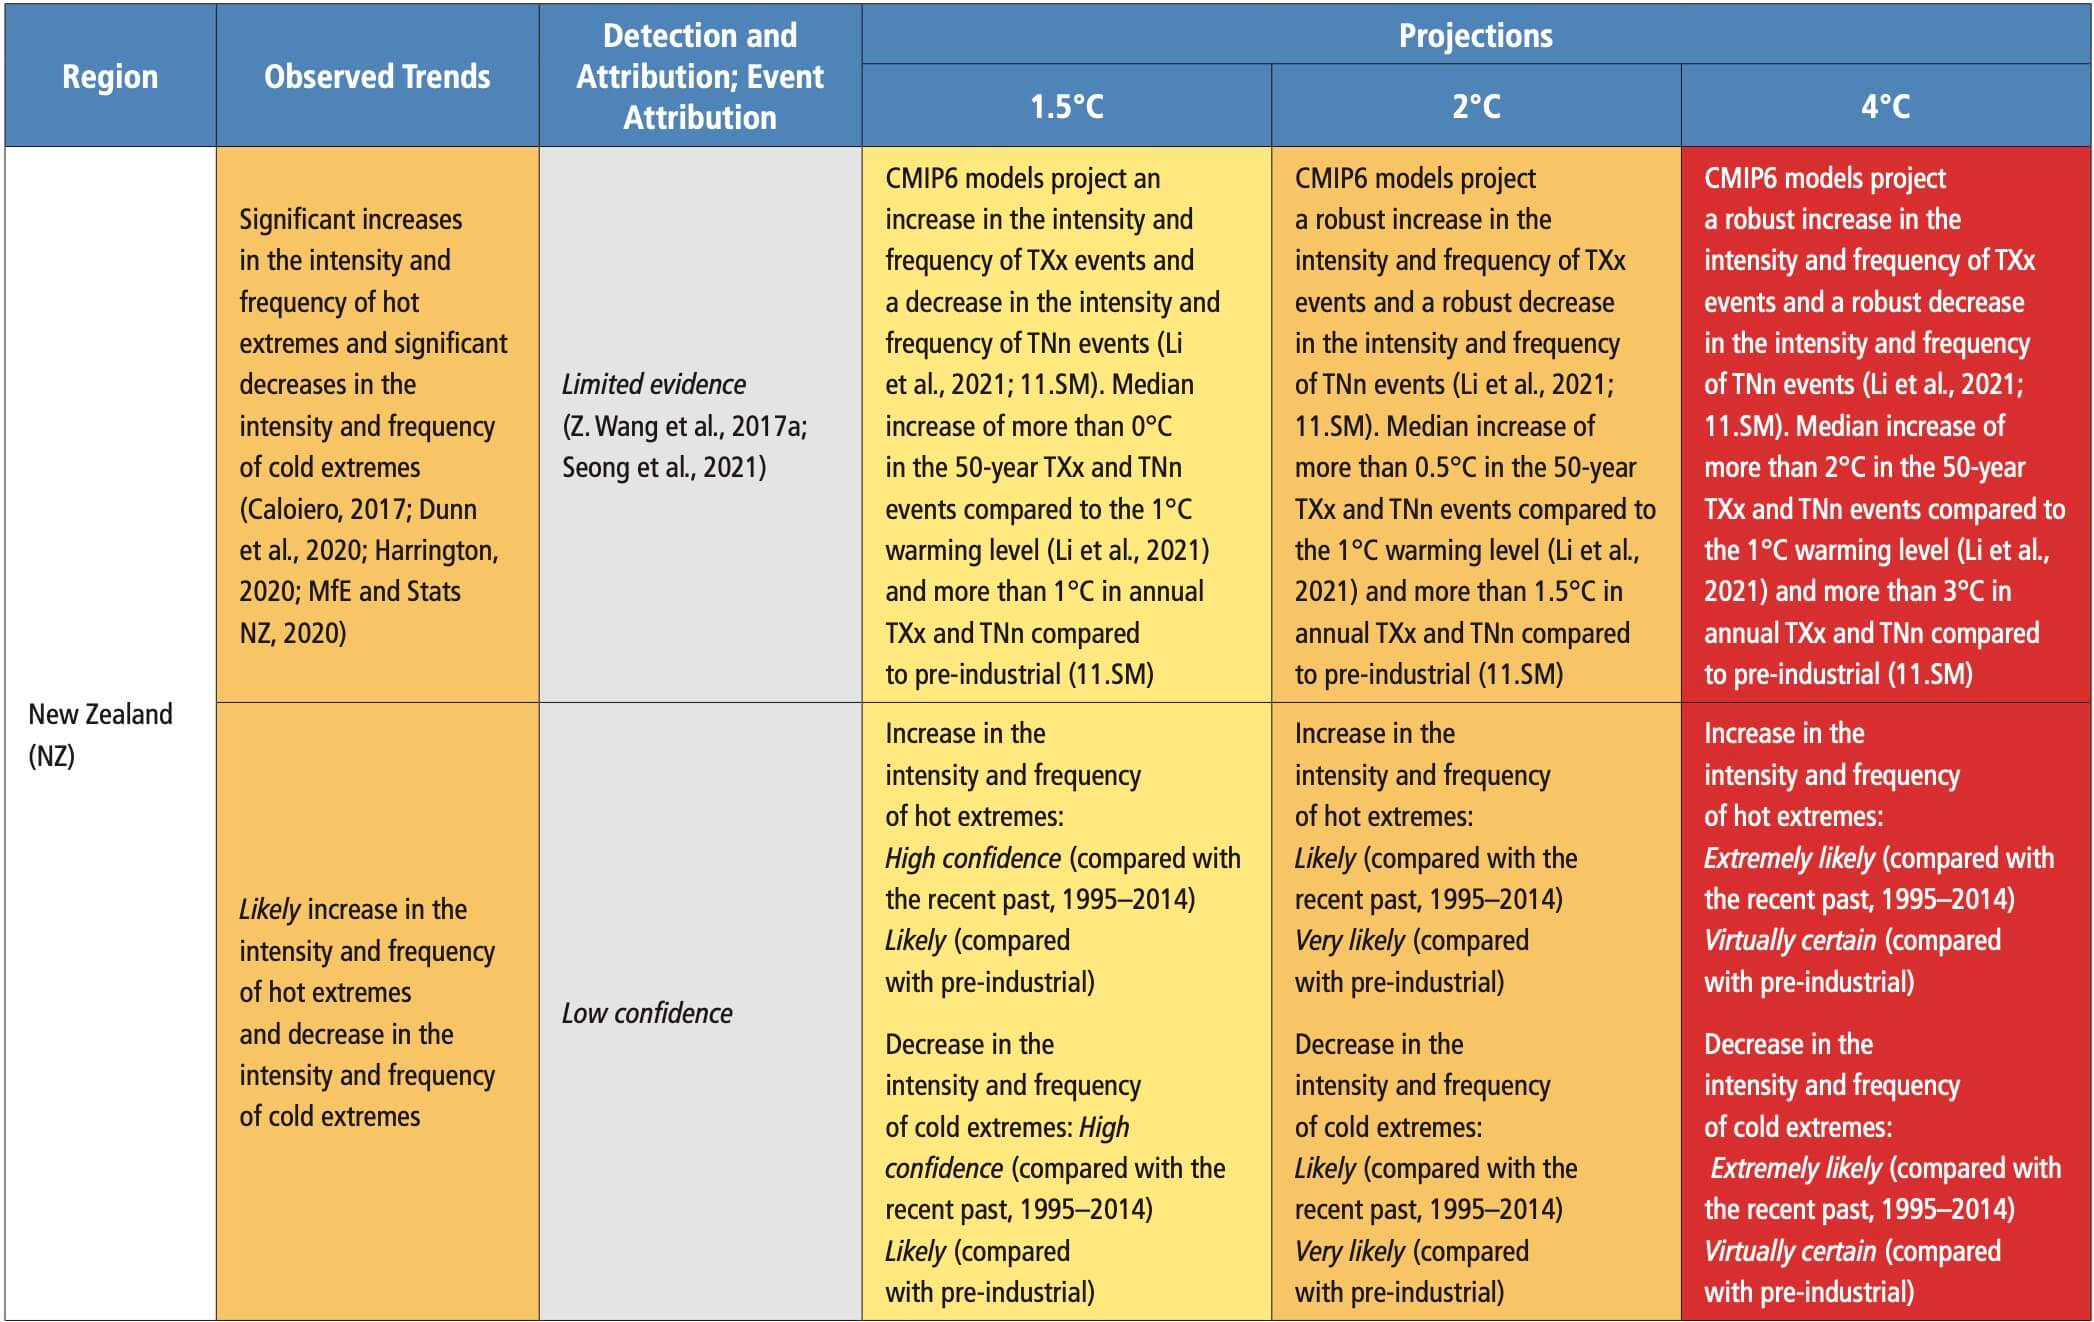 Table 11.11 | Observed trends, human contribution to observed trends, and projected changes at 1.5°C, 2°C and 4°C of global warming for heavy precipitation in Australasia, subdivided by AR6 regions. See Sections 11.9.1 and 11.9.3 for details.
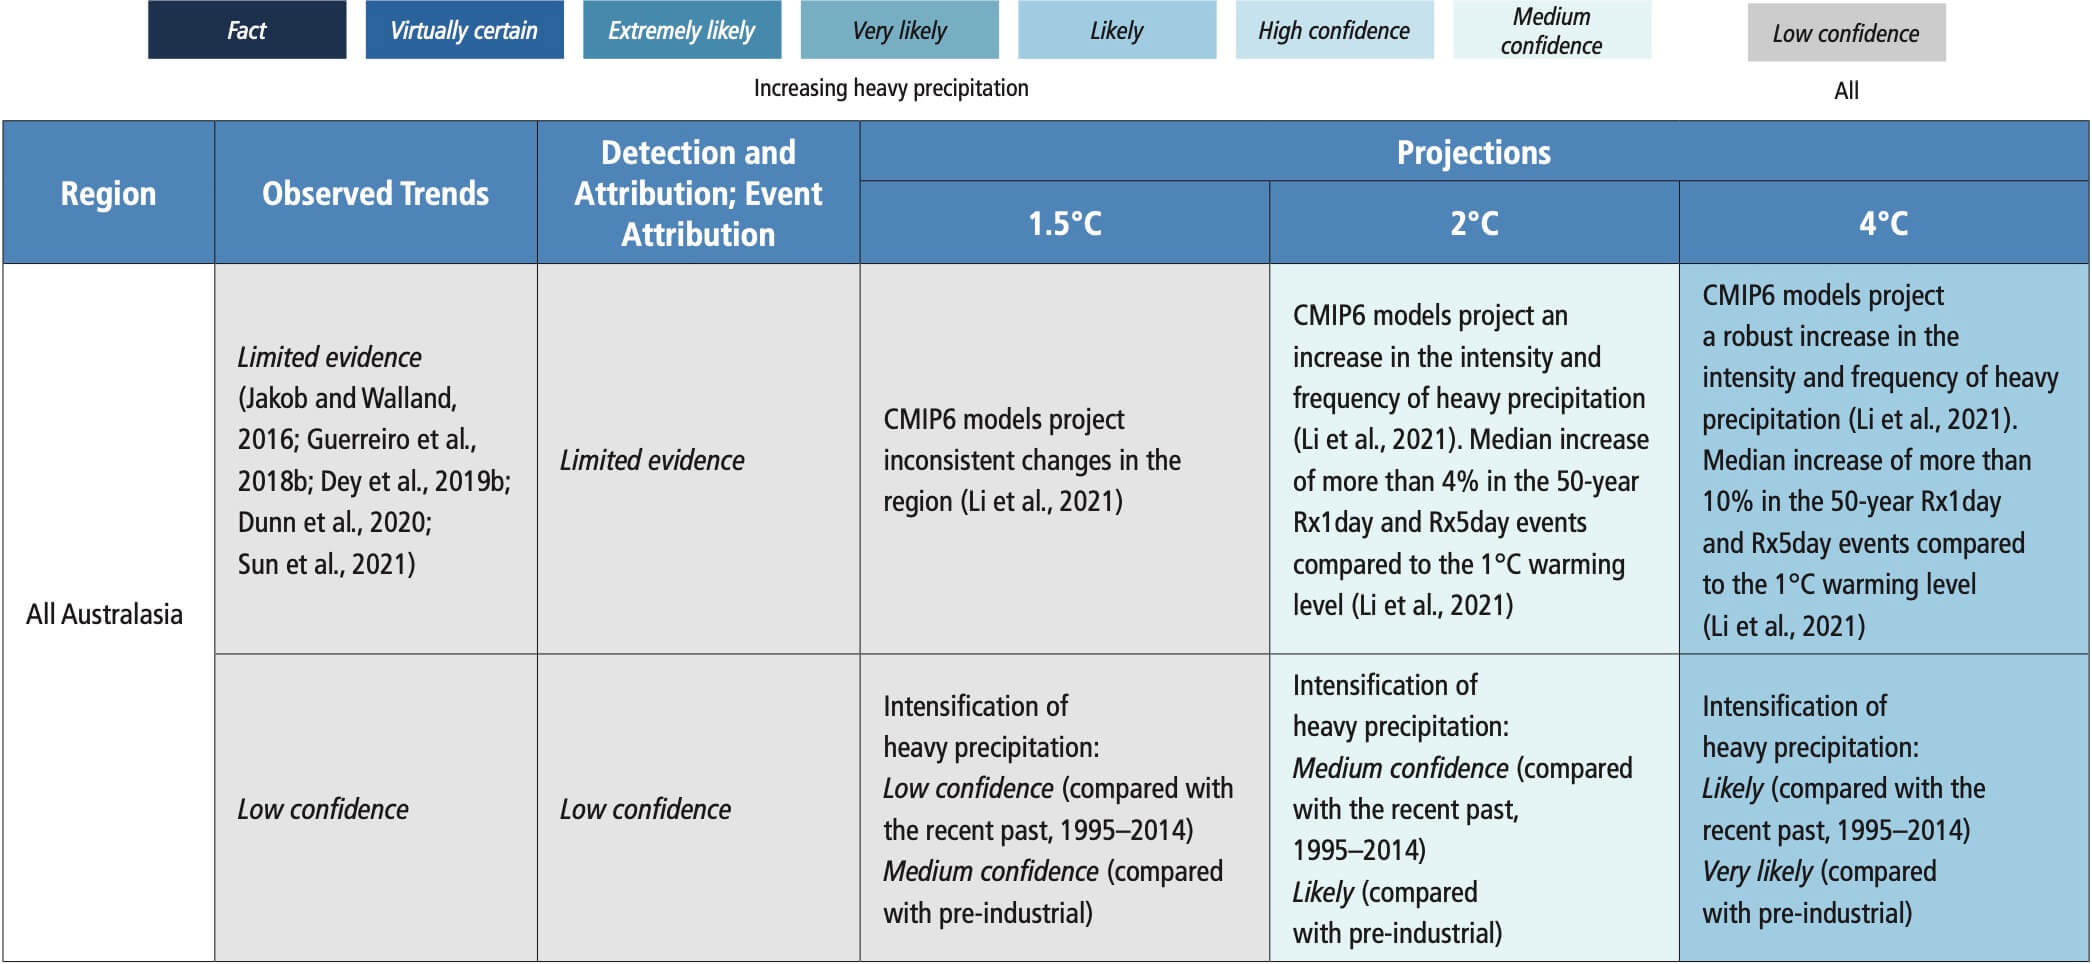
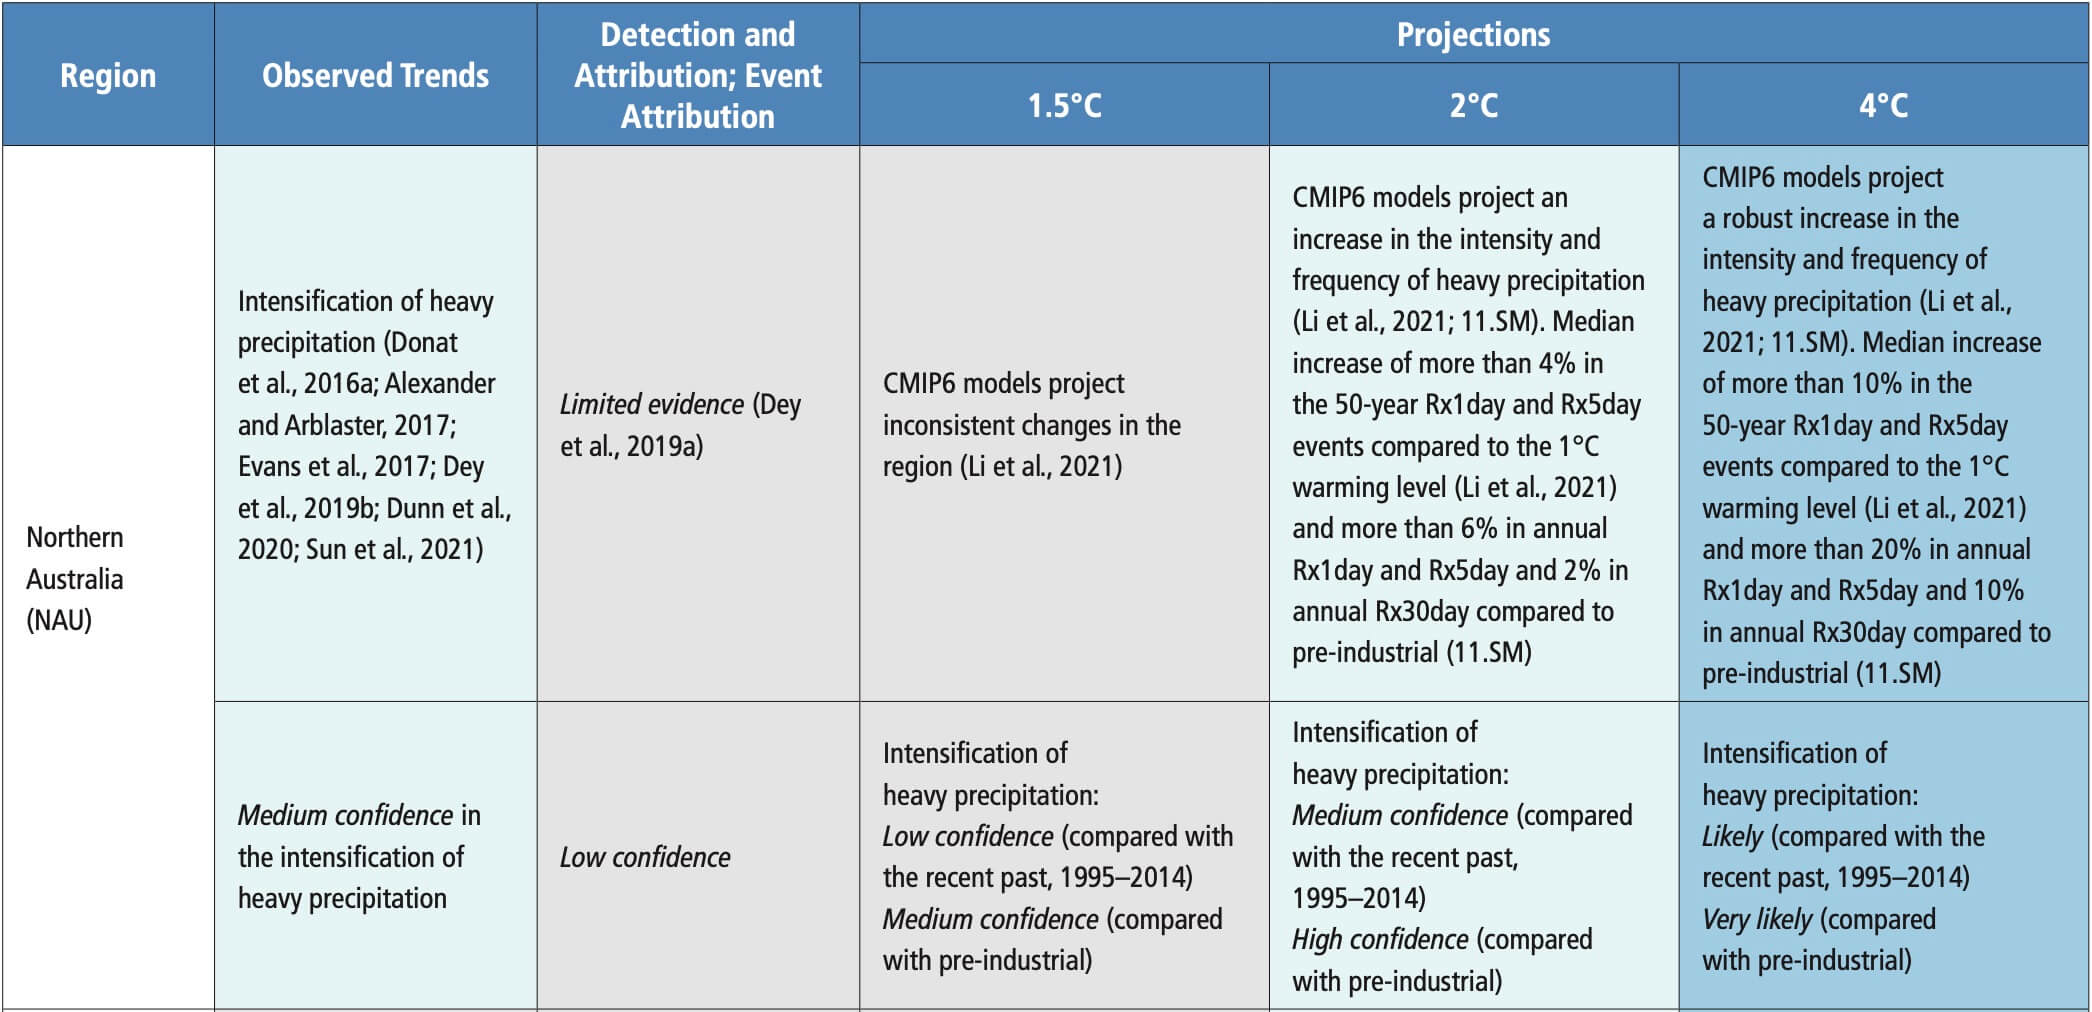
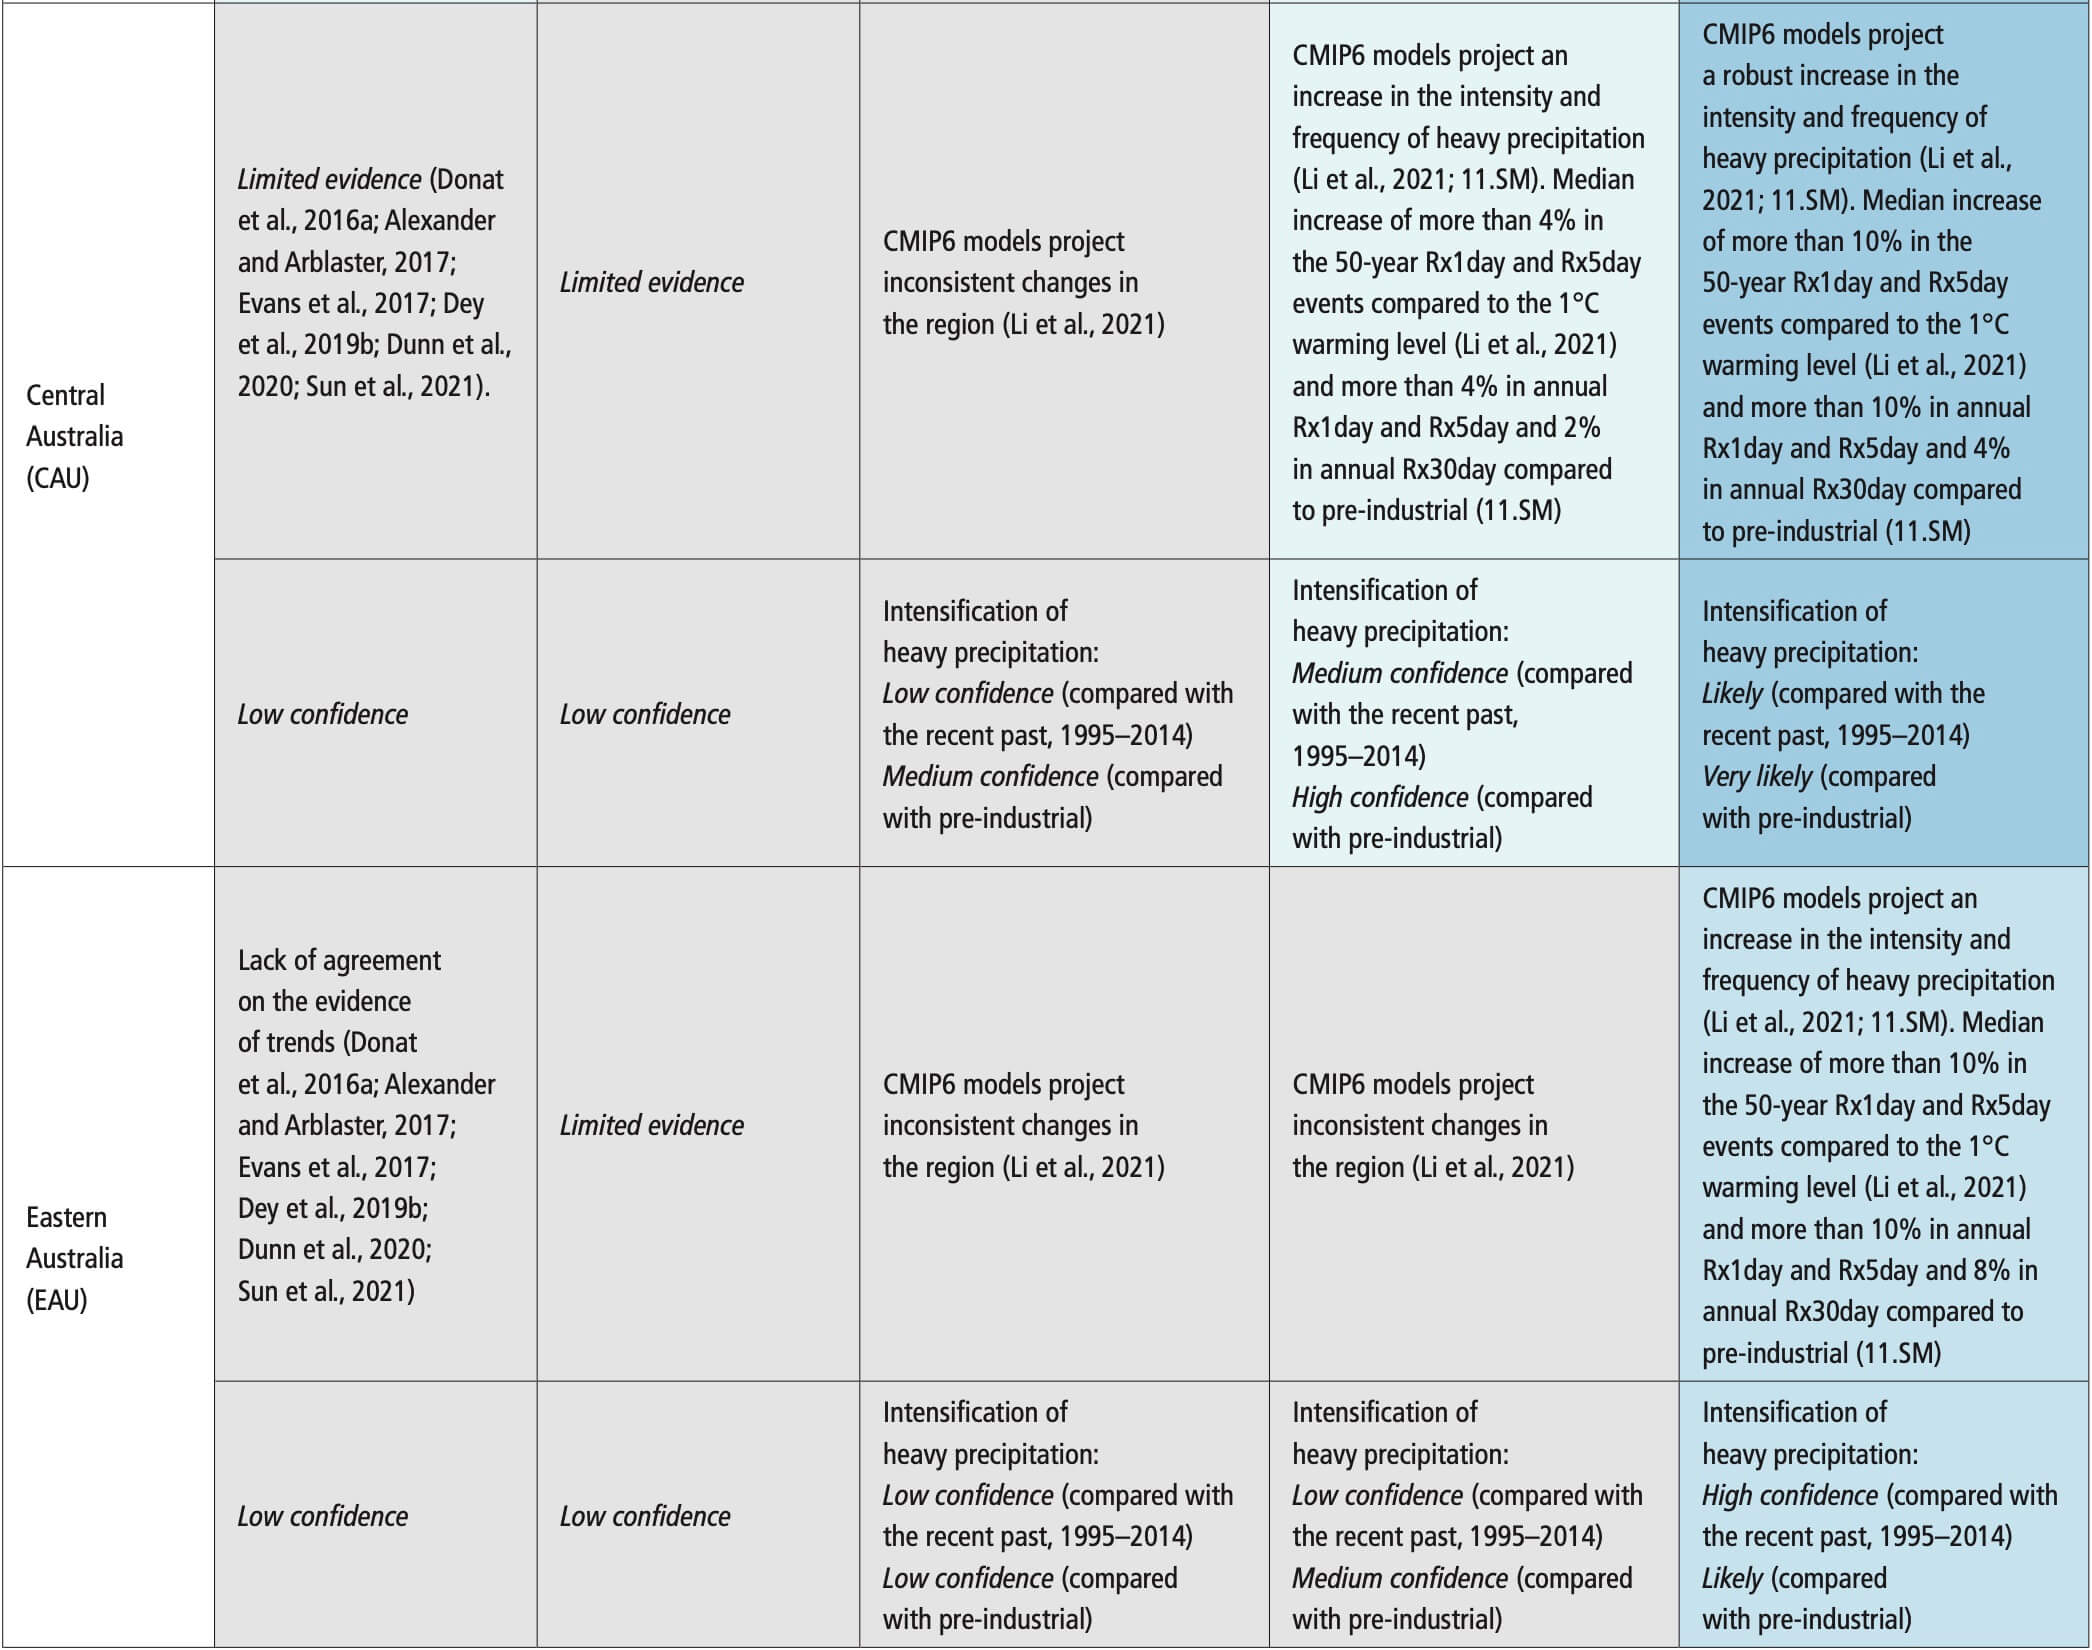
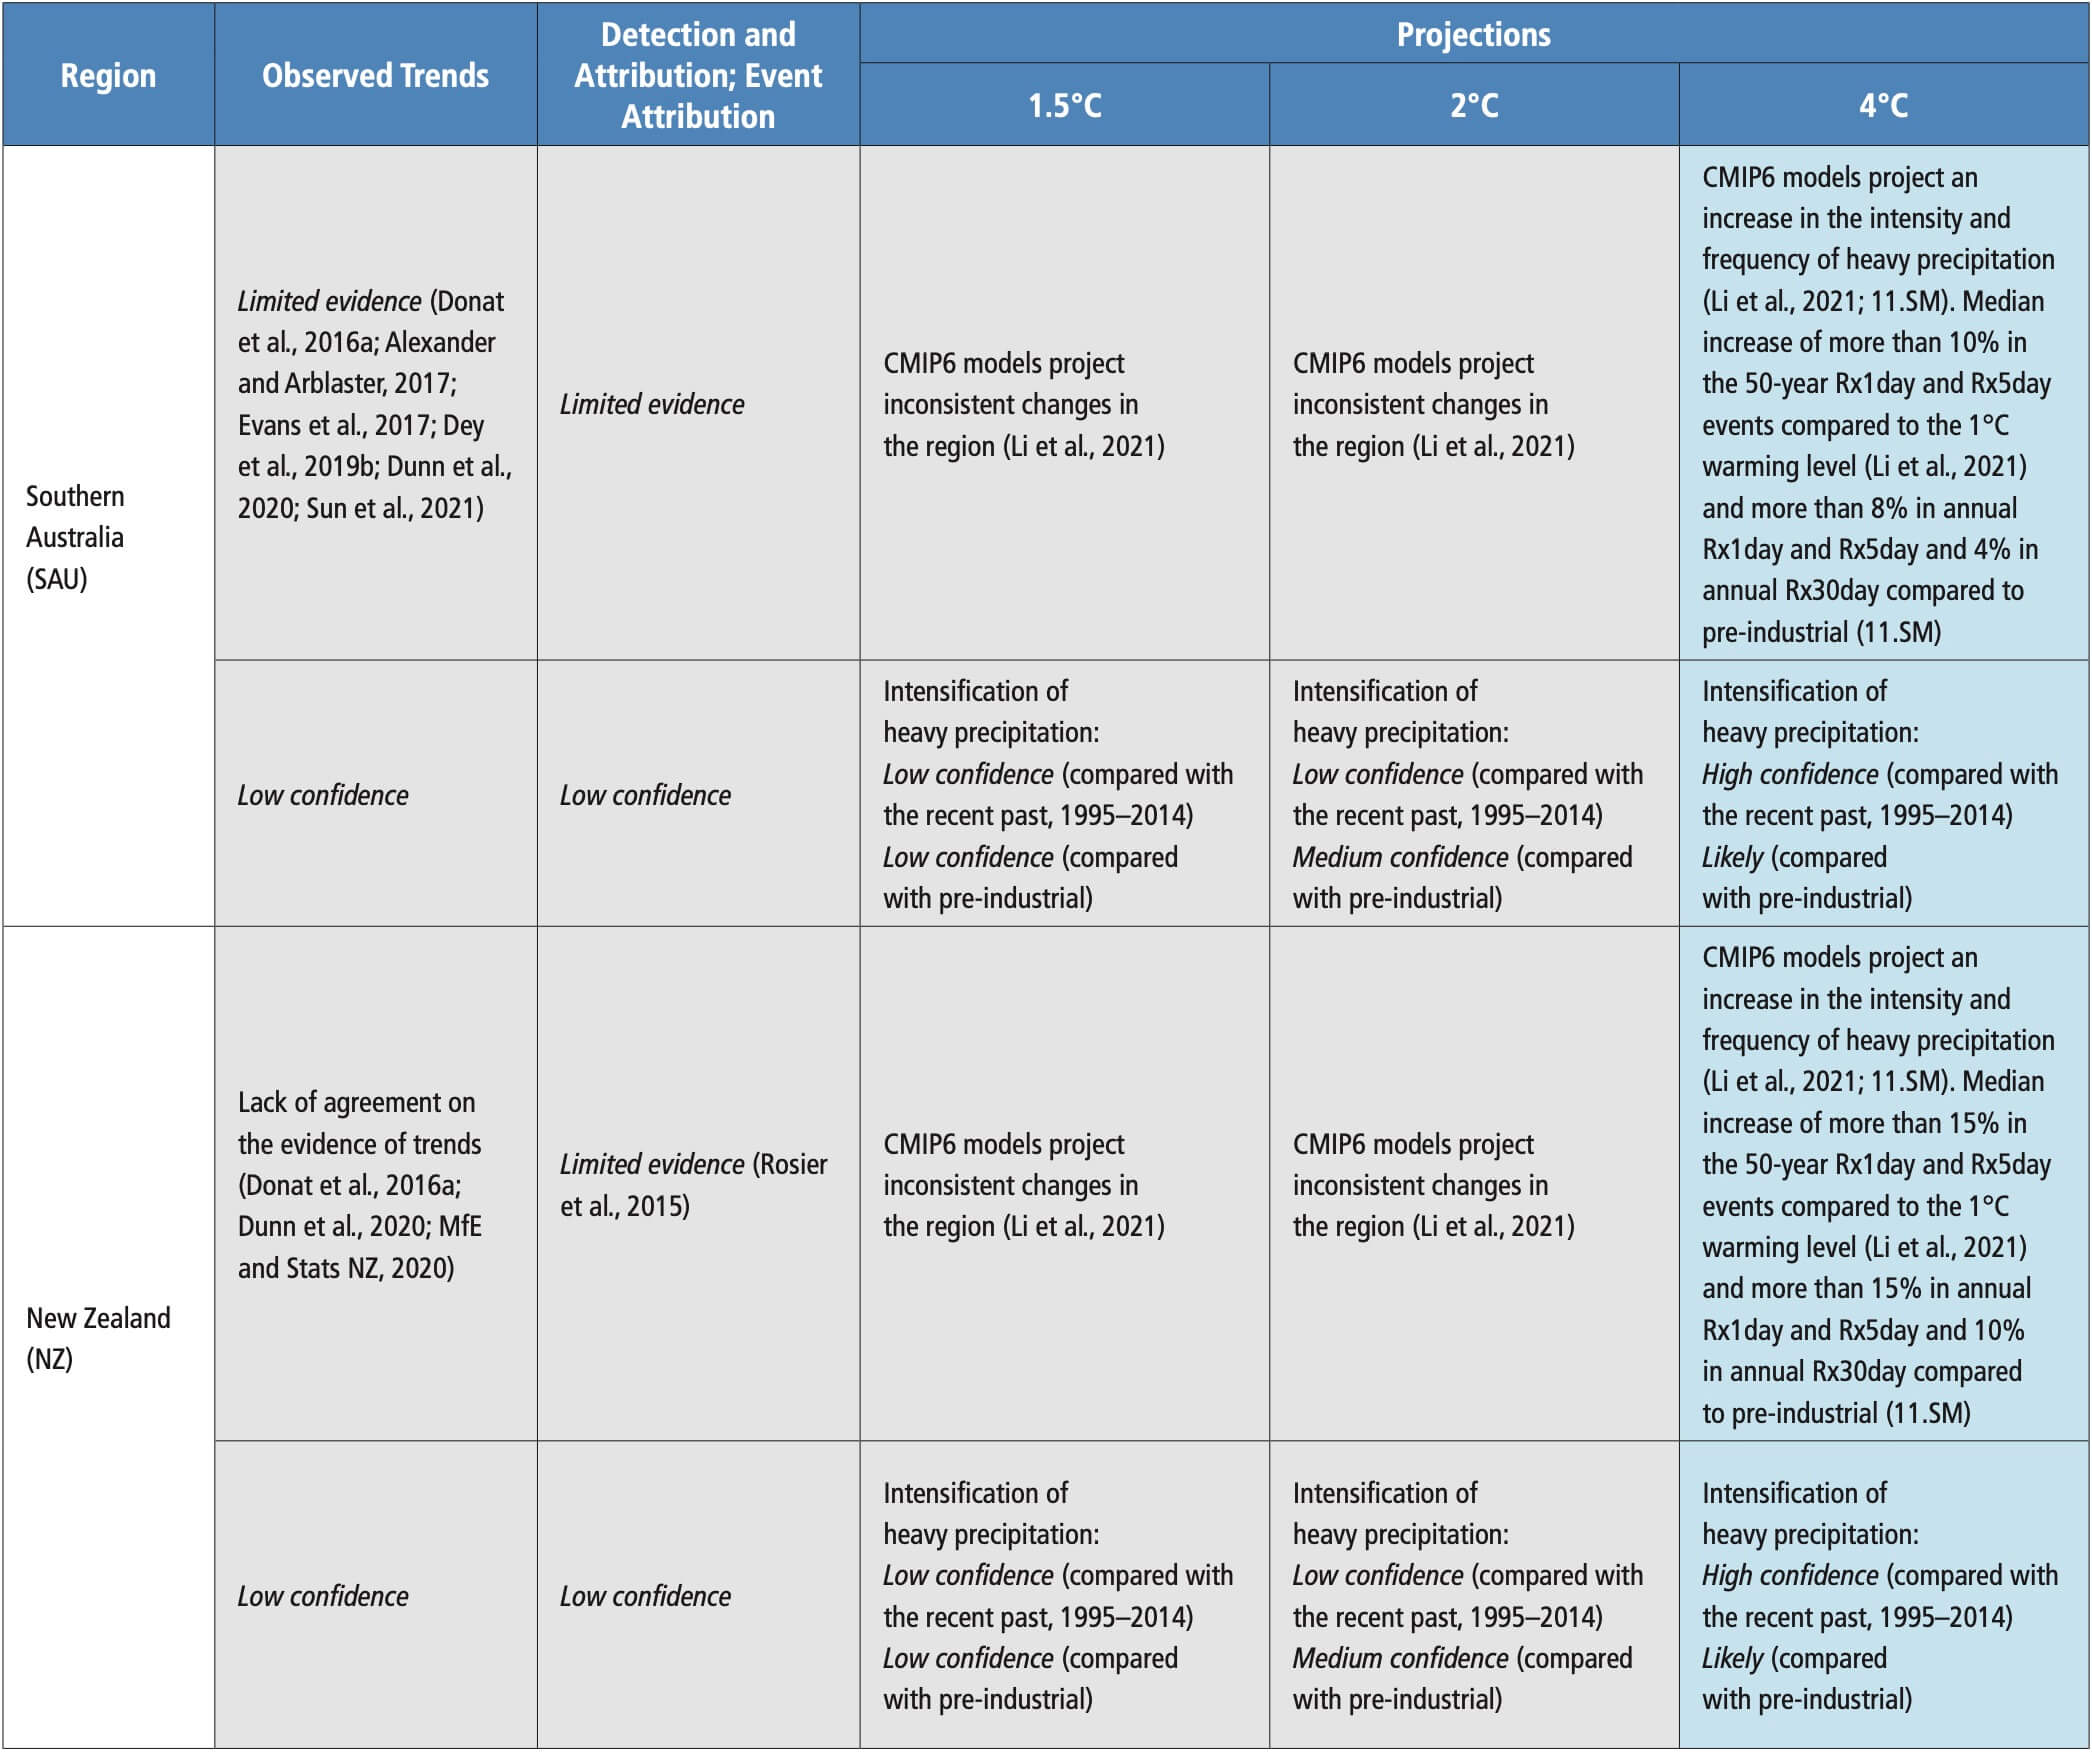 Table 11.12 | Observed trends, human contribution to observed trends, and projected changesat 1.5°C, 2°C and 4°C of global warming for meteorological droughts (MET), agricultural and ecological droughts (AGR/ECOL), and hydrological droughts (HYDR) in Australasia, subdivided by AR6 regions. See Sections 11.9.1 and 11.9.4 for details.
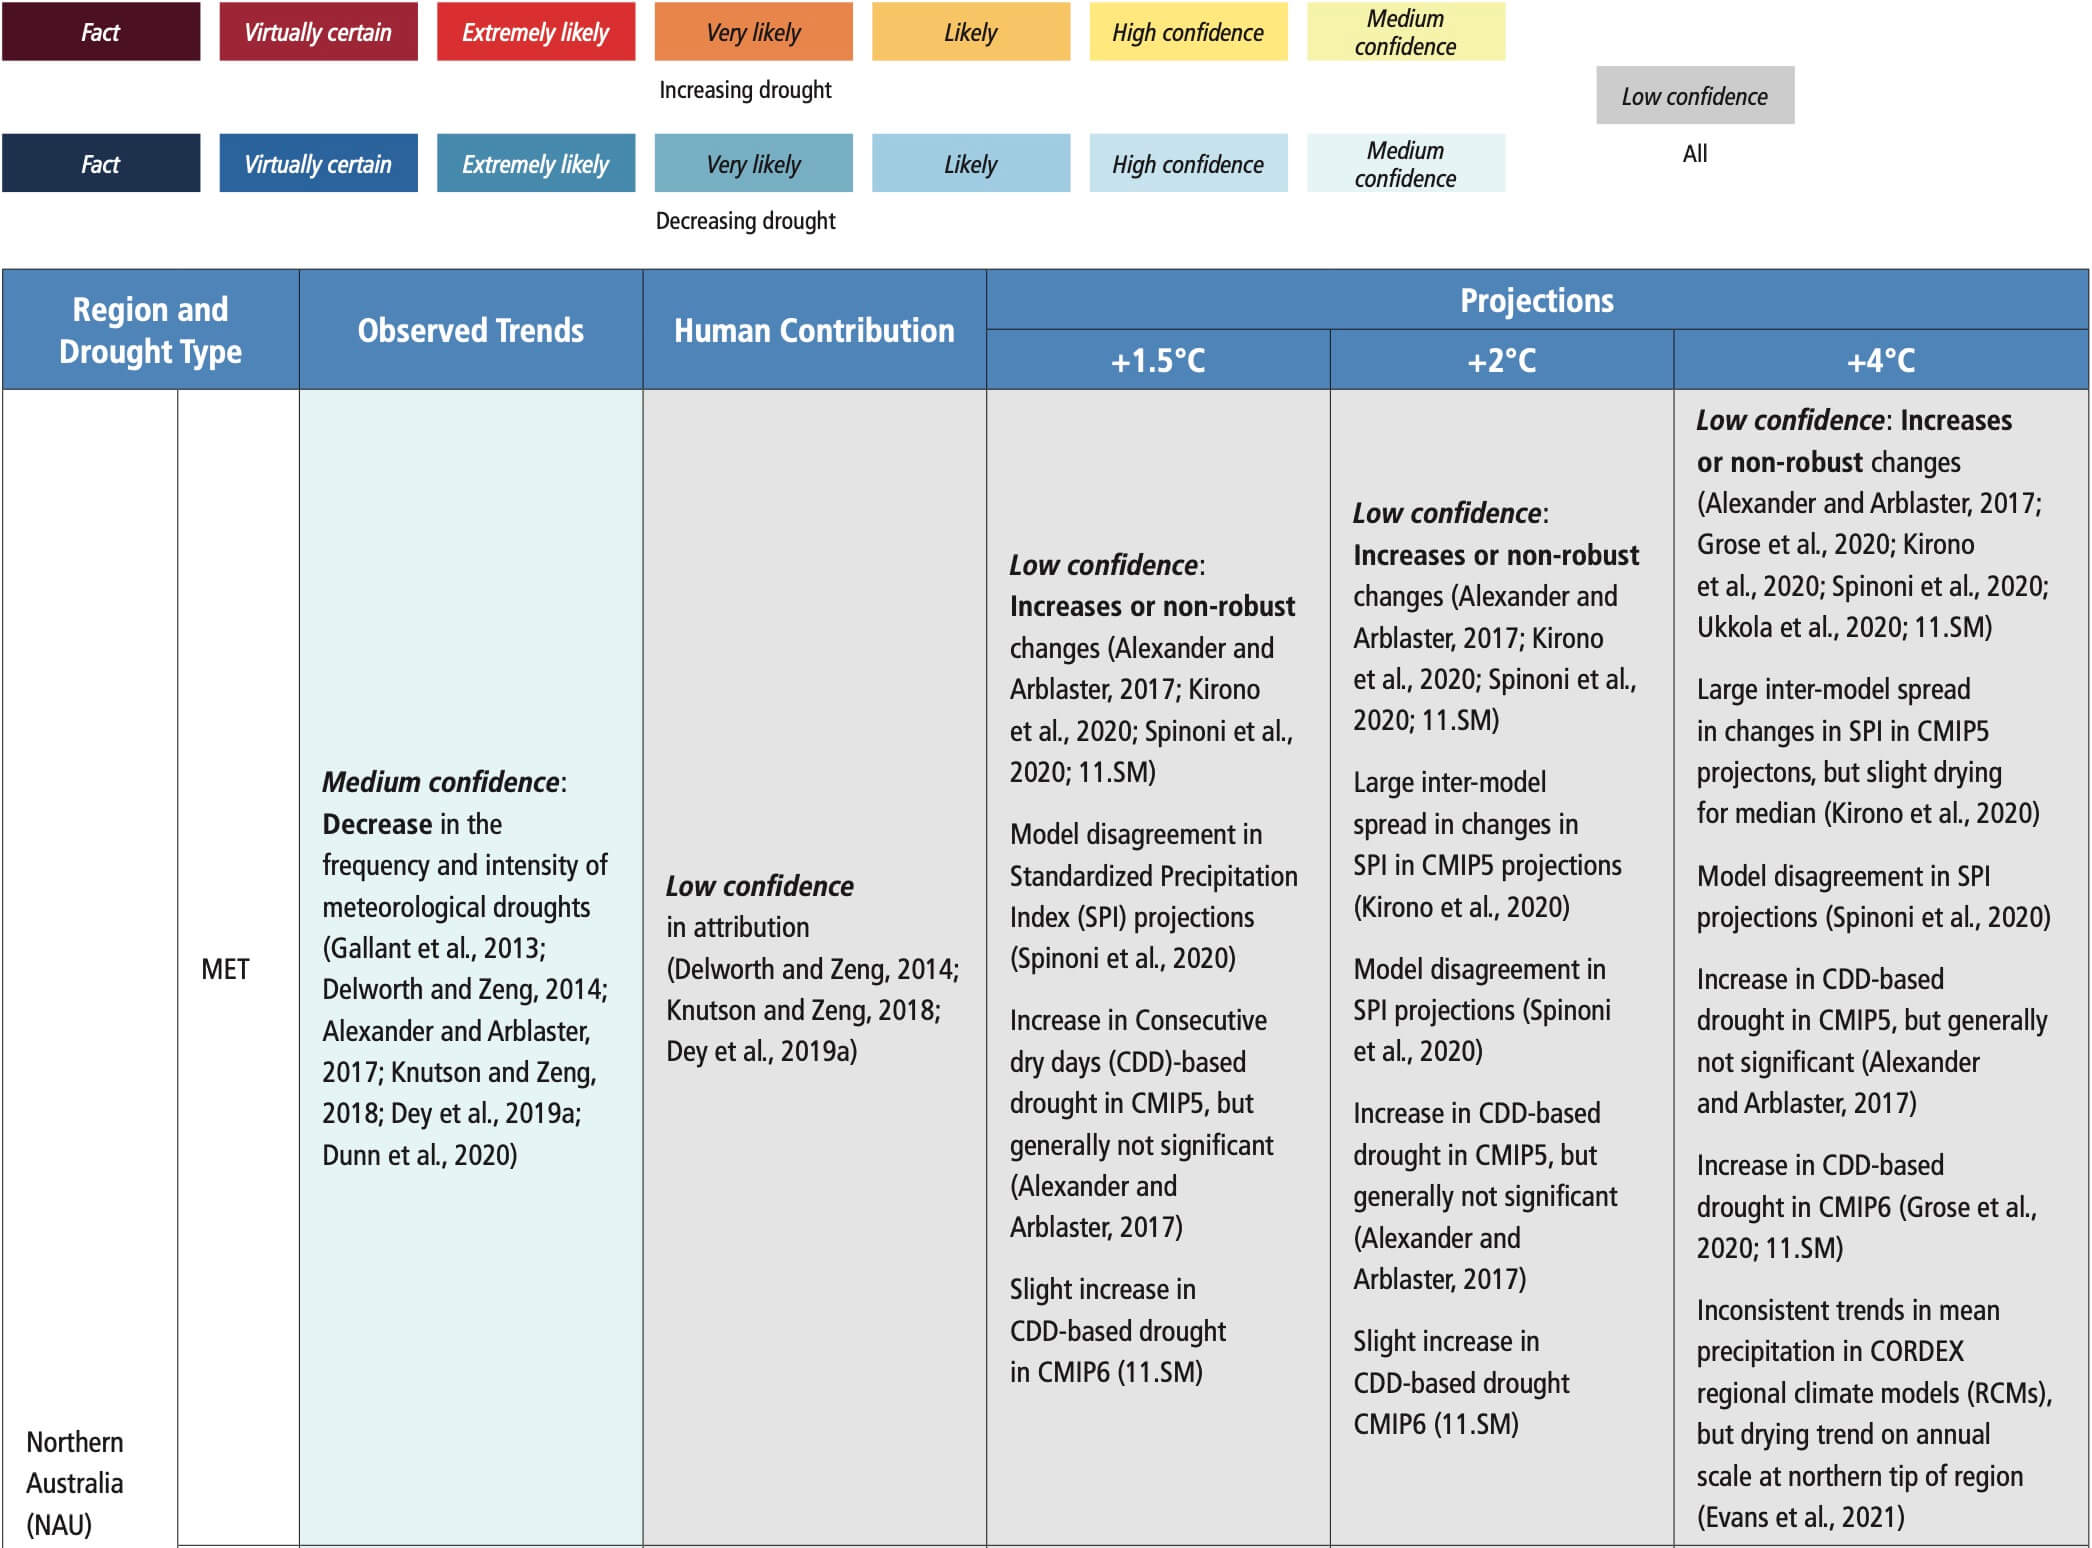
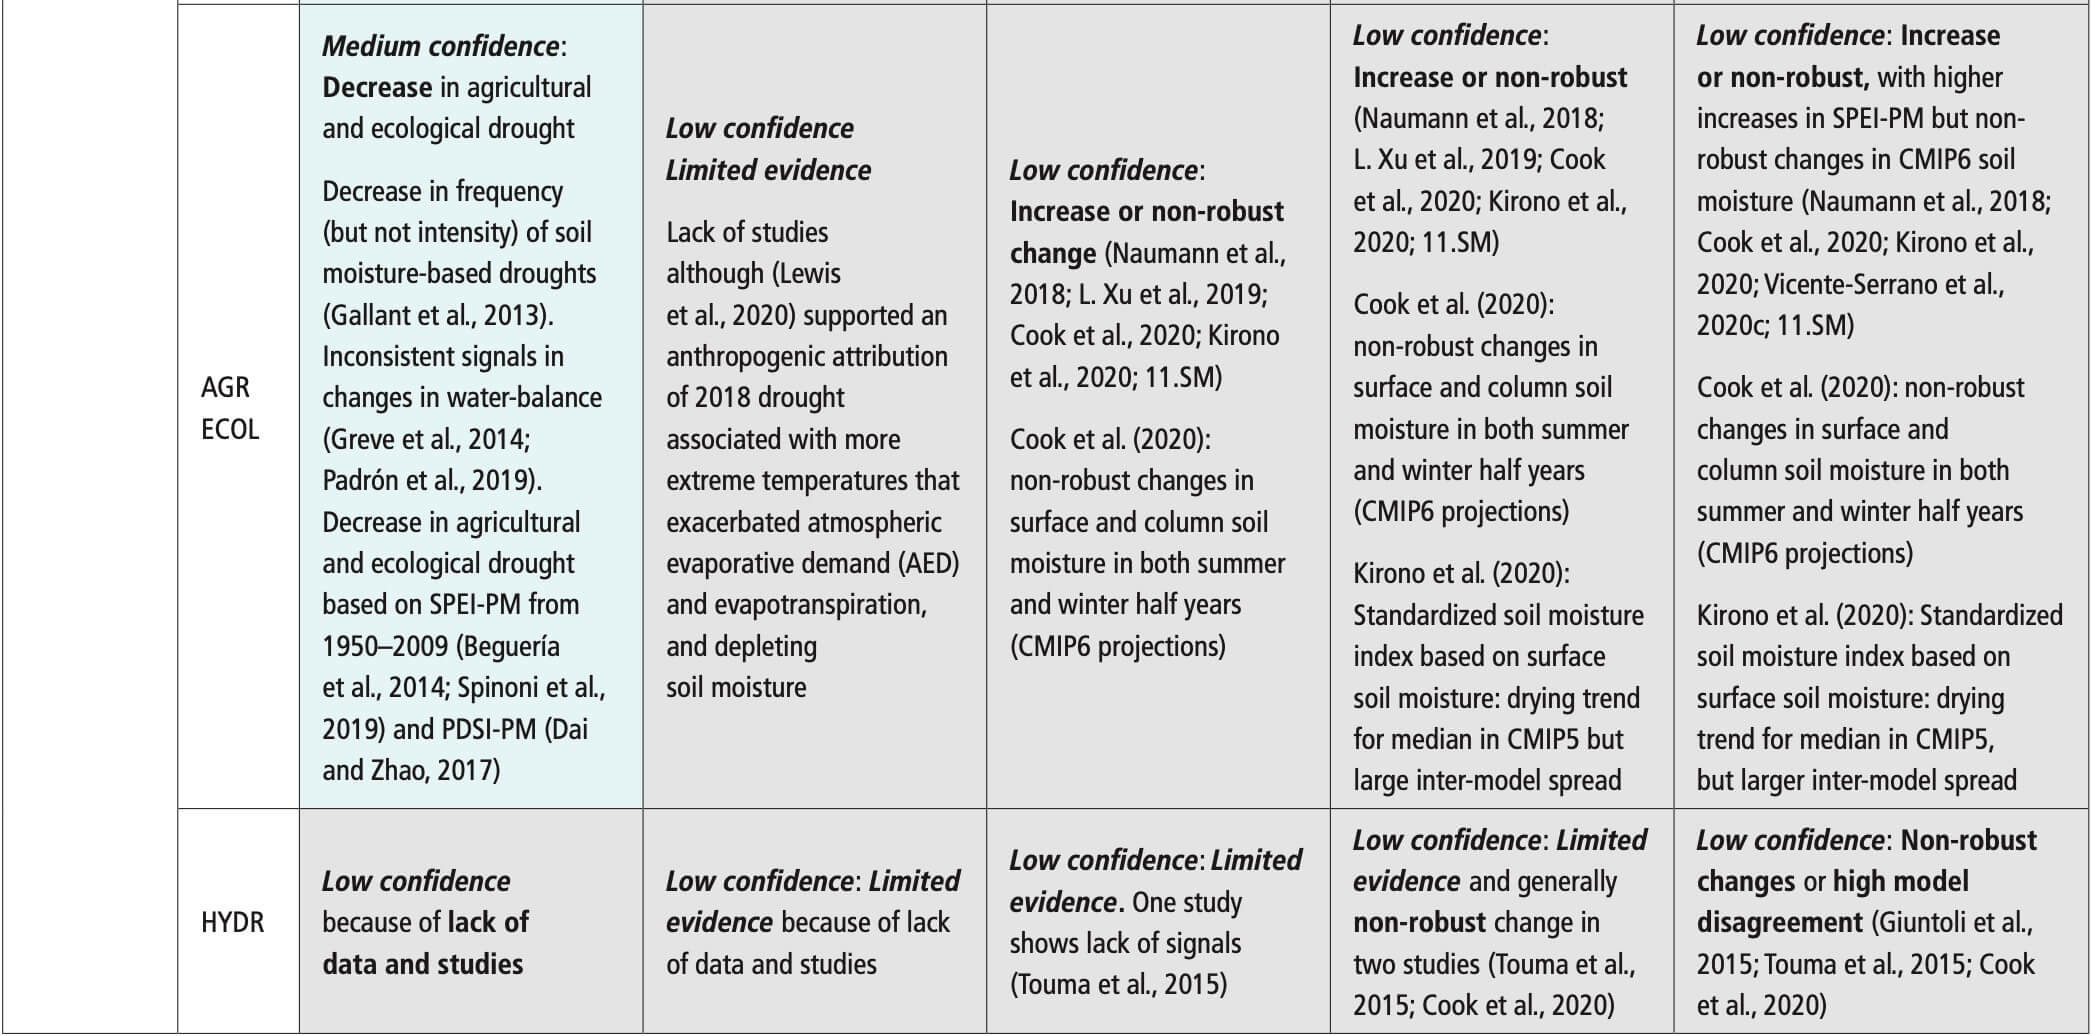
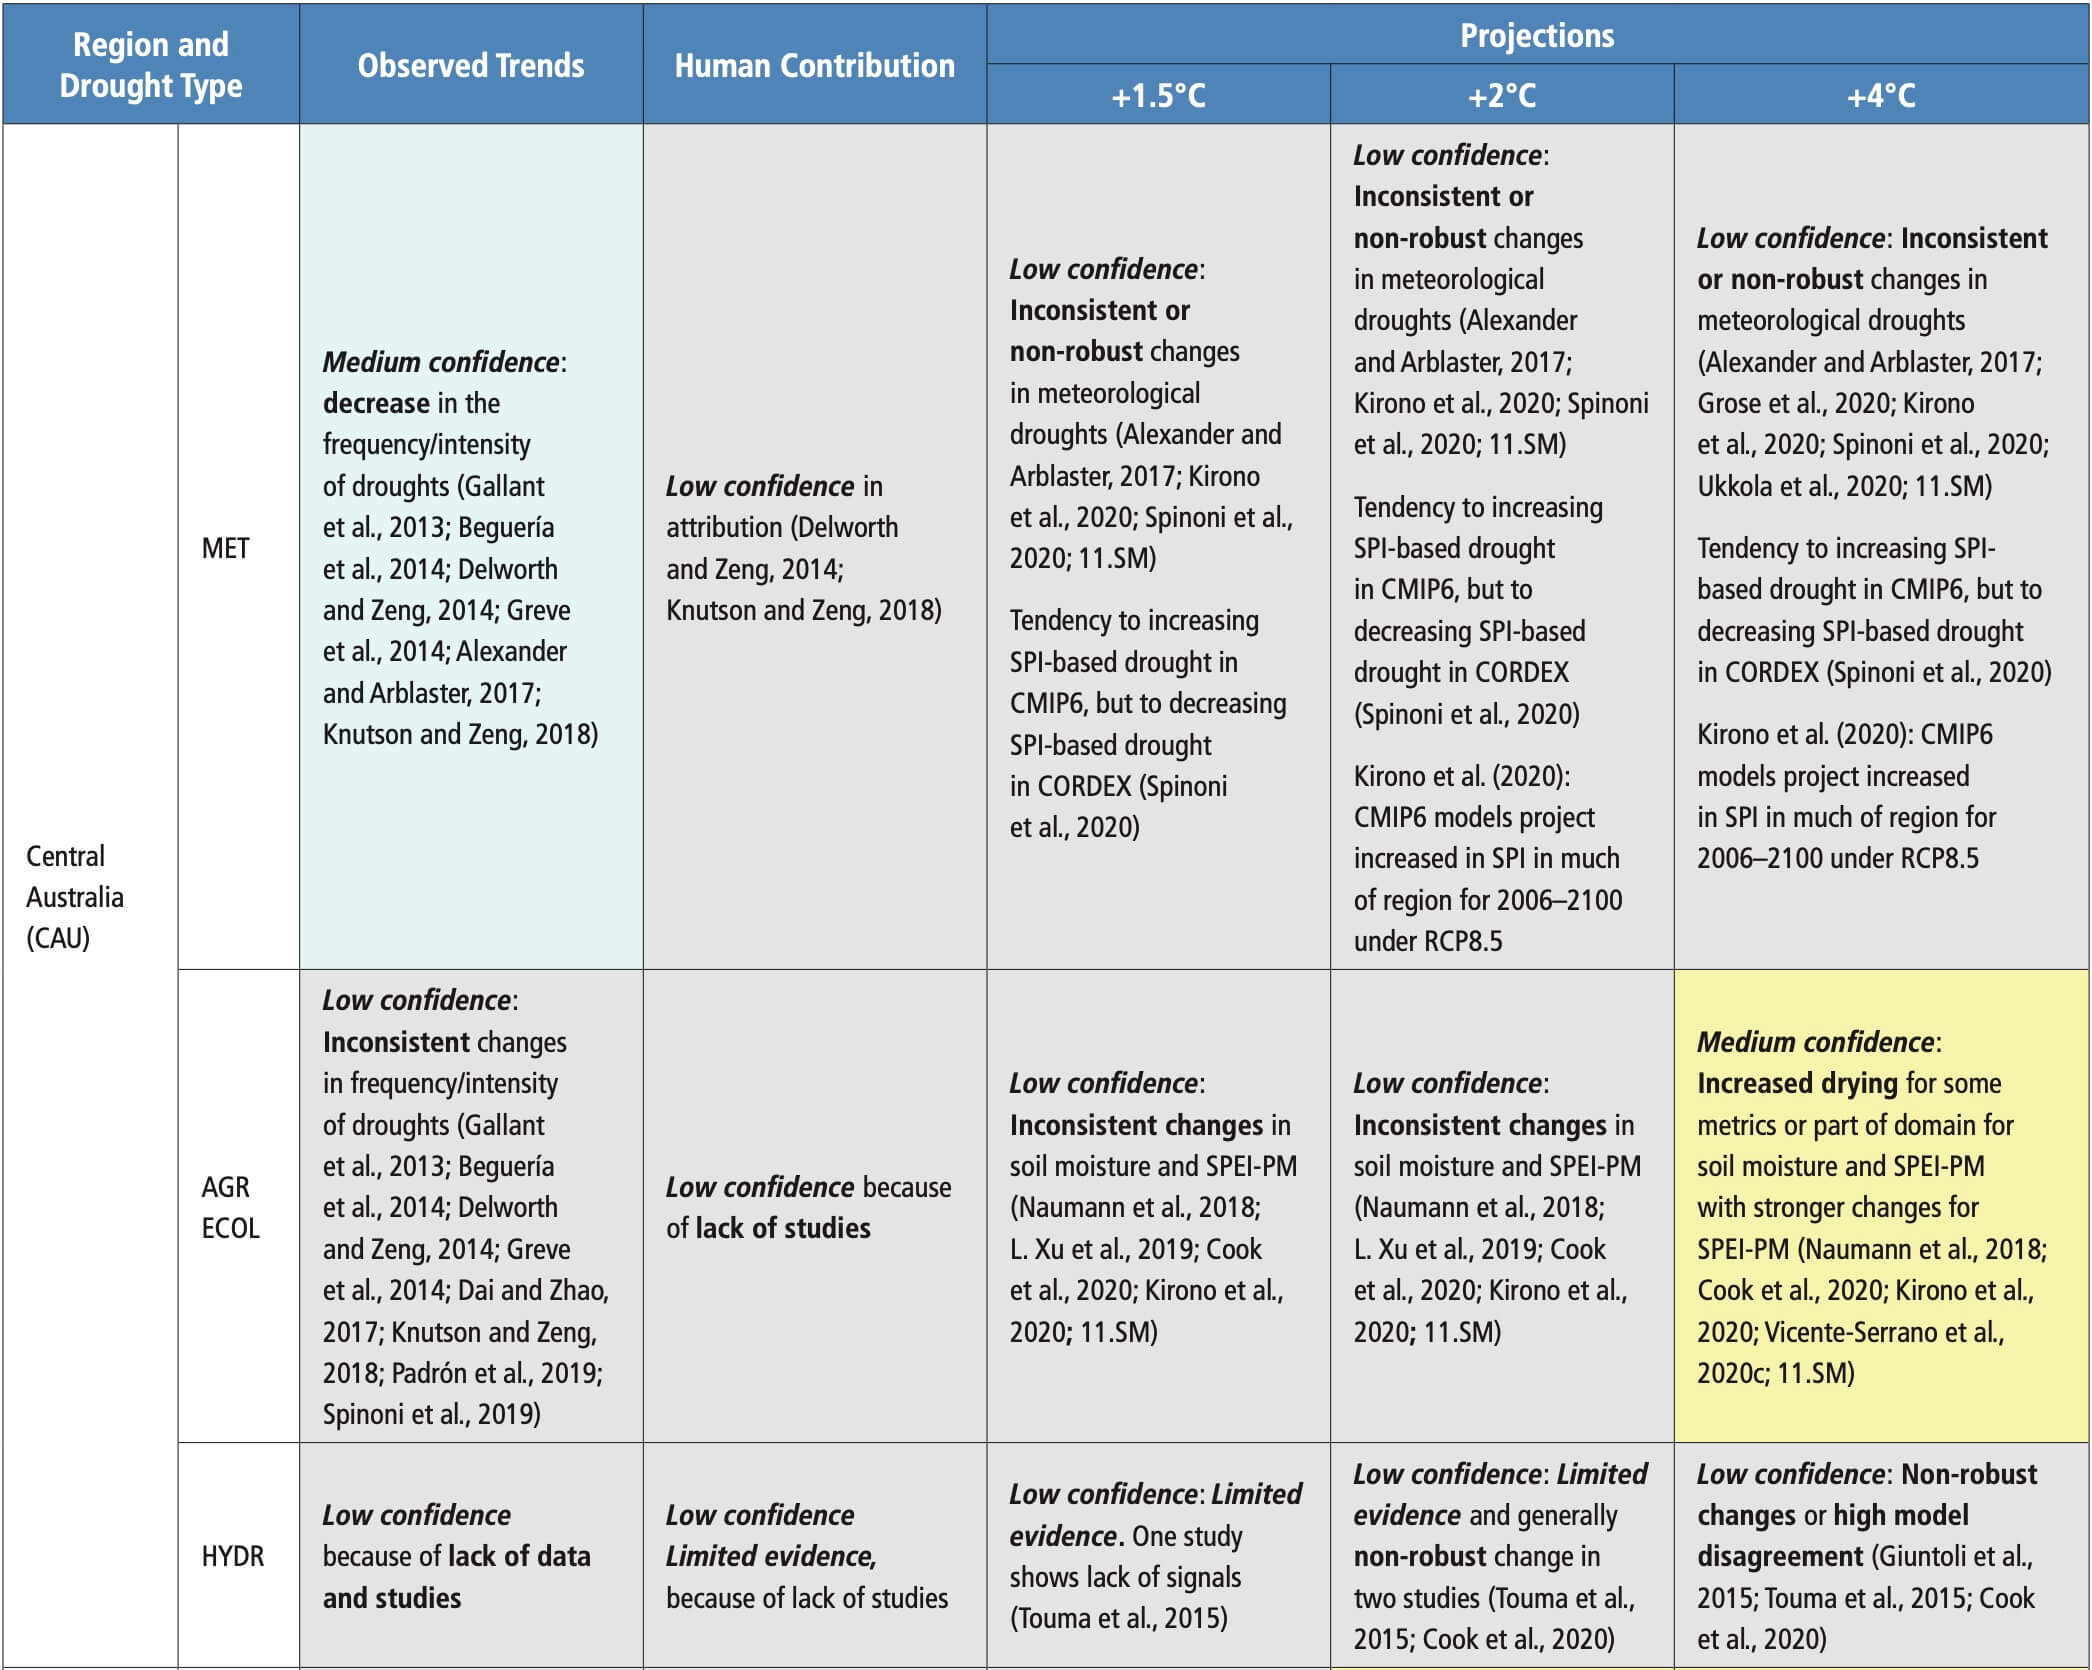
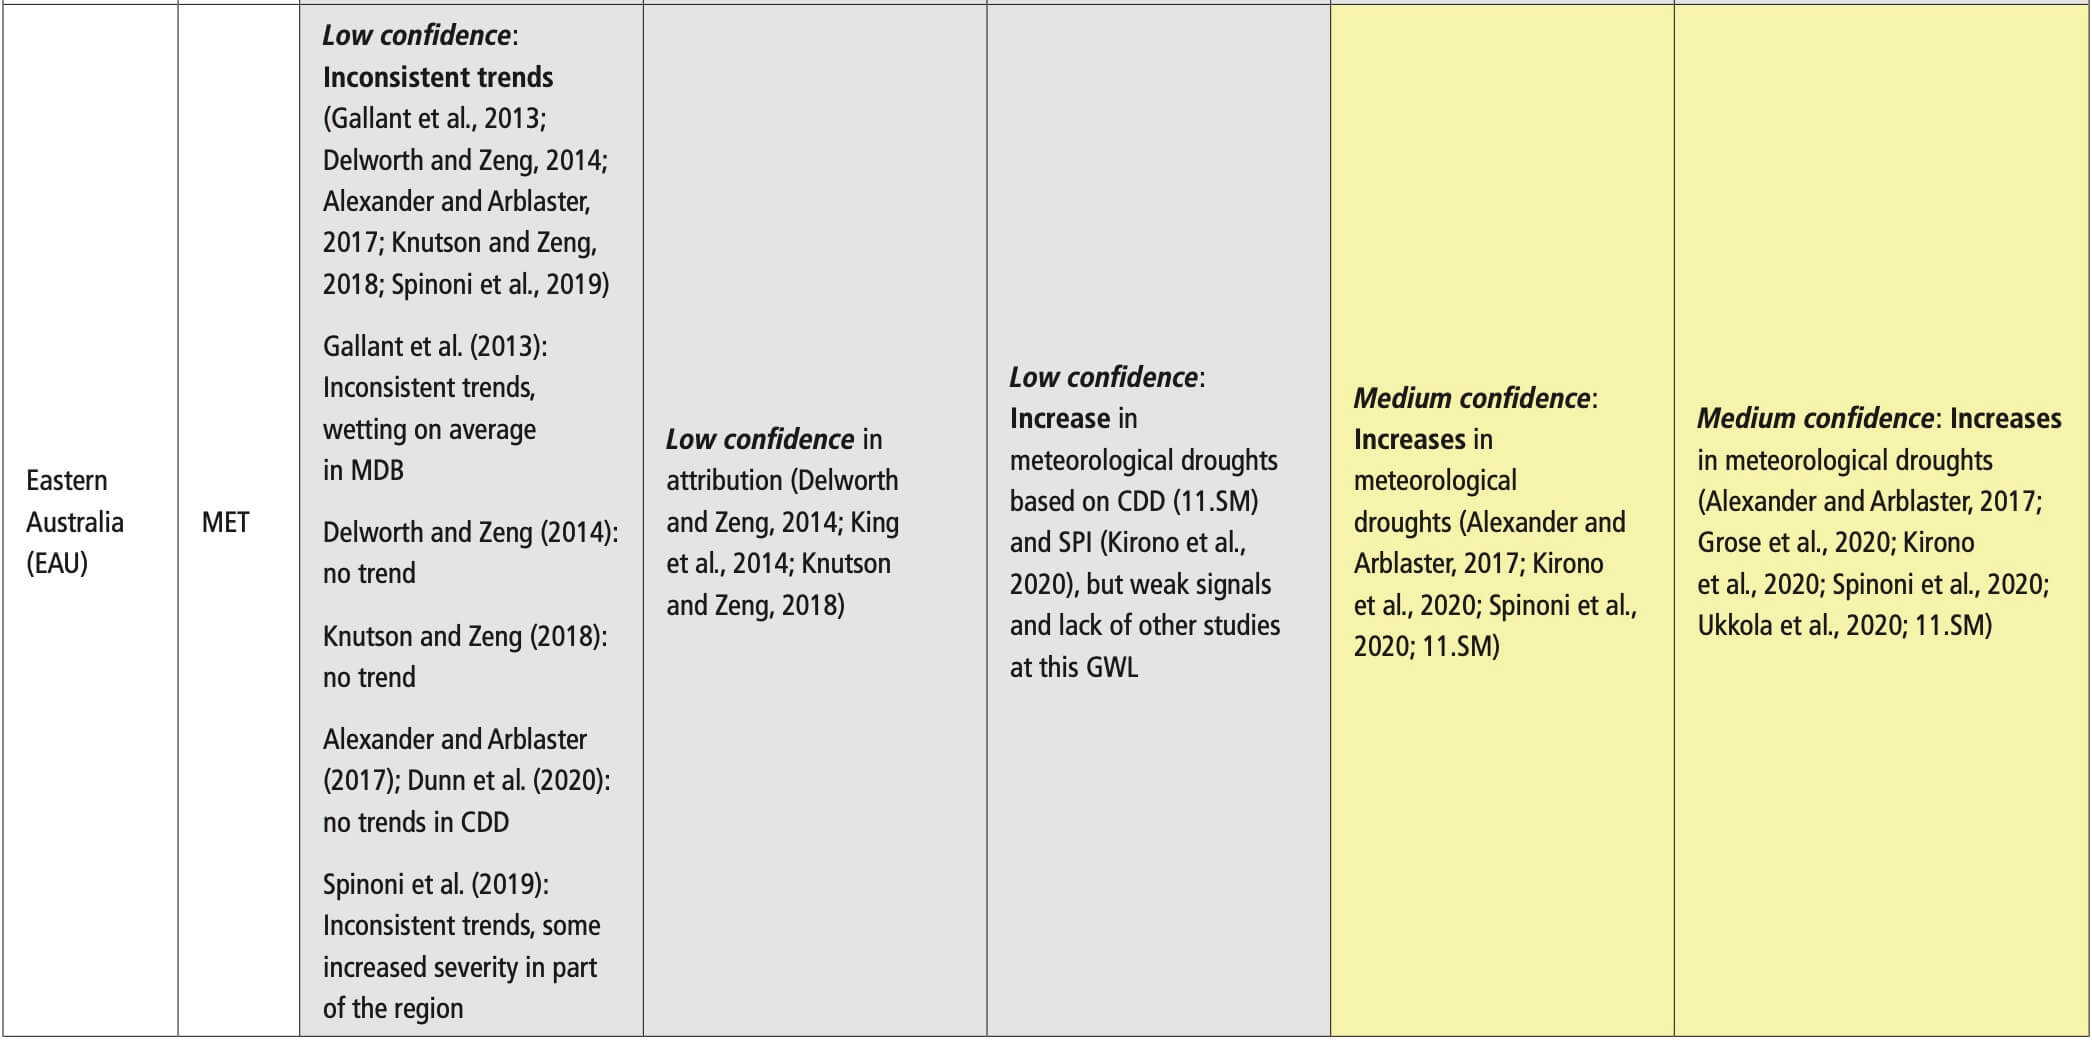
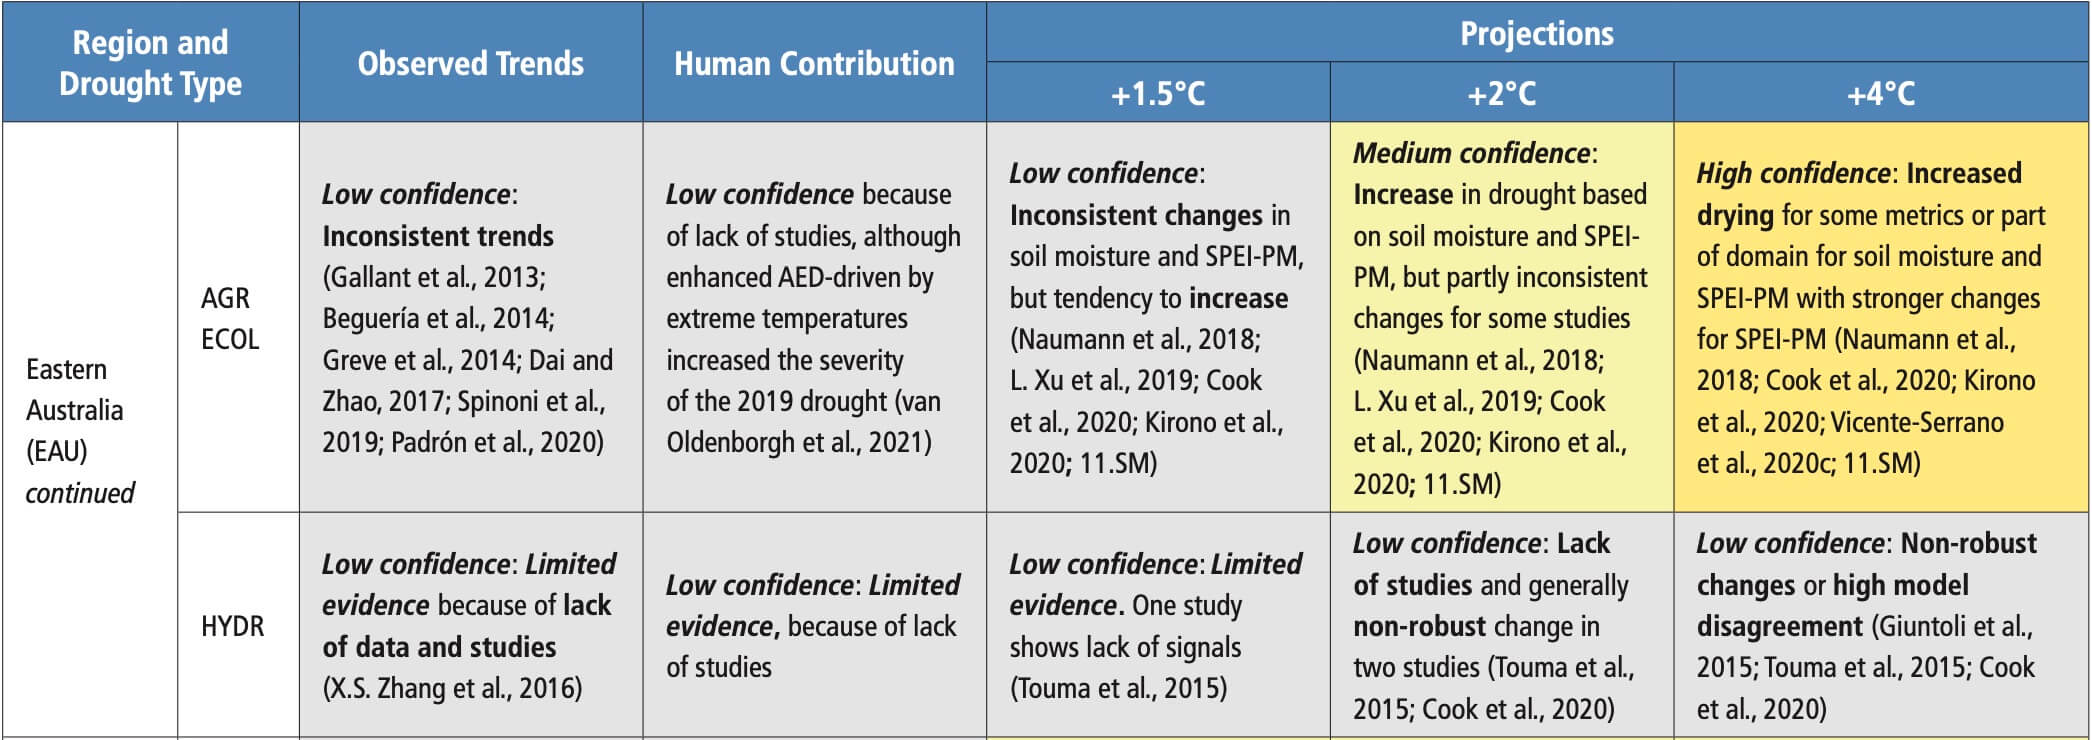
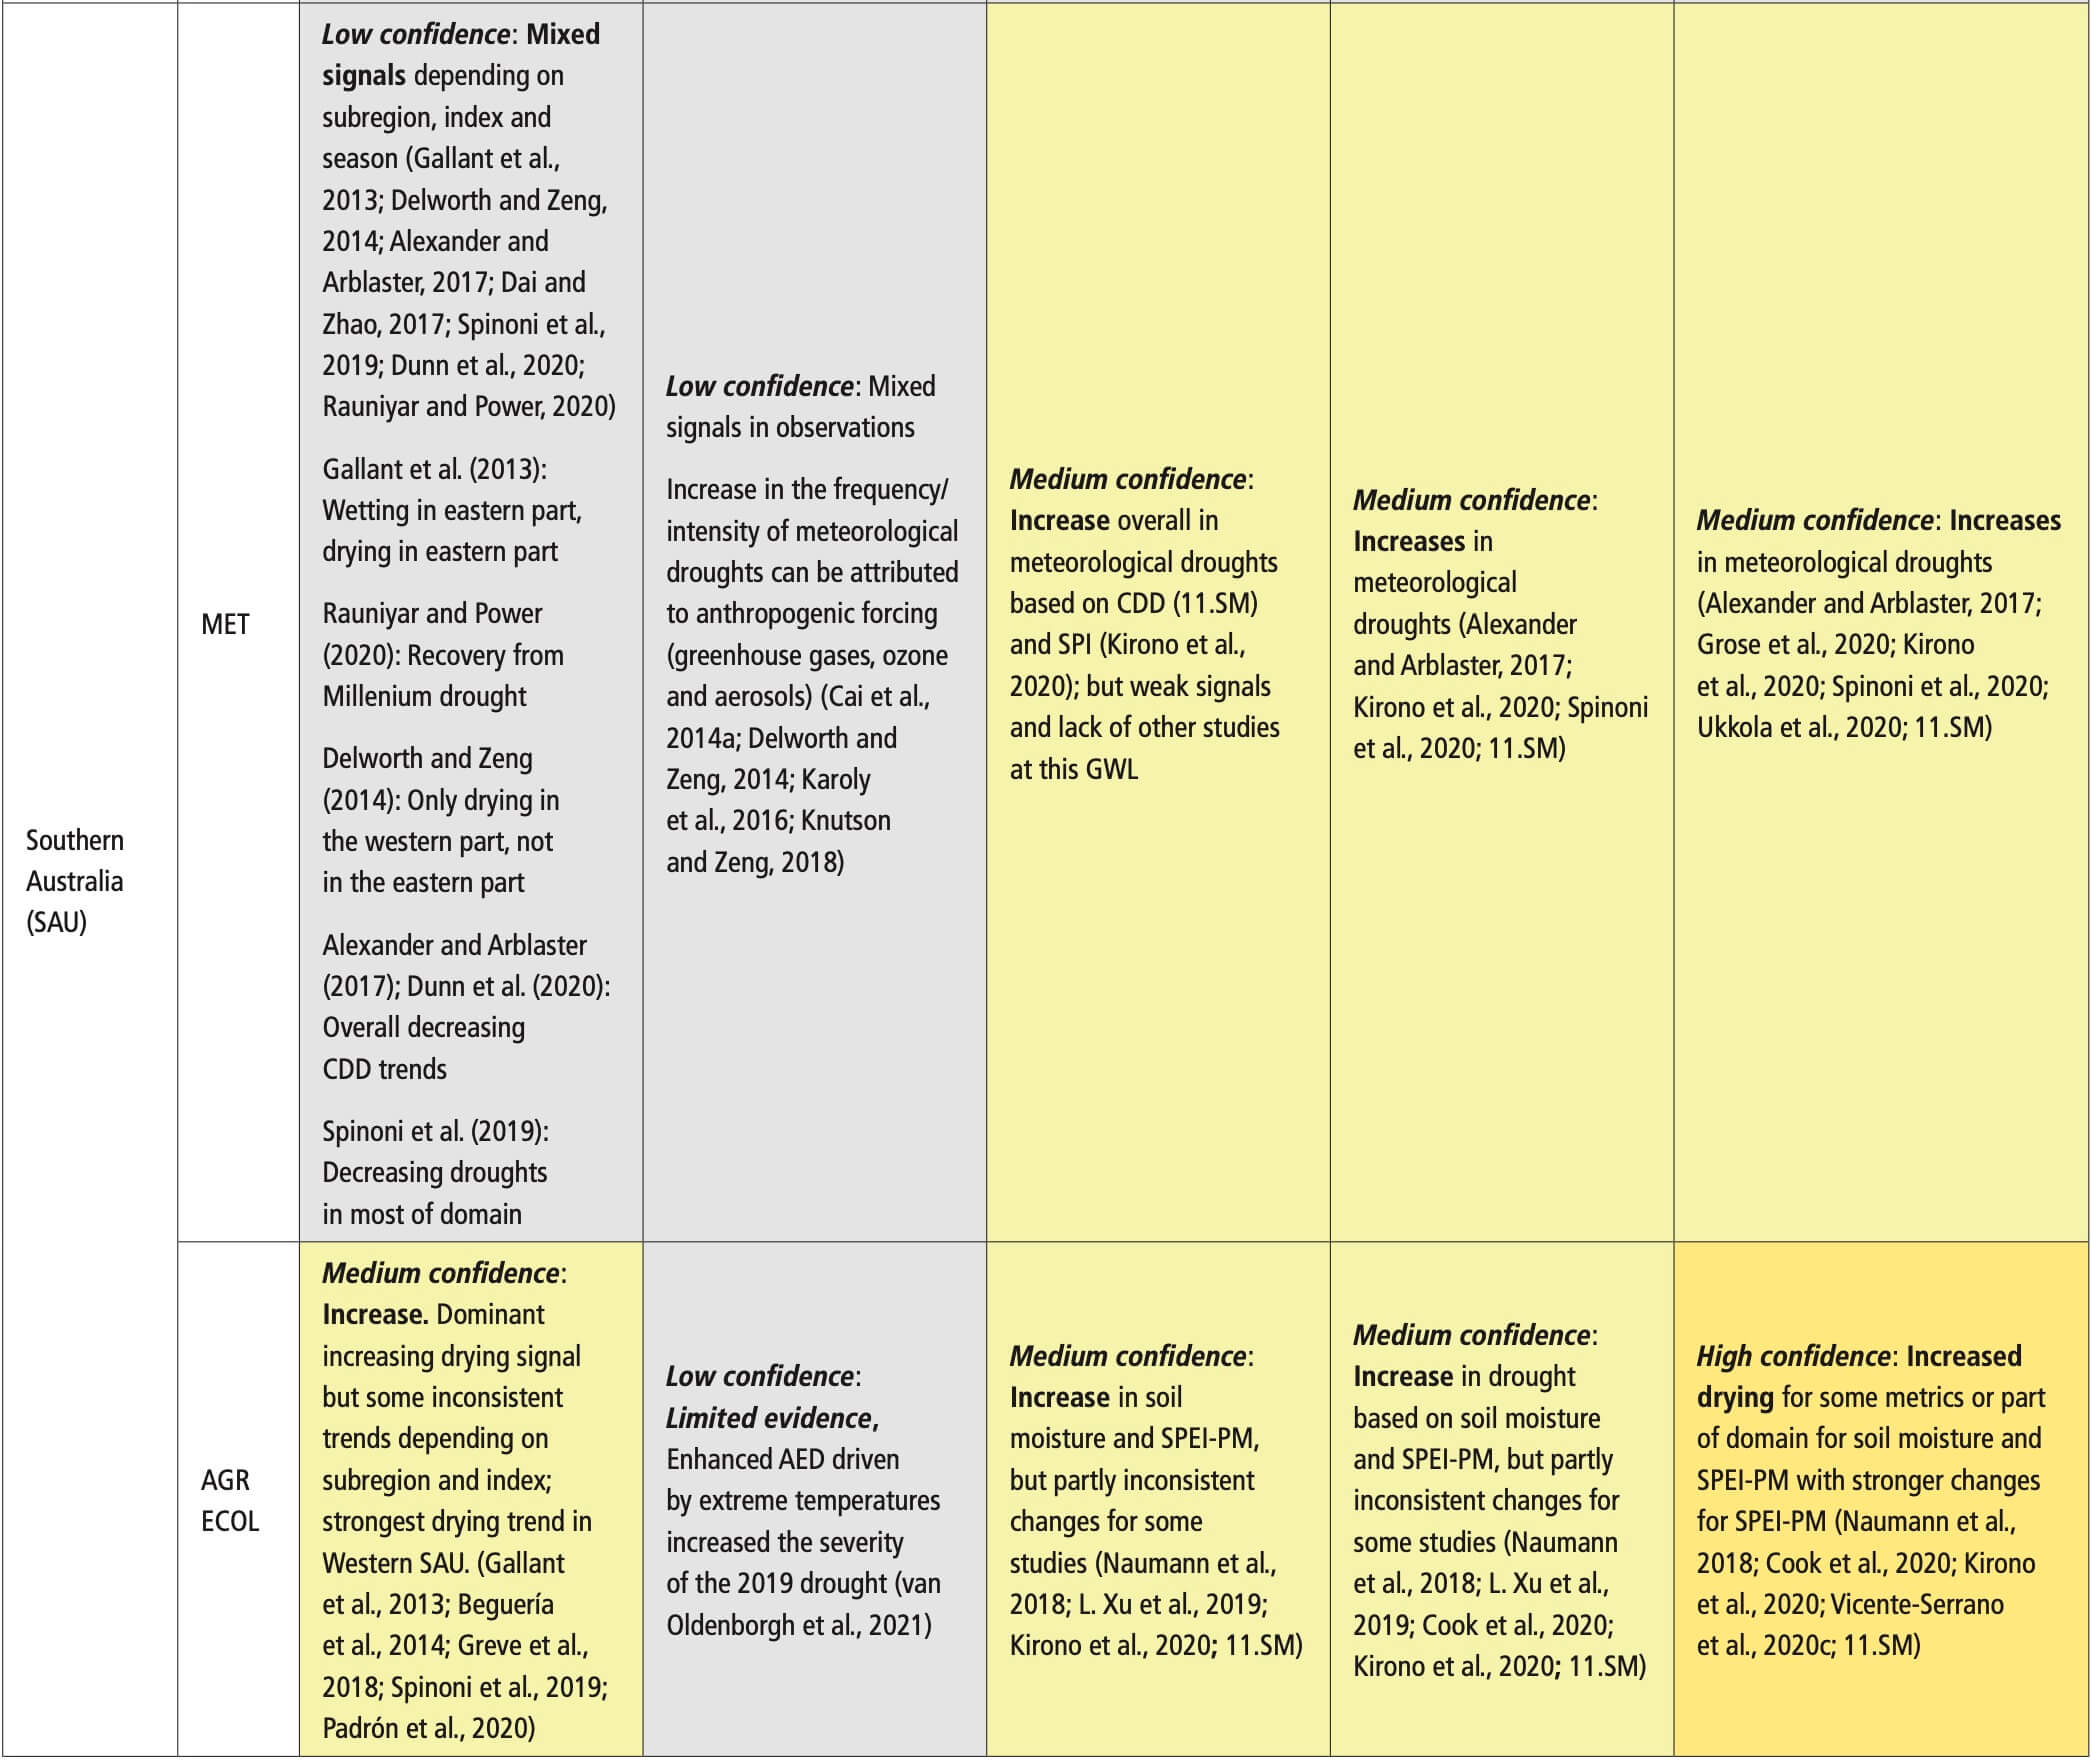
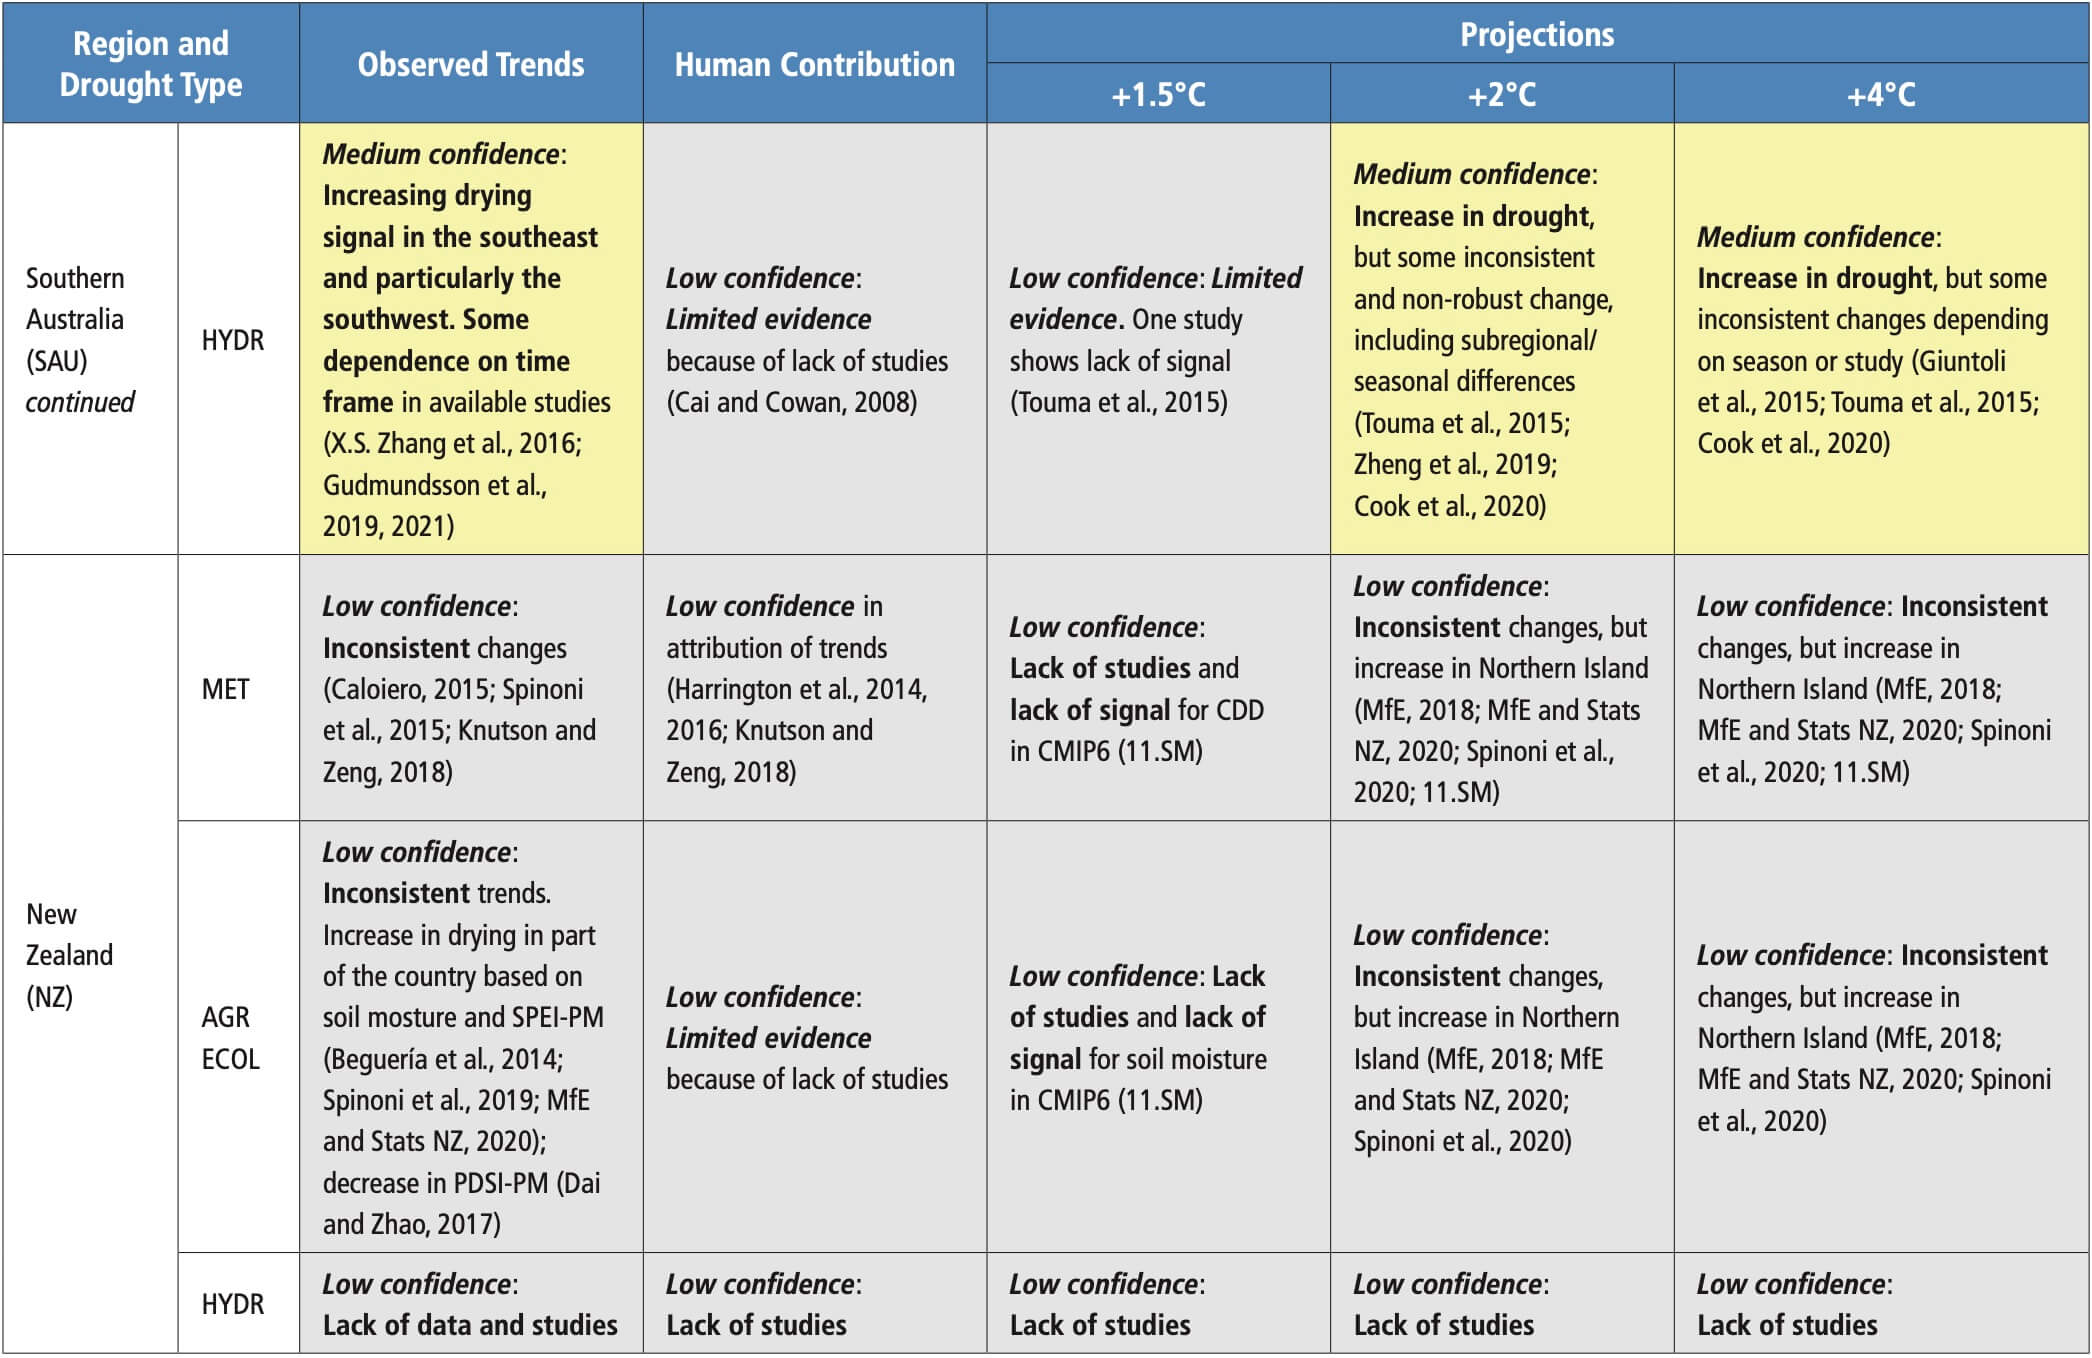 Table 11.13 | Observed trends, human contribution to observed trends, and projected changes at 1.5°C, 2°C and 4°C of global warming for temperature extremes in Central and South America, subdivided by AR6 regions. See Sections 11.9.1 and 11.9.2 for details.
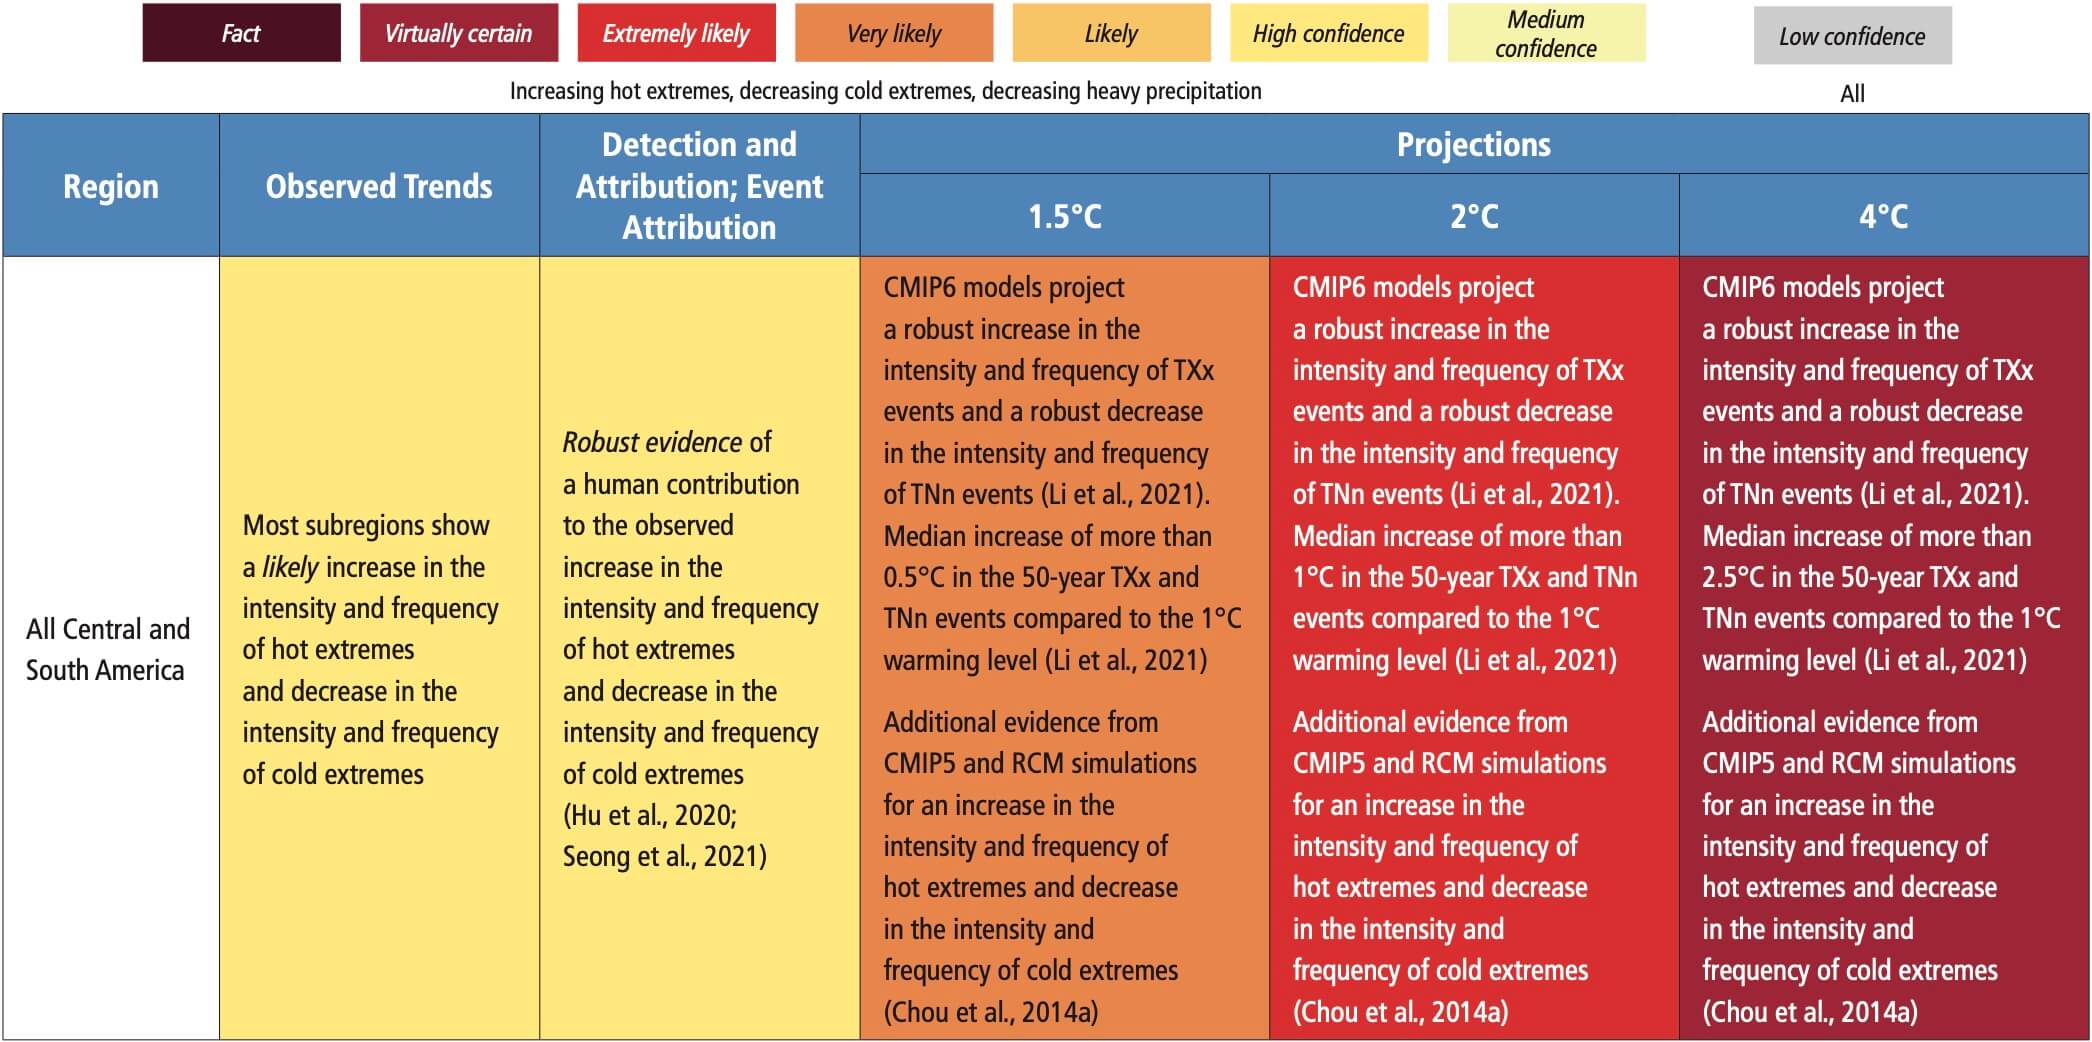
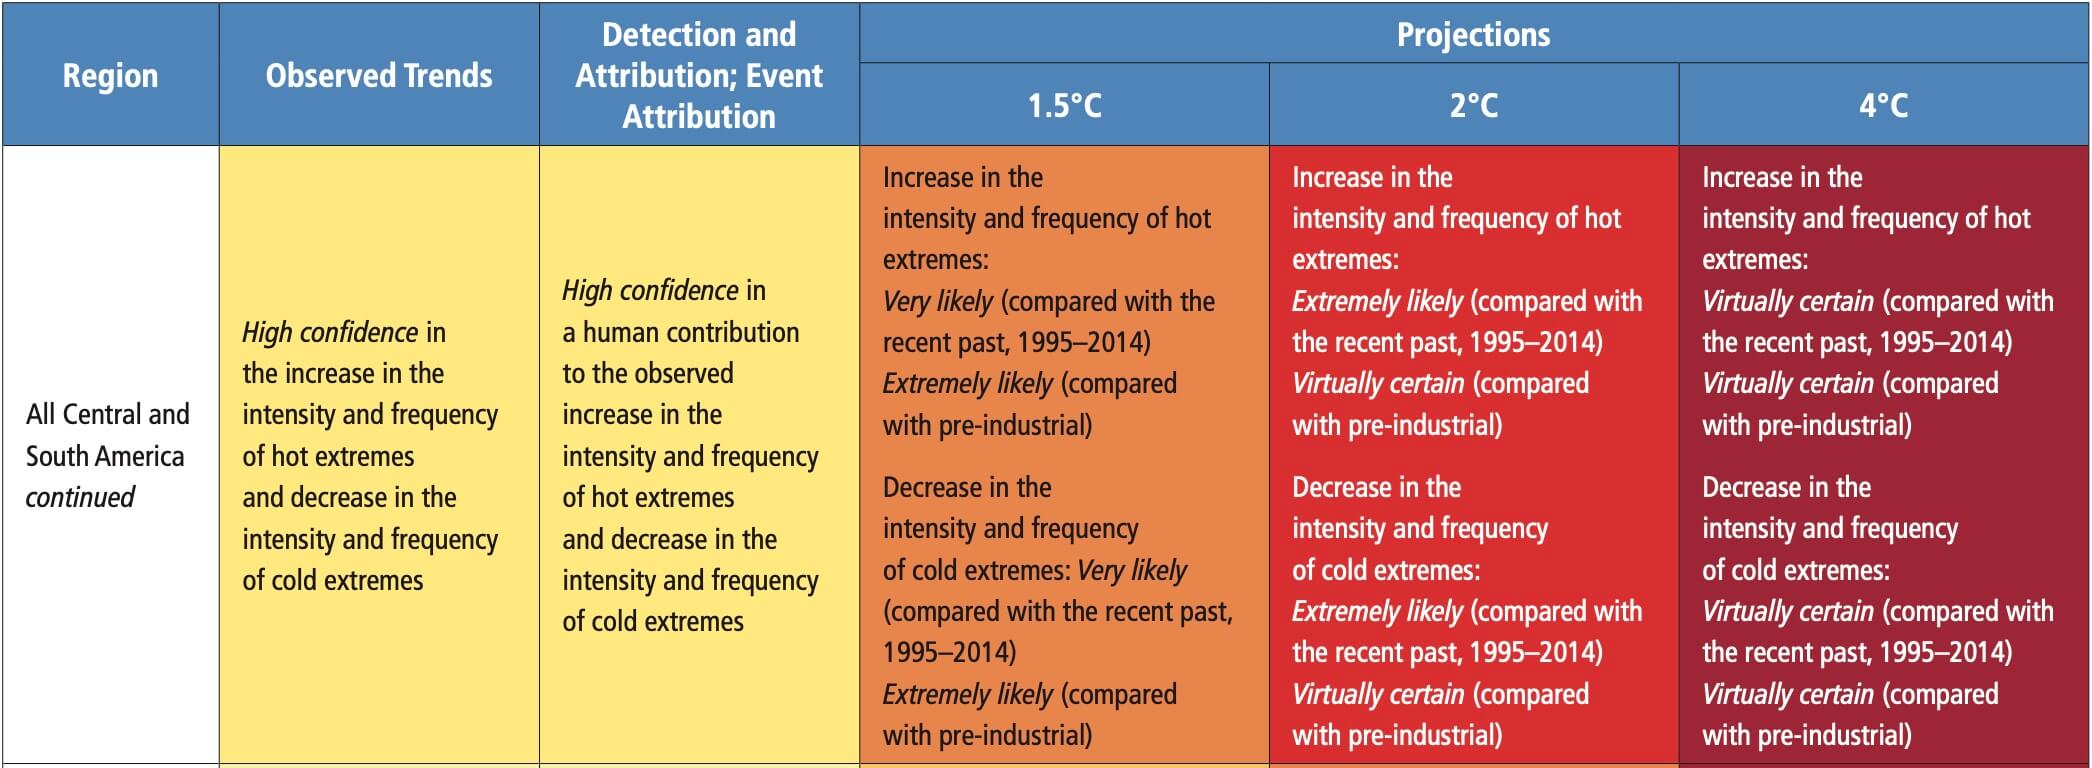
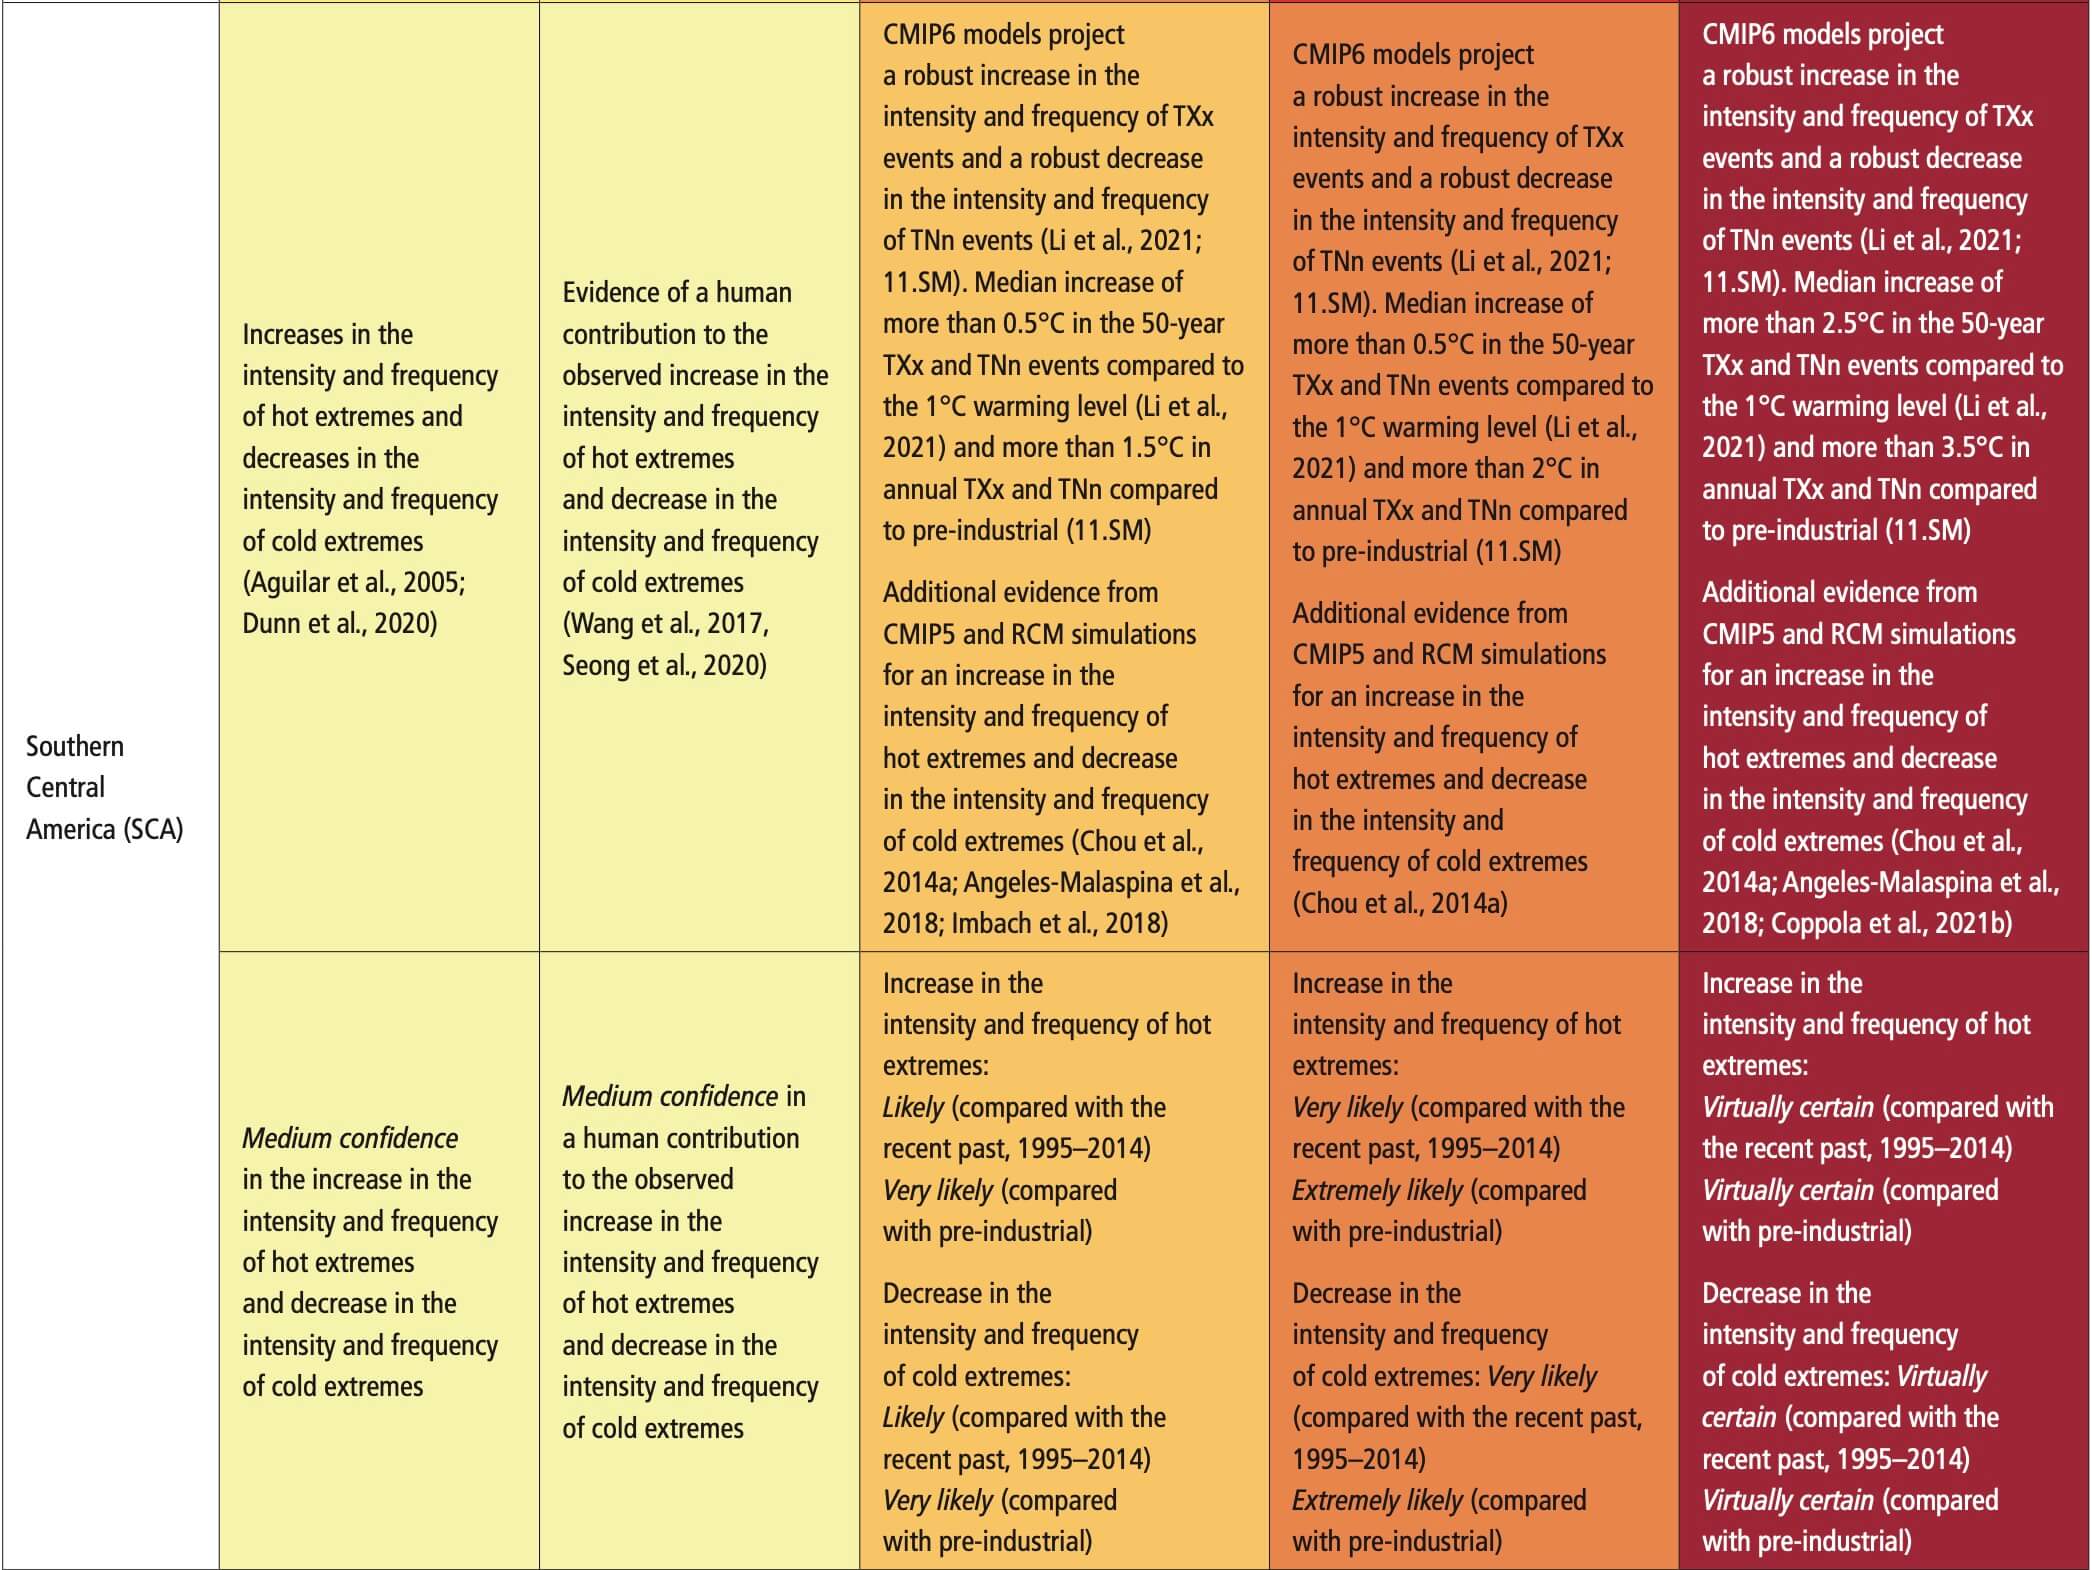
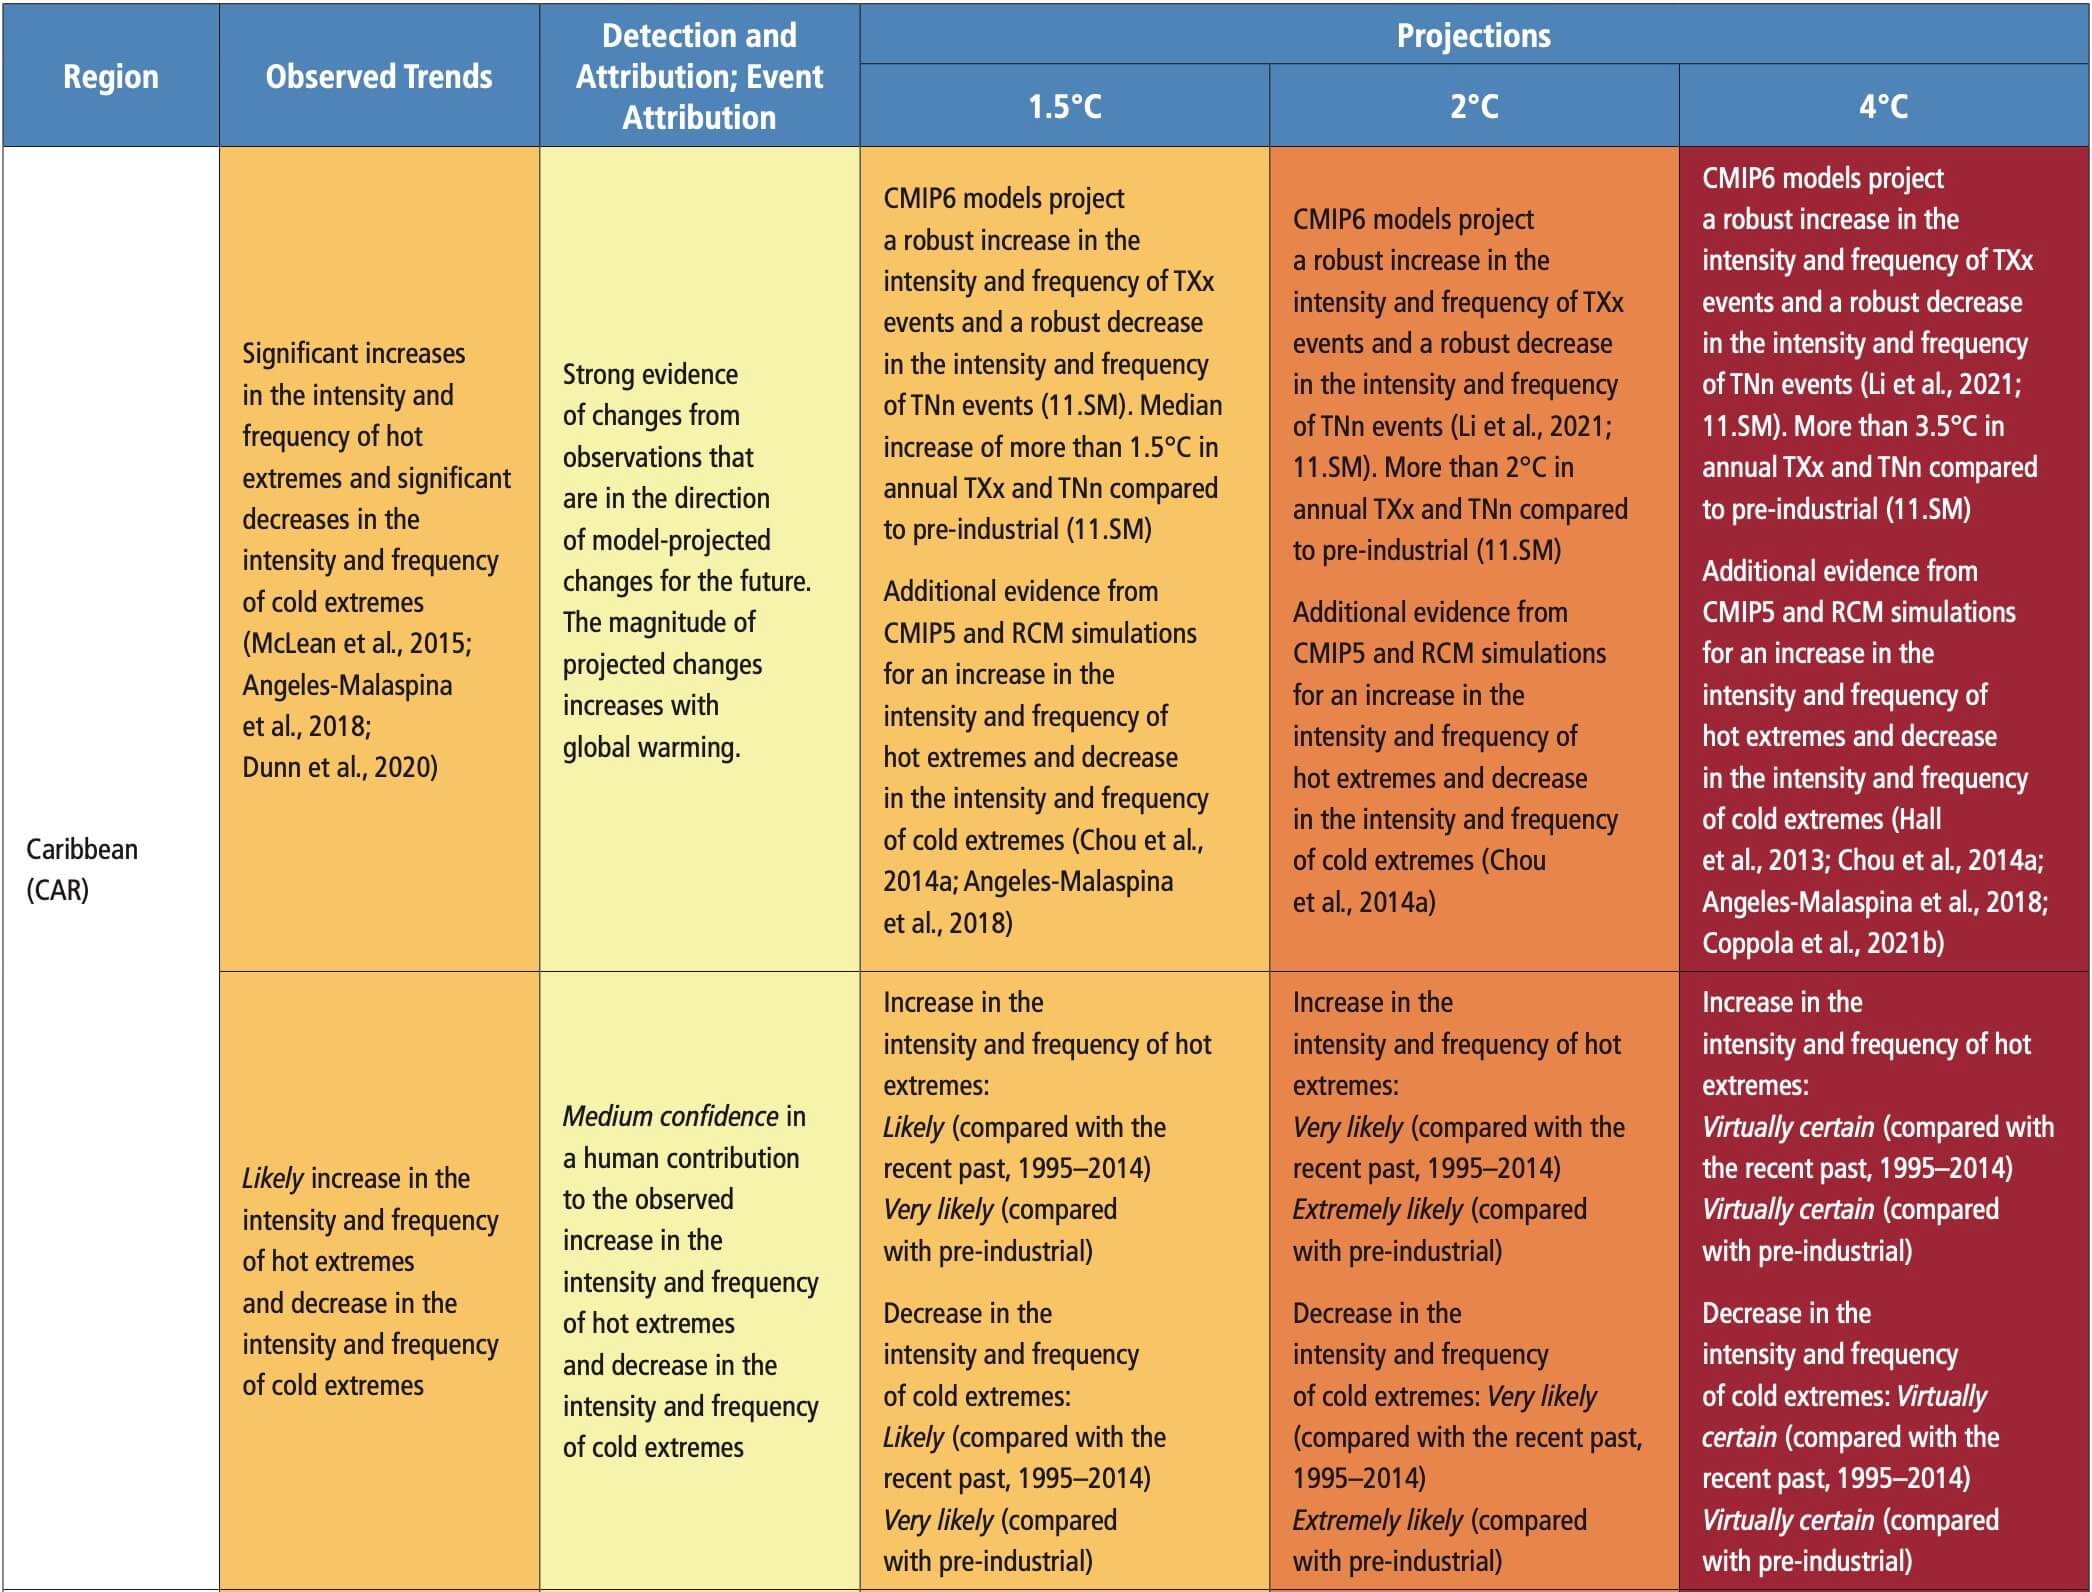
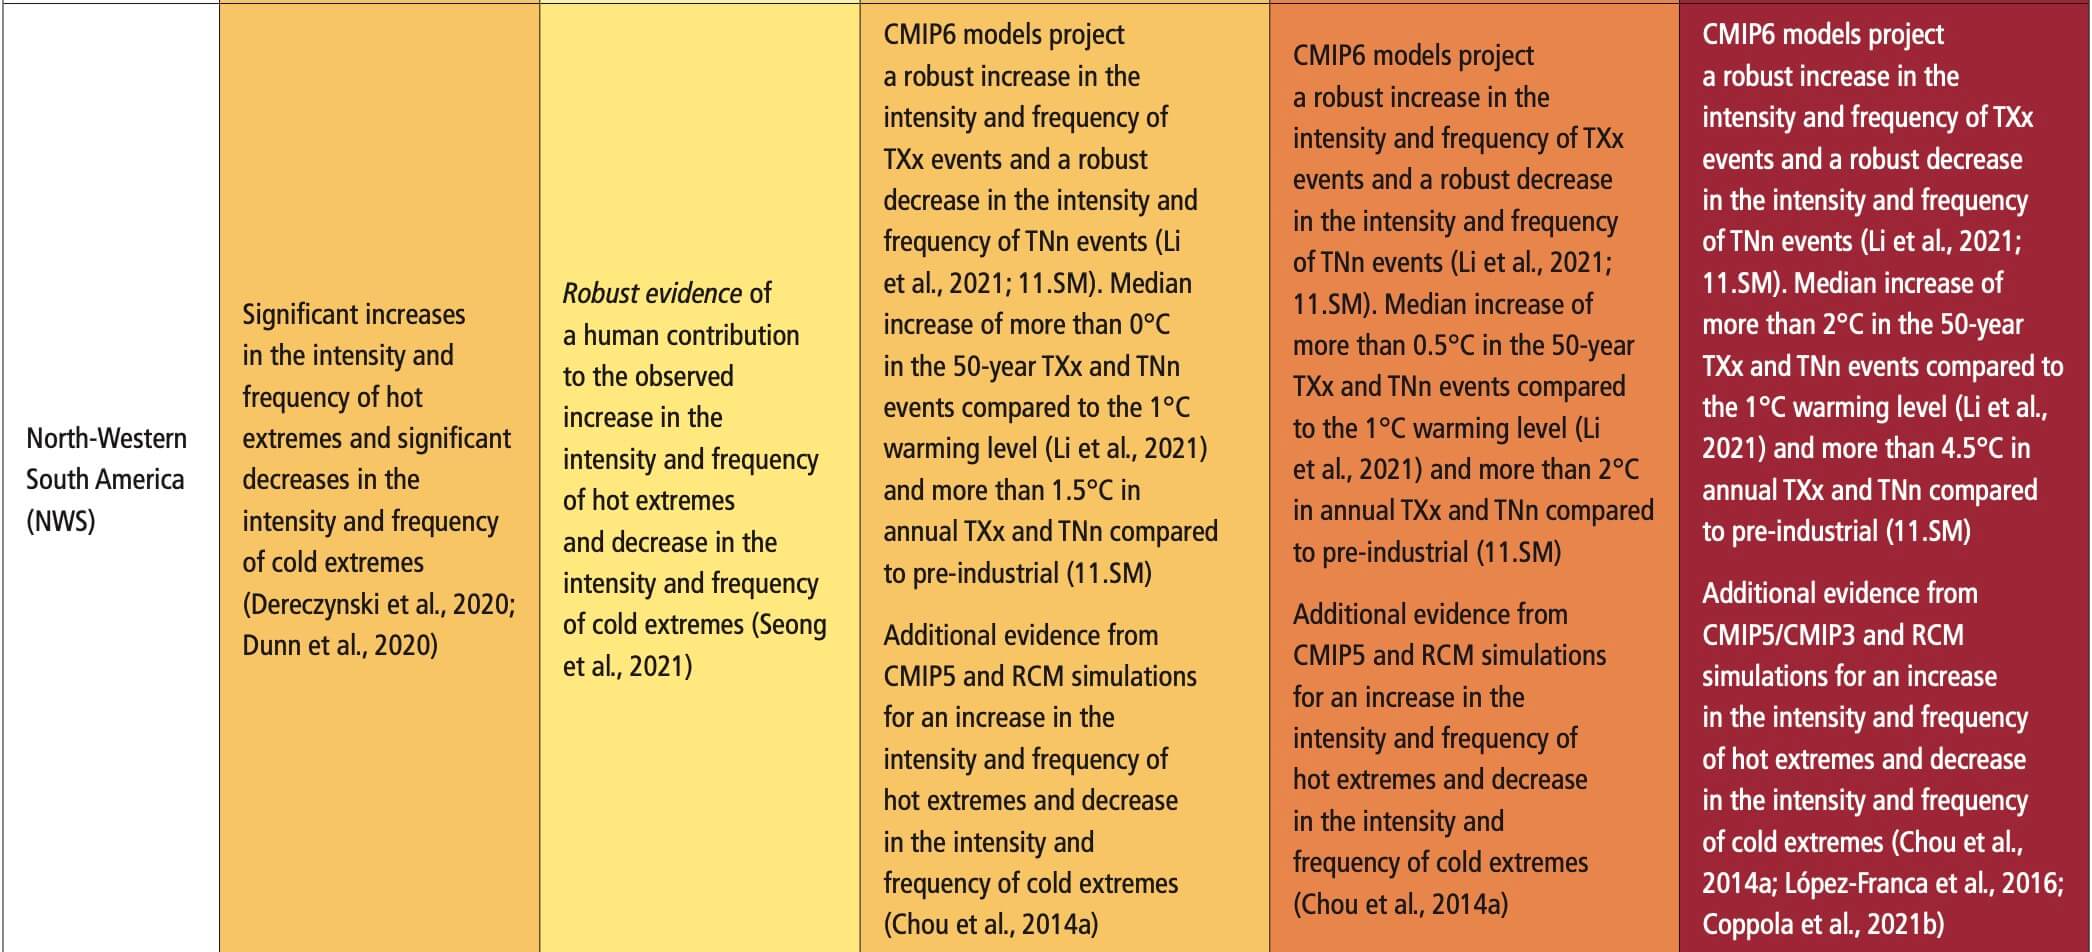
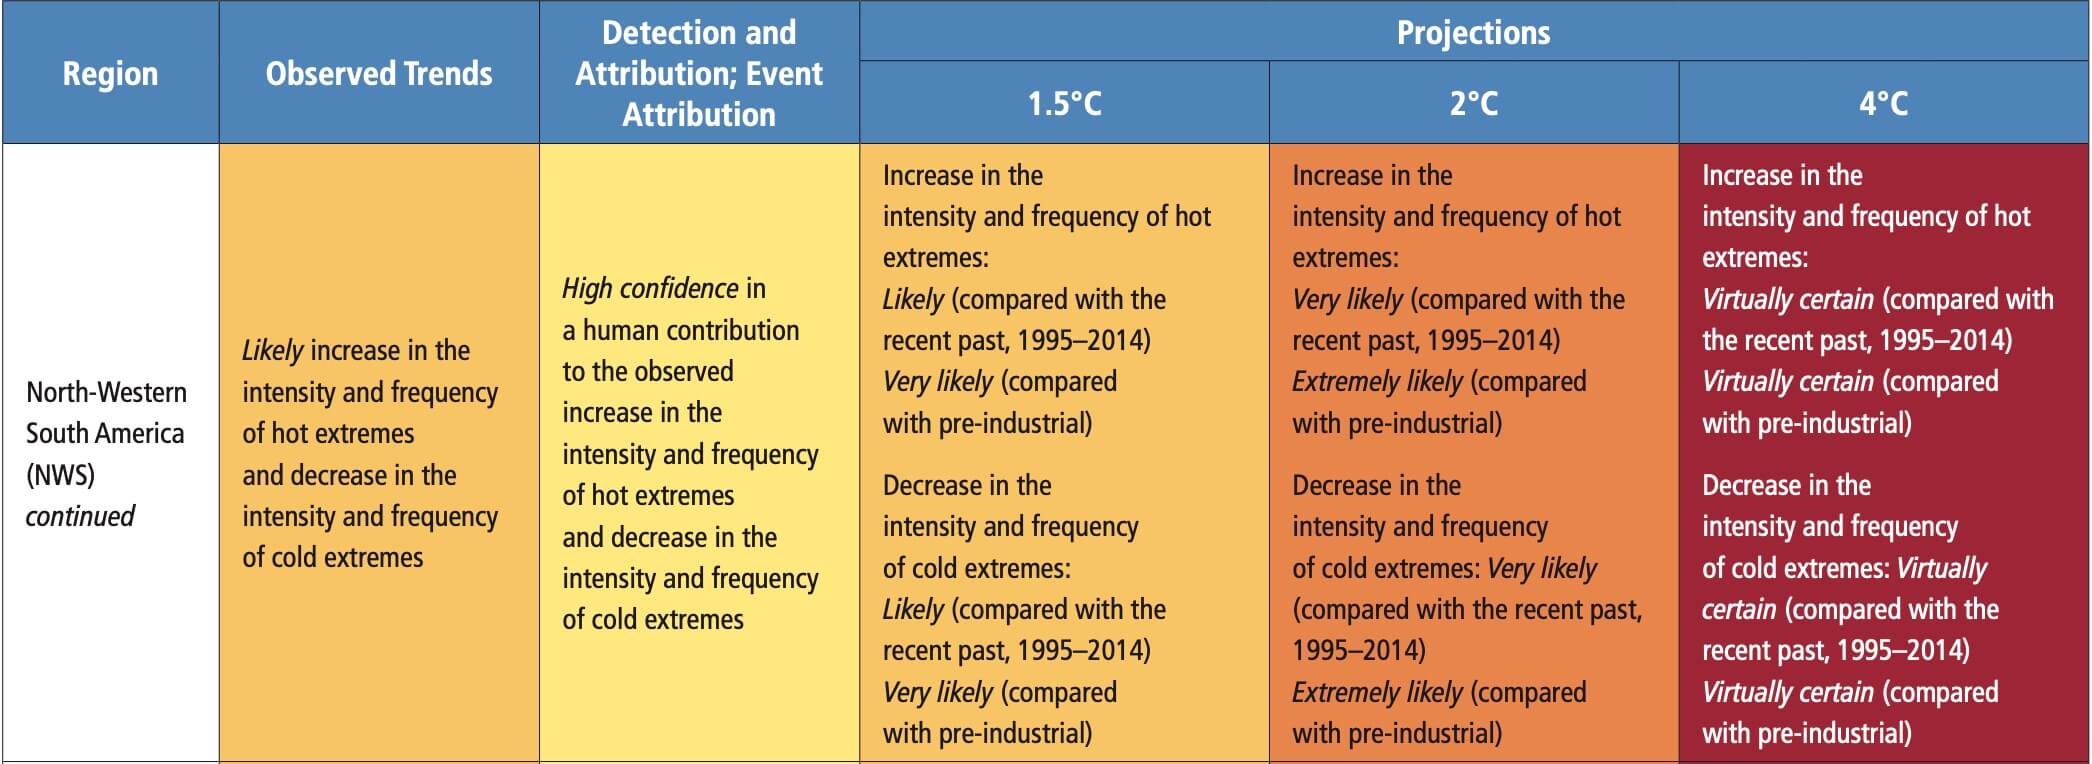
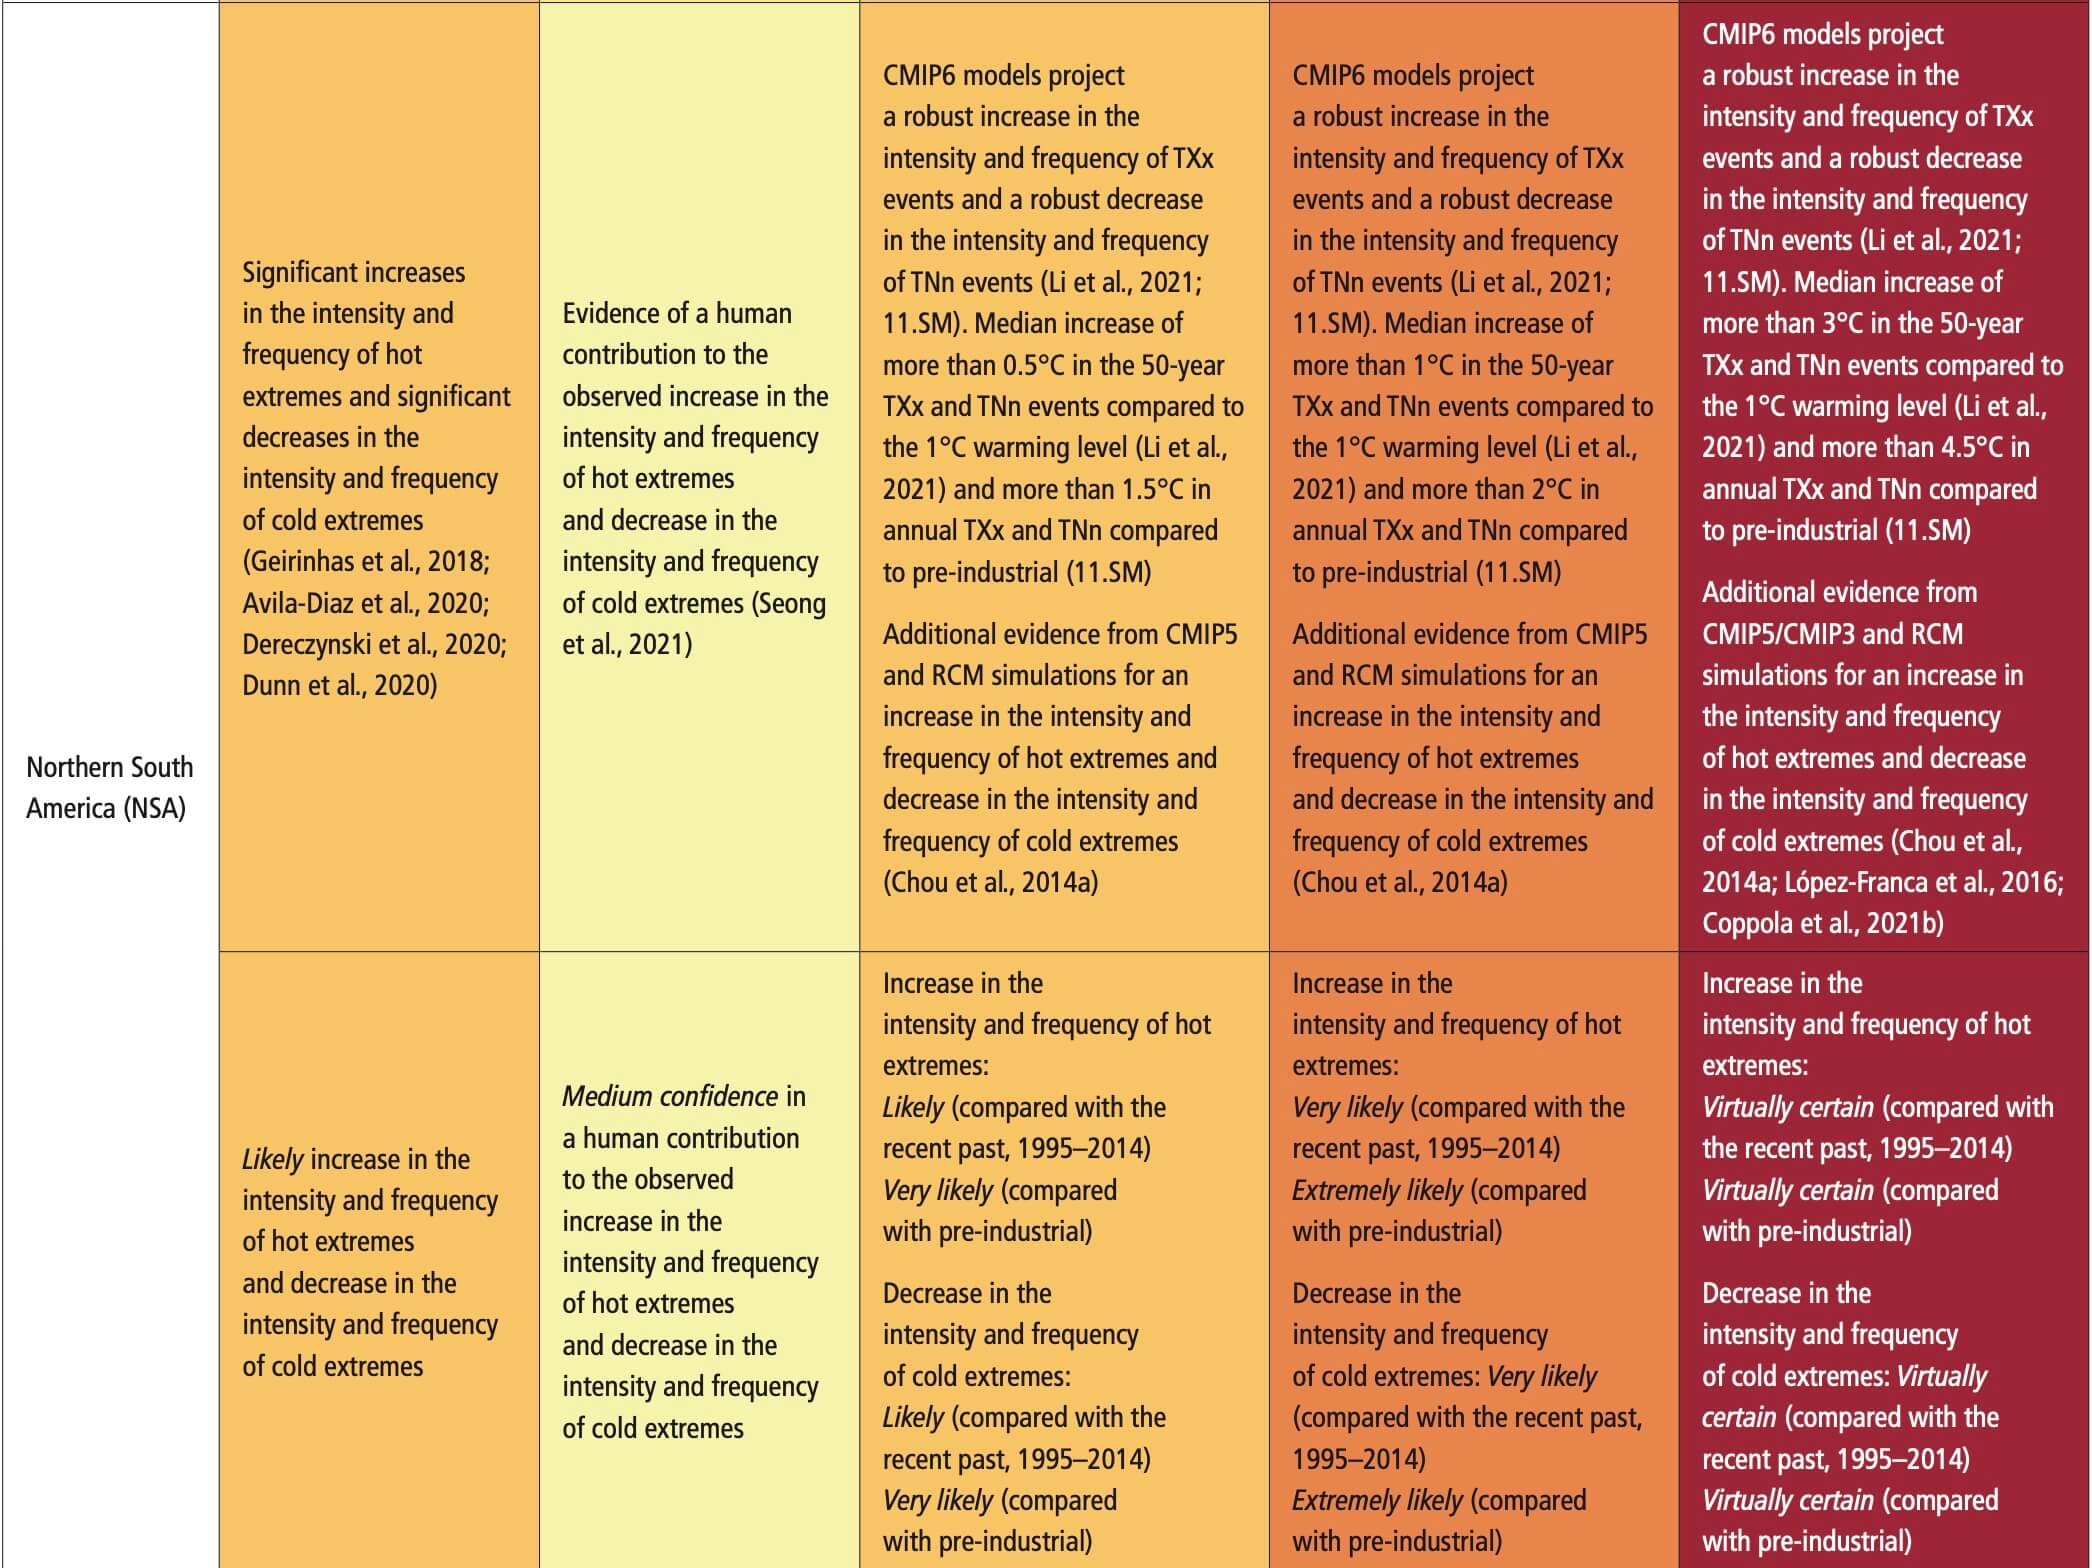
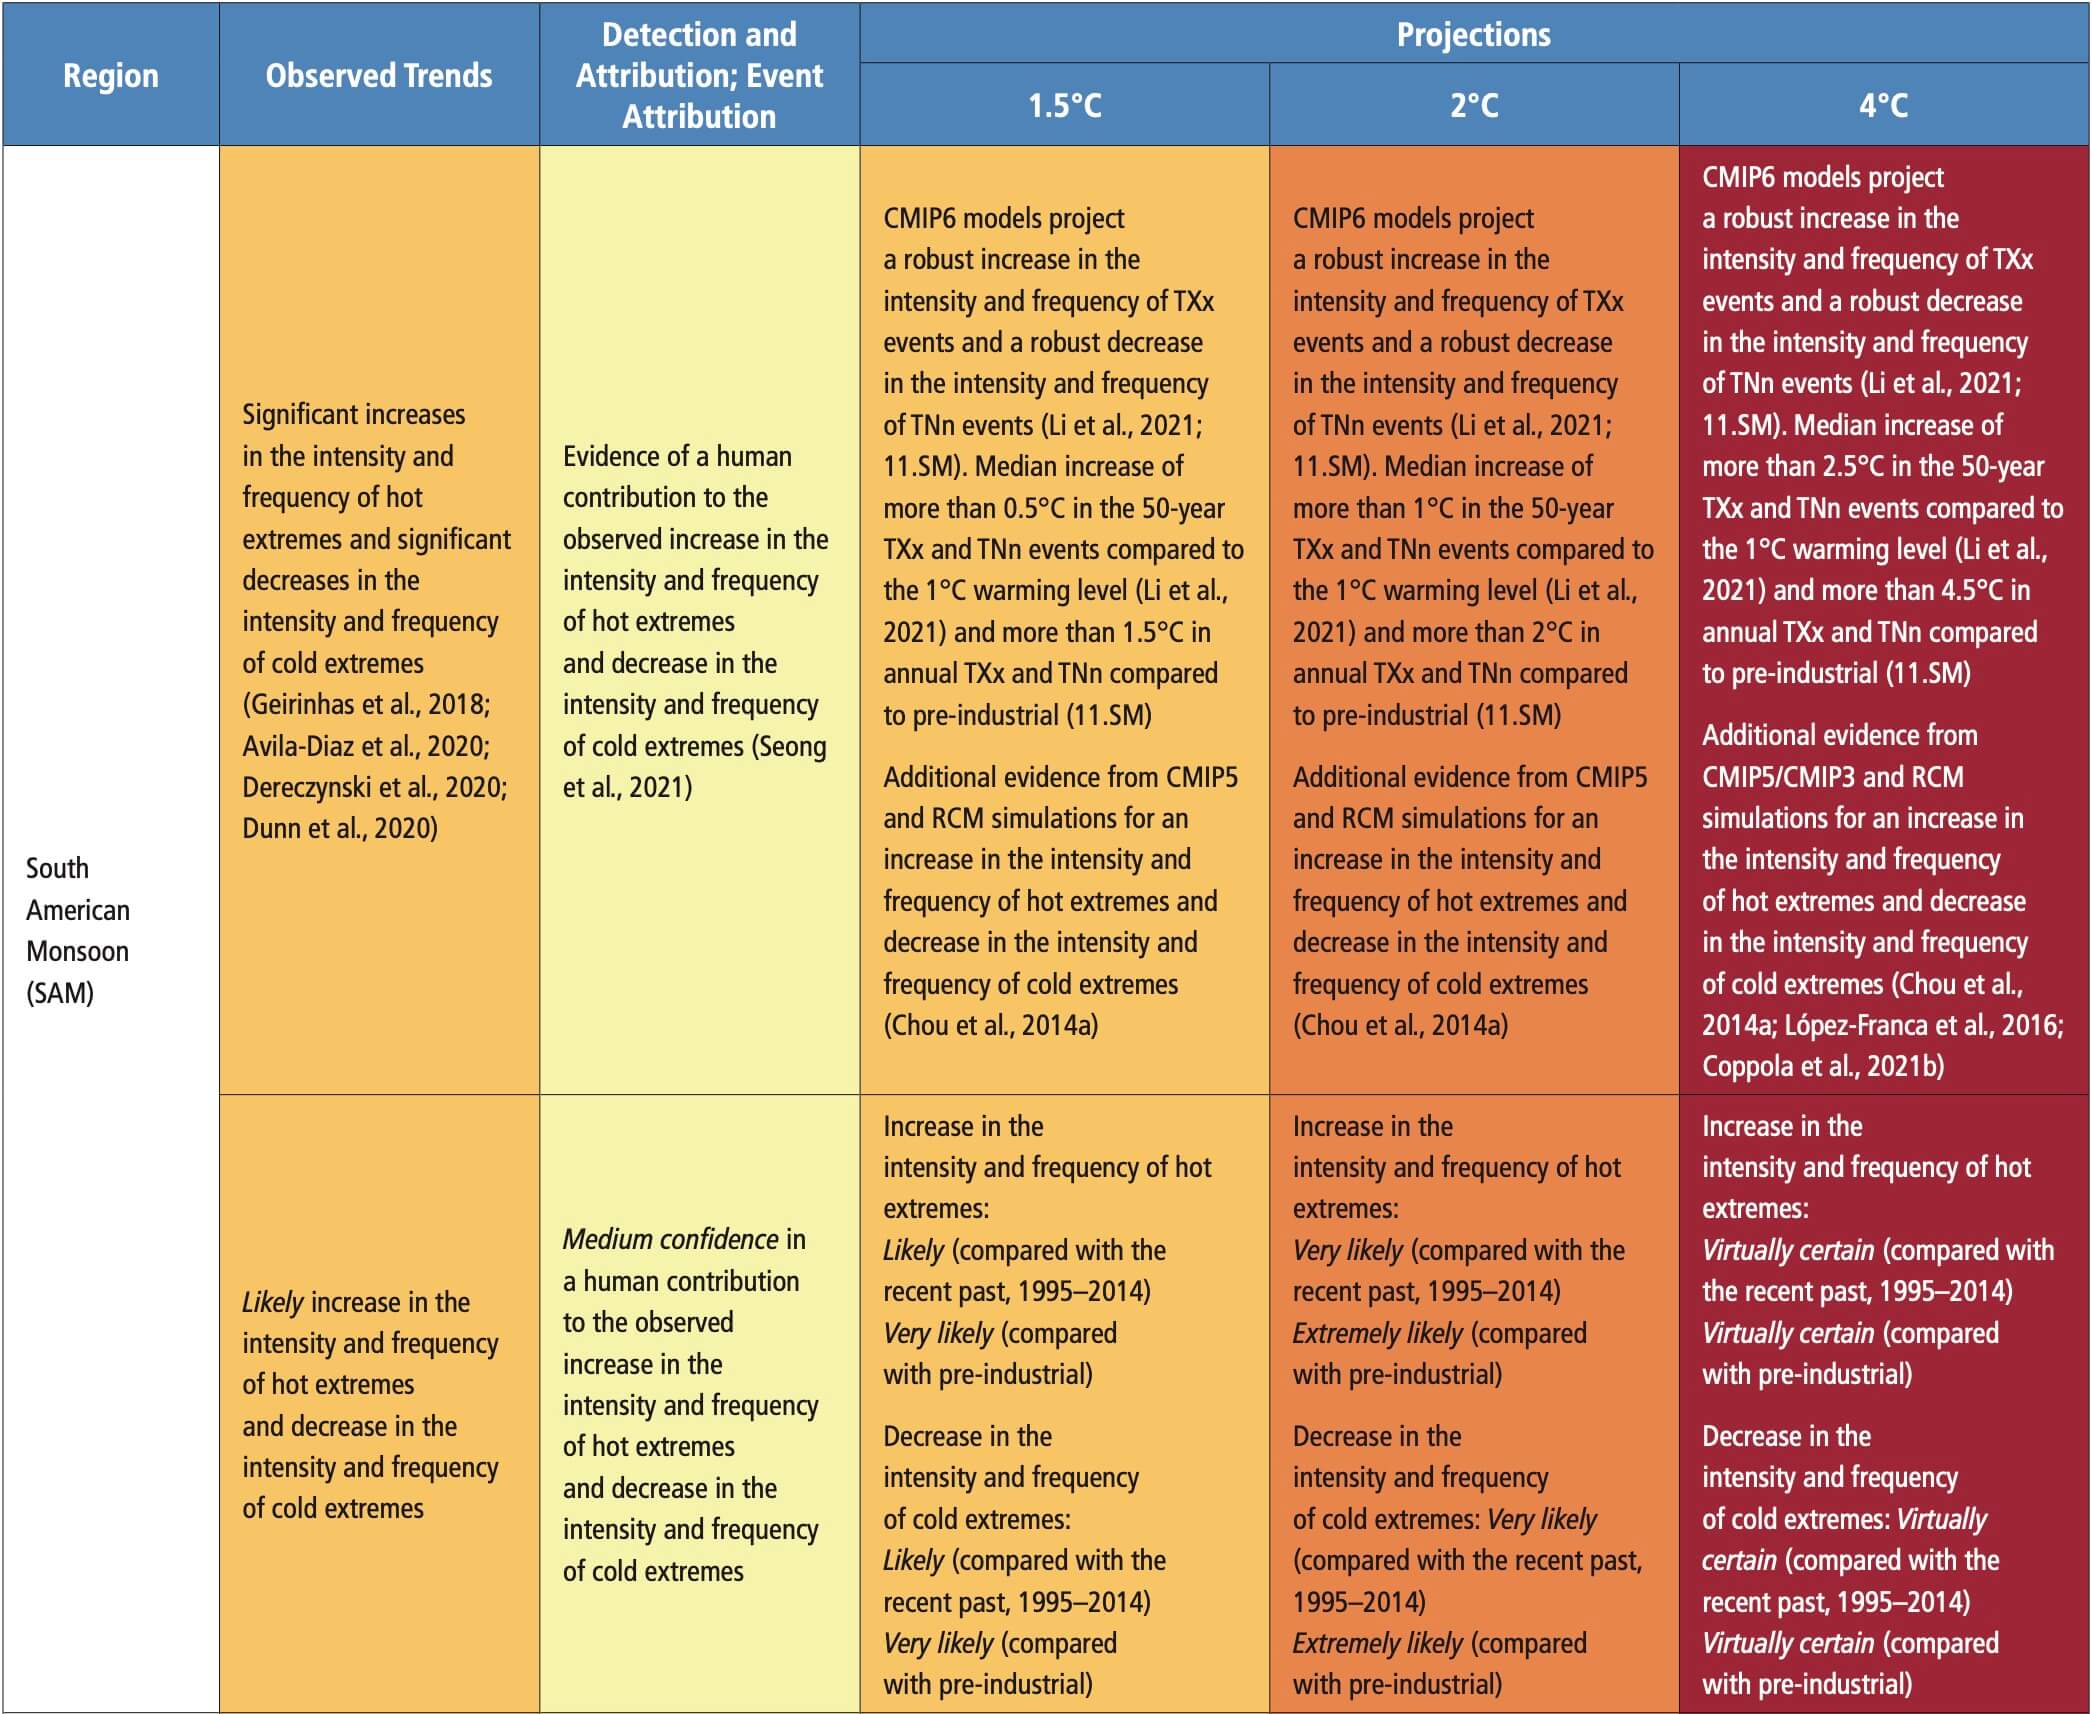
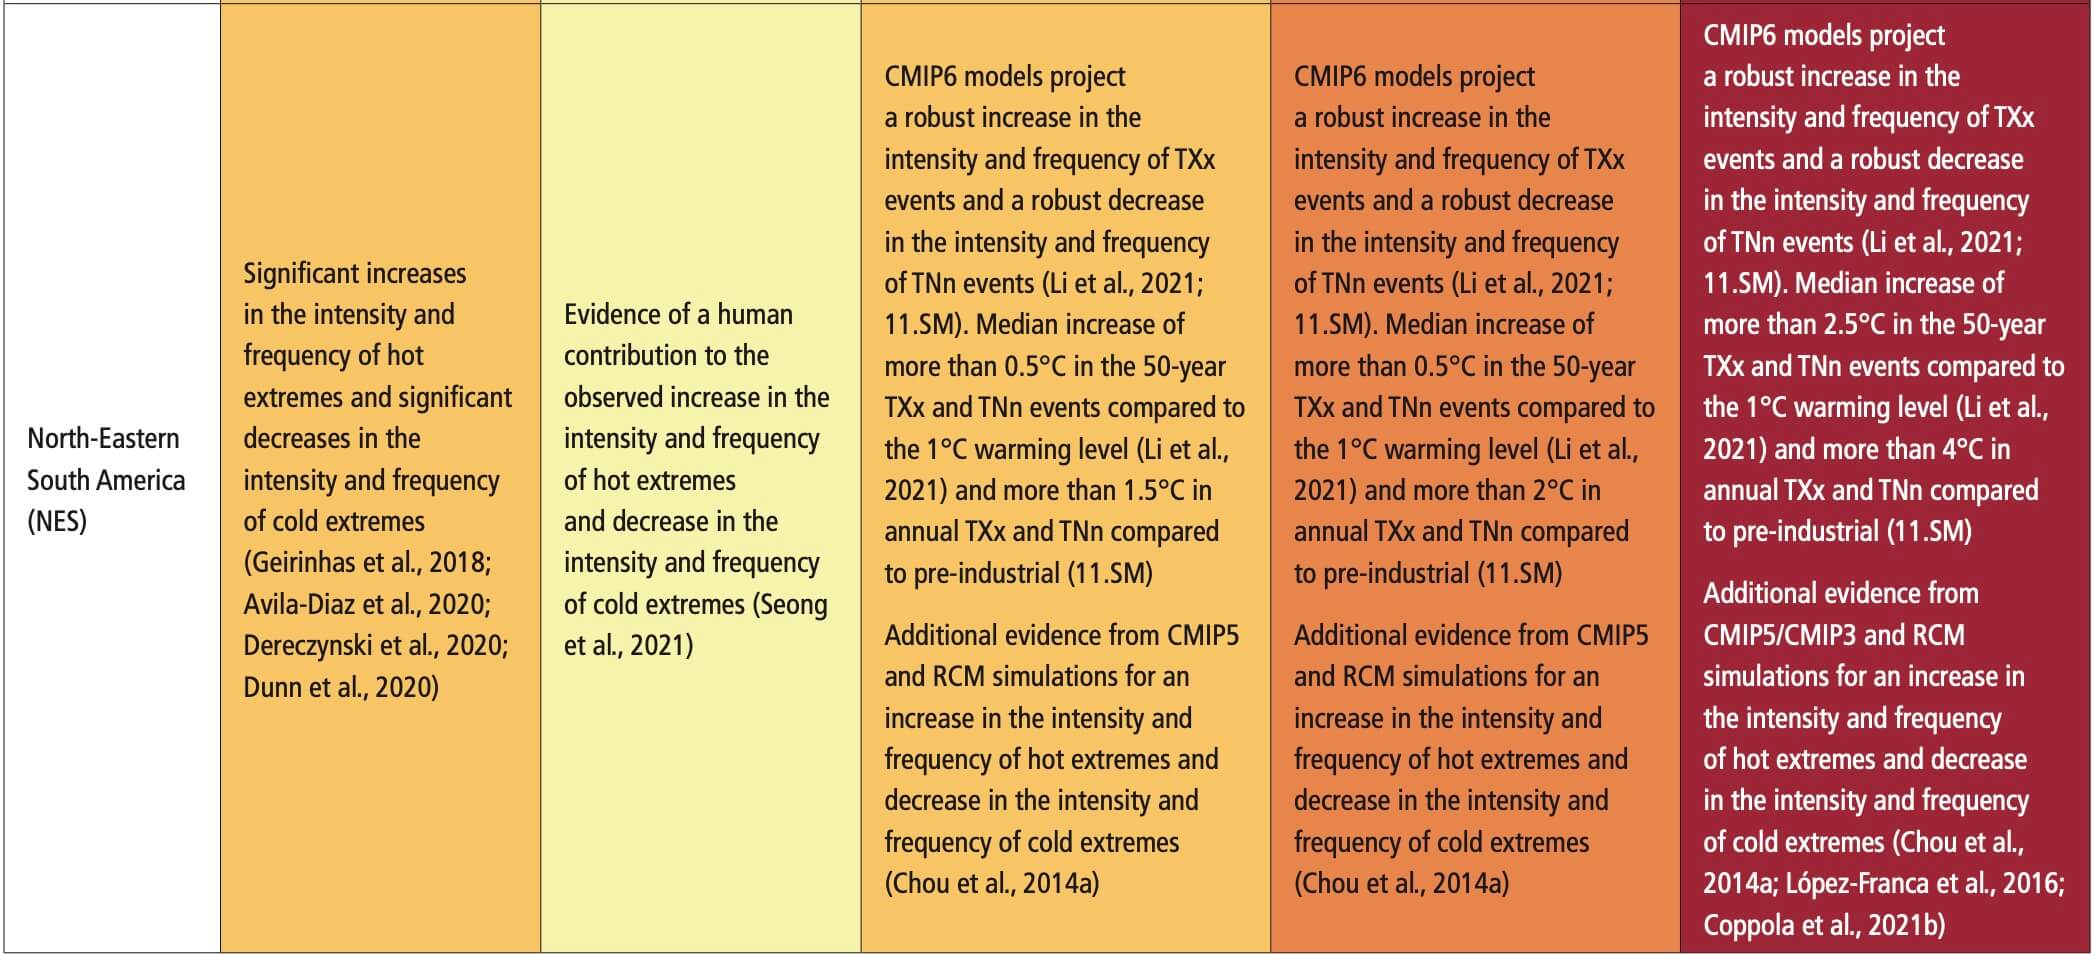
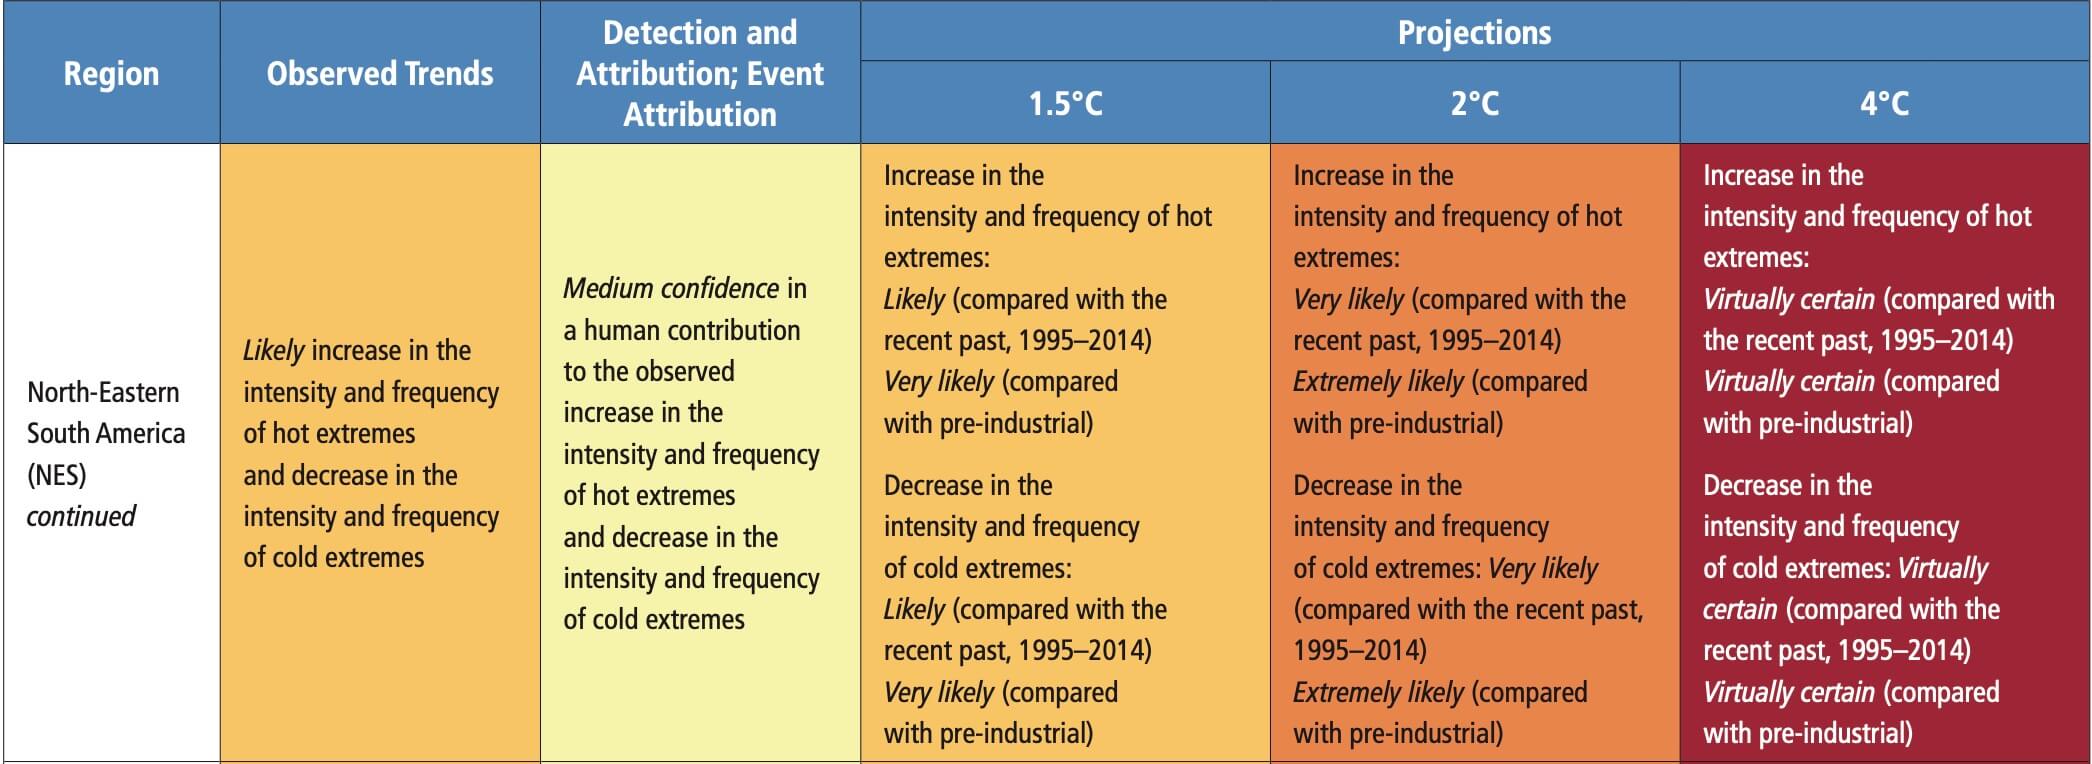
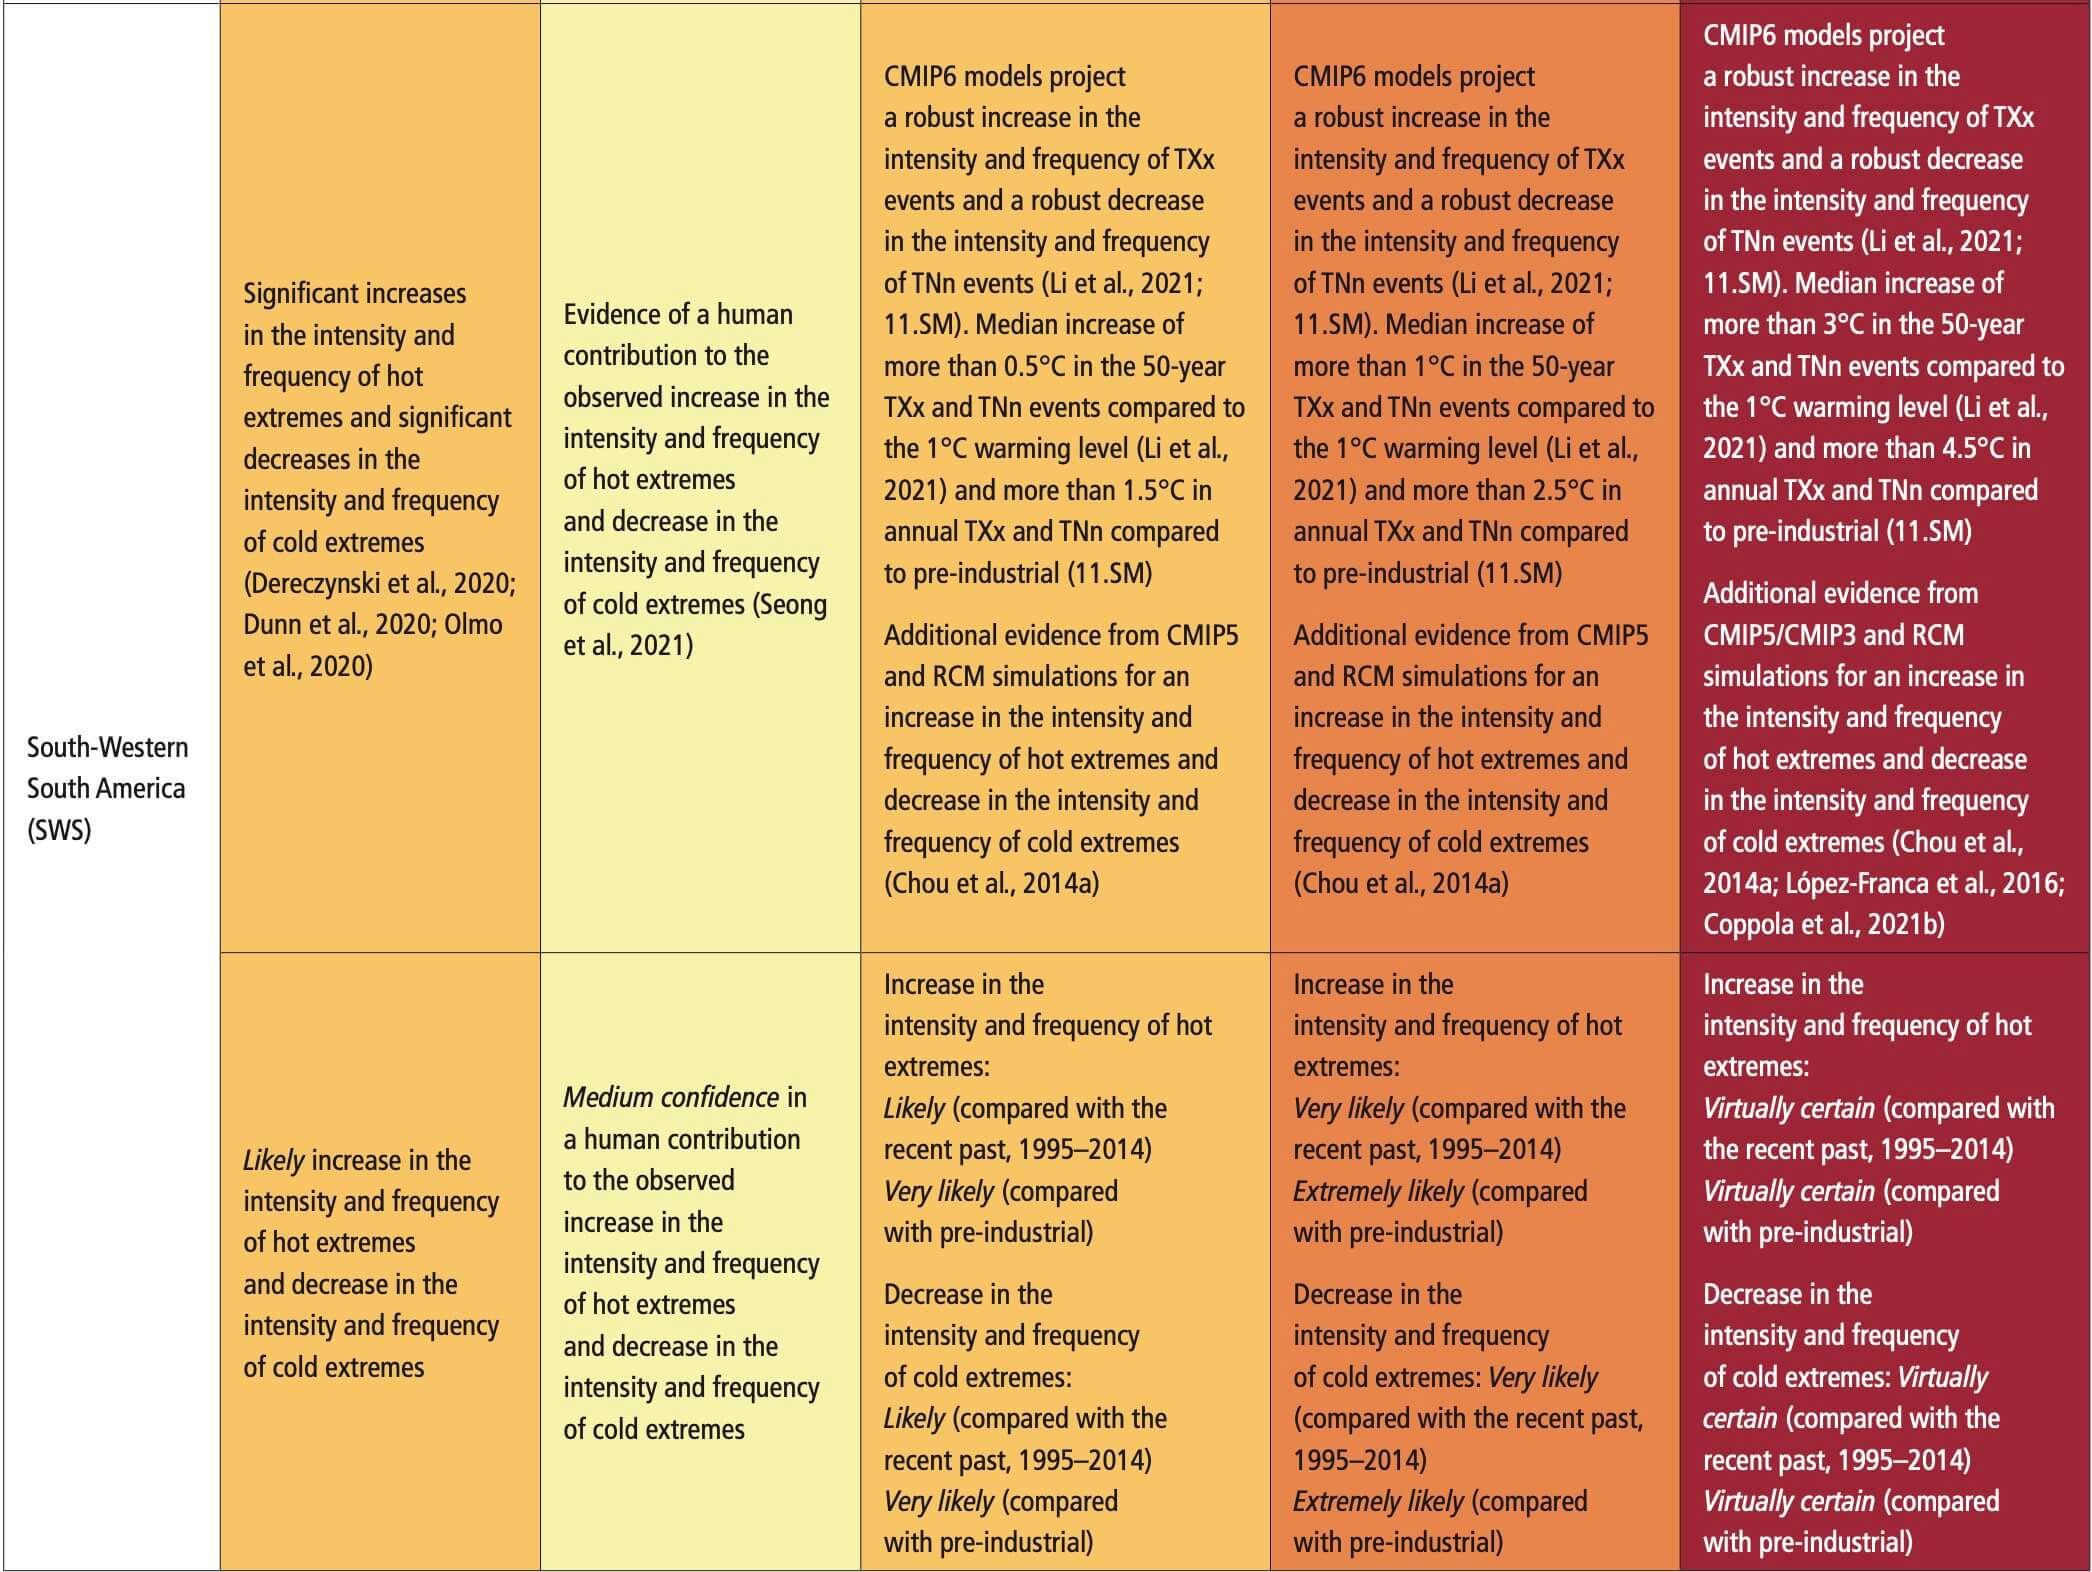
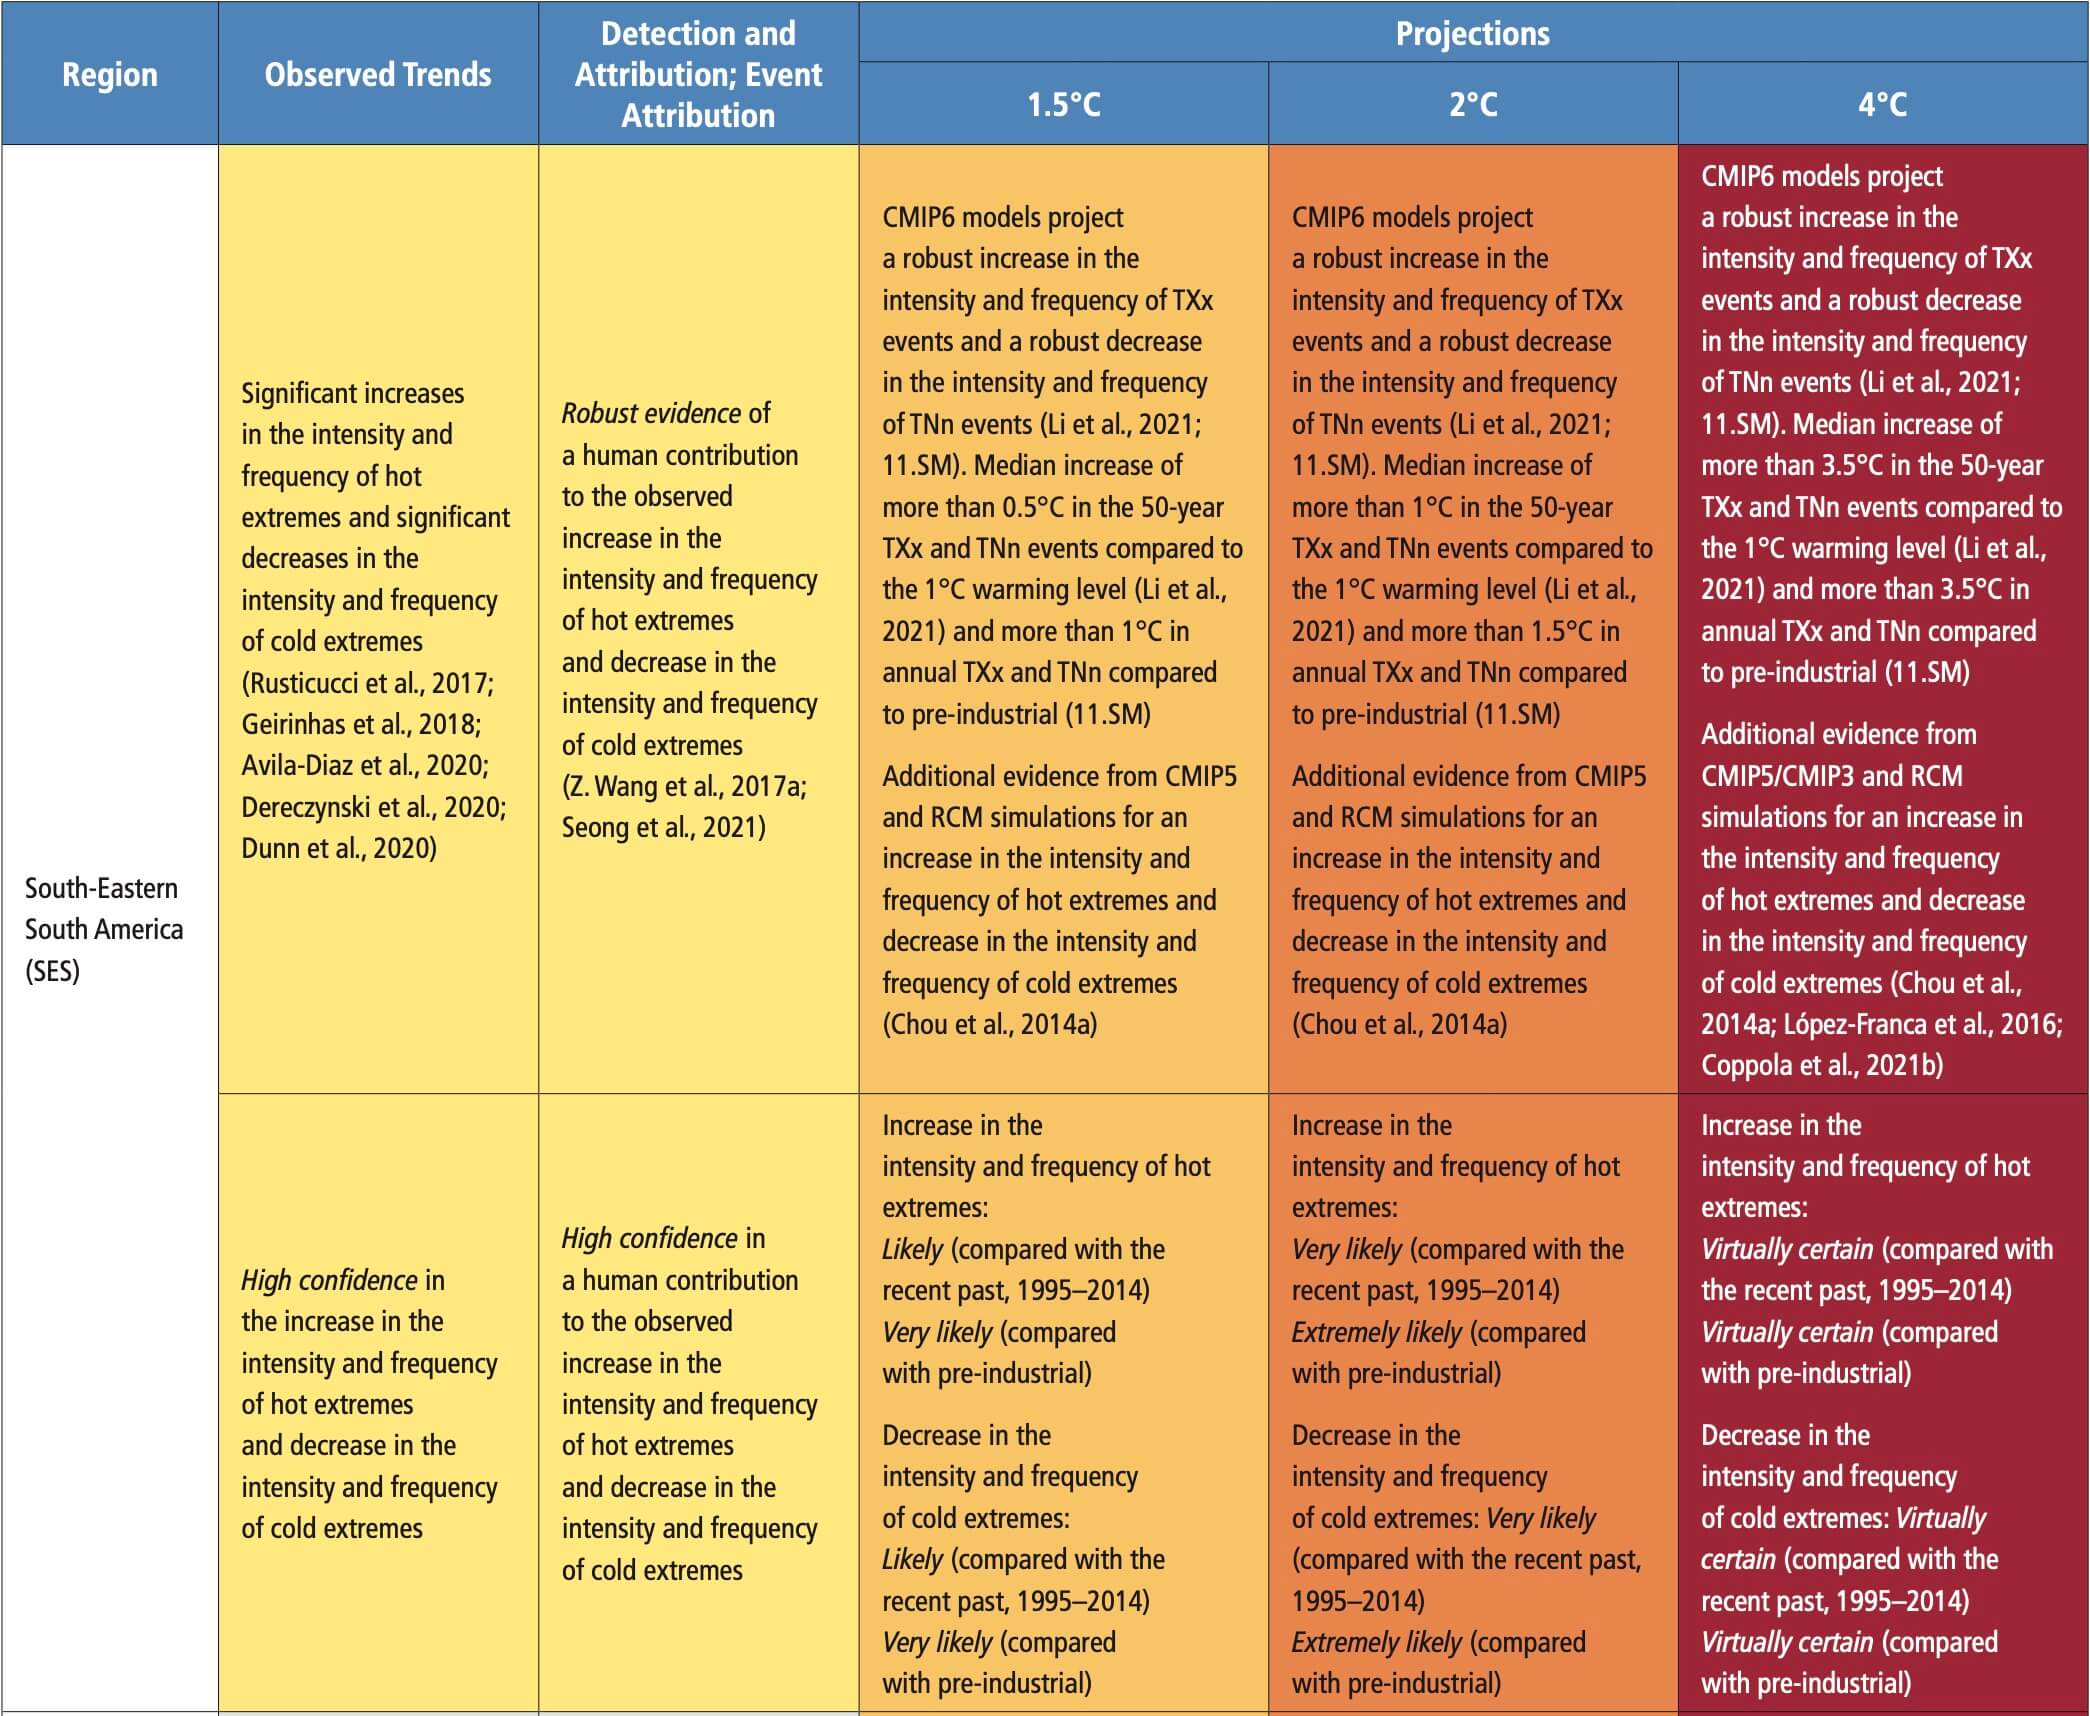
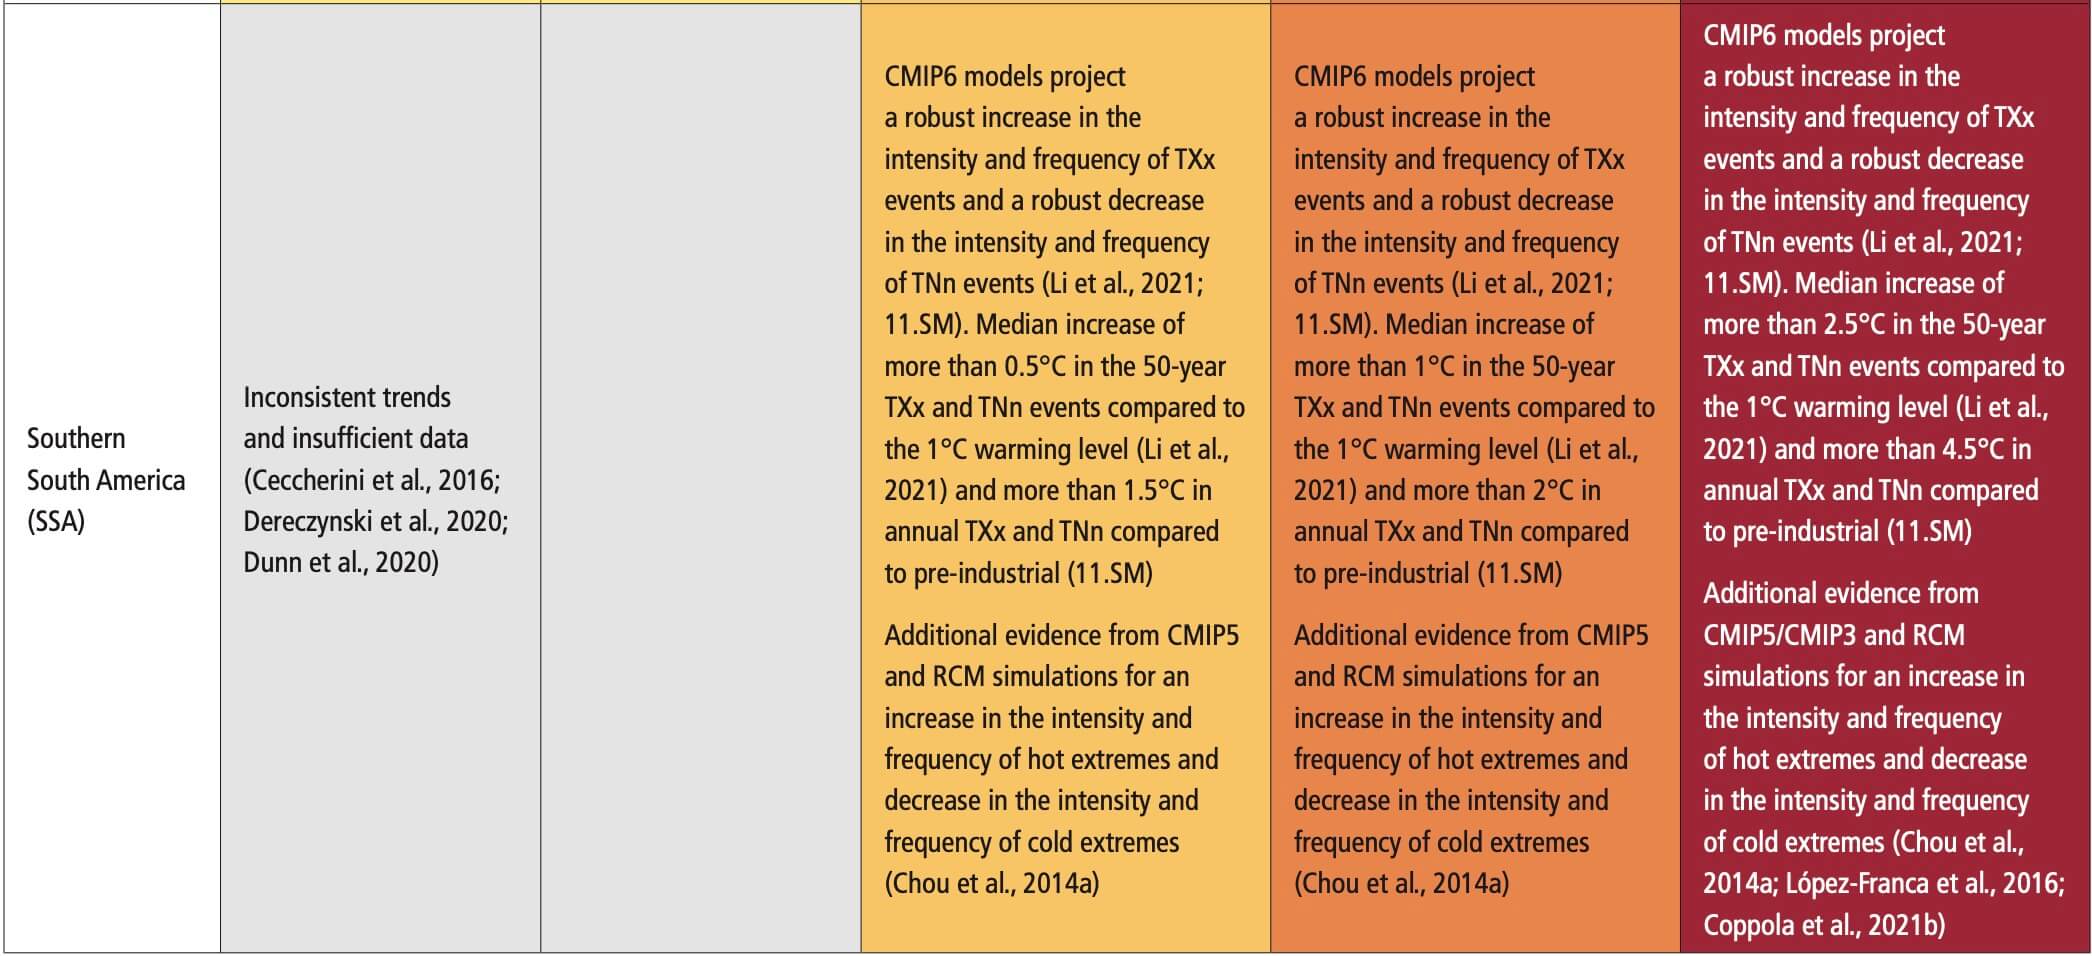
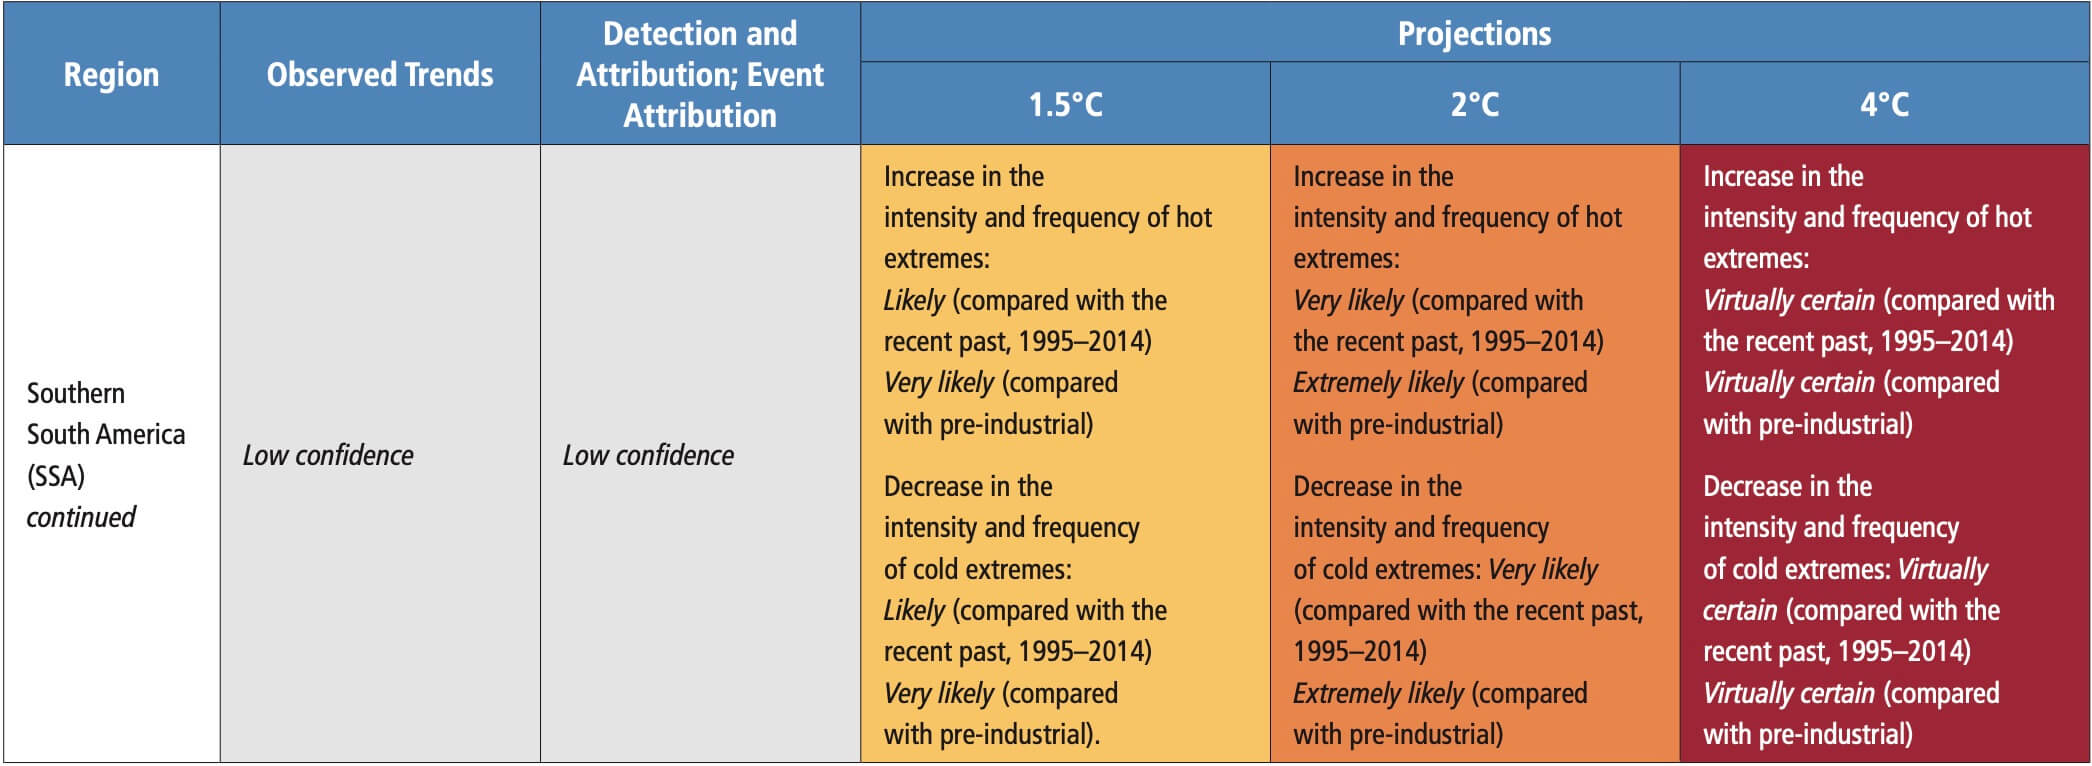 Table 11.14 | Observed trends, human contribution to observedtrends, and projected changes at 1.5°C, 2°C and 4°C of global warming for heavy precipitation in Central and South America, subdivided by AR6 regions. See Sections 11.9.1 and 11.9.3 for details.
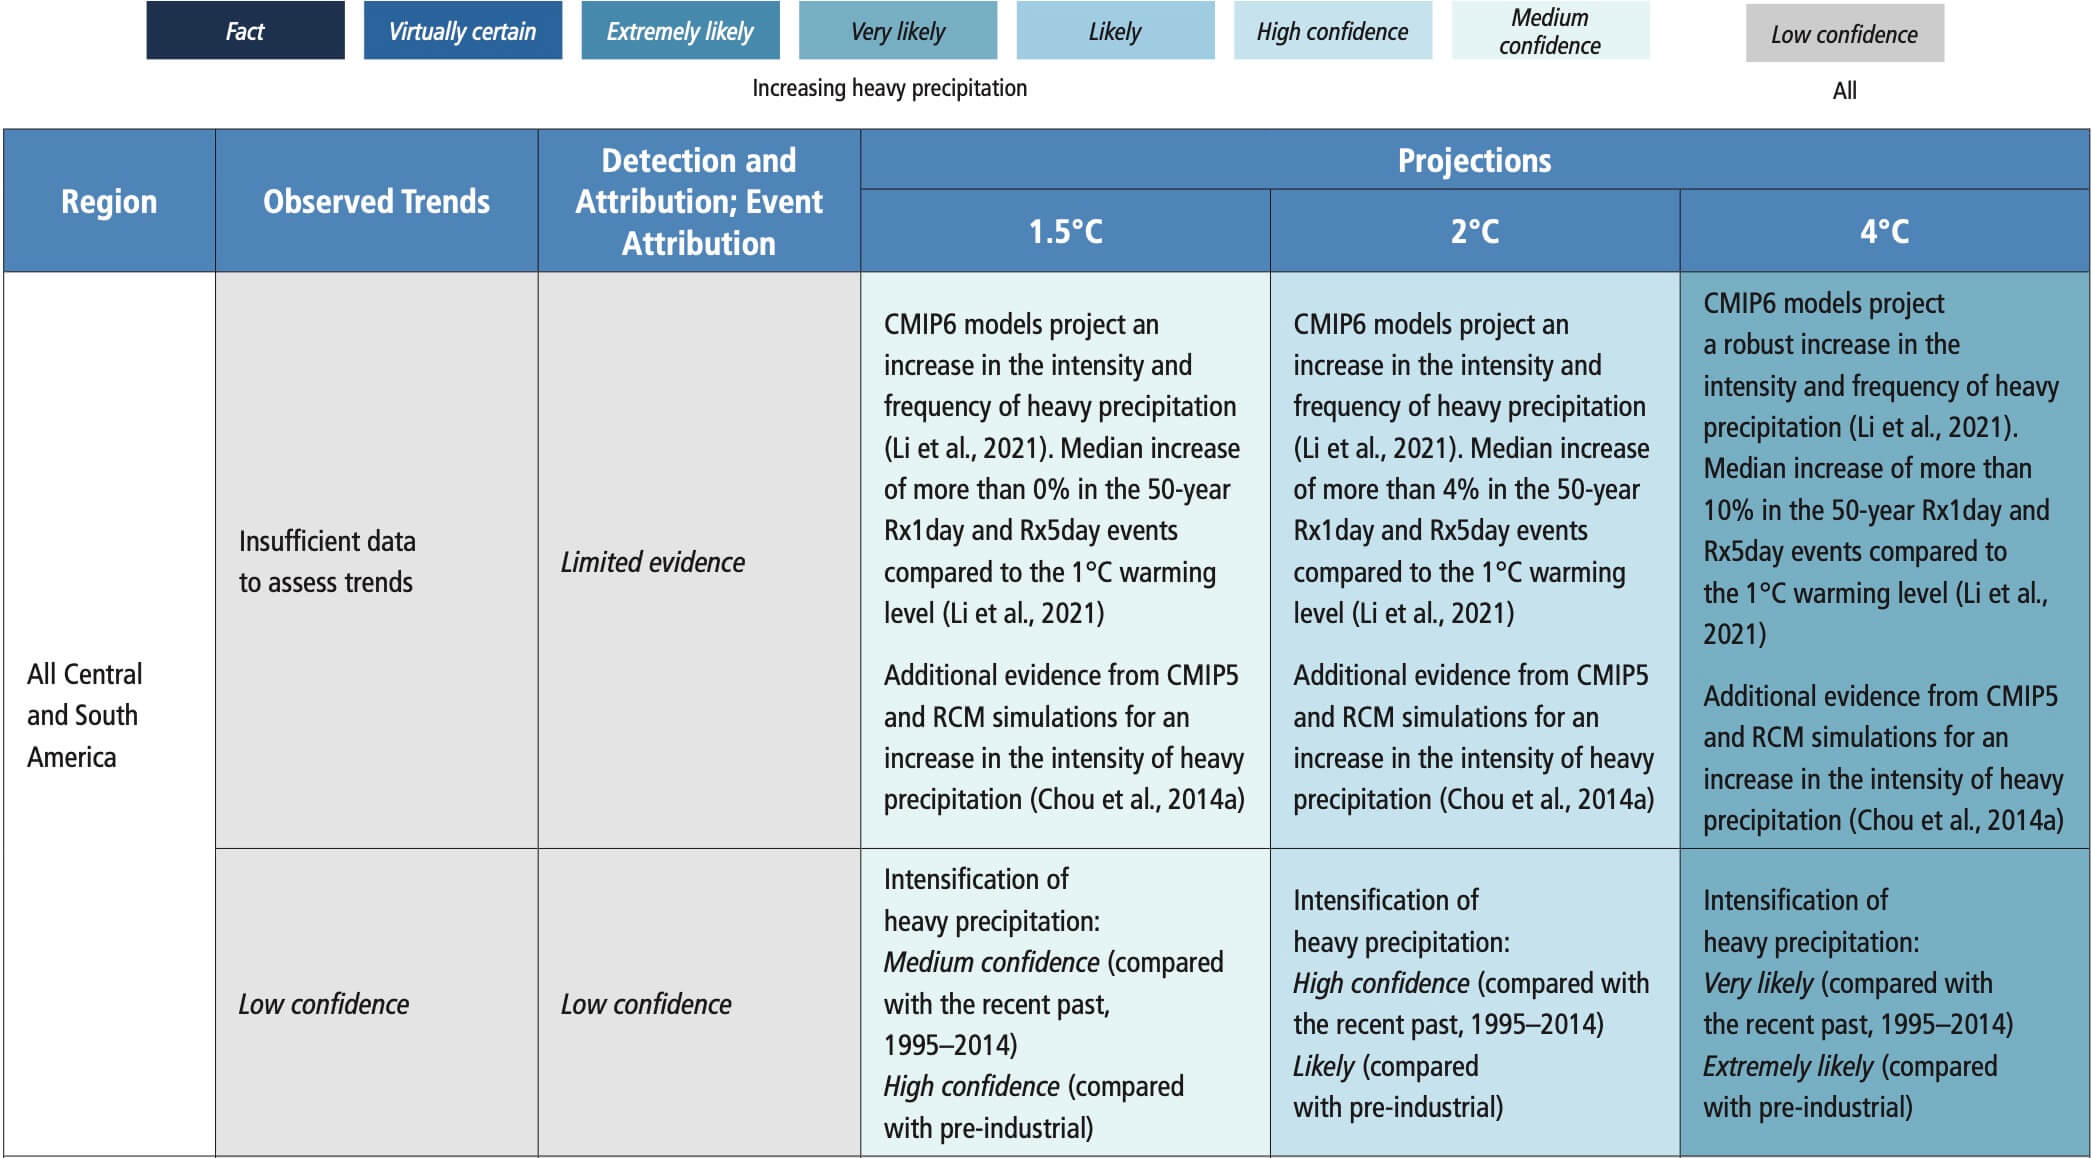
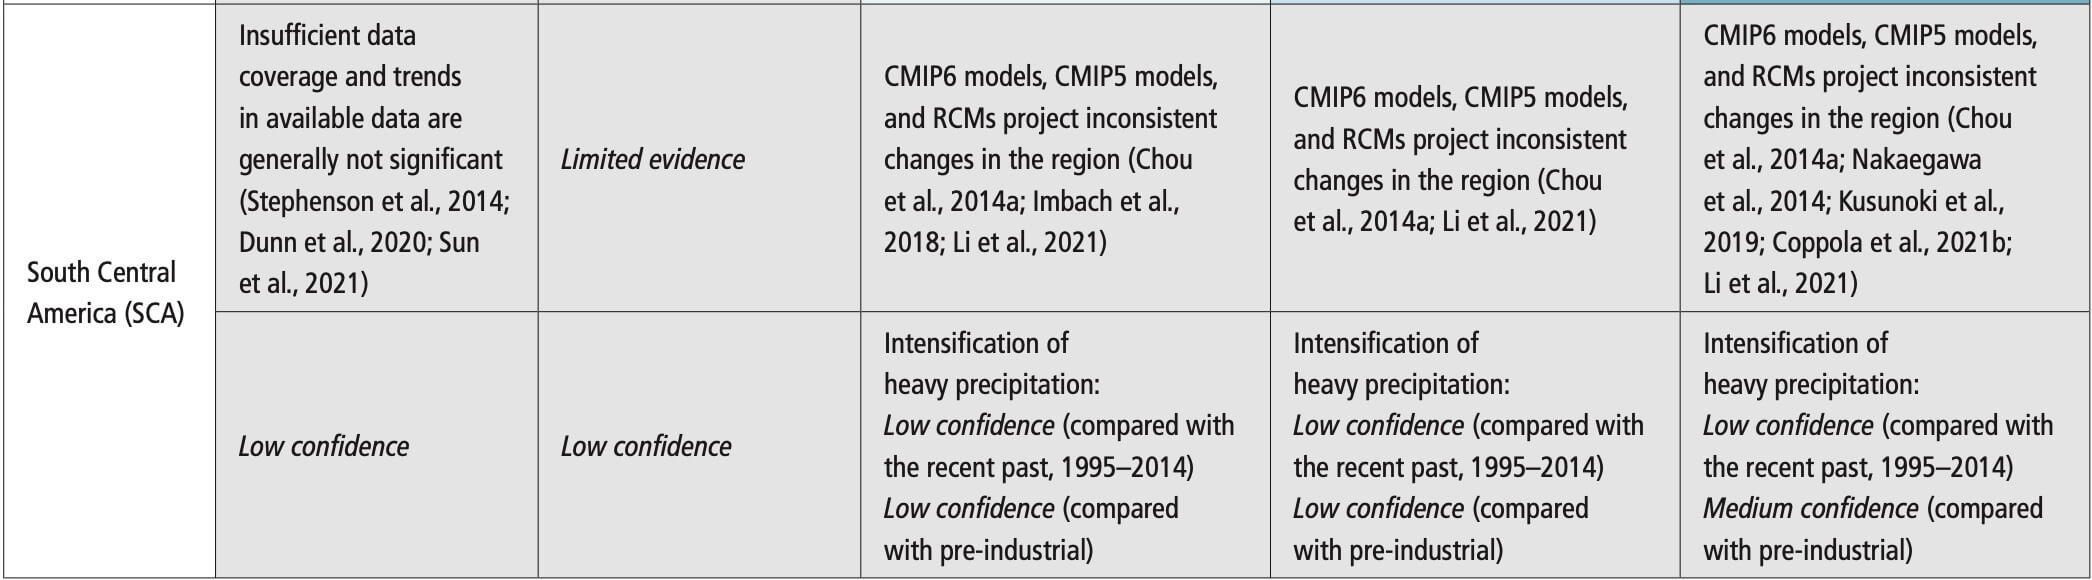
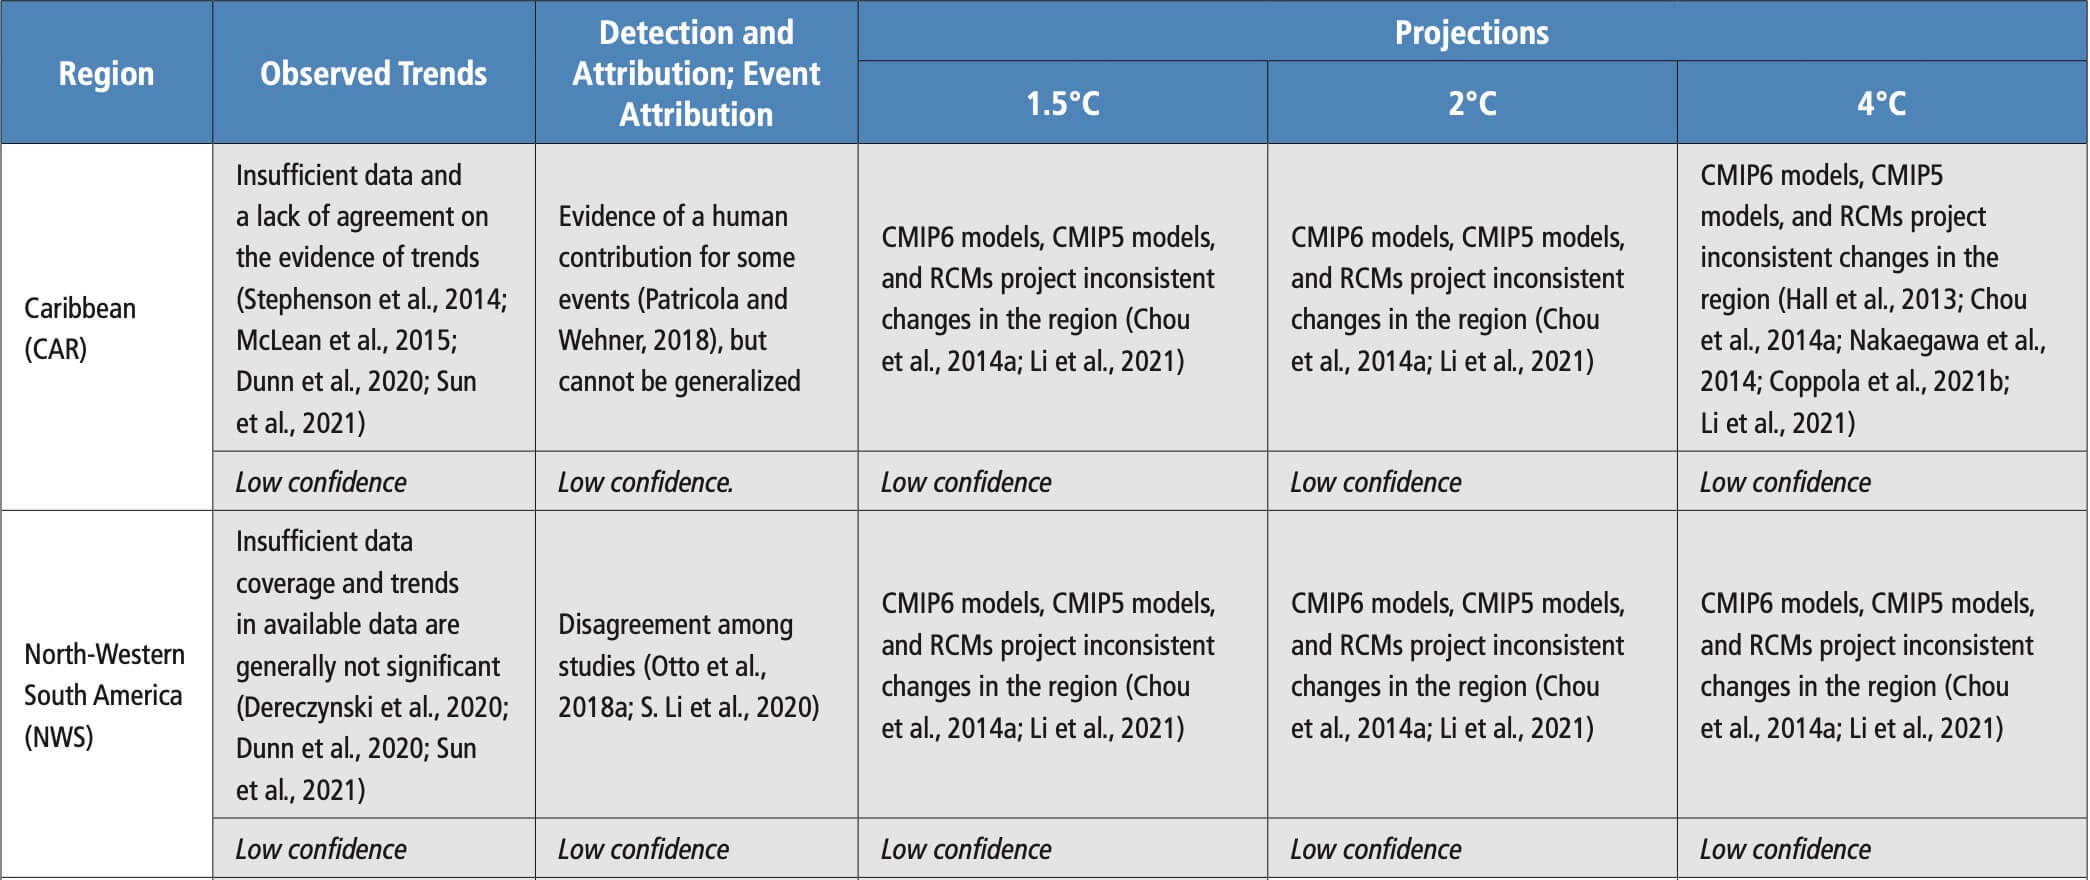
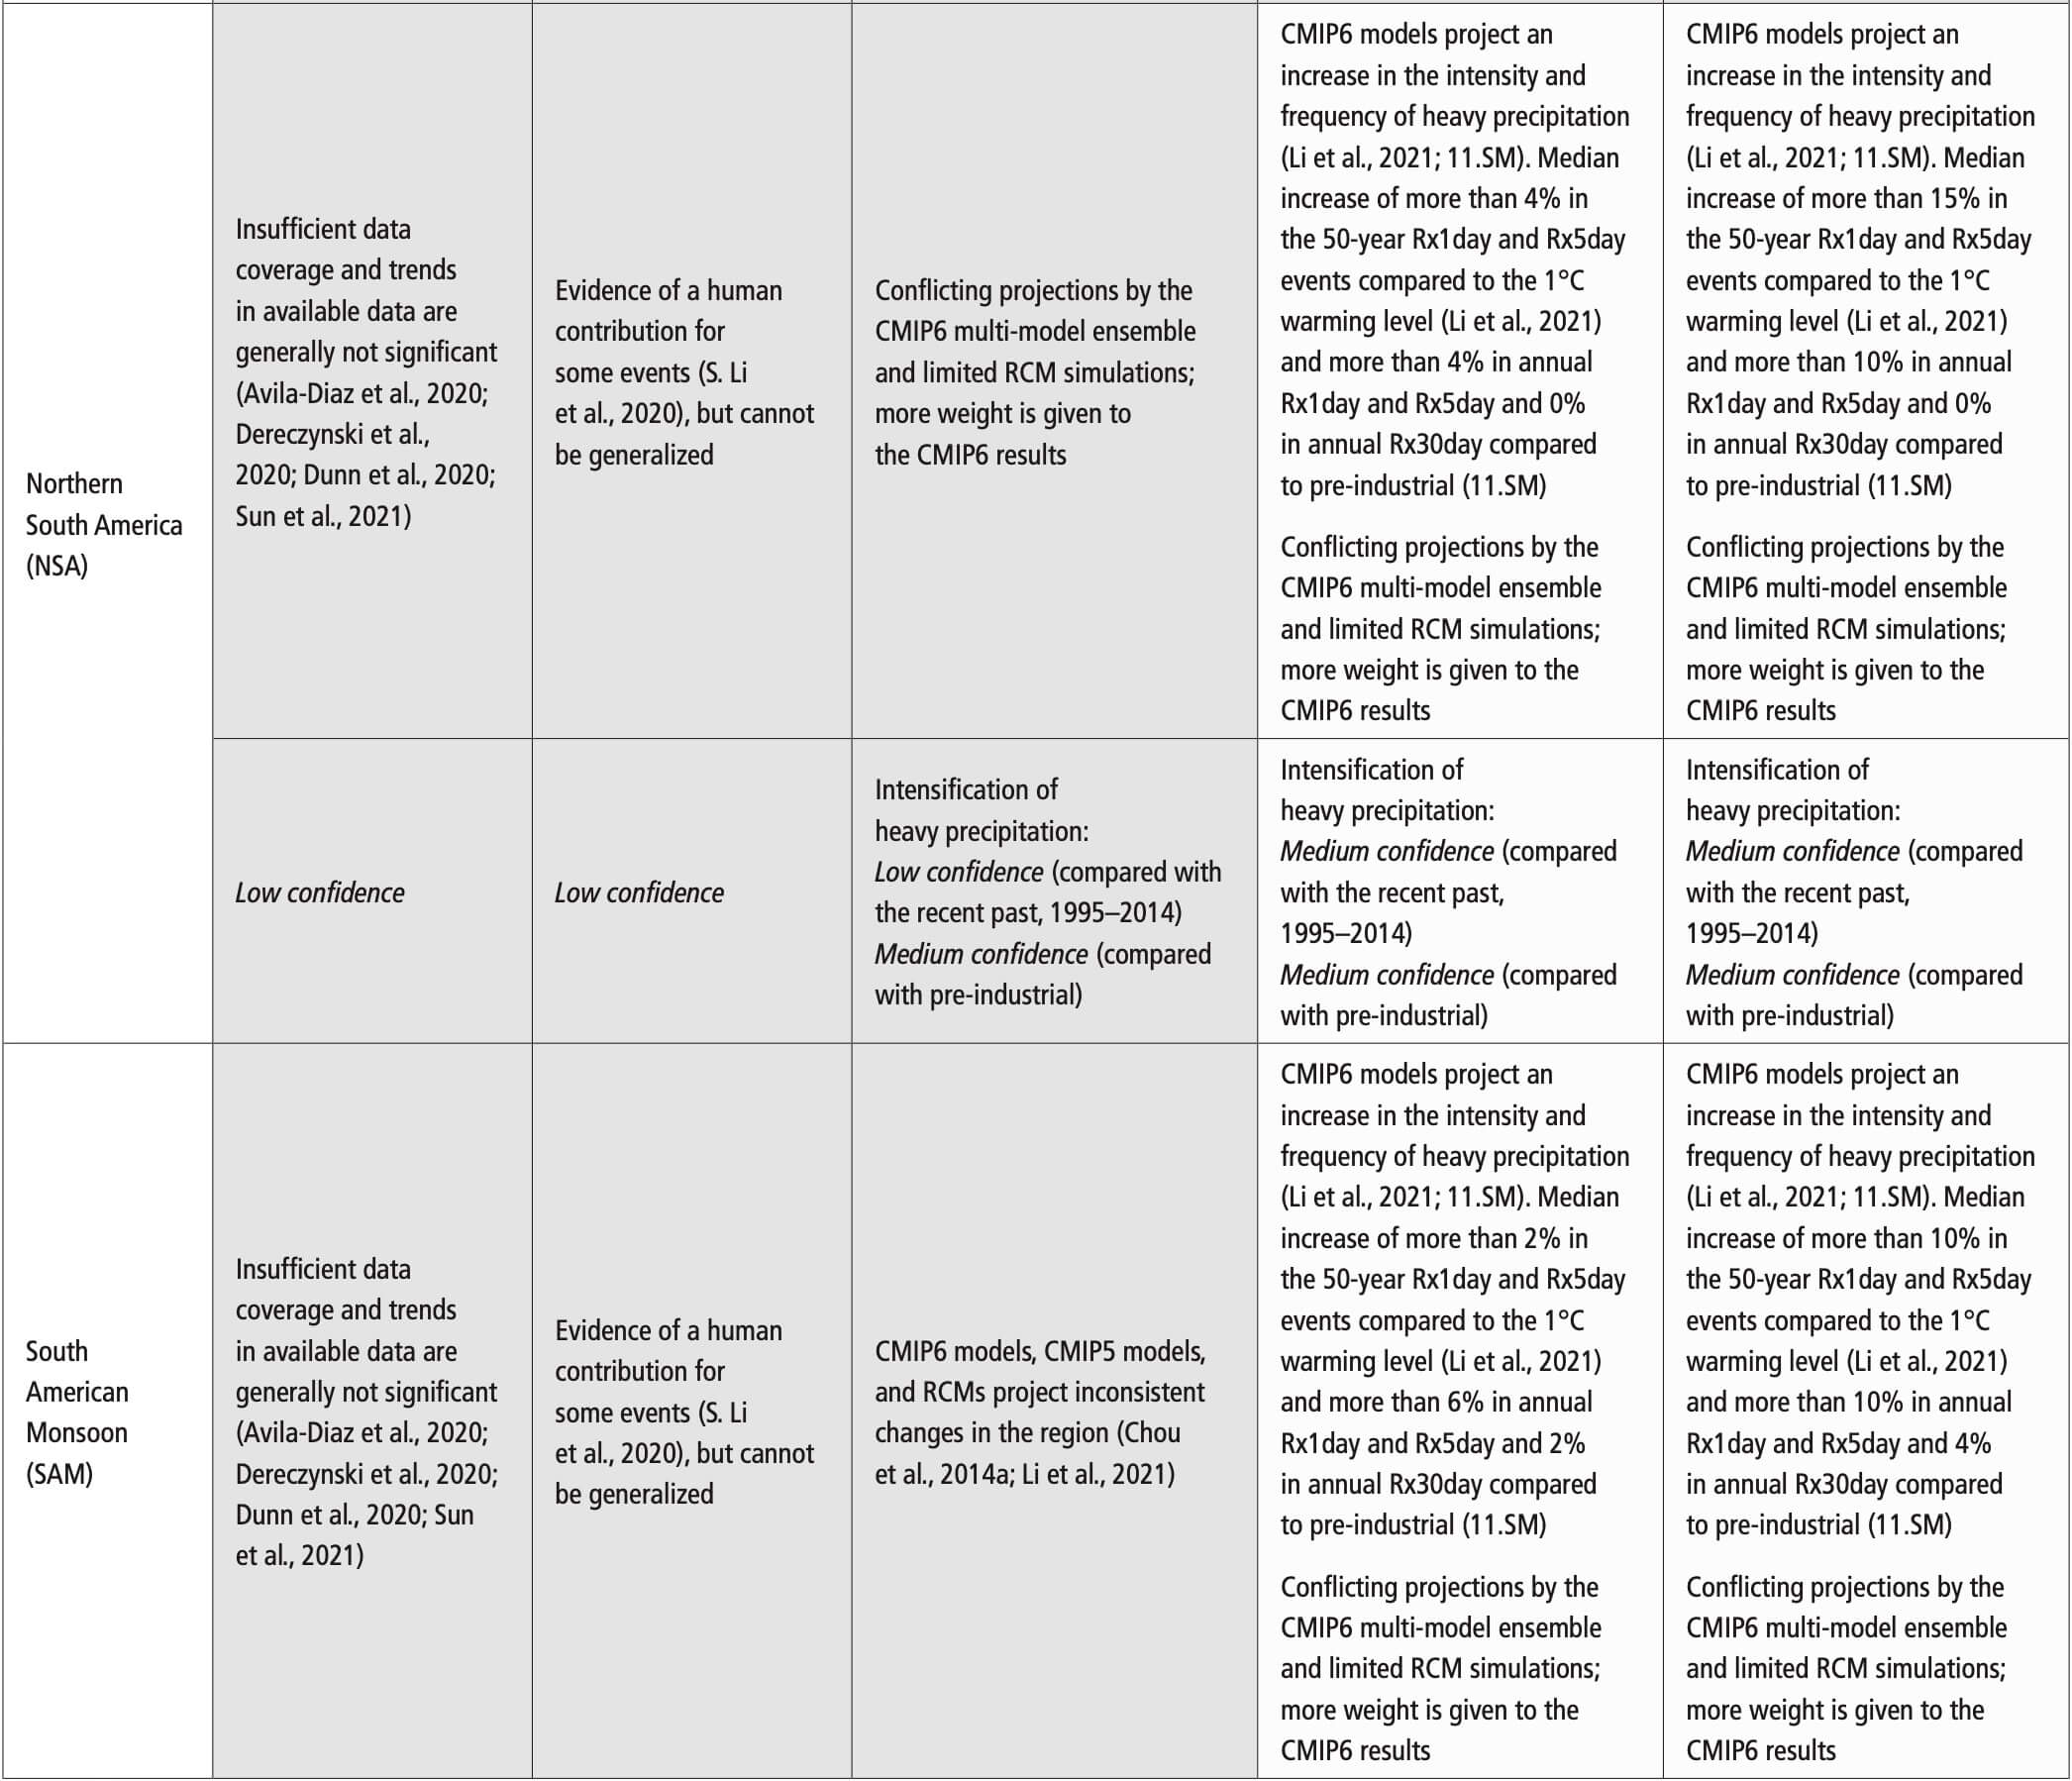
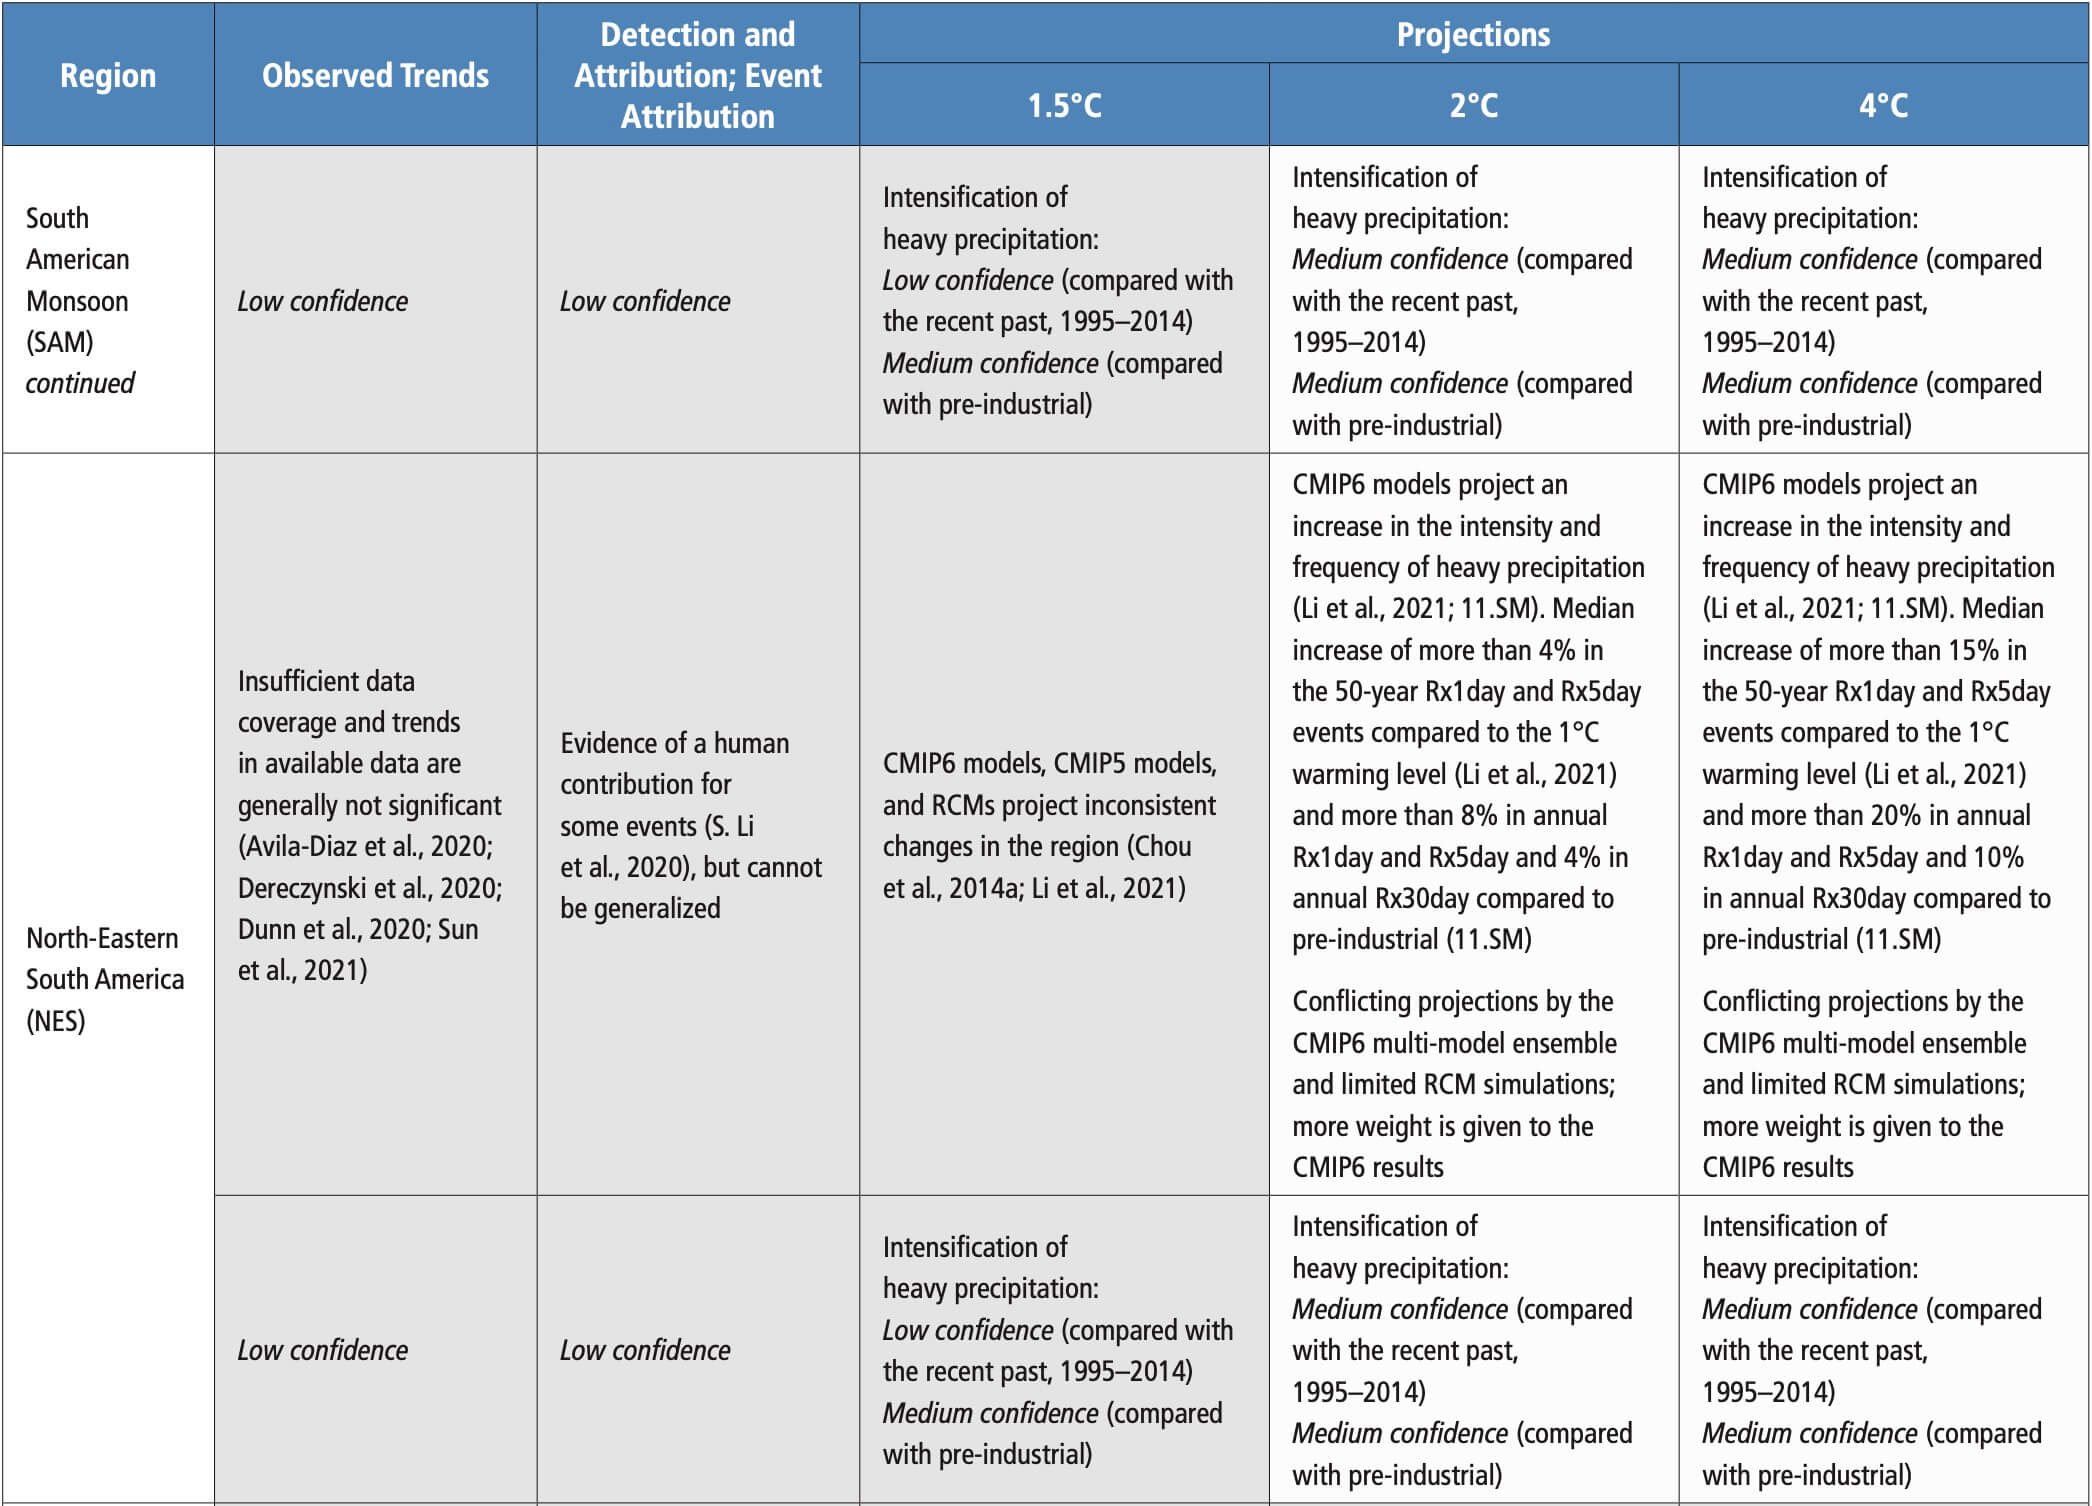
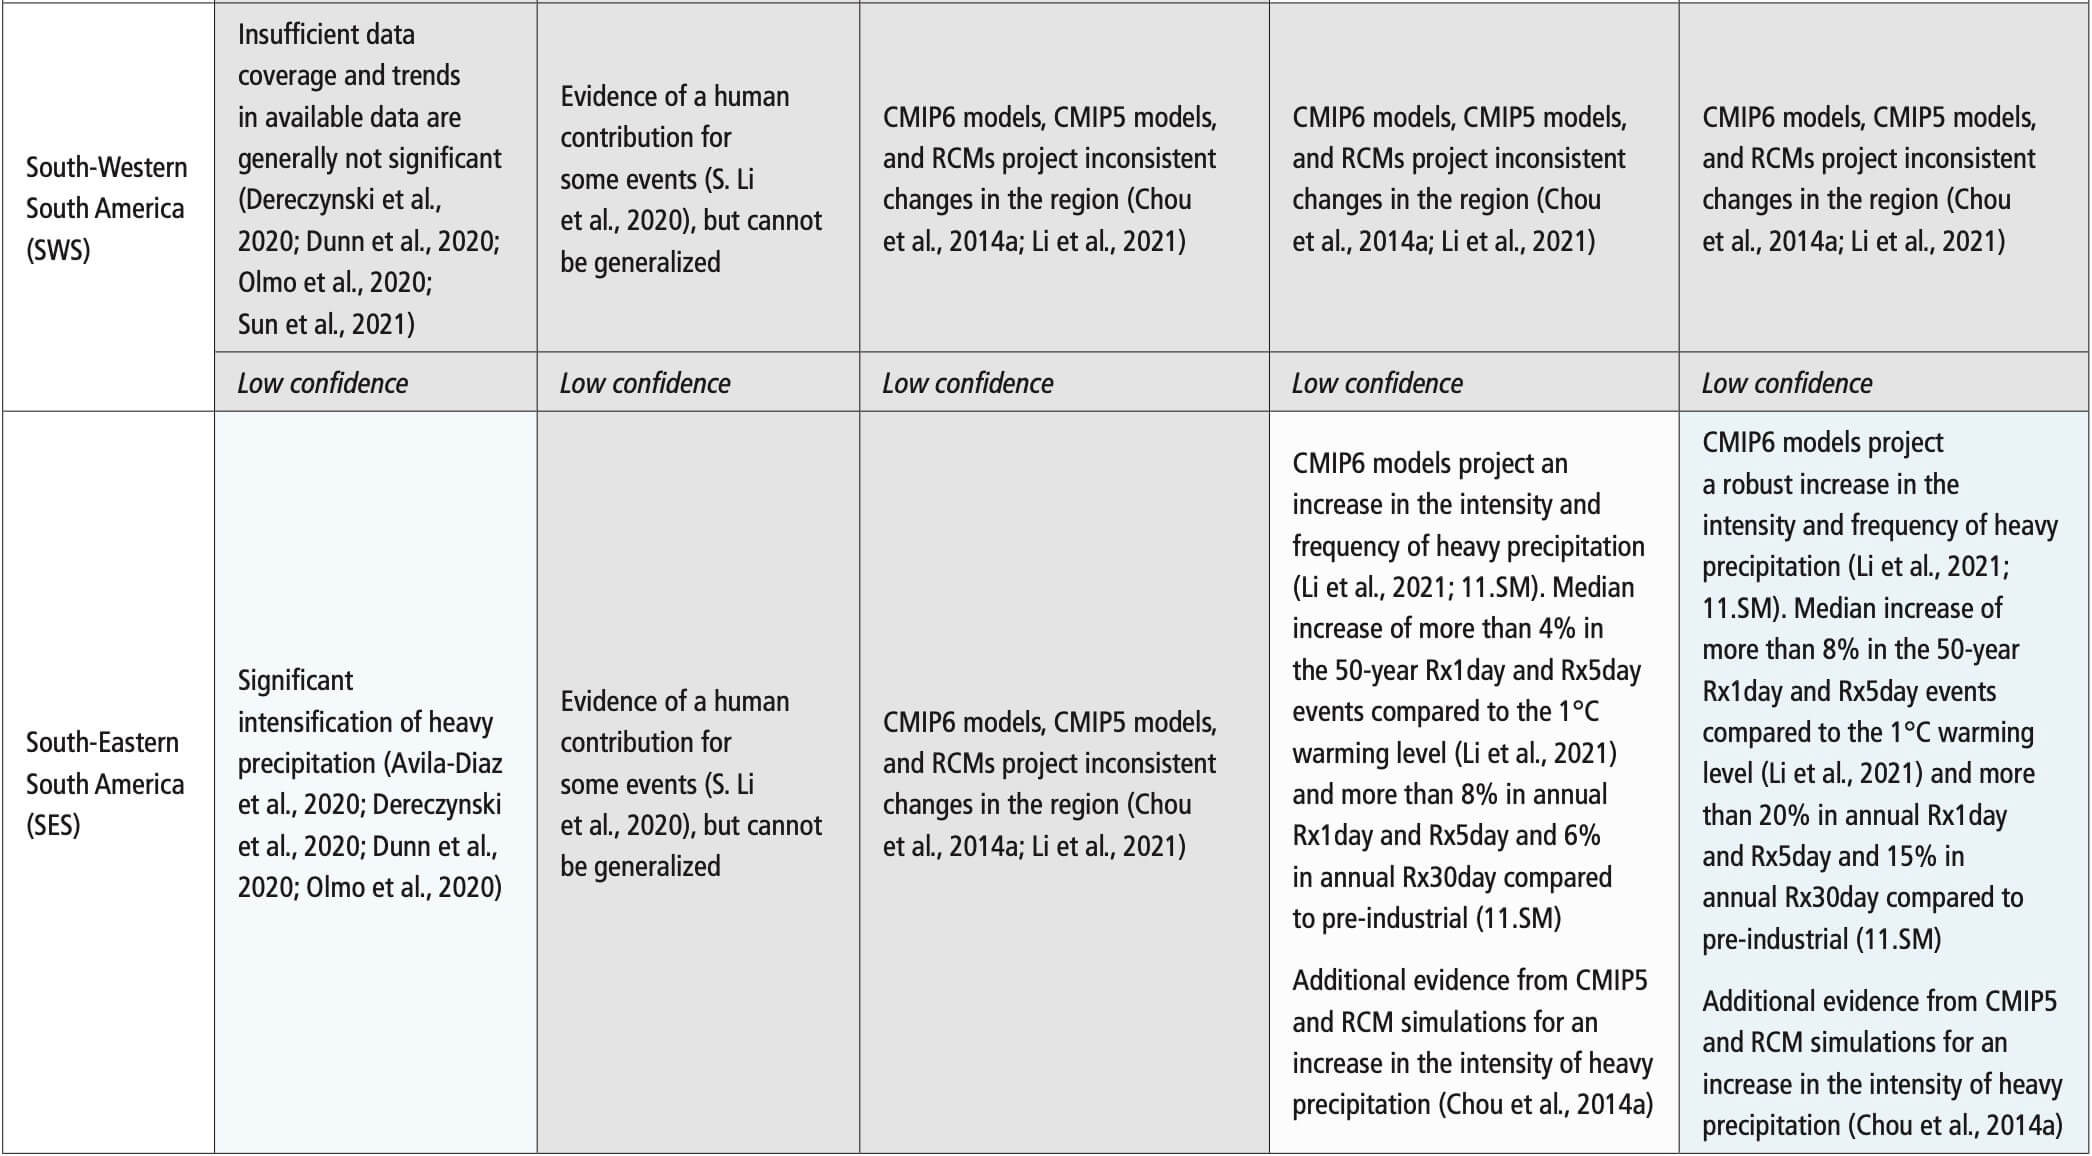
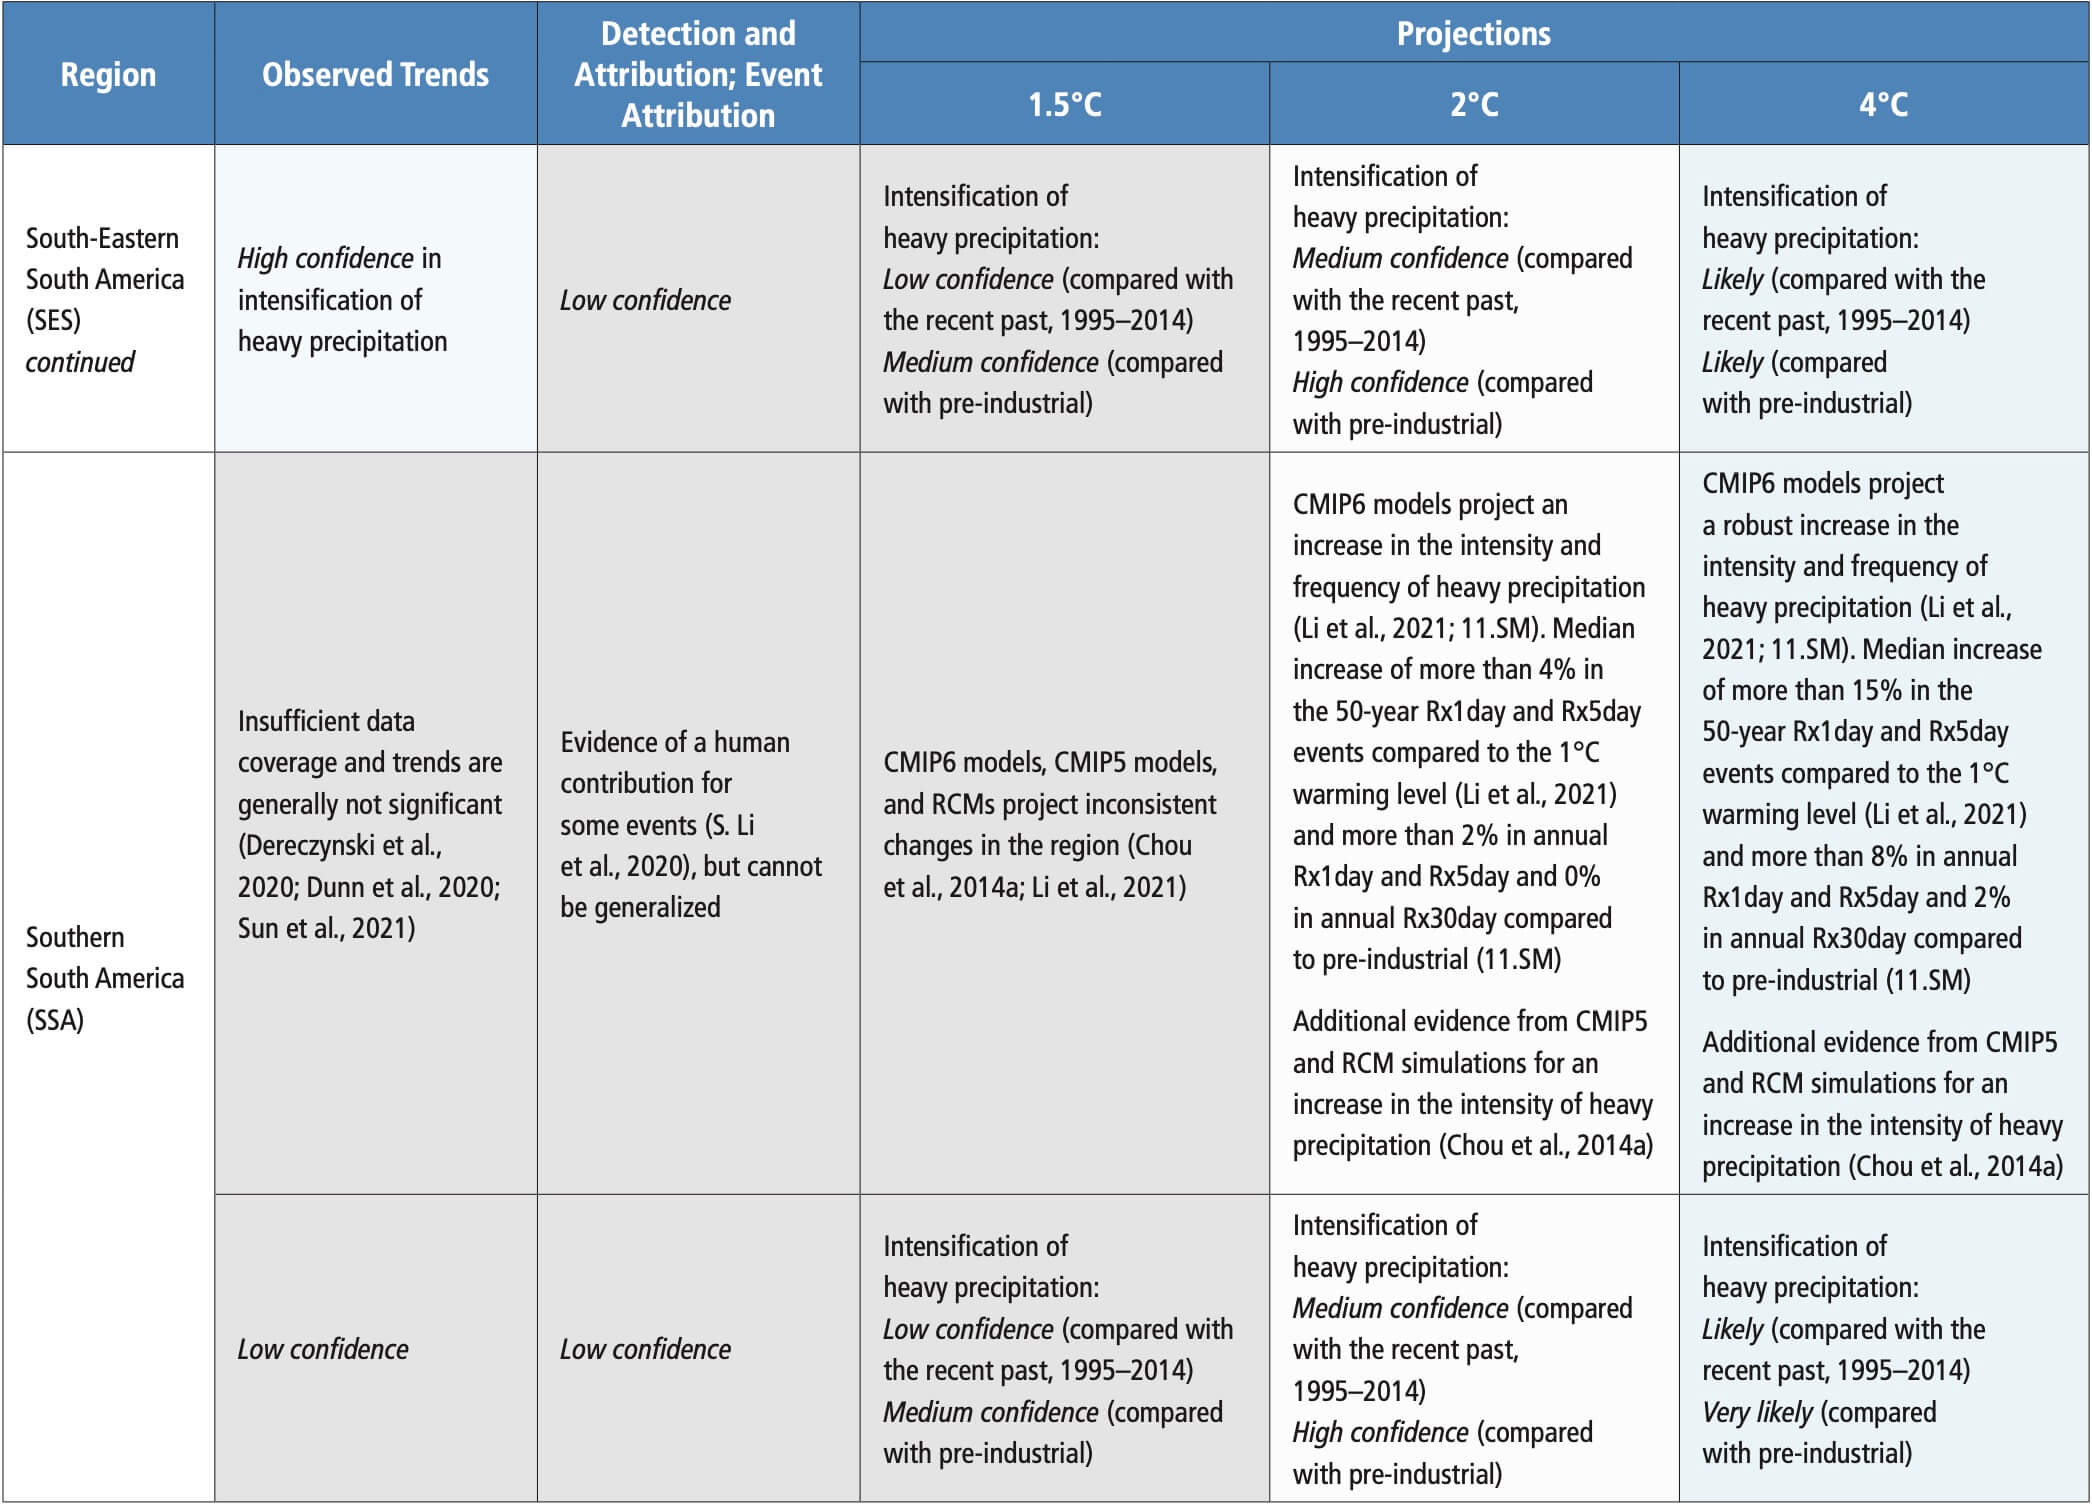 Table 11.15 | Observed trends, human contribution to observed trends, and projected changes at 1.5°C, 2°C and 4°C of global warming for meteorological droughts (MET), agricultural and ecological droughts (AGR/ECOL), and hydrological droughts (HYDR) in Central and South America, subdivided by AR6 regions. See Sections 11.9.1 and 11.9.4 for details.
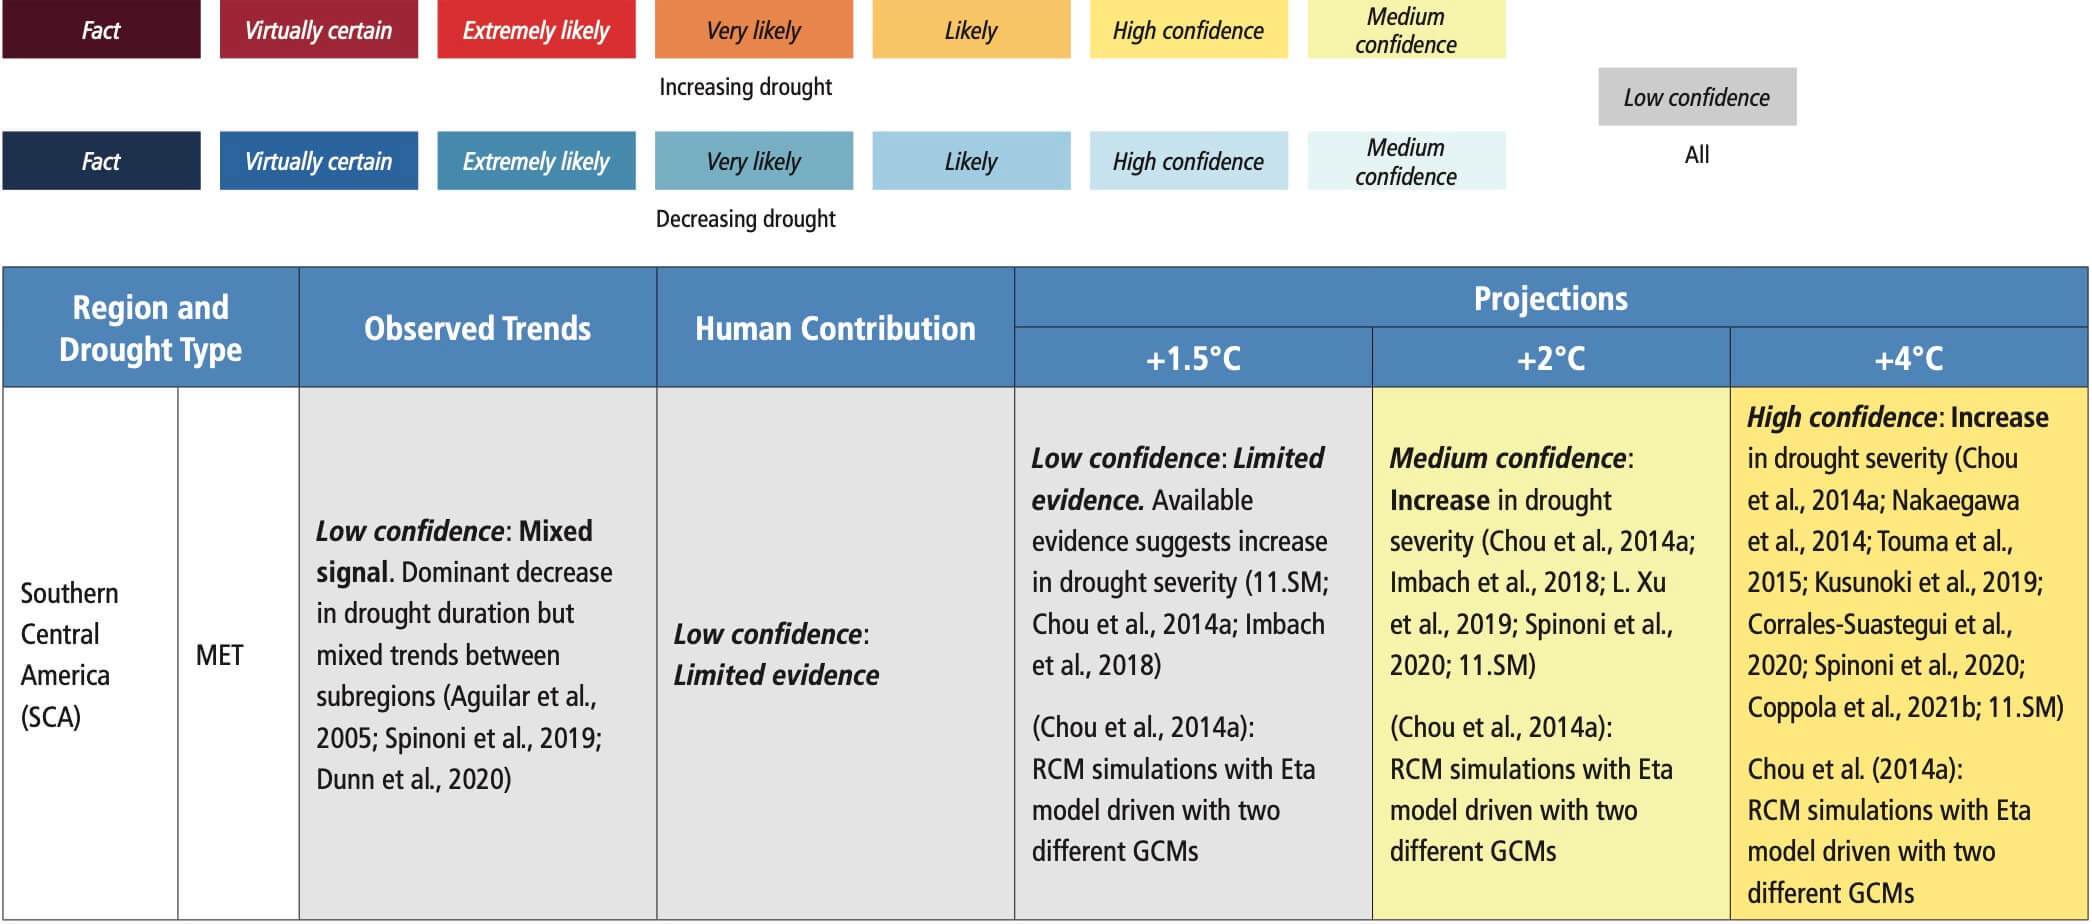
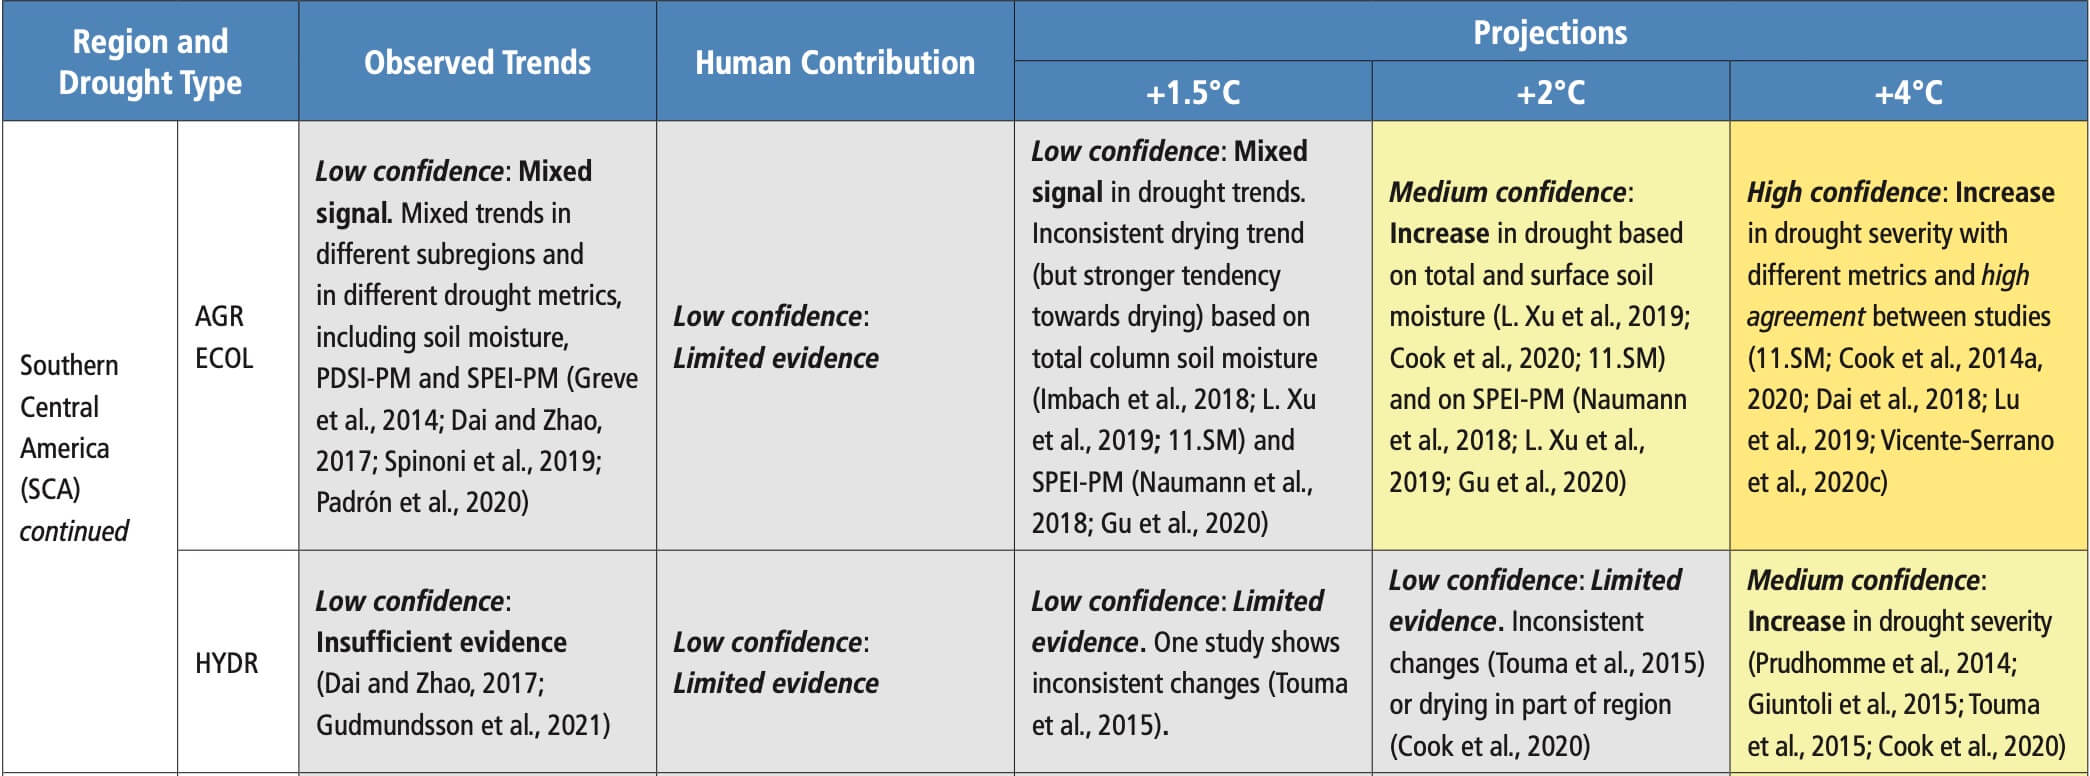
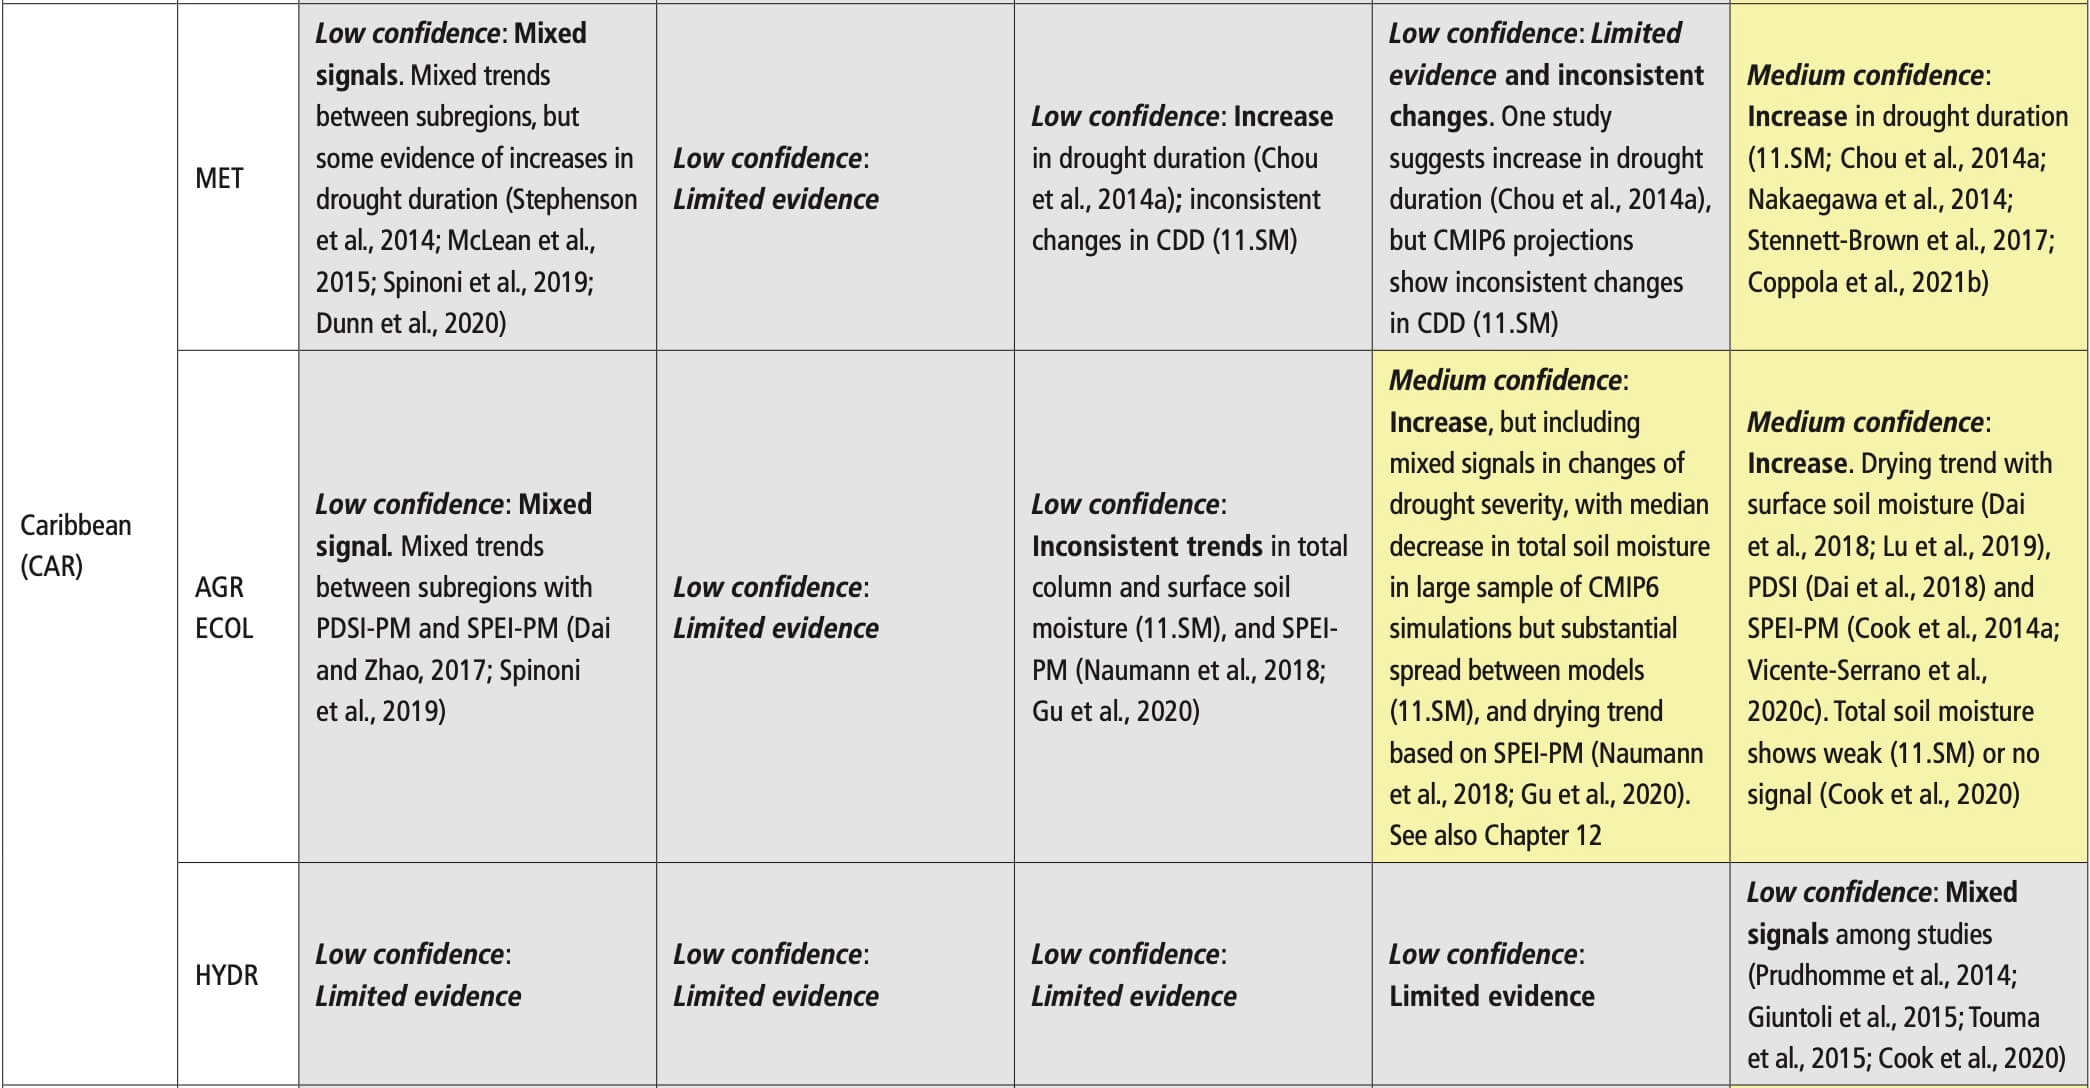
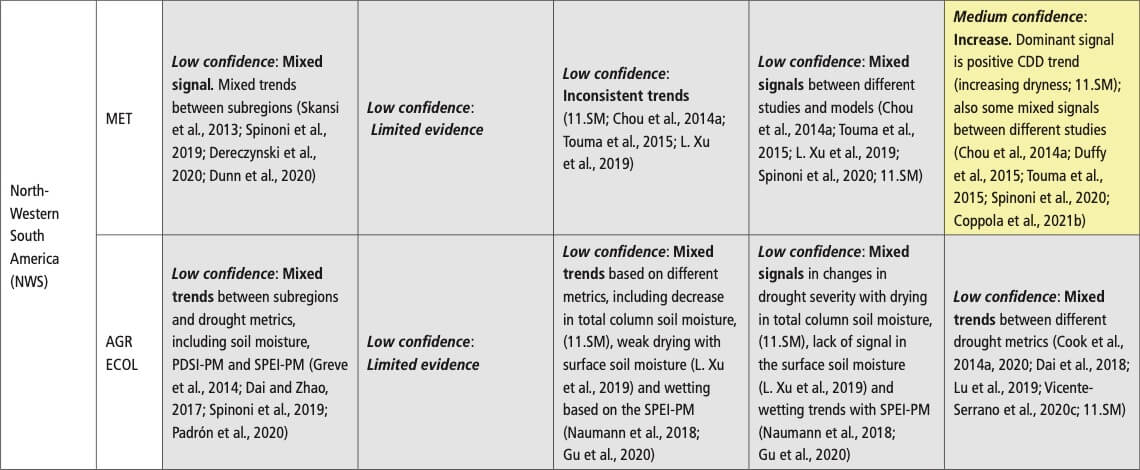
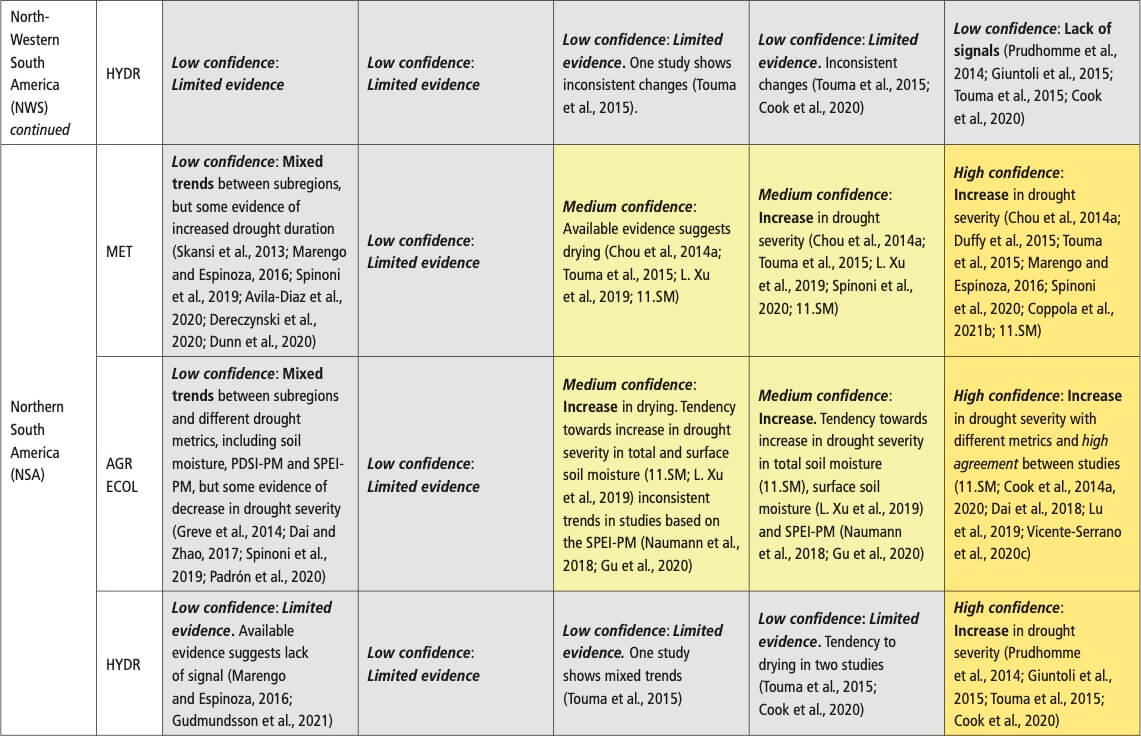
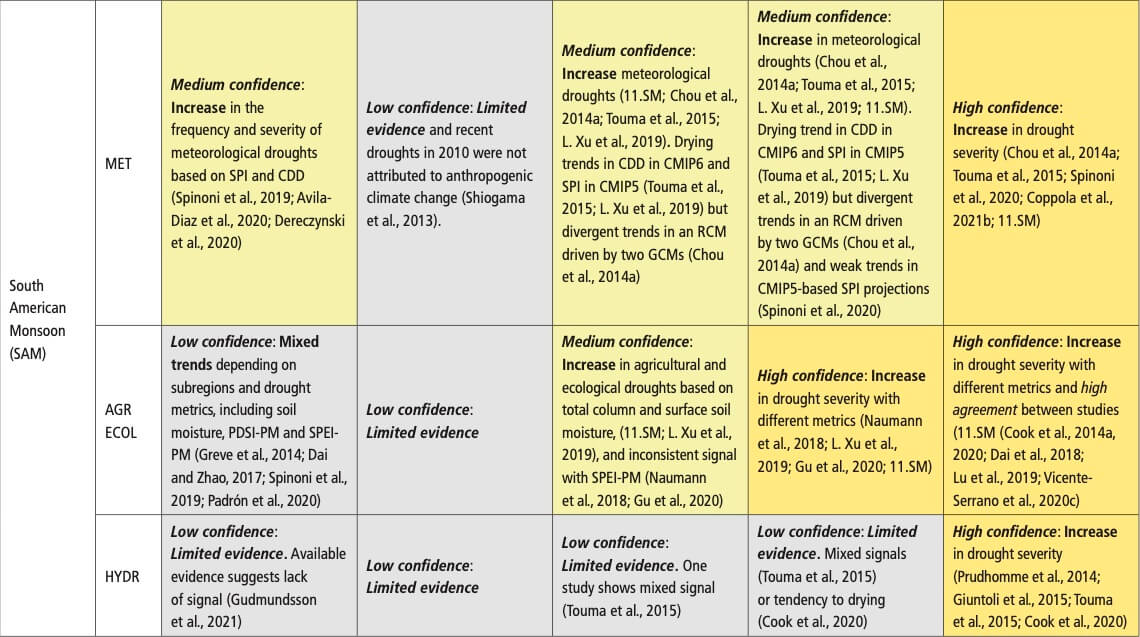
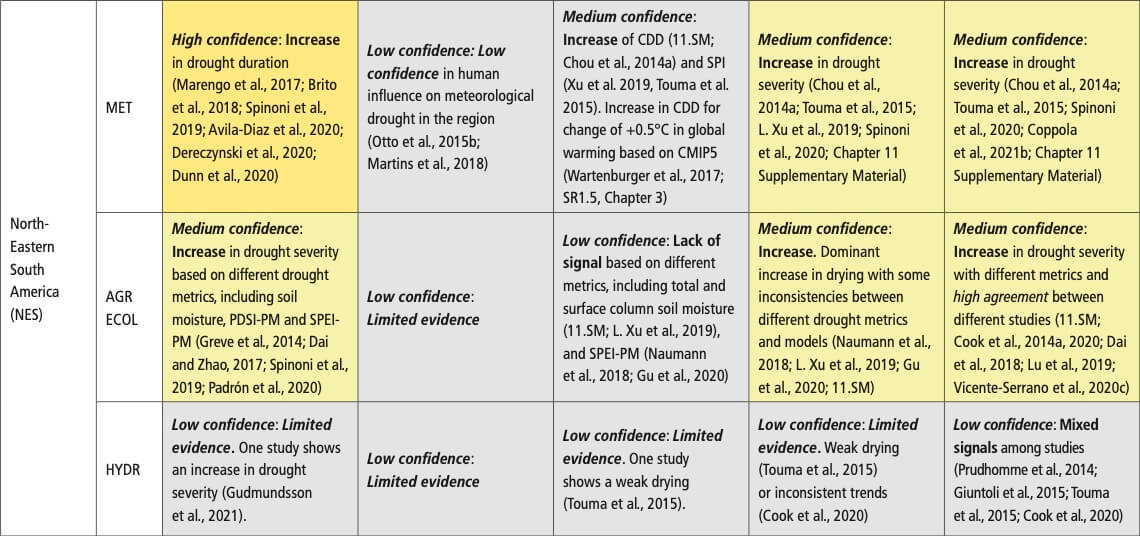
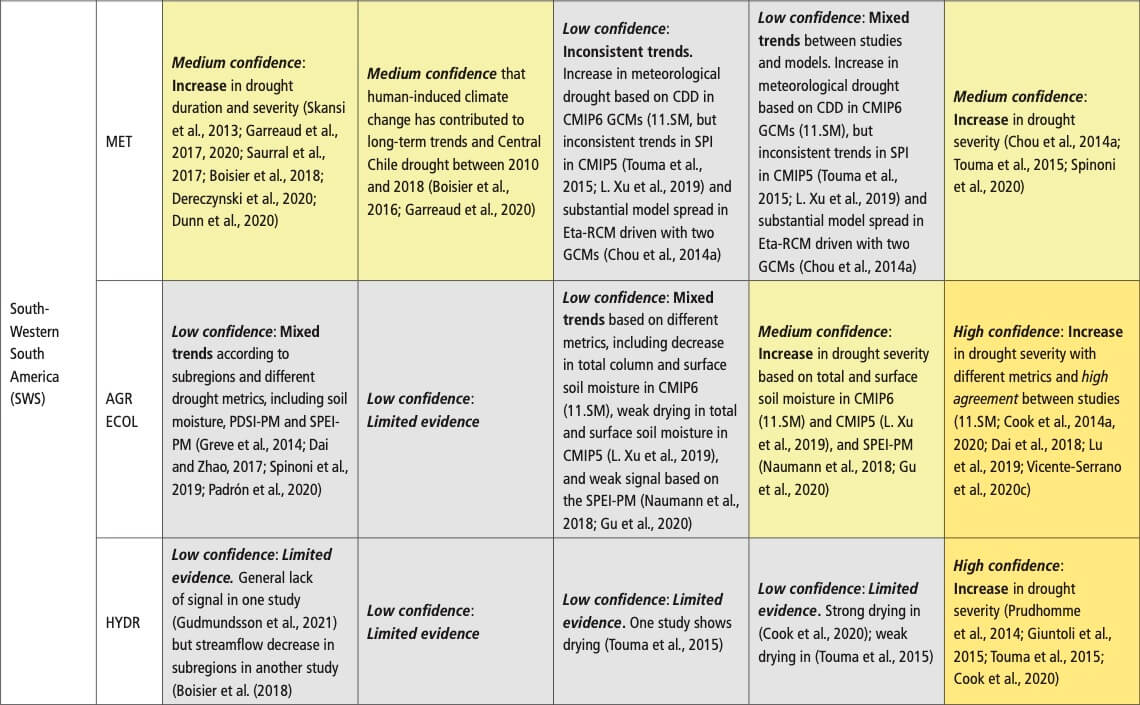
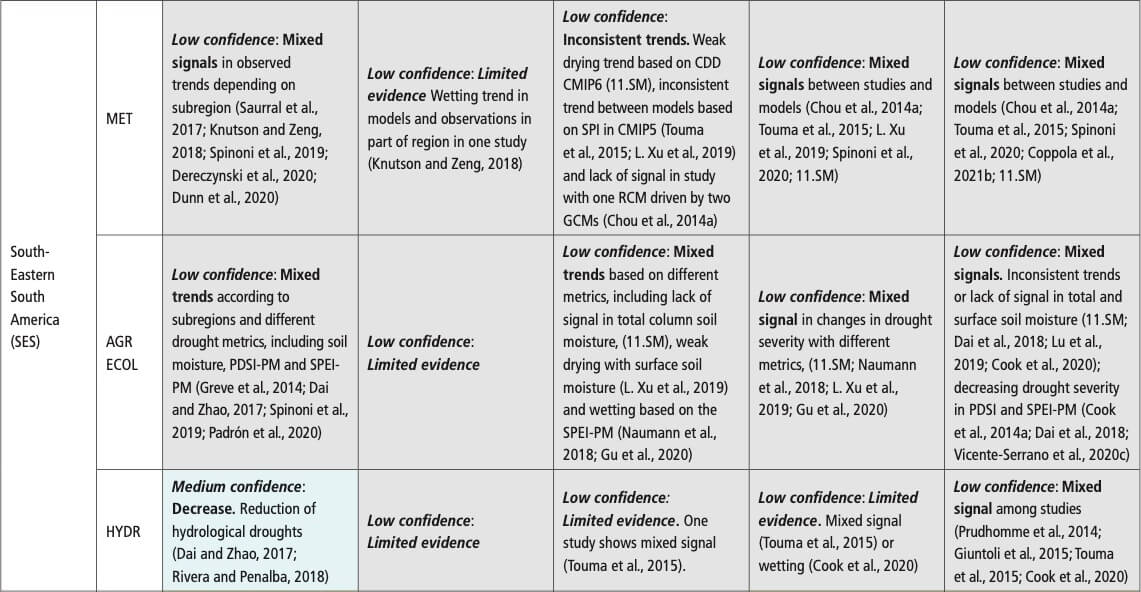
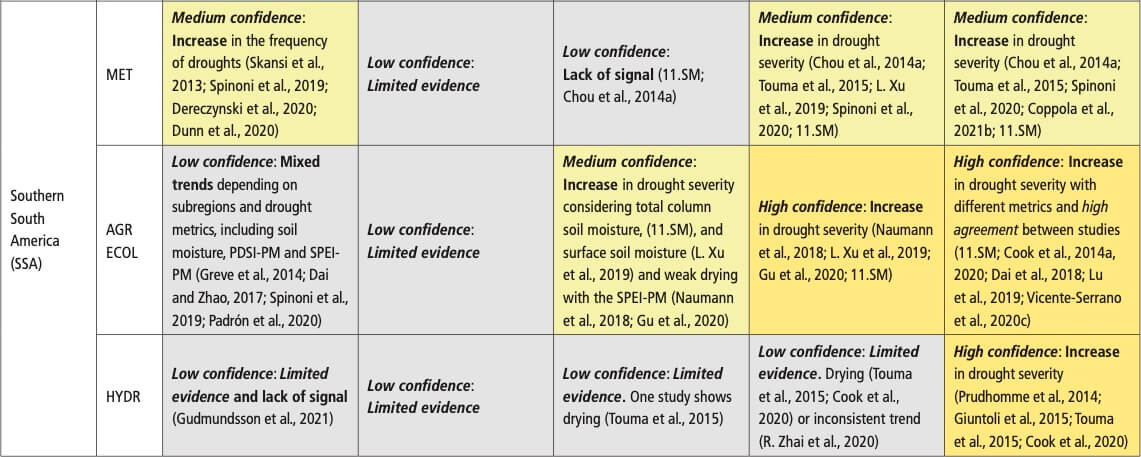 Table 11.16 | Observed trends, human contribution to observed trends, and projected changes at 1.5°C, 2°C and 4°C of global warming for temperature extremes in Europe, subdivided by AR6 regions. See Sections 11.9.1 and 11.9.2 for details.
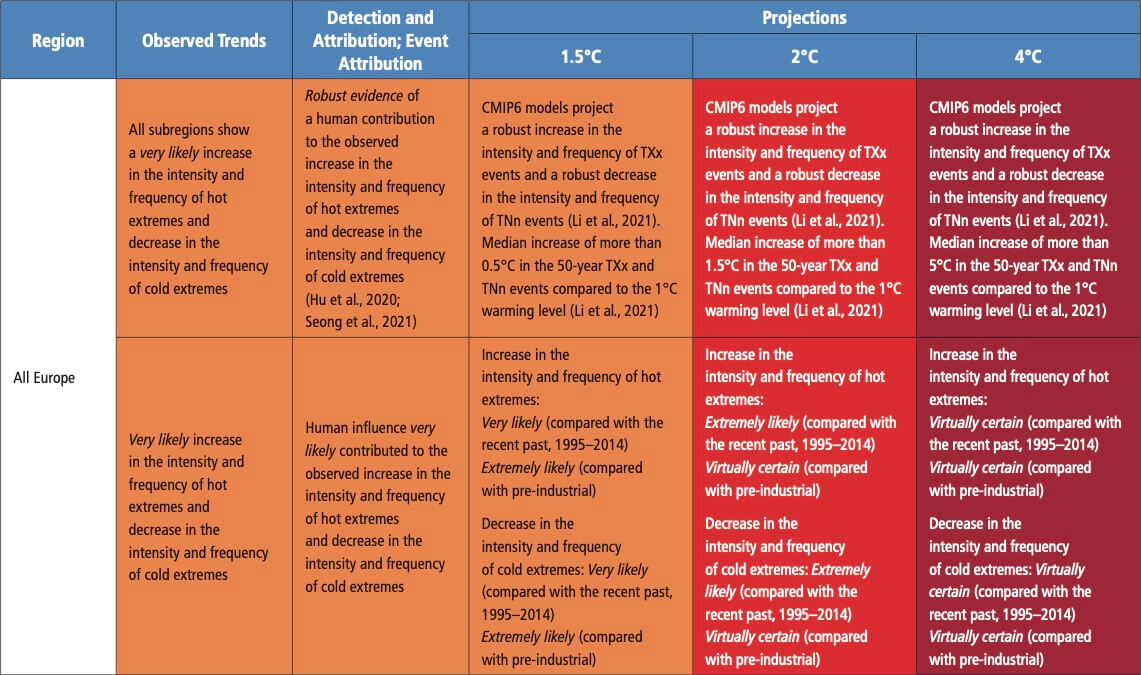
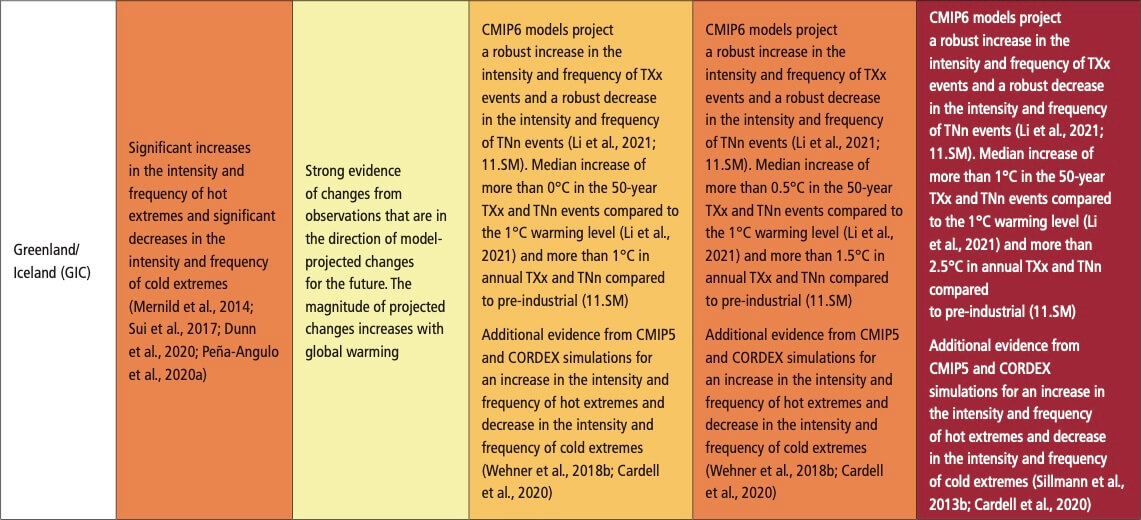
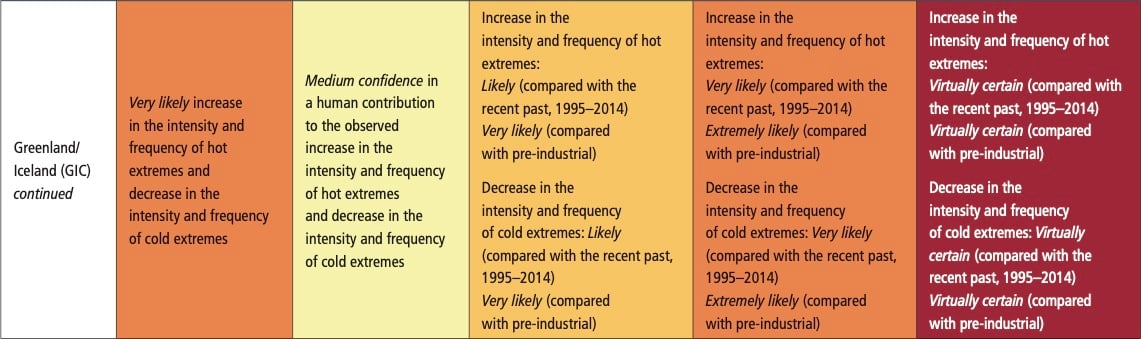
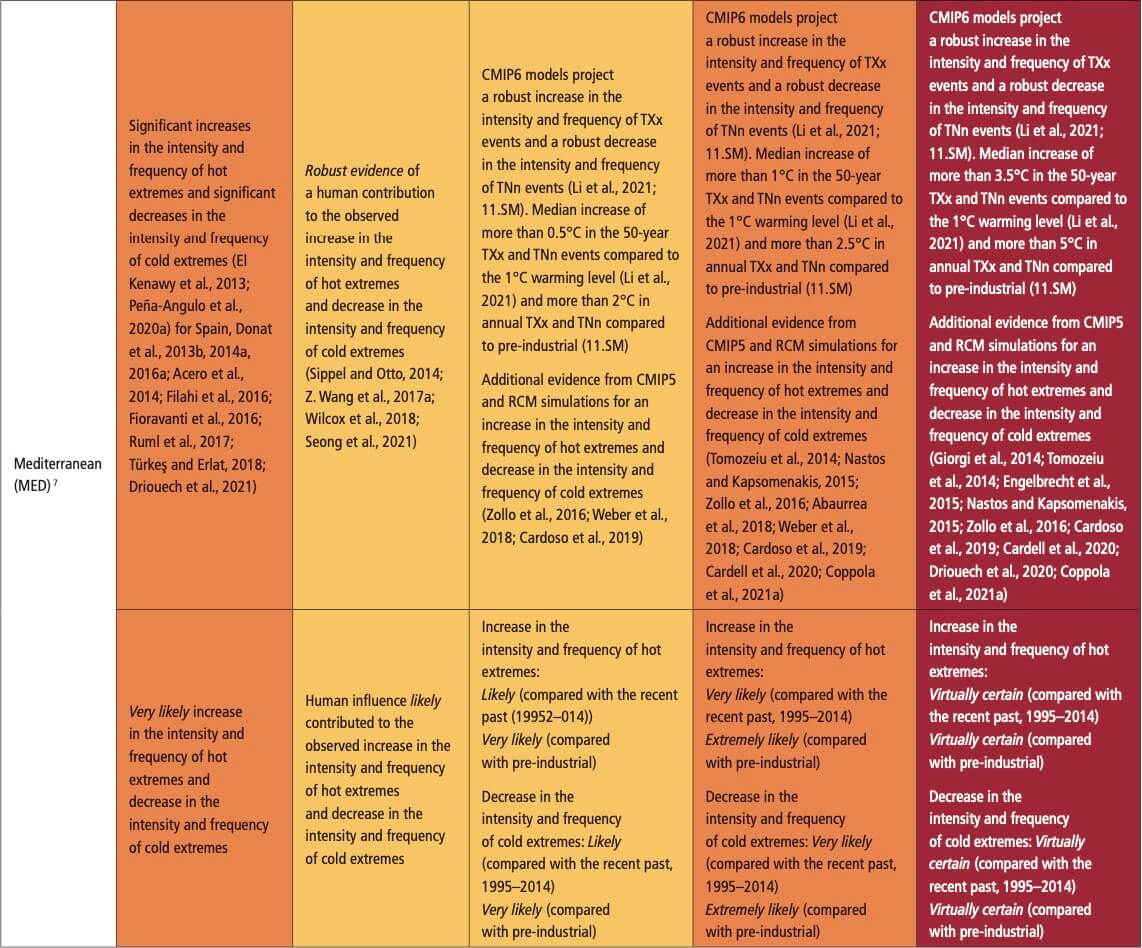
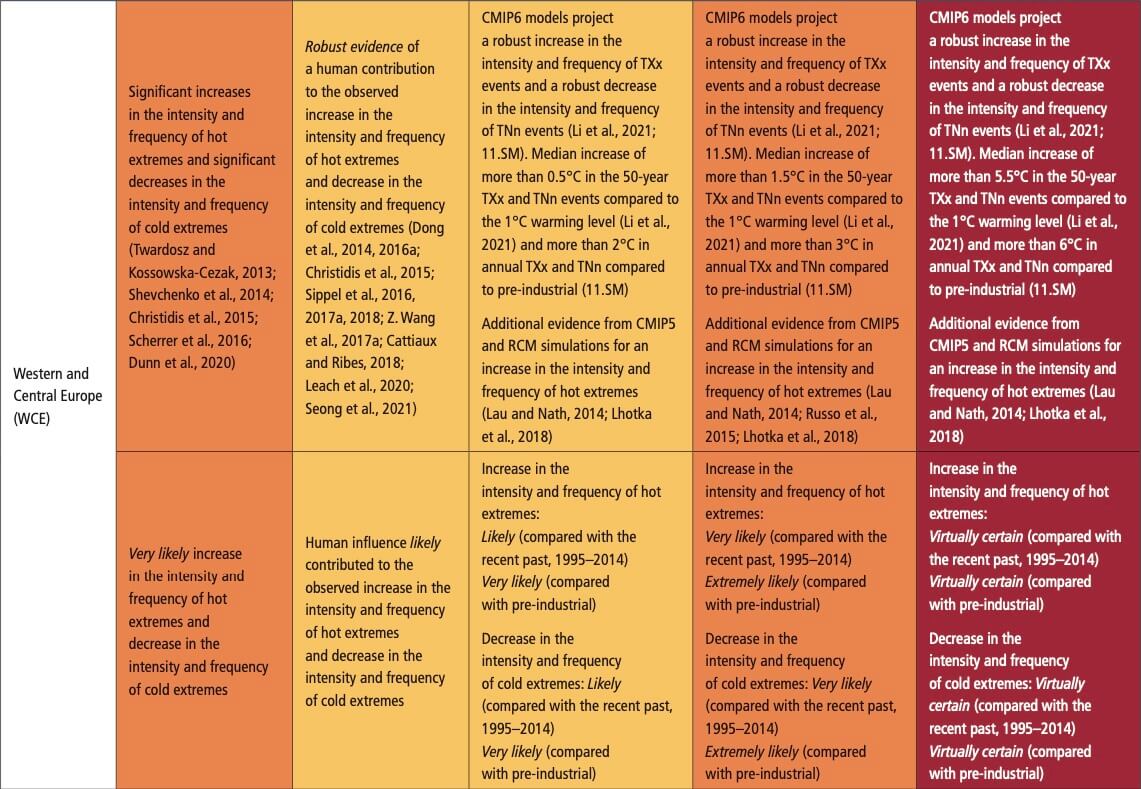
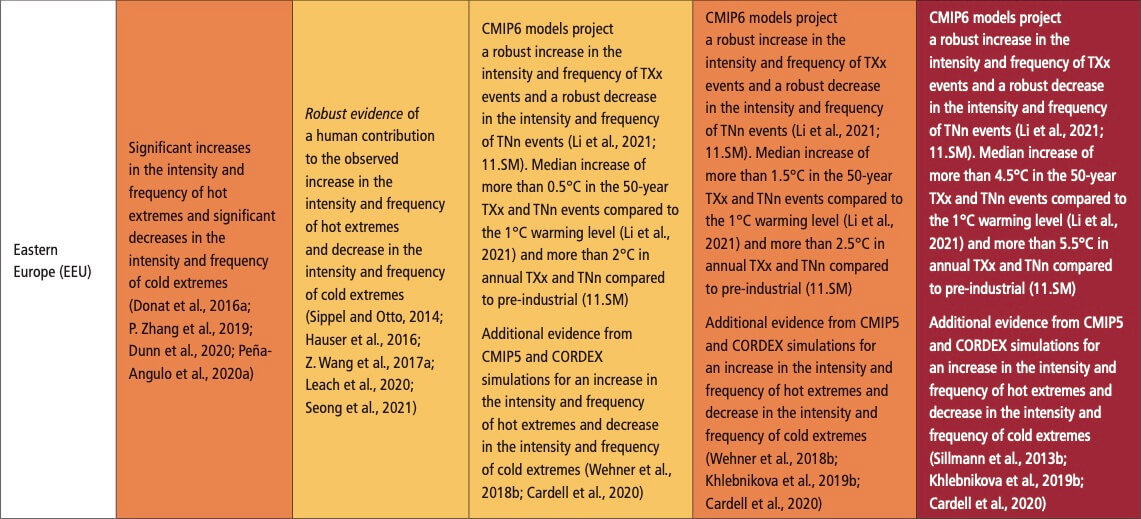
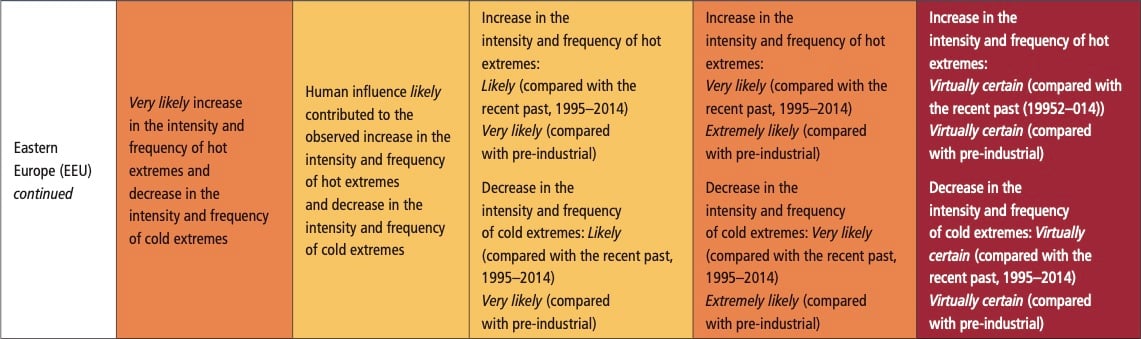
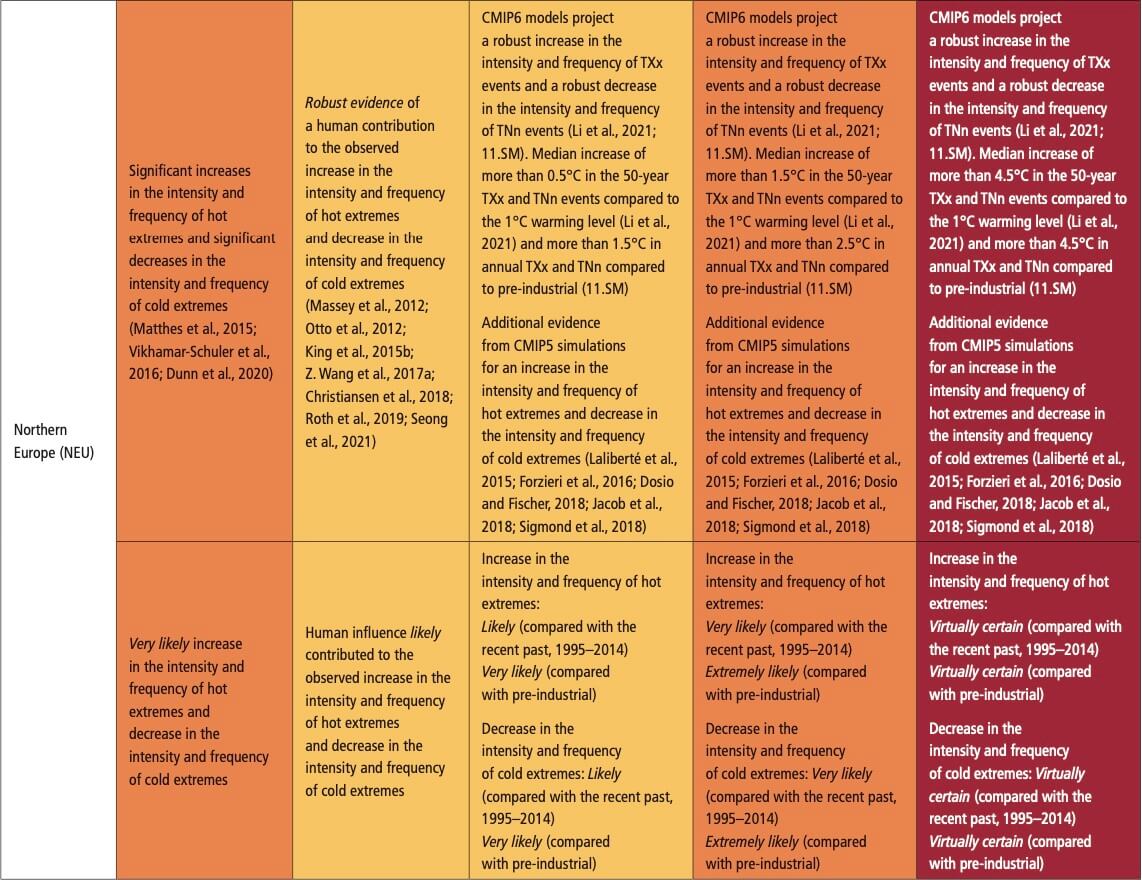 Table 11.17 | Observed trends, human contribution to observed trends, and projected changes at 1.5°C, 2°C and 4°C of global warming for heavy precipitation in Europe, subdivided by AR6 regions. See Sections 11.9.1 and 11.9.3 for details.
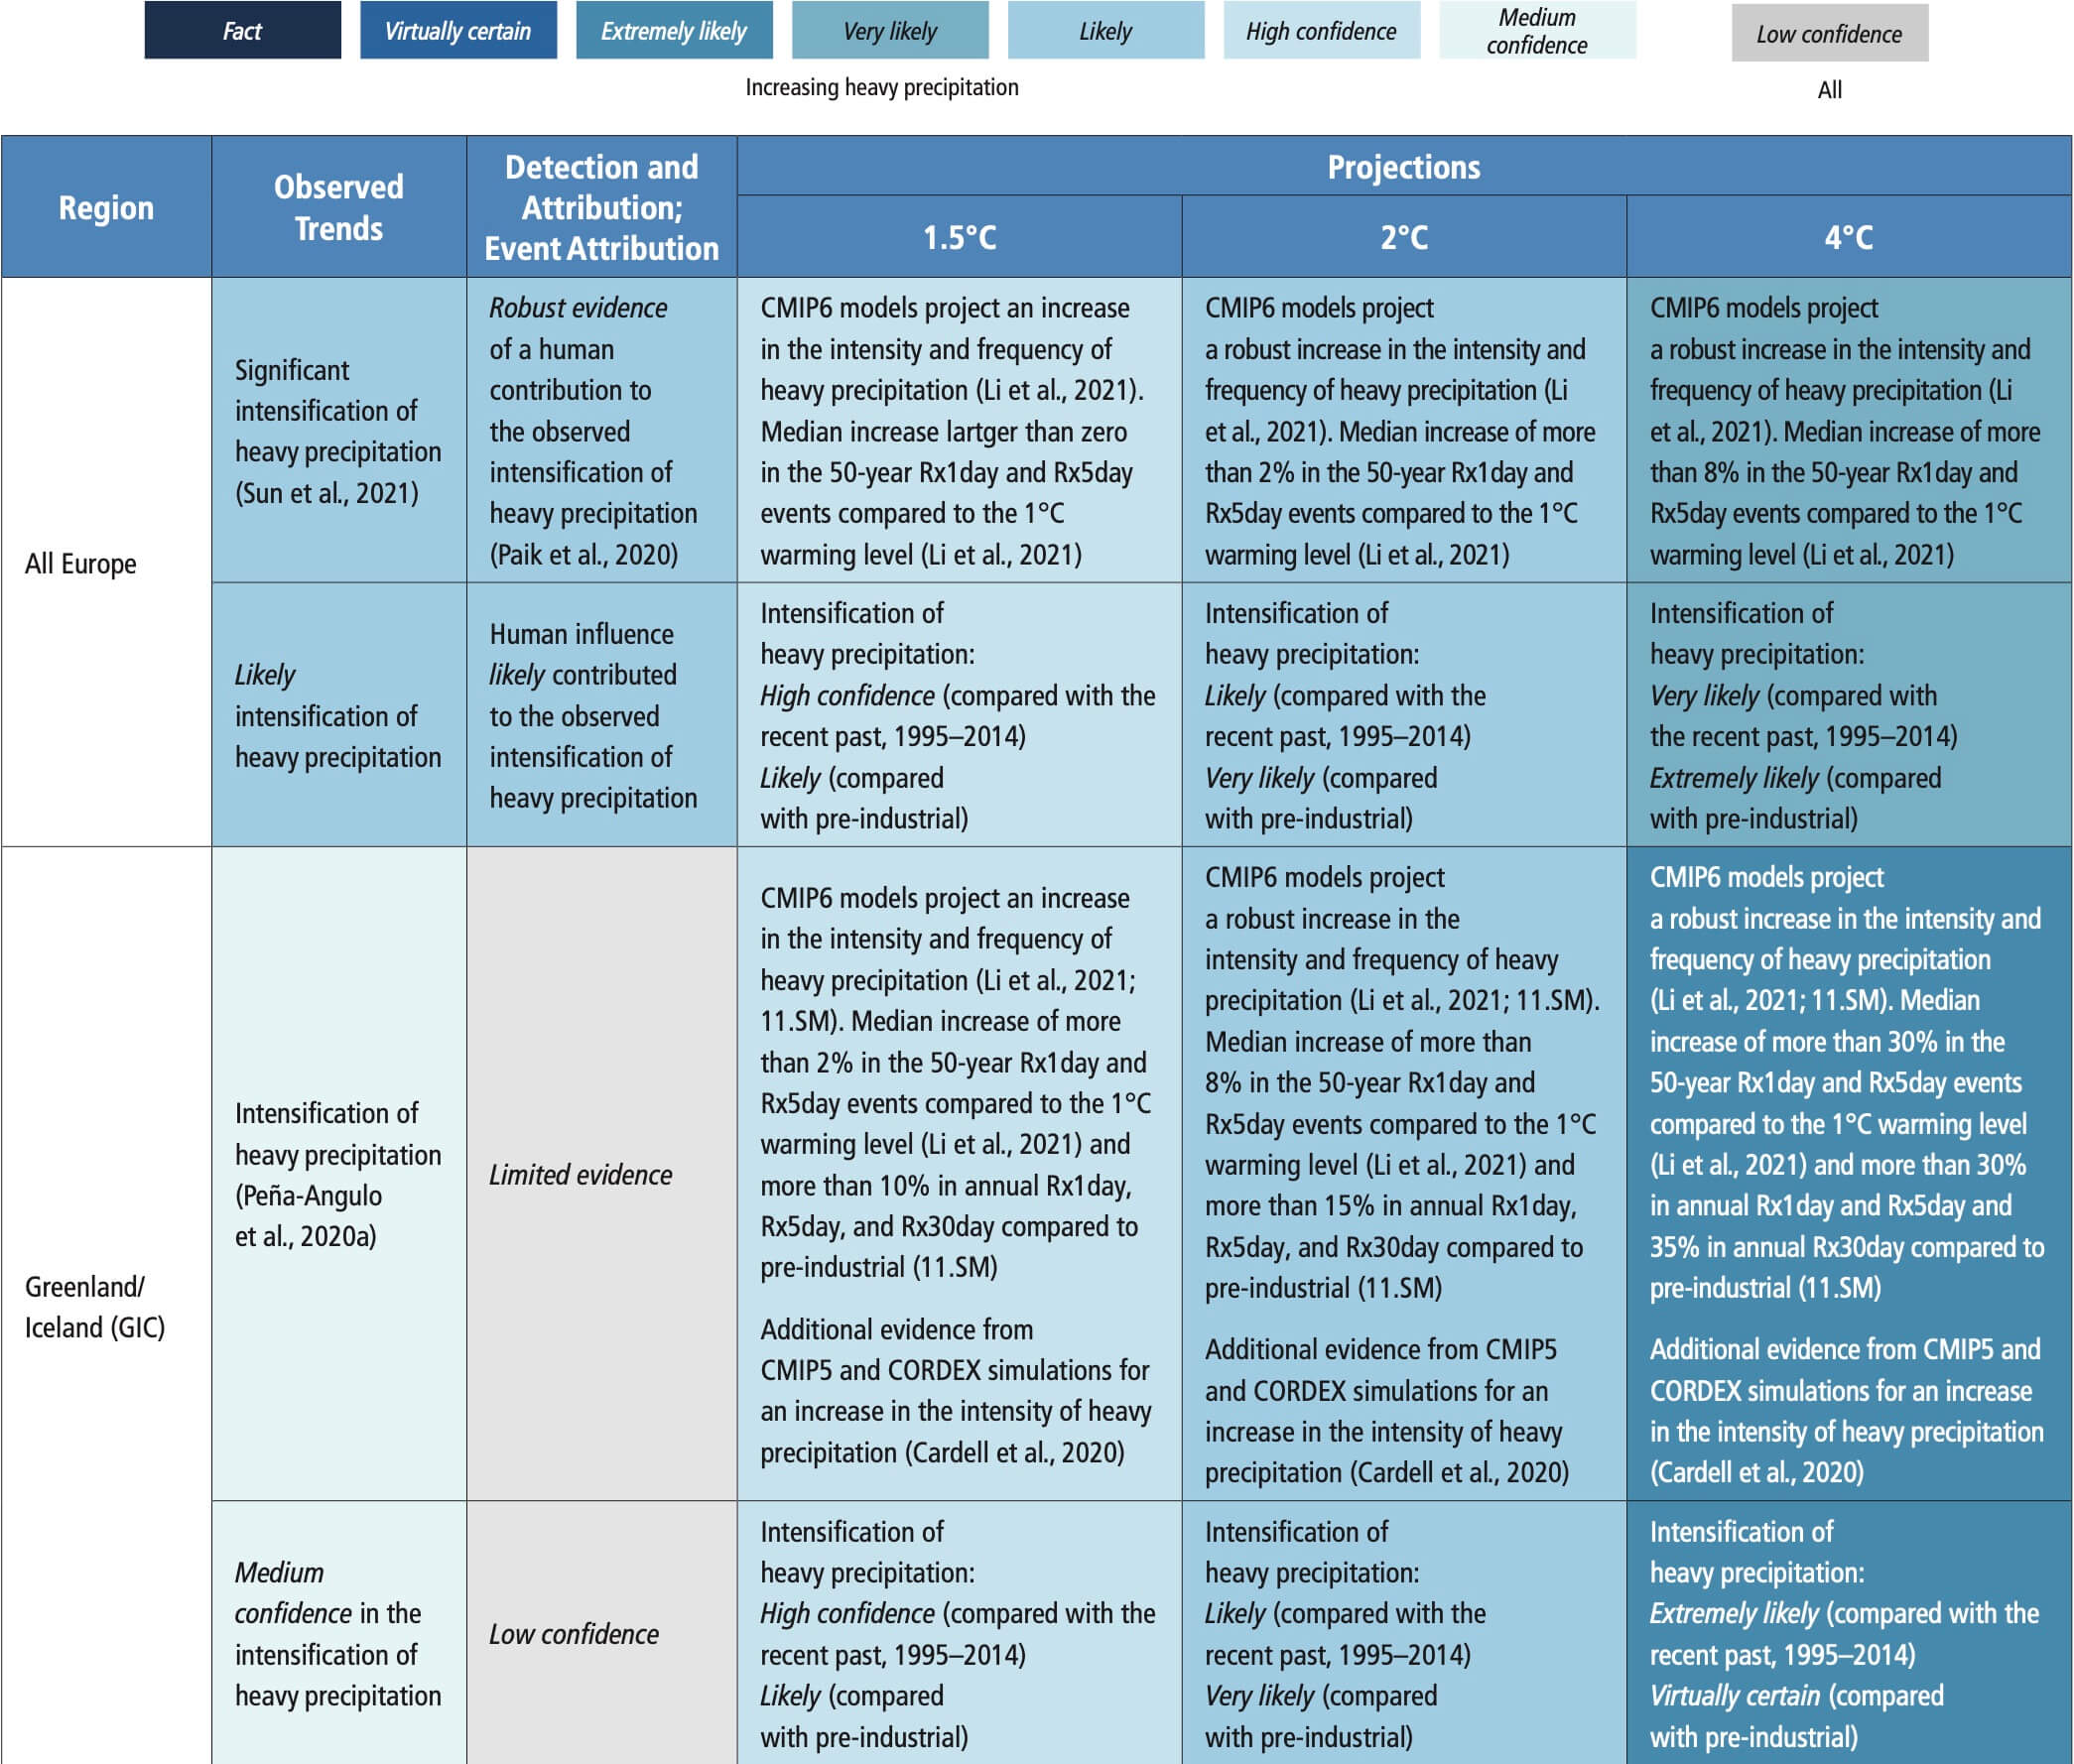
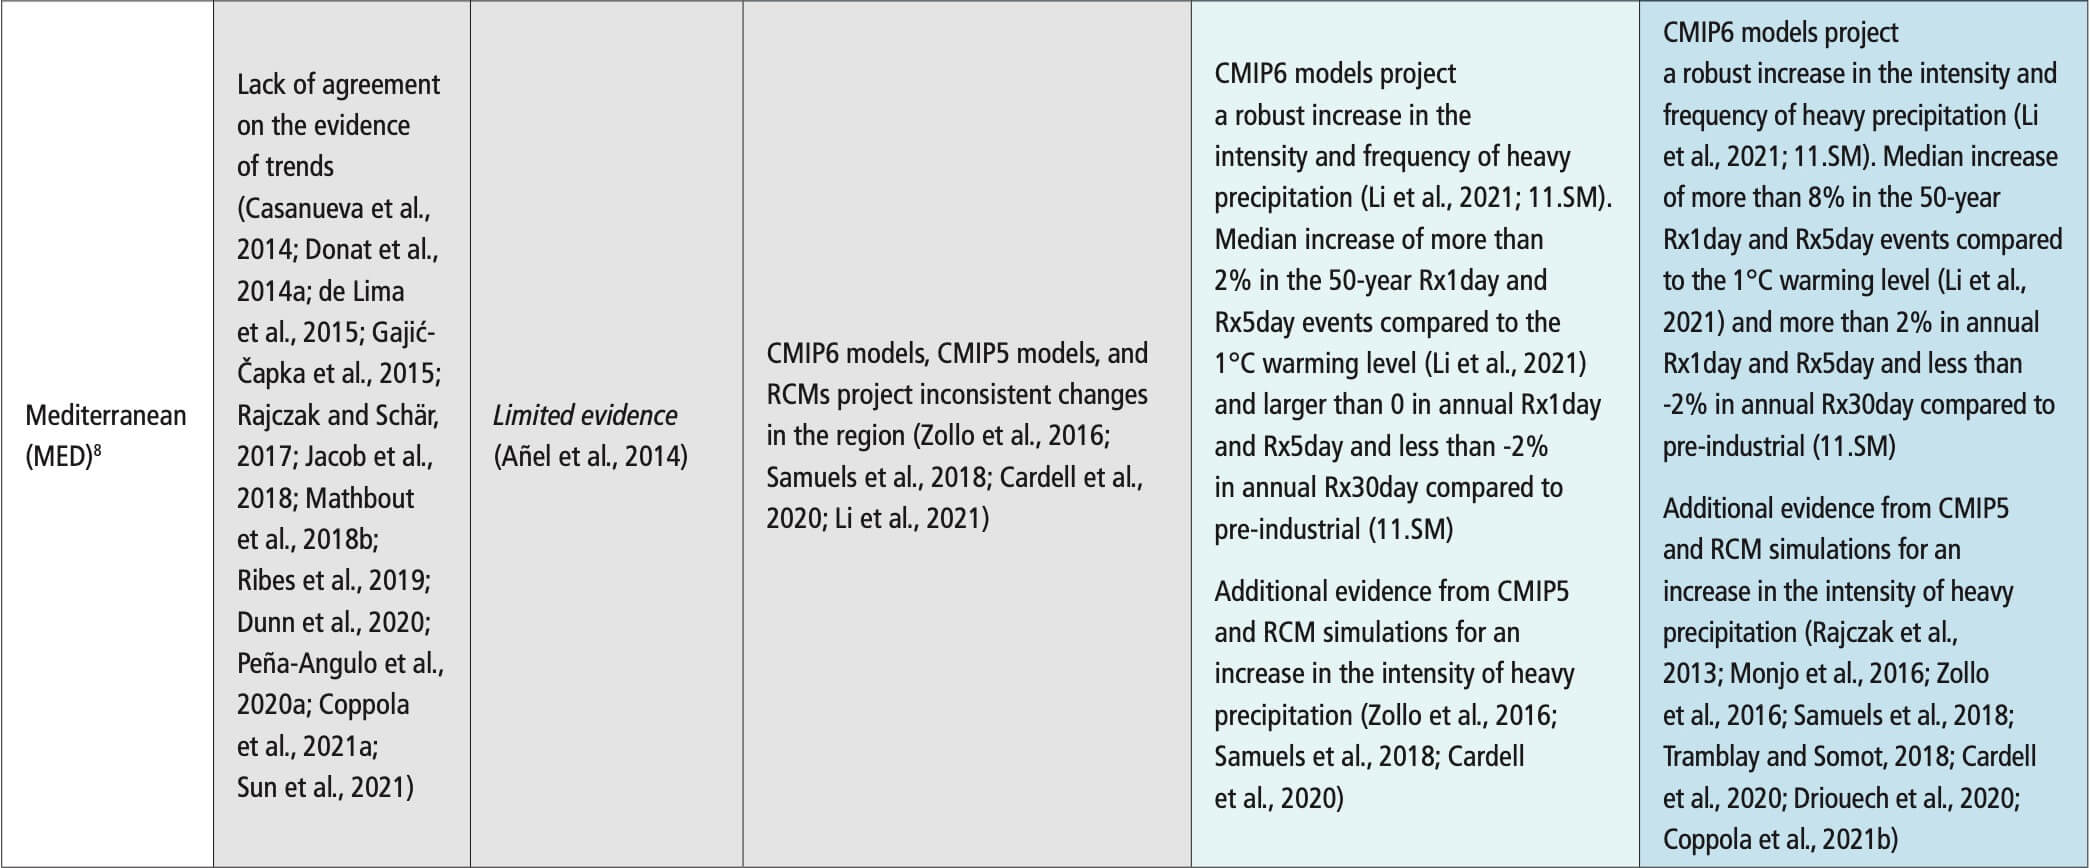
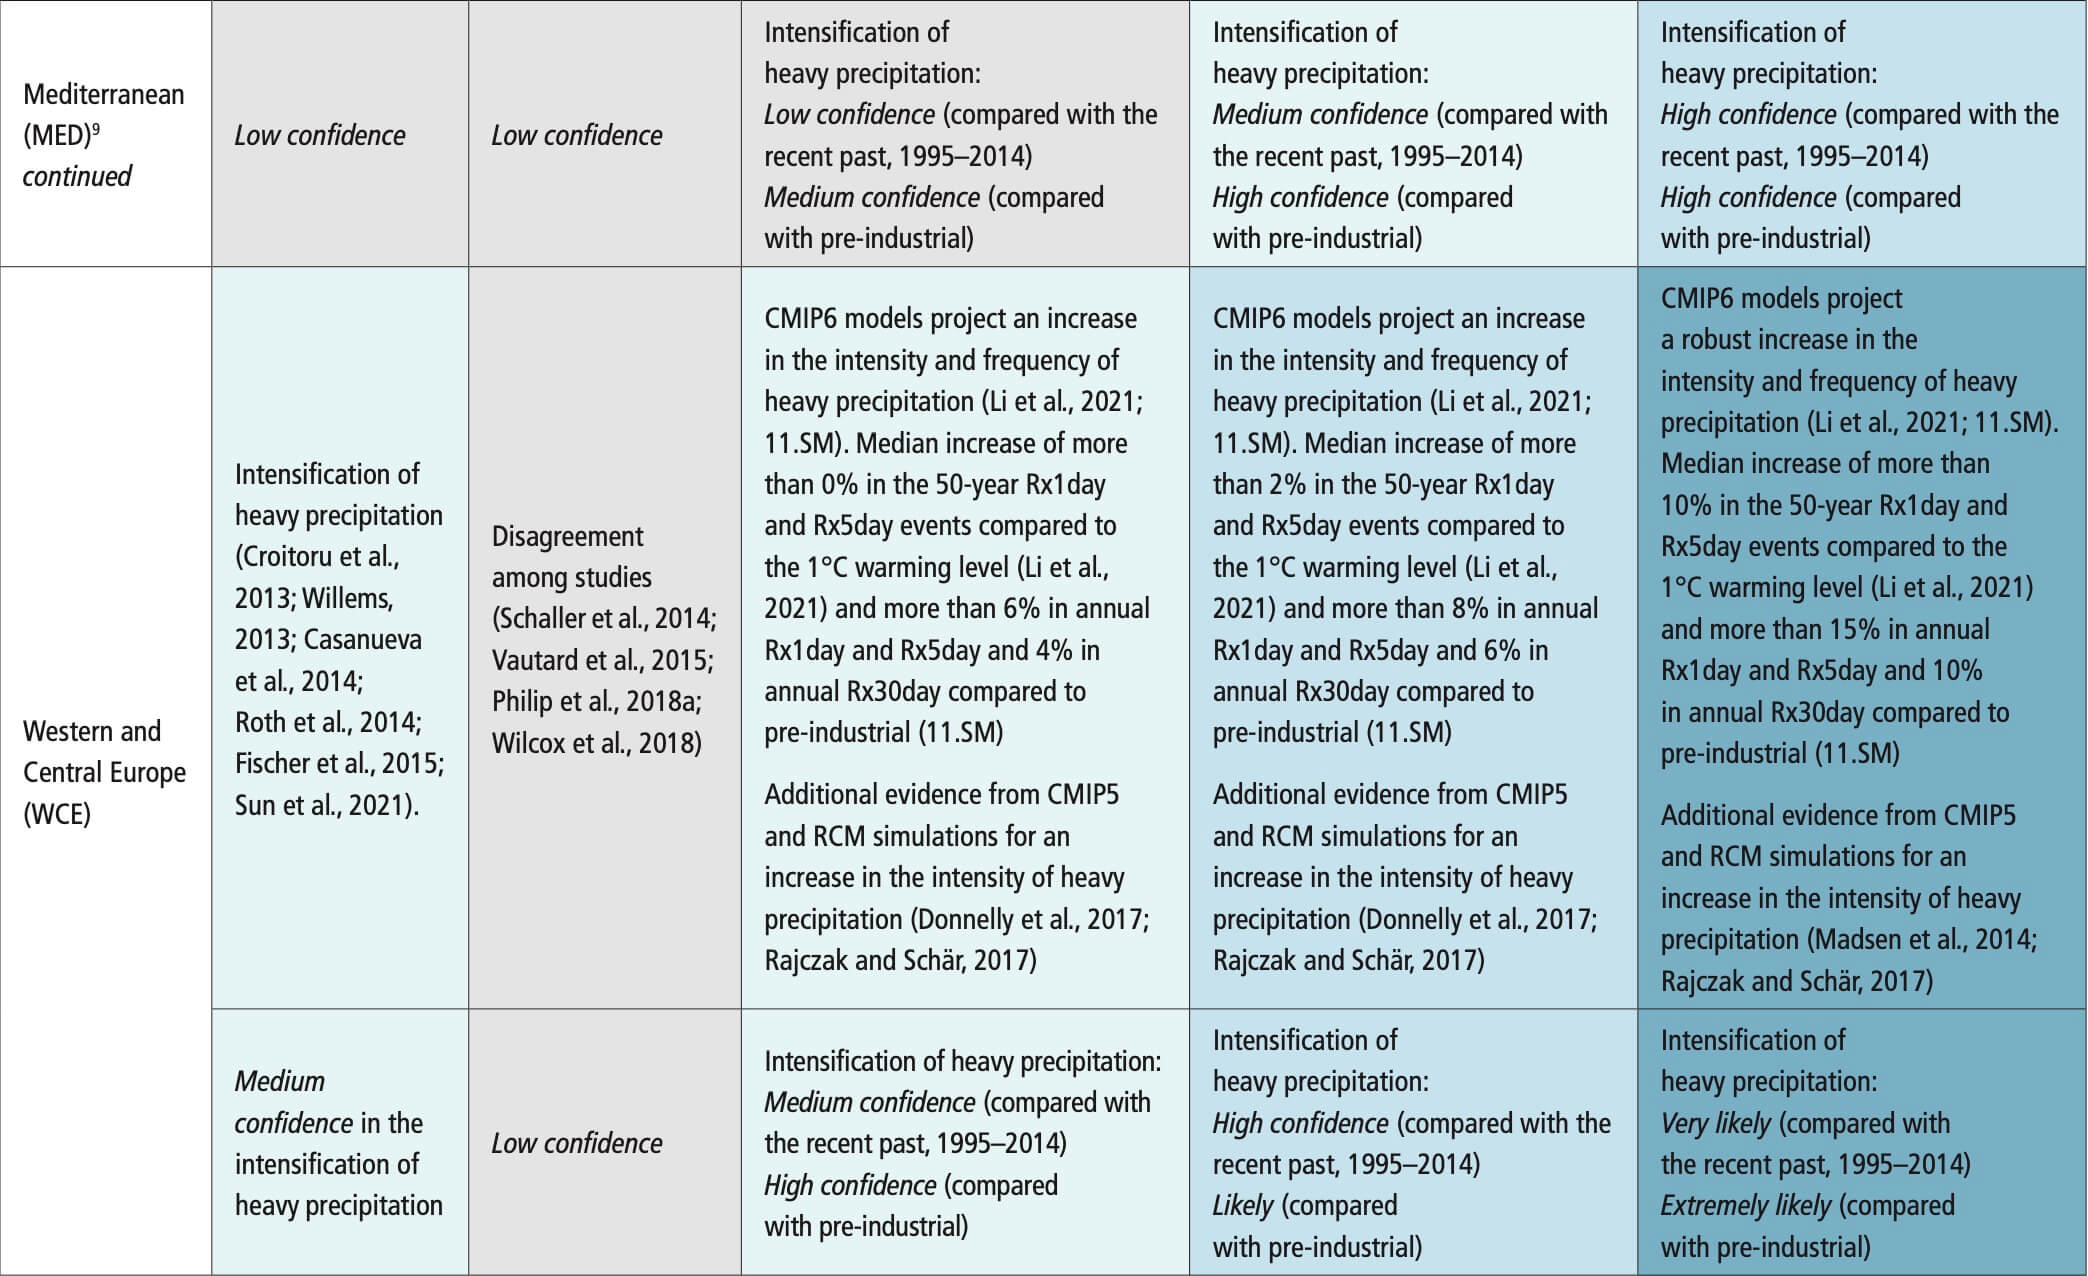
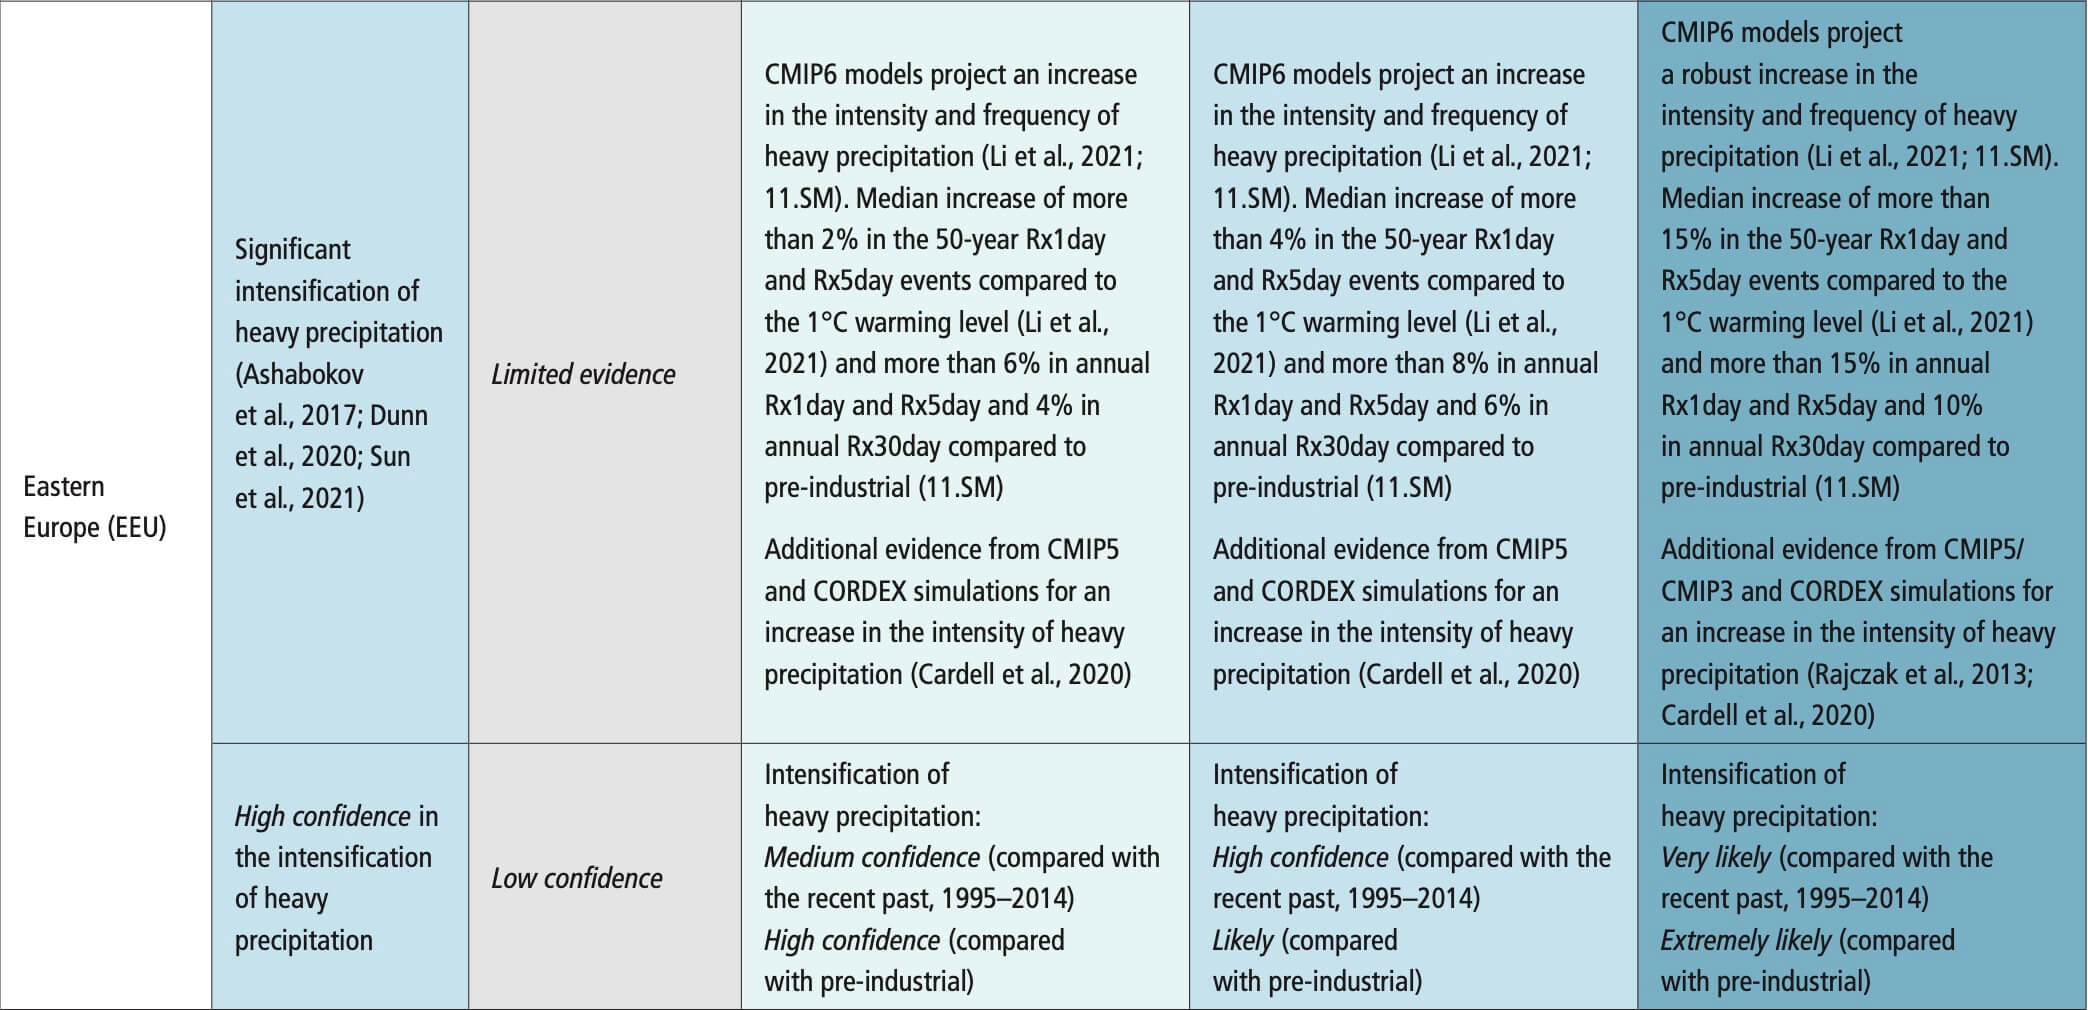
 Table 11.18 | Observed trends, human contribution to observed trends, and projected changes at 1.5°C, 2°C and 4°C of global warming for meteorological droughts (MET), agricultural and ecological droughts (AGR/ECOL), and hydrological droughts (HYDR) in Europe, subdivided by AR6 regions. See Sections 11.9.1 and 11.9.4 for details.
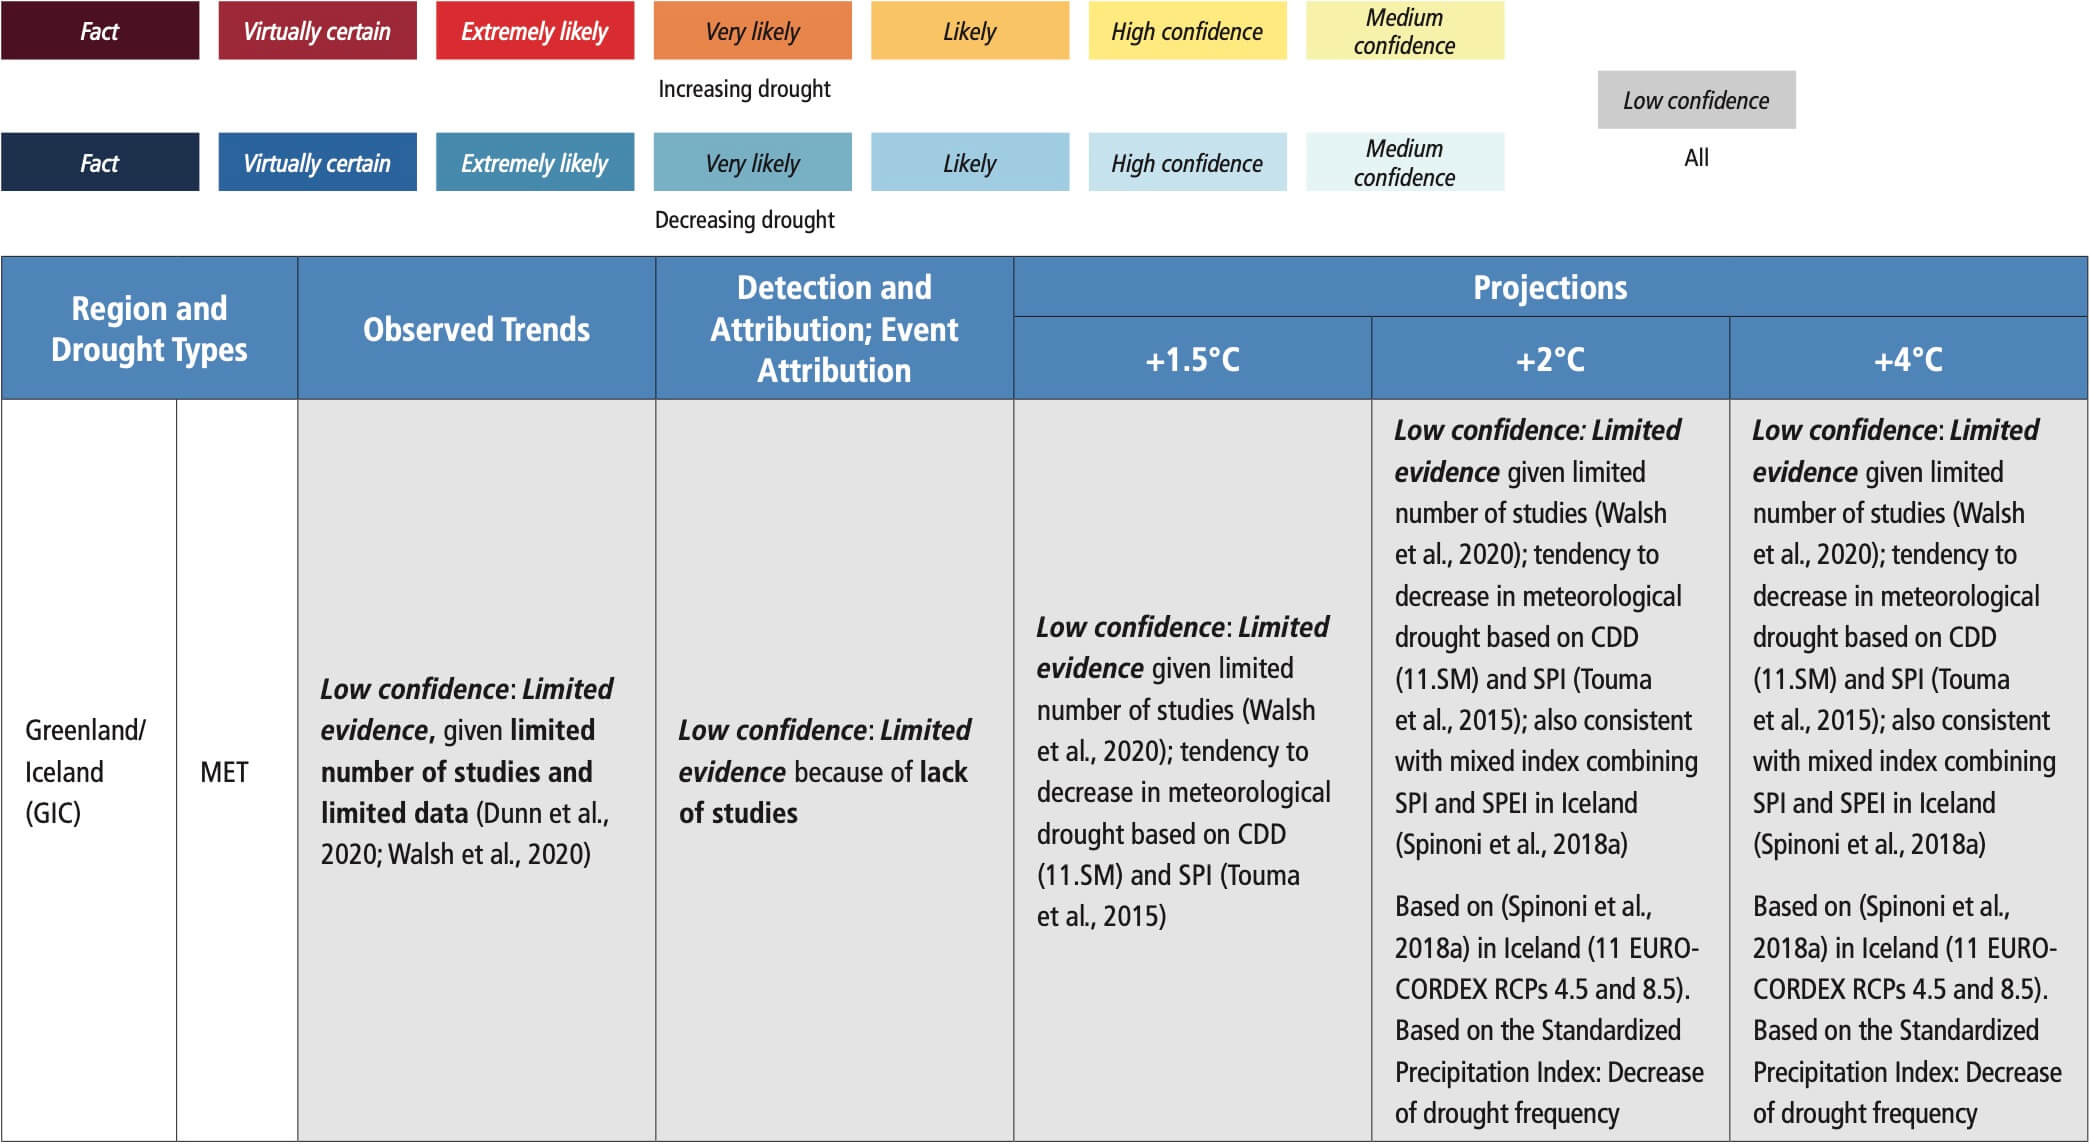
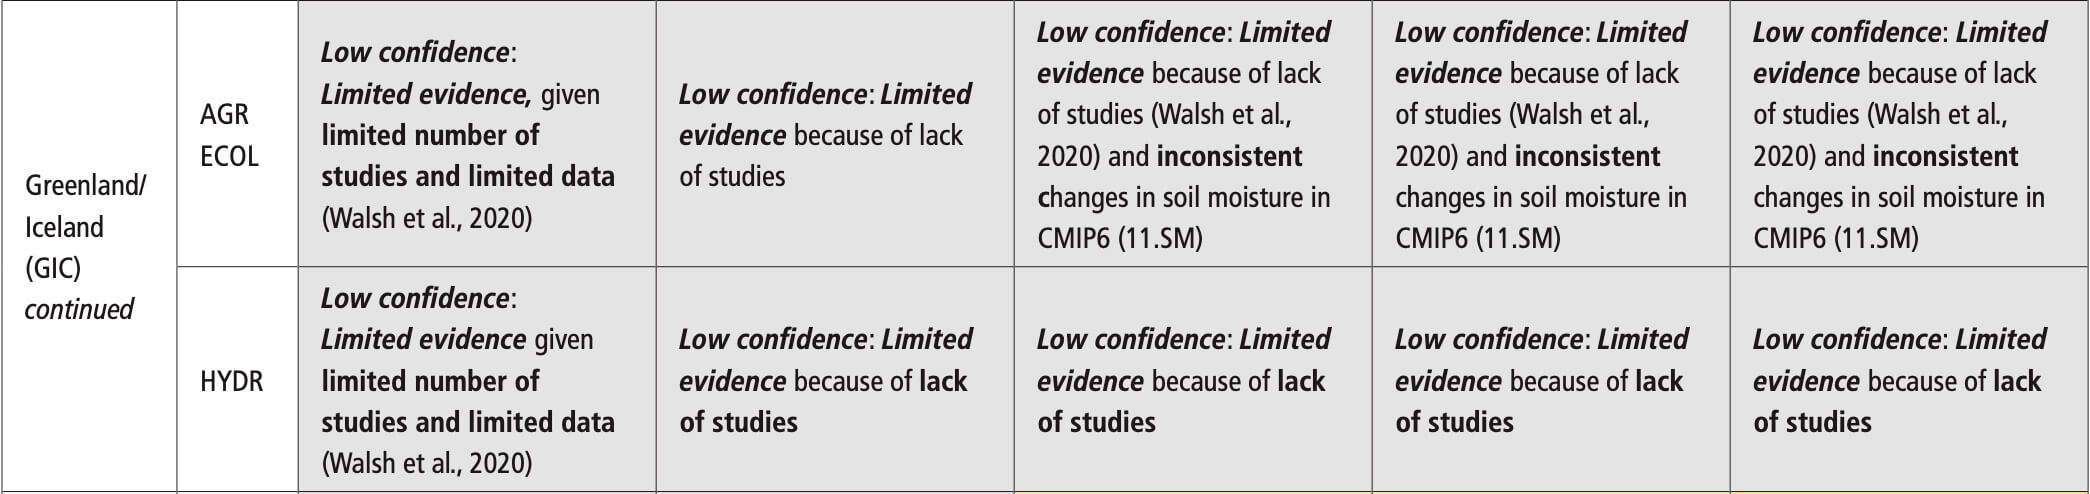
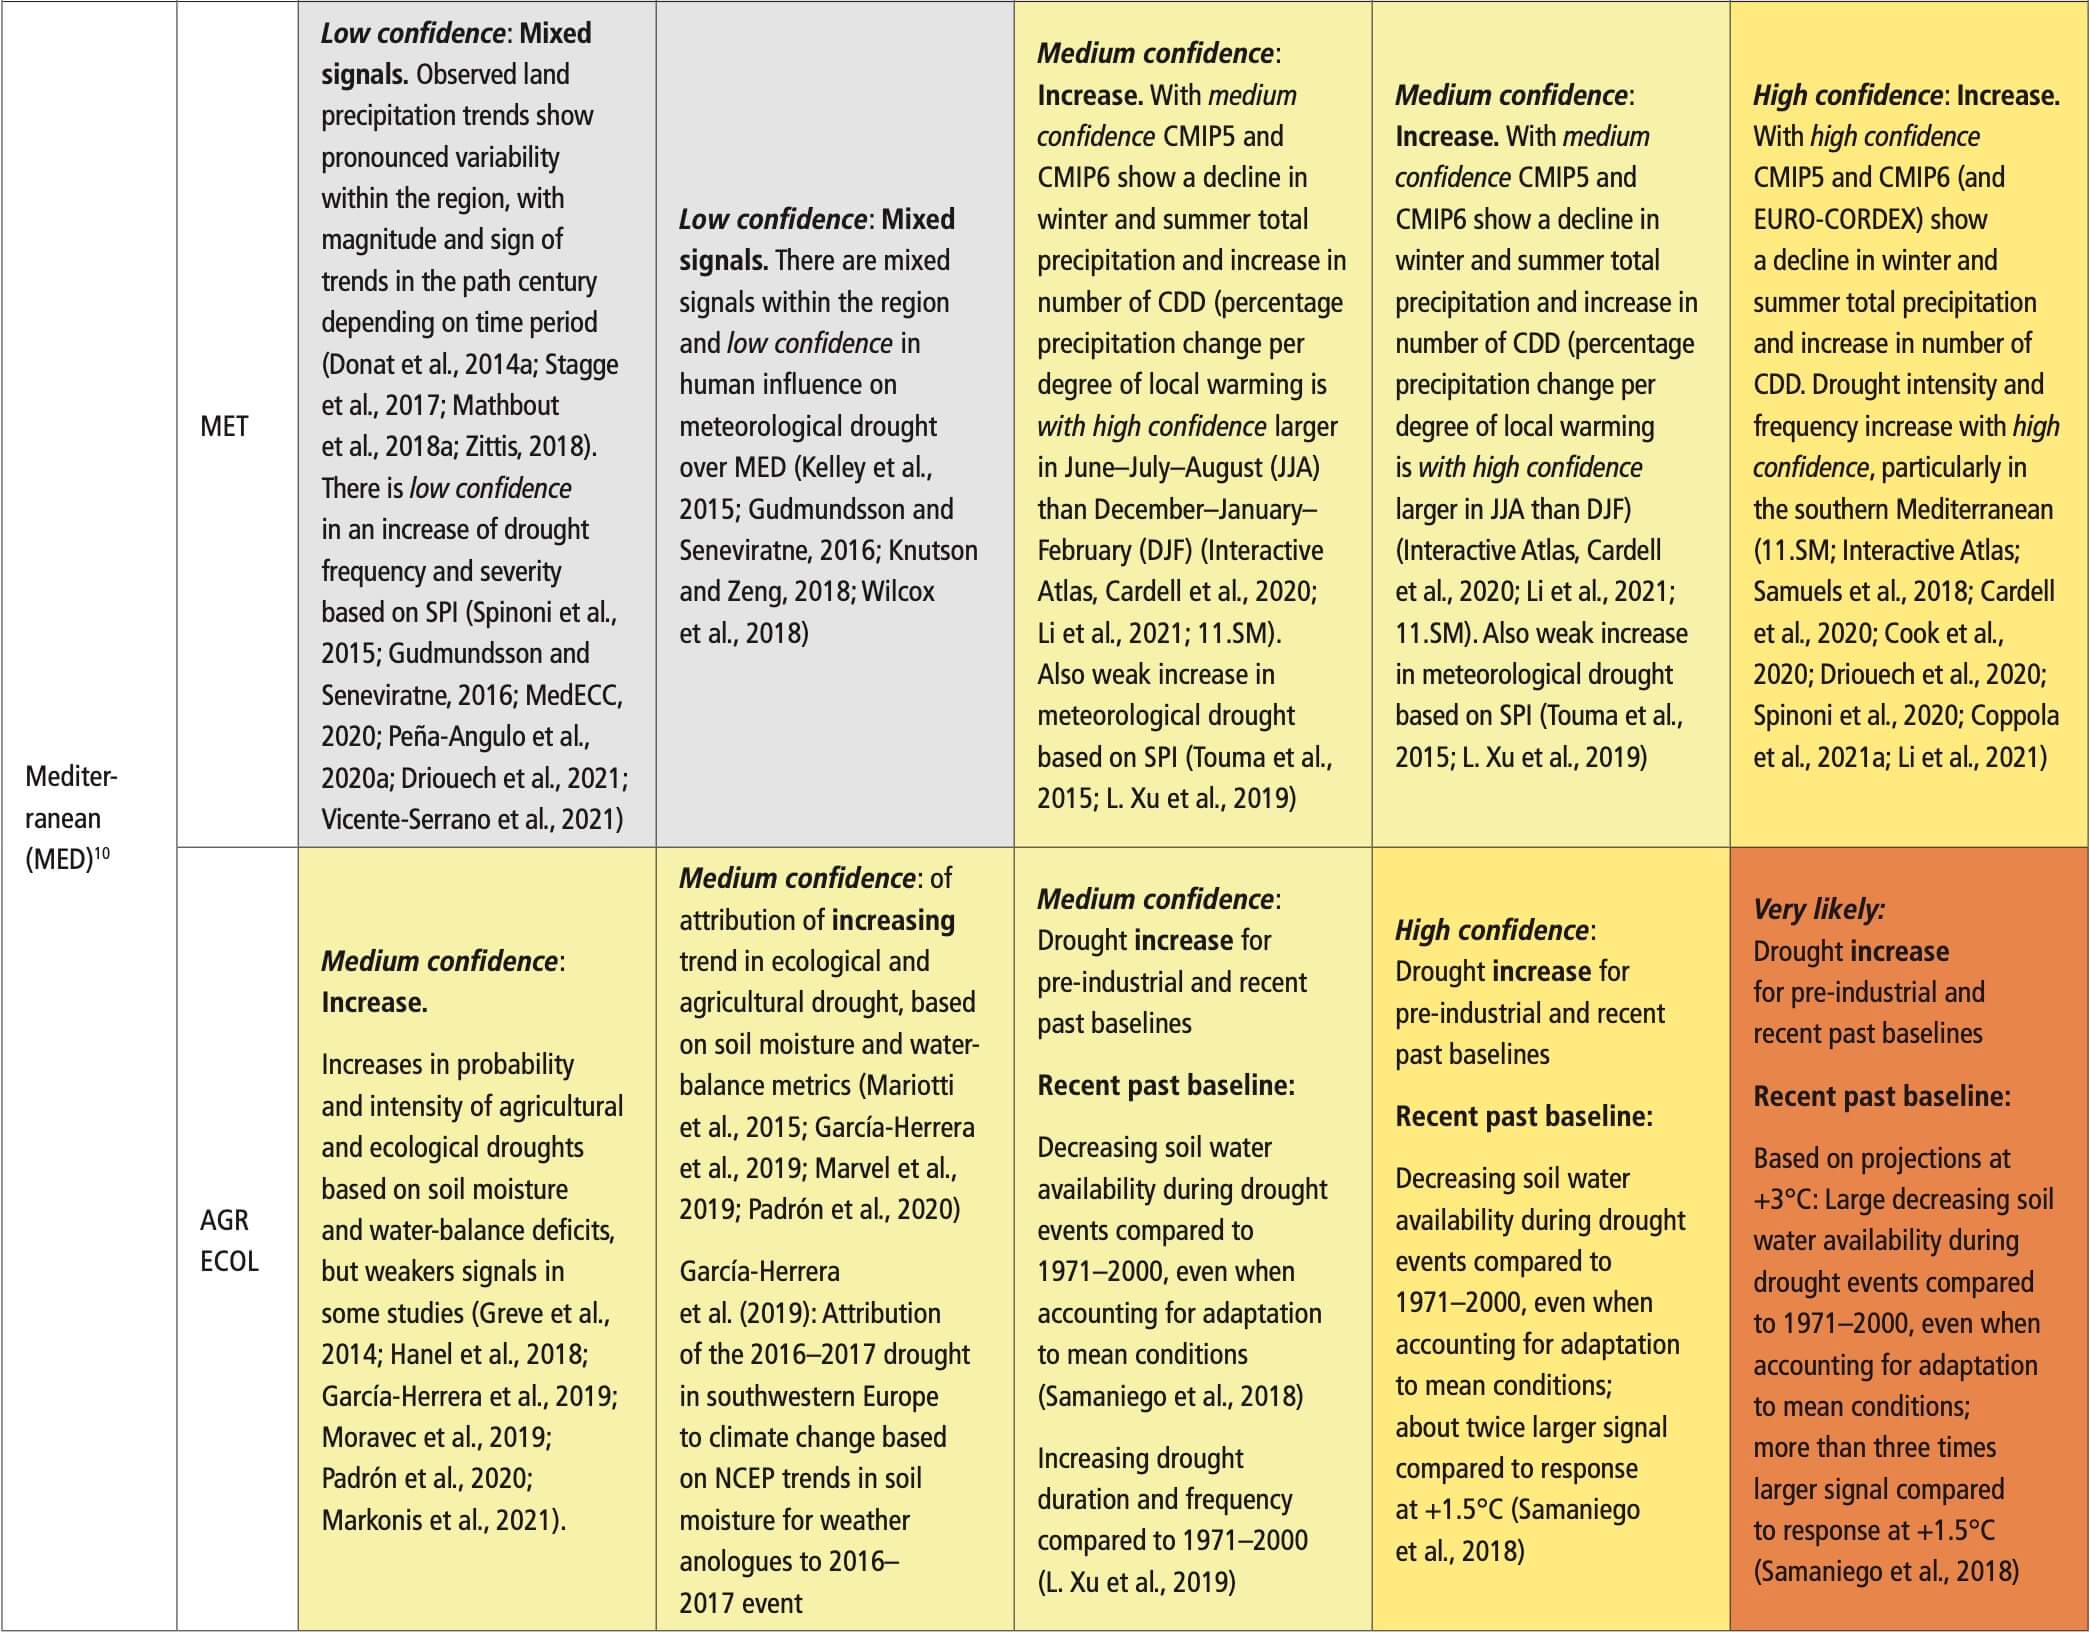
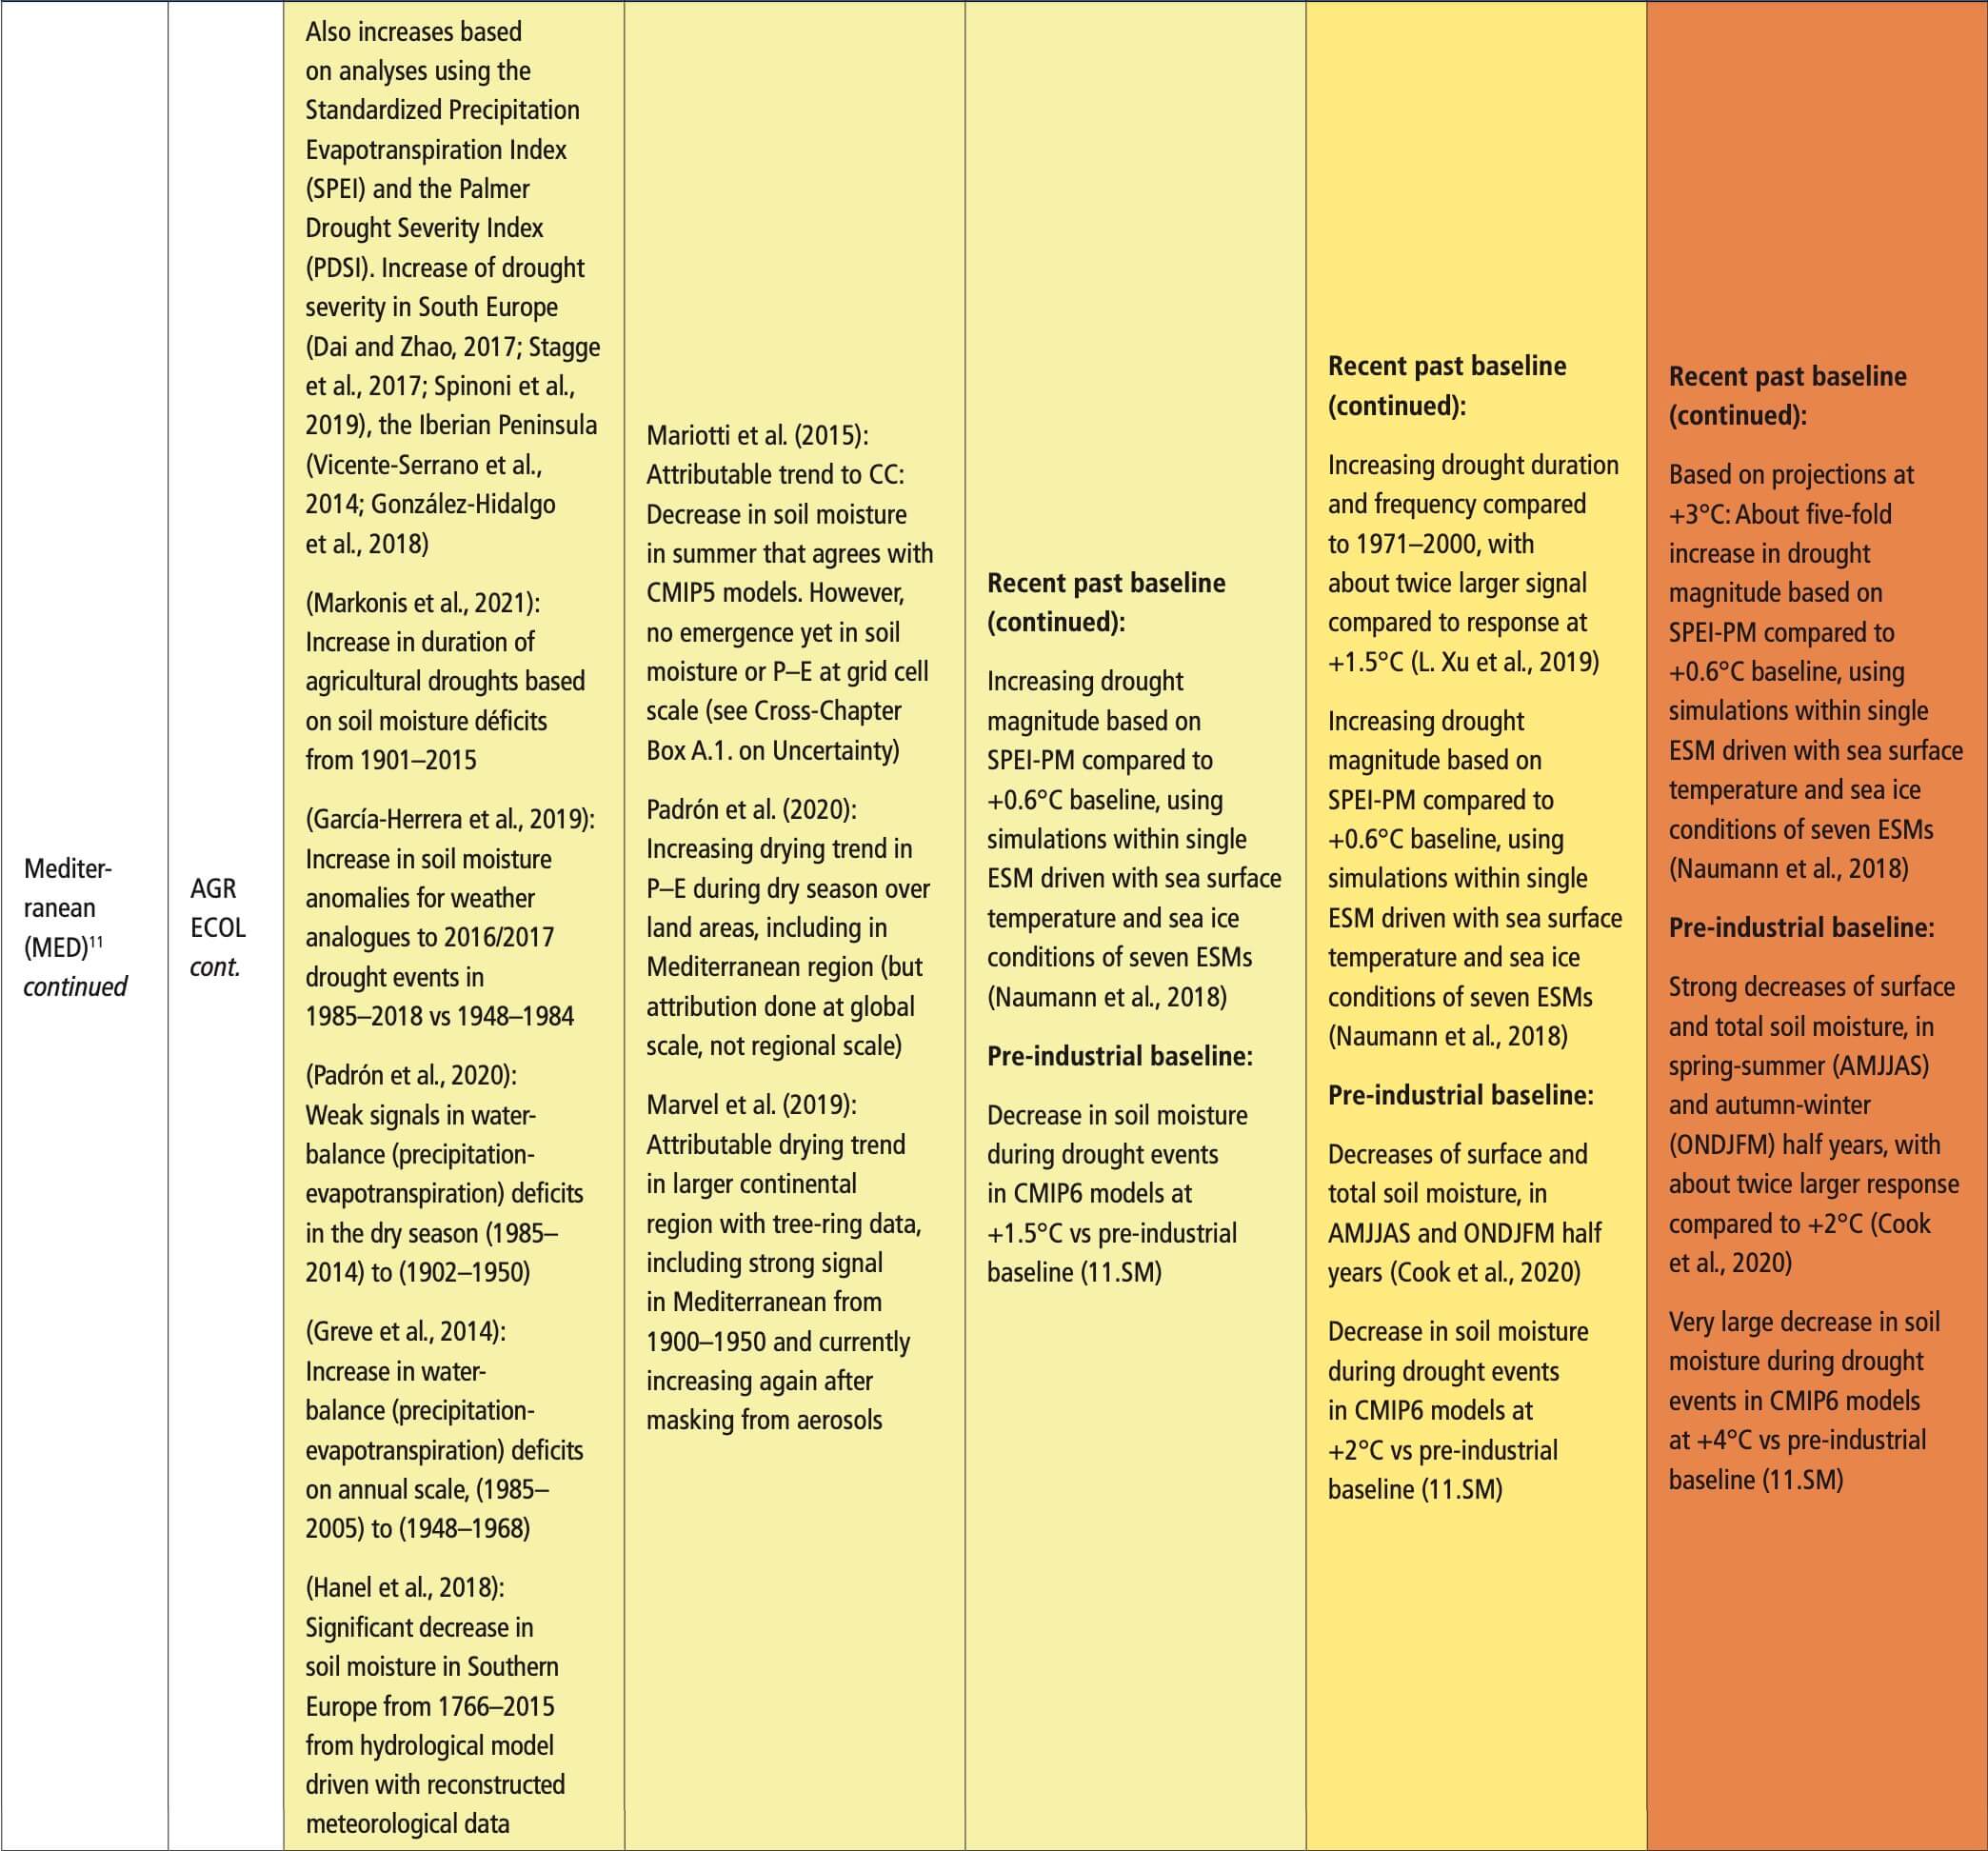
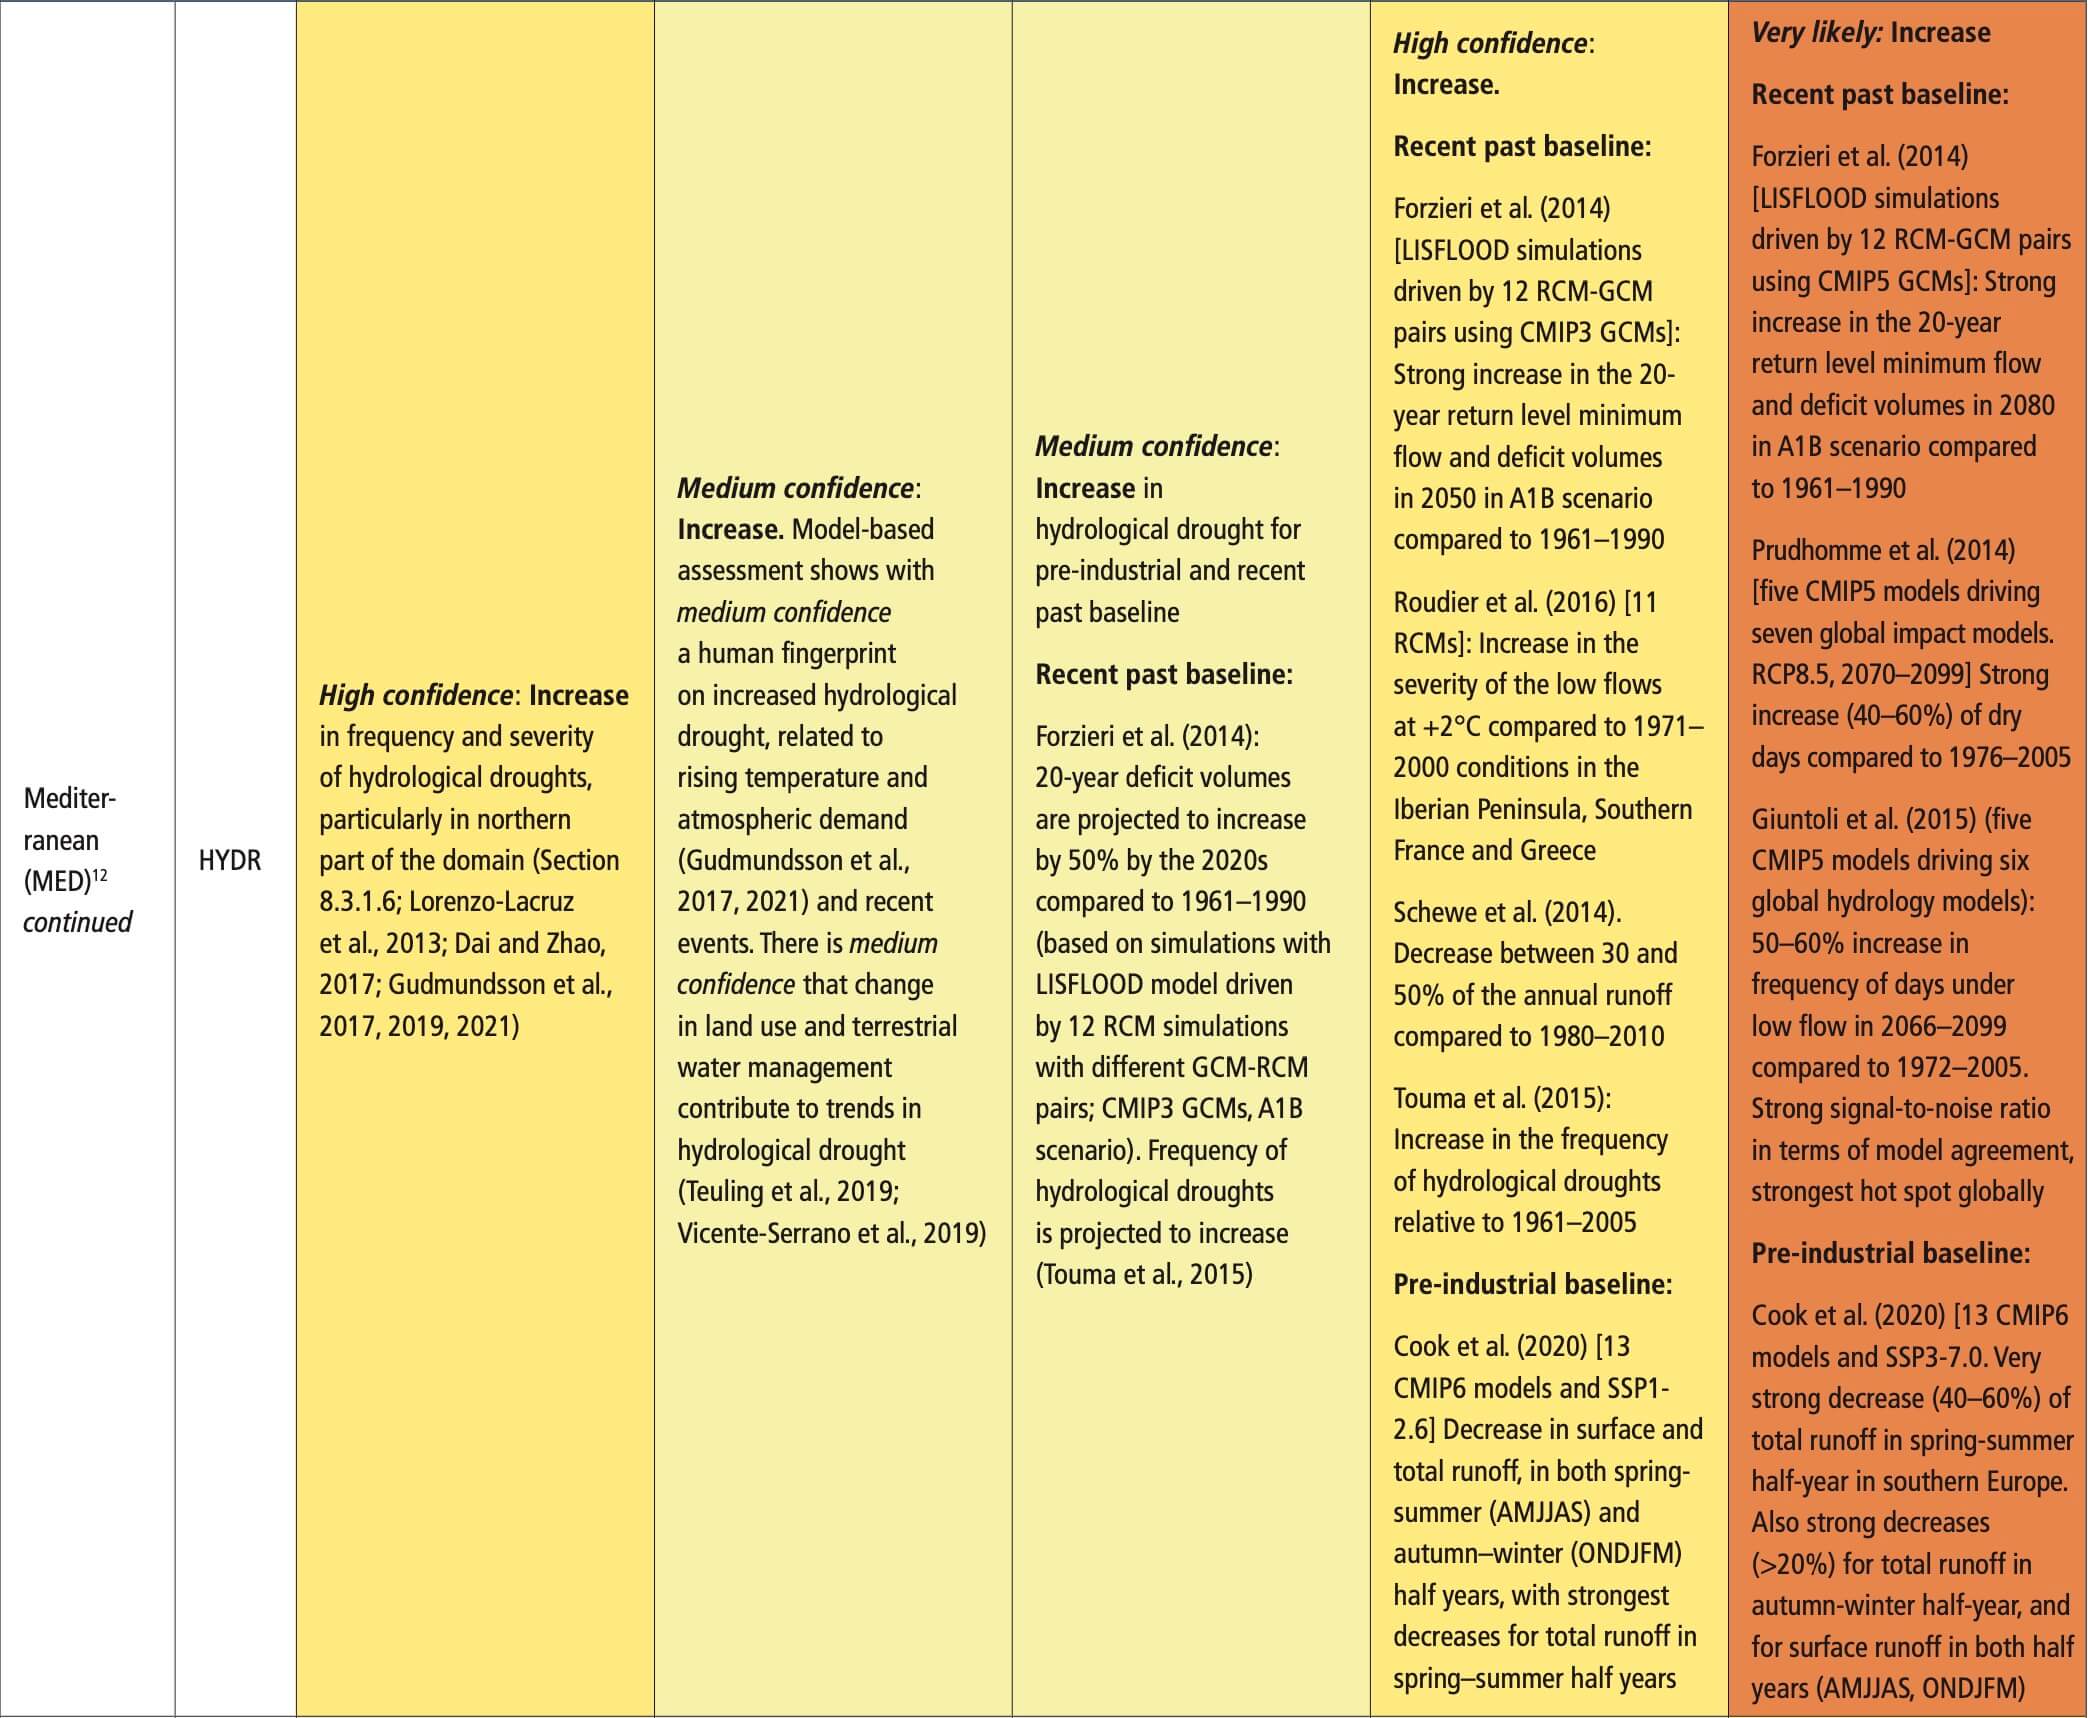
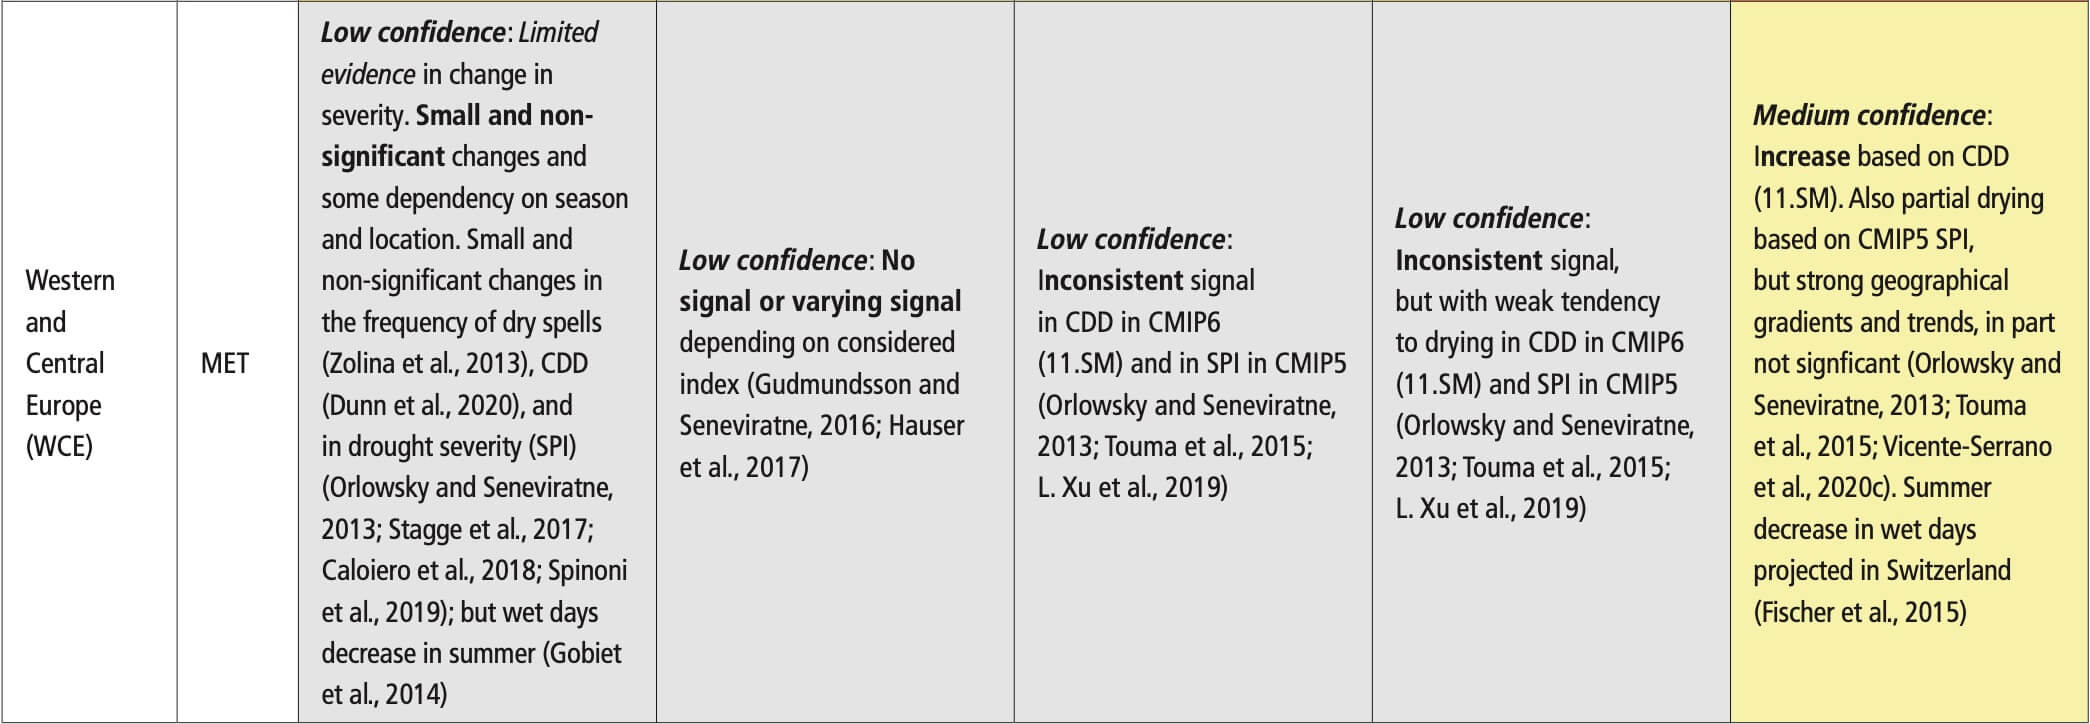
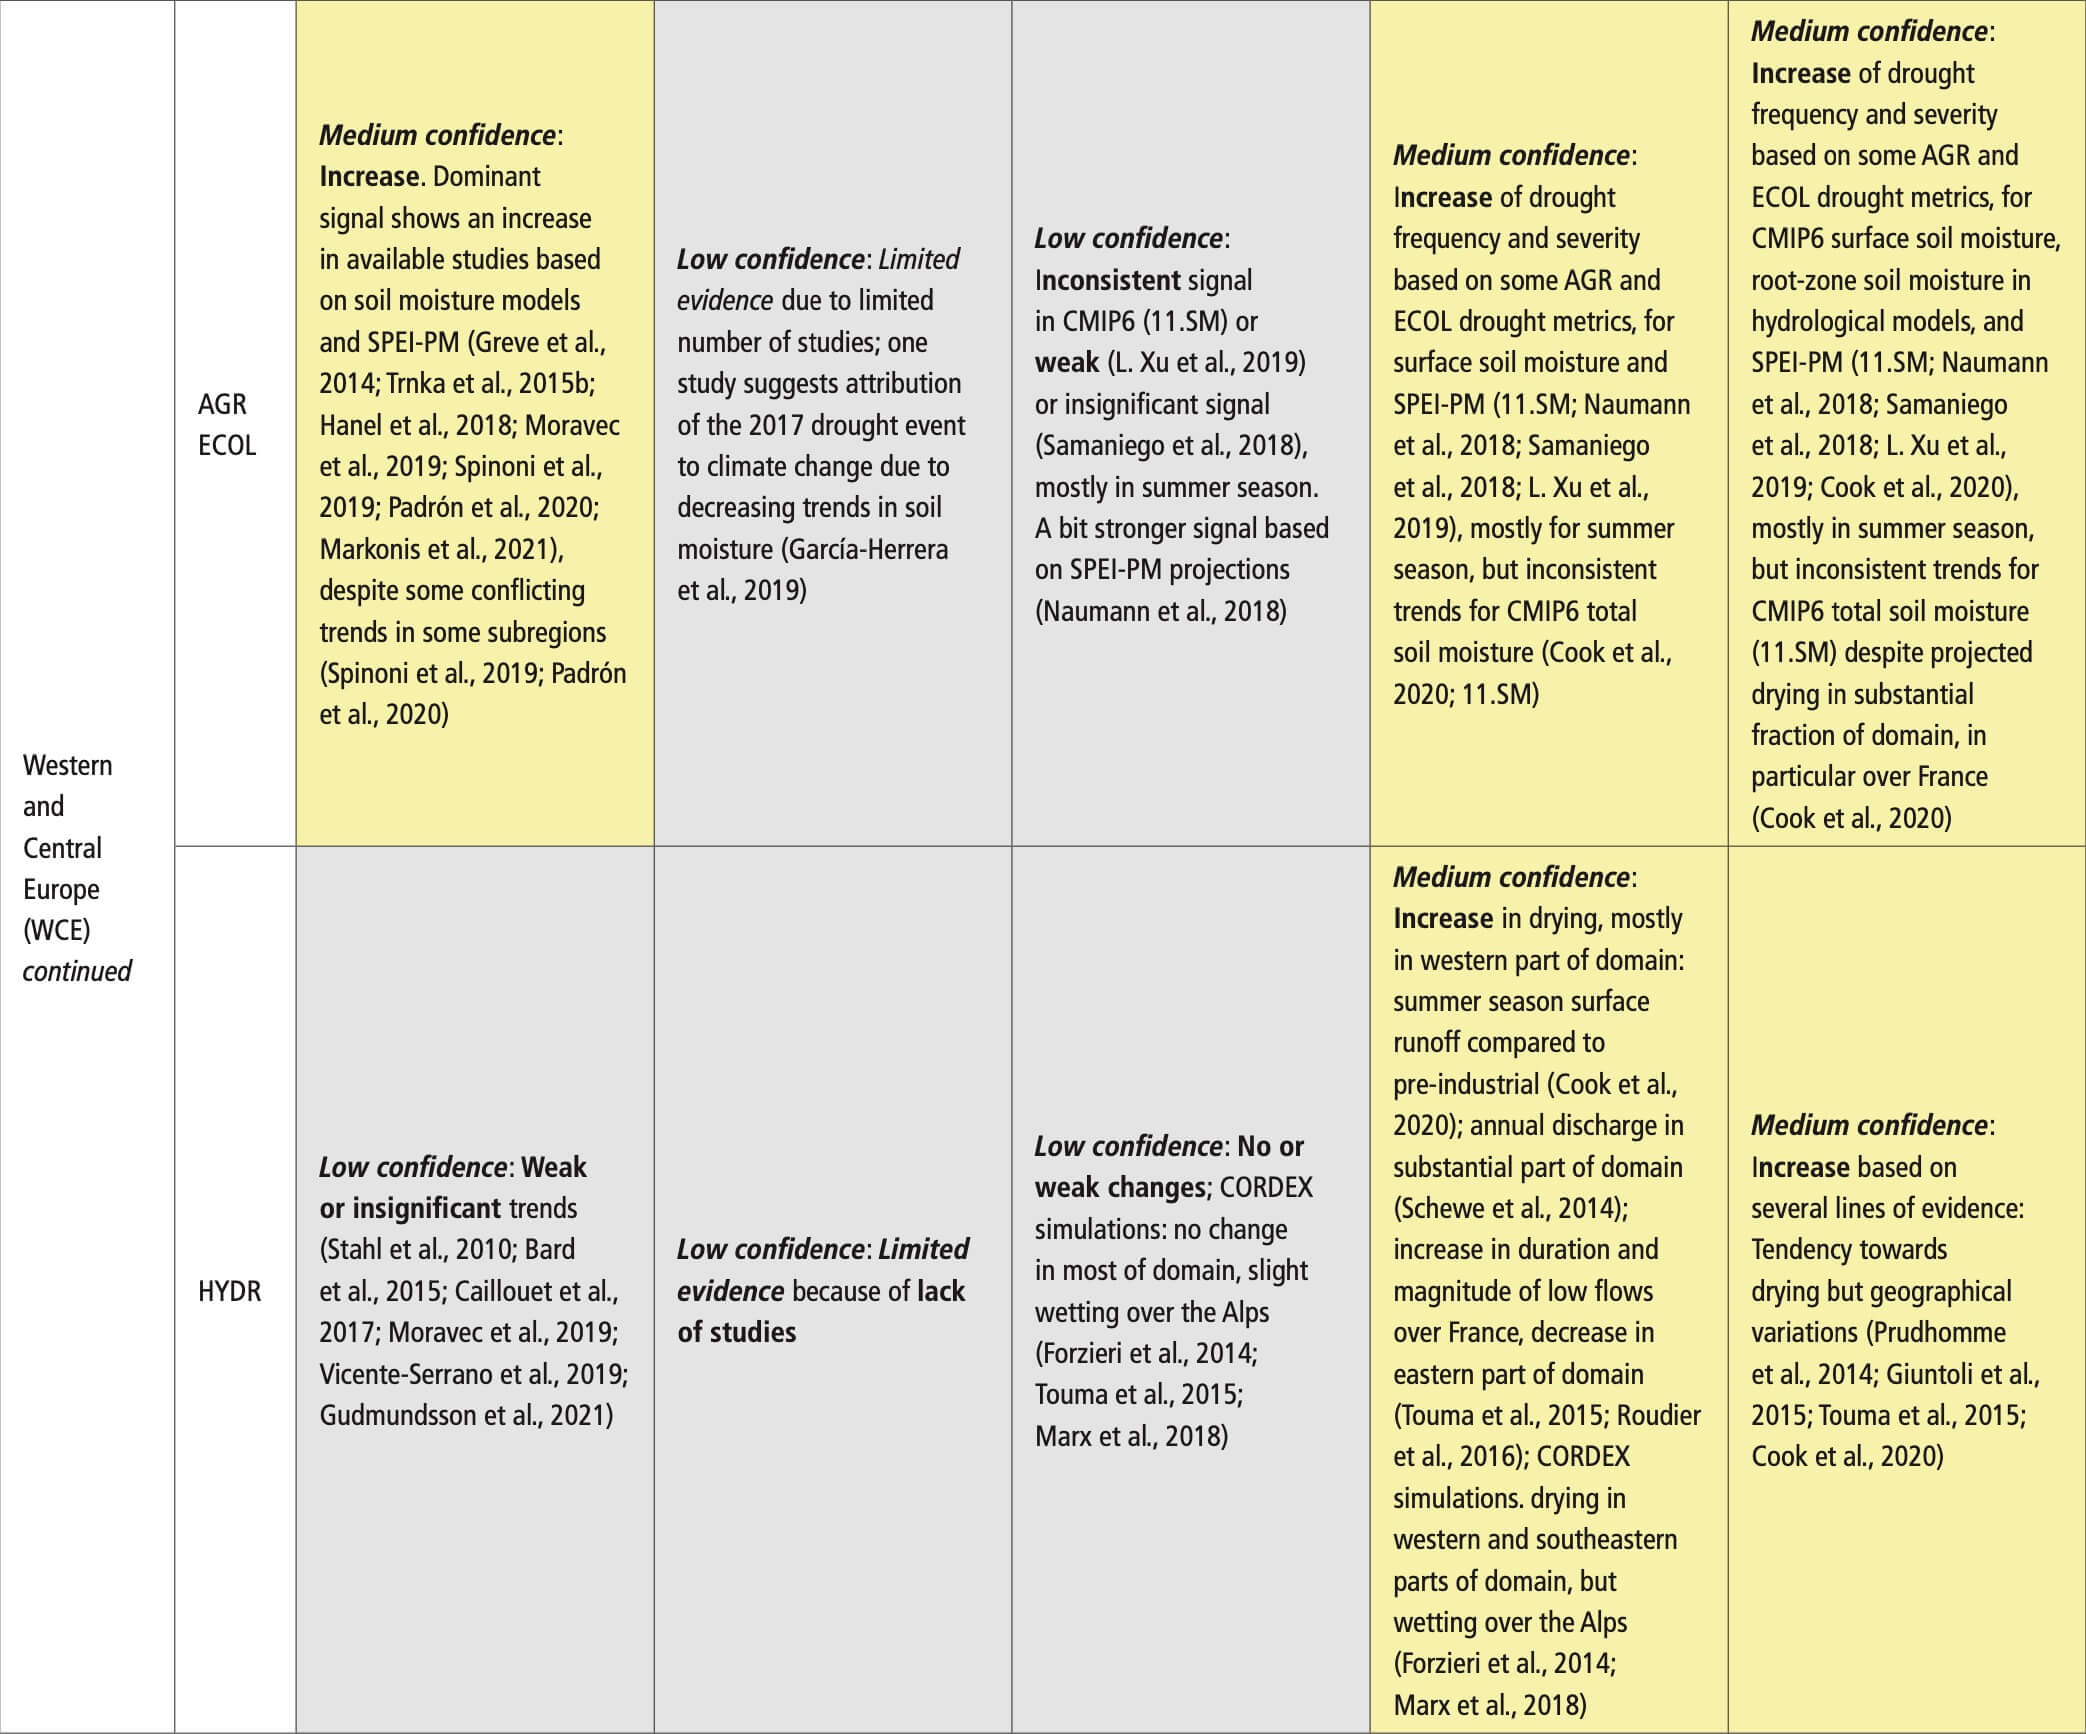
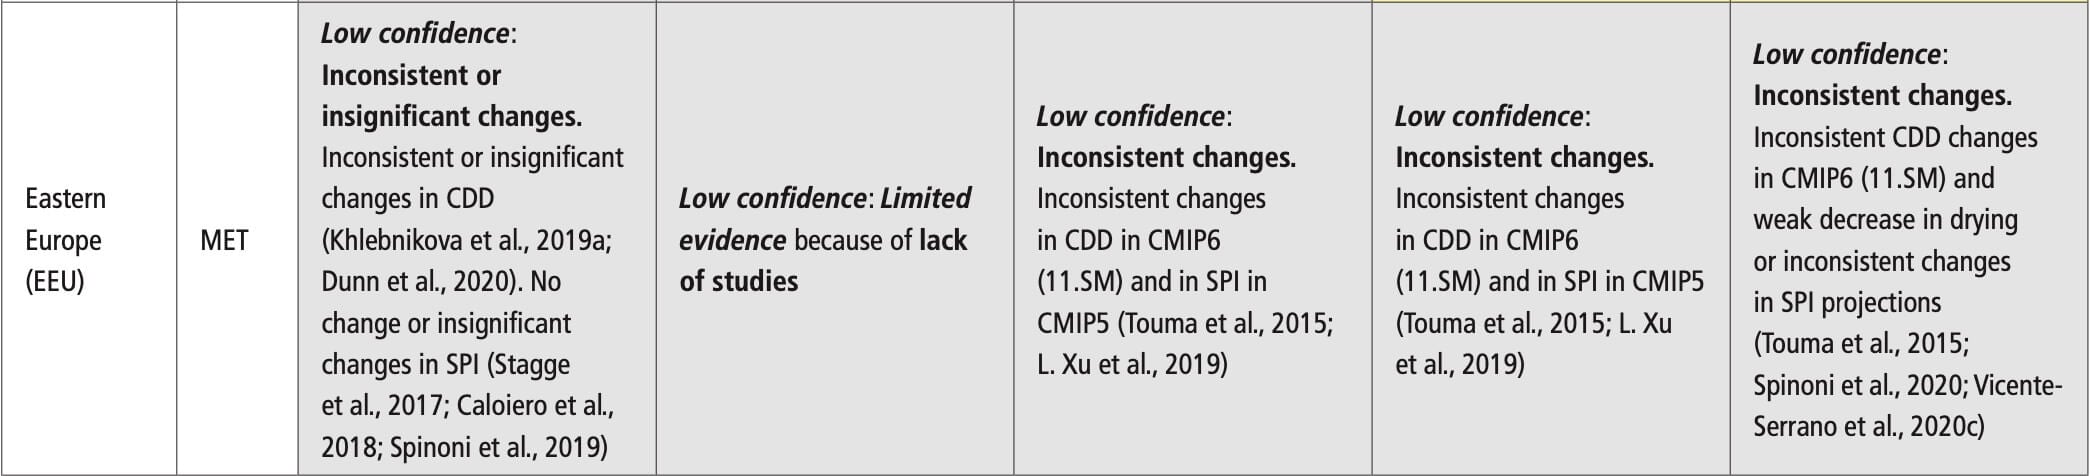
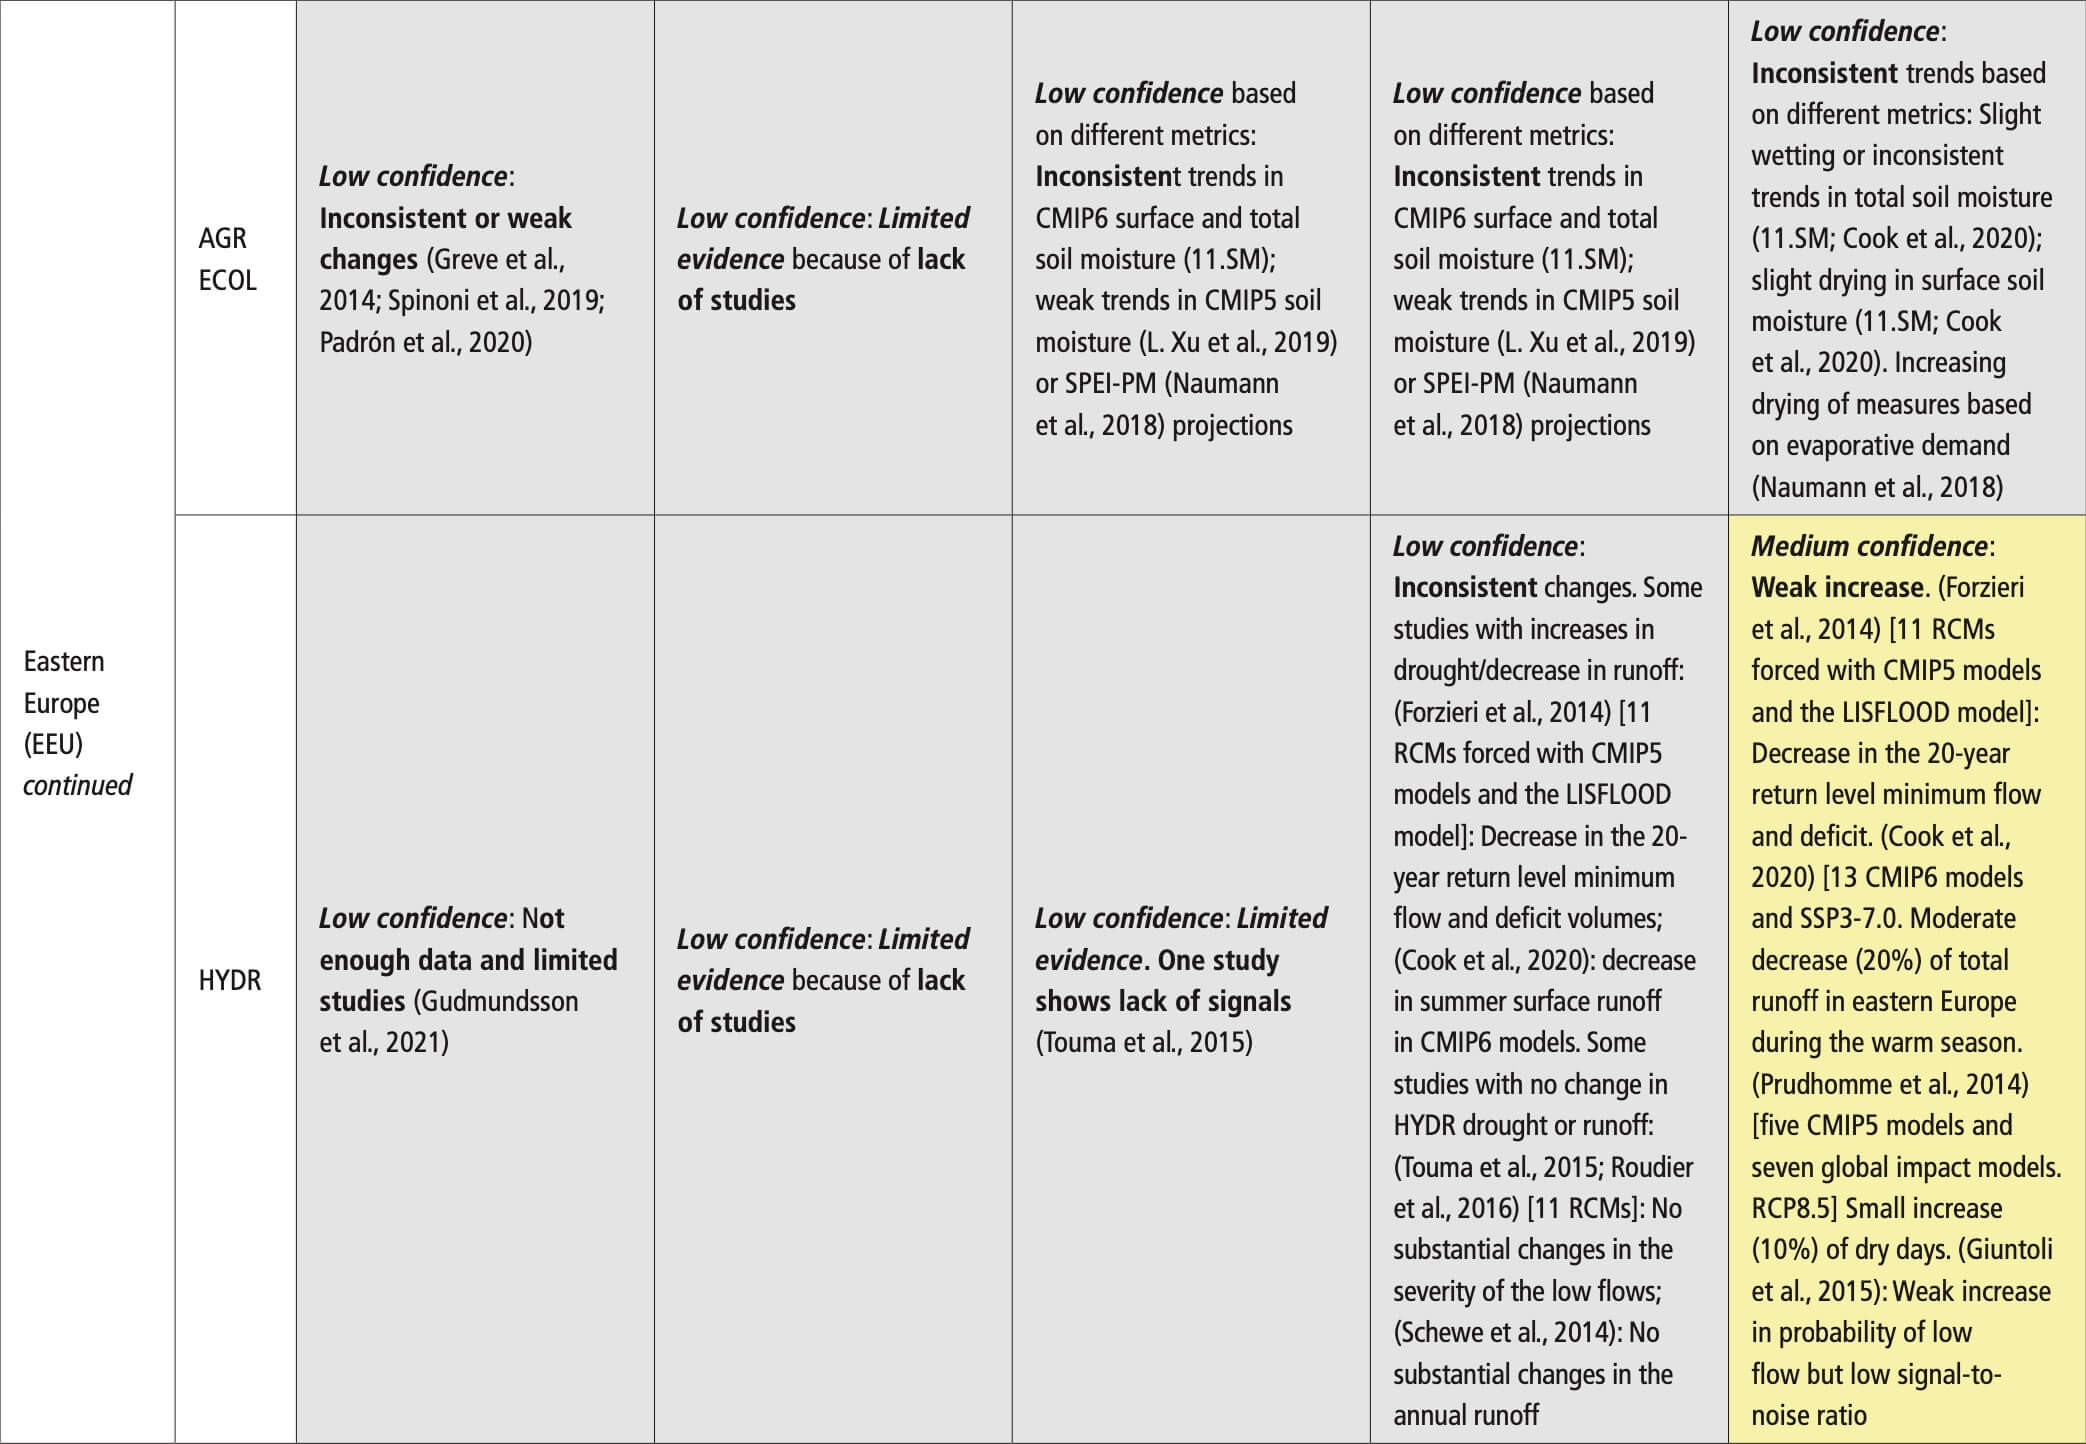
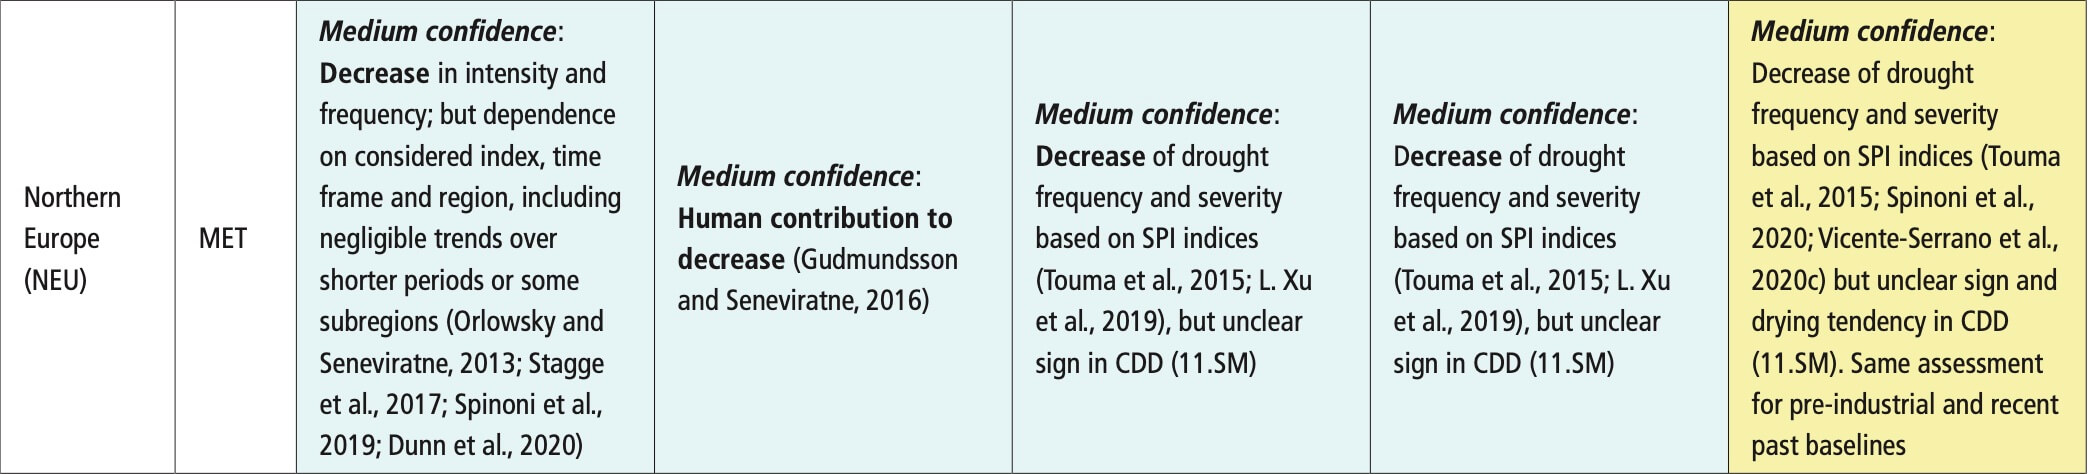
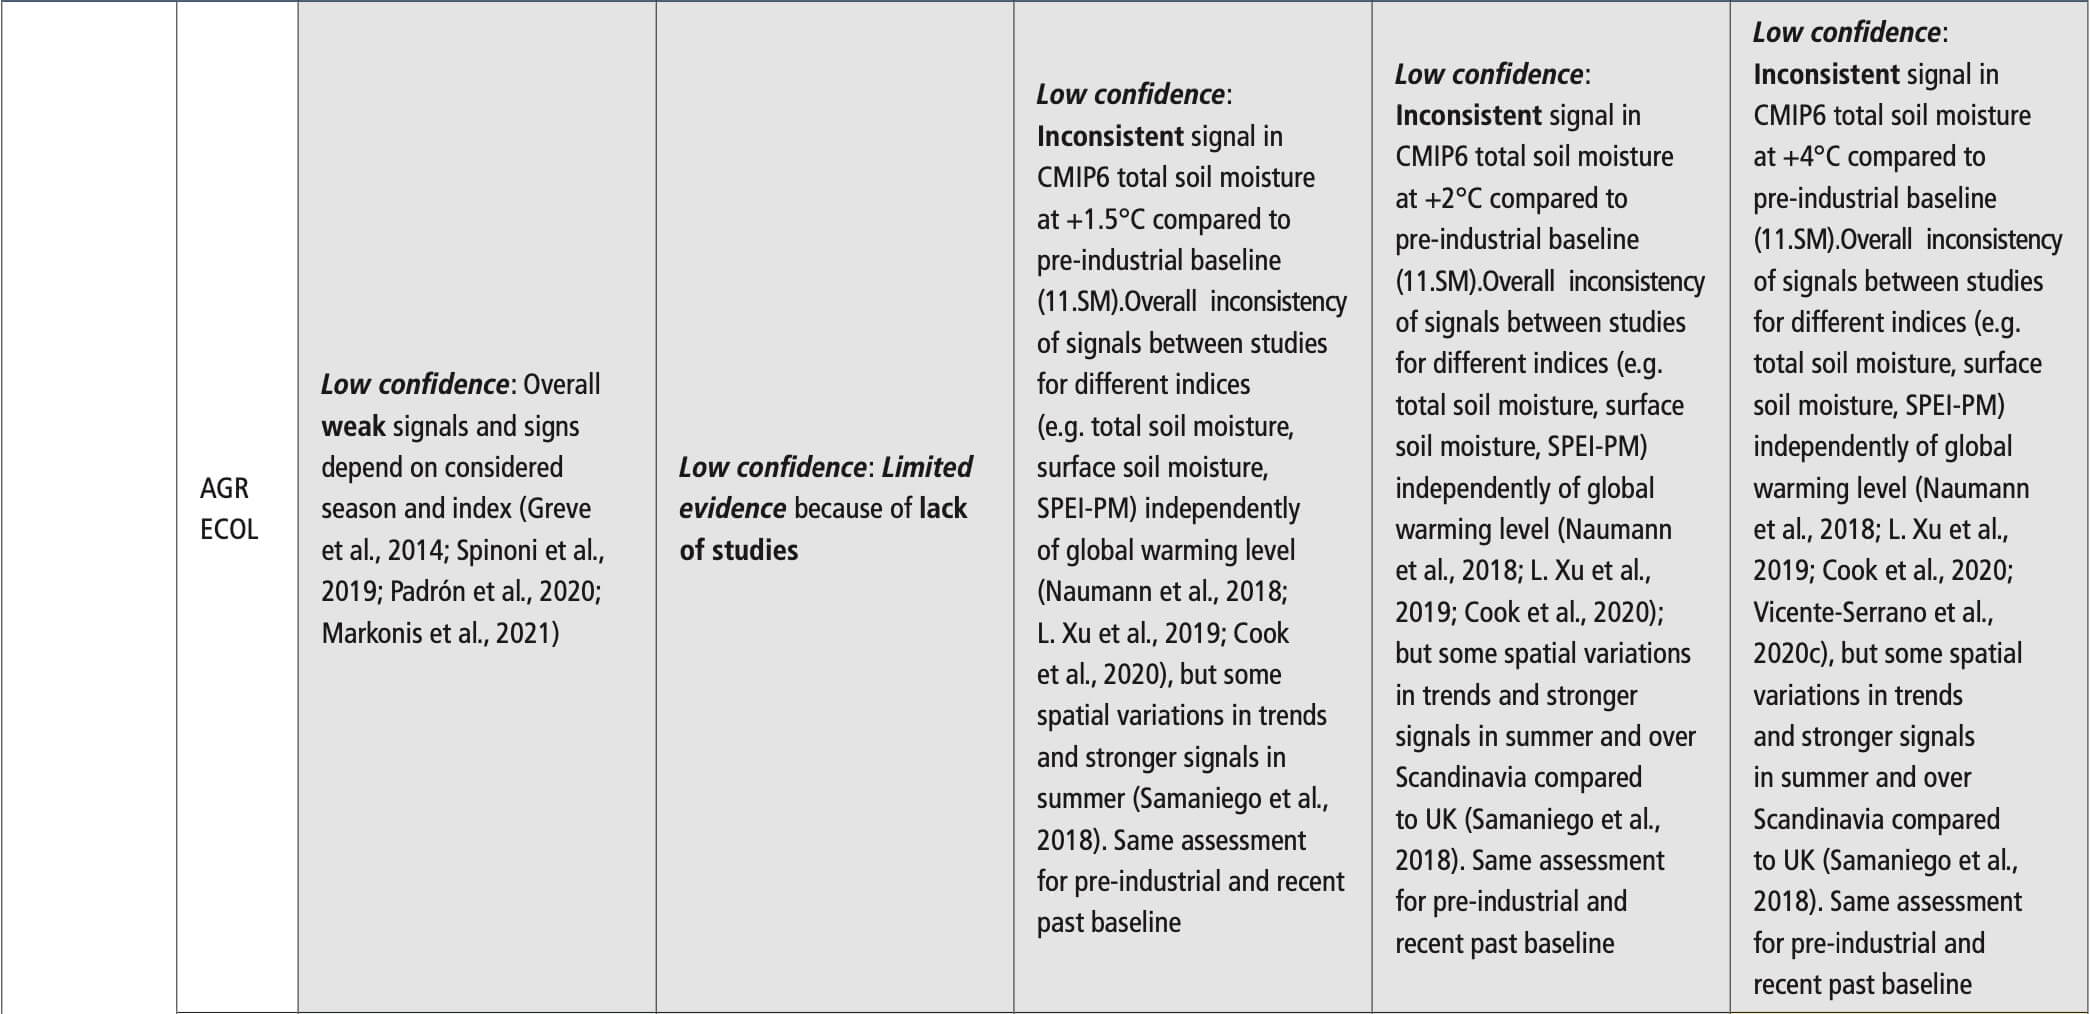
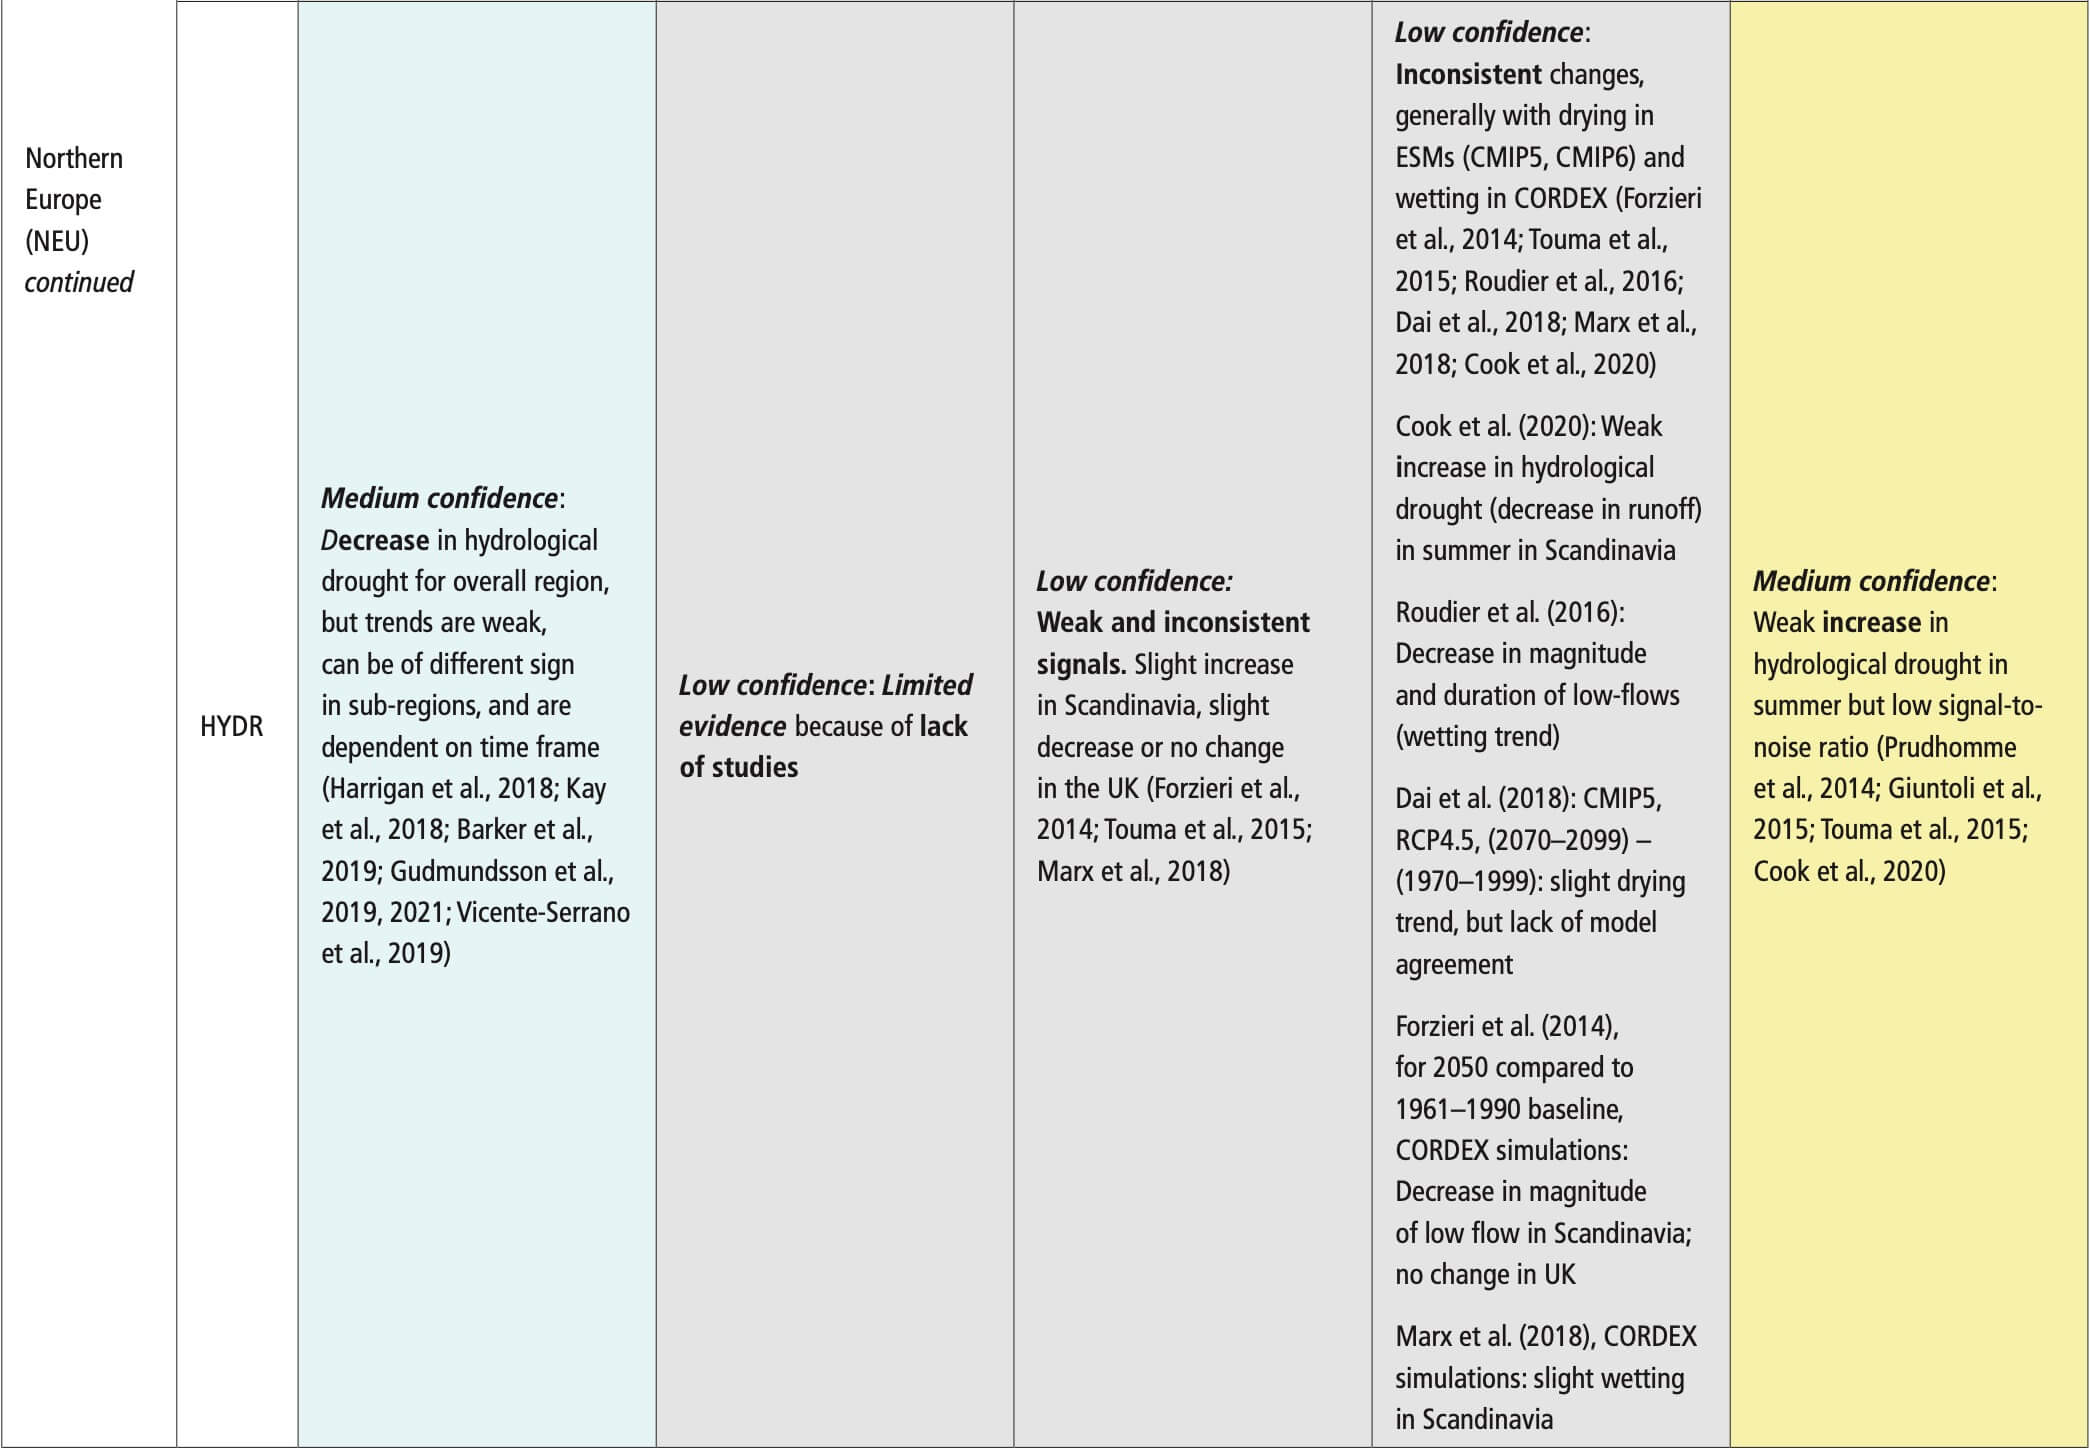 Table 11.19 | Observed trends, human contribution to observed trends, and projected changes at 1.5°C, 2°C and 4°C of global warming for temperature extremes in North America, subdivided by AR6 regions. See Sections 11.9.1 and 11.9.2 for details.
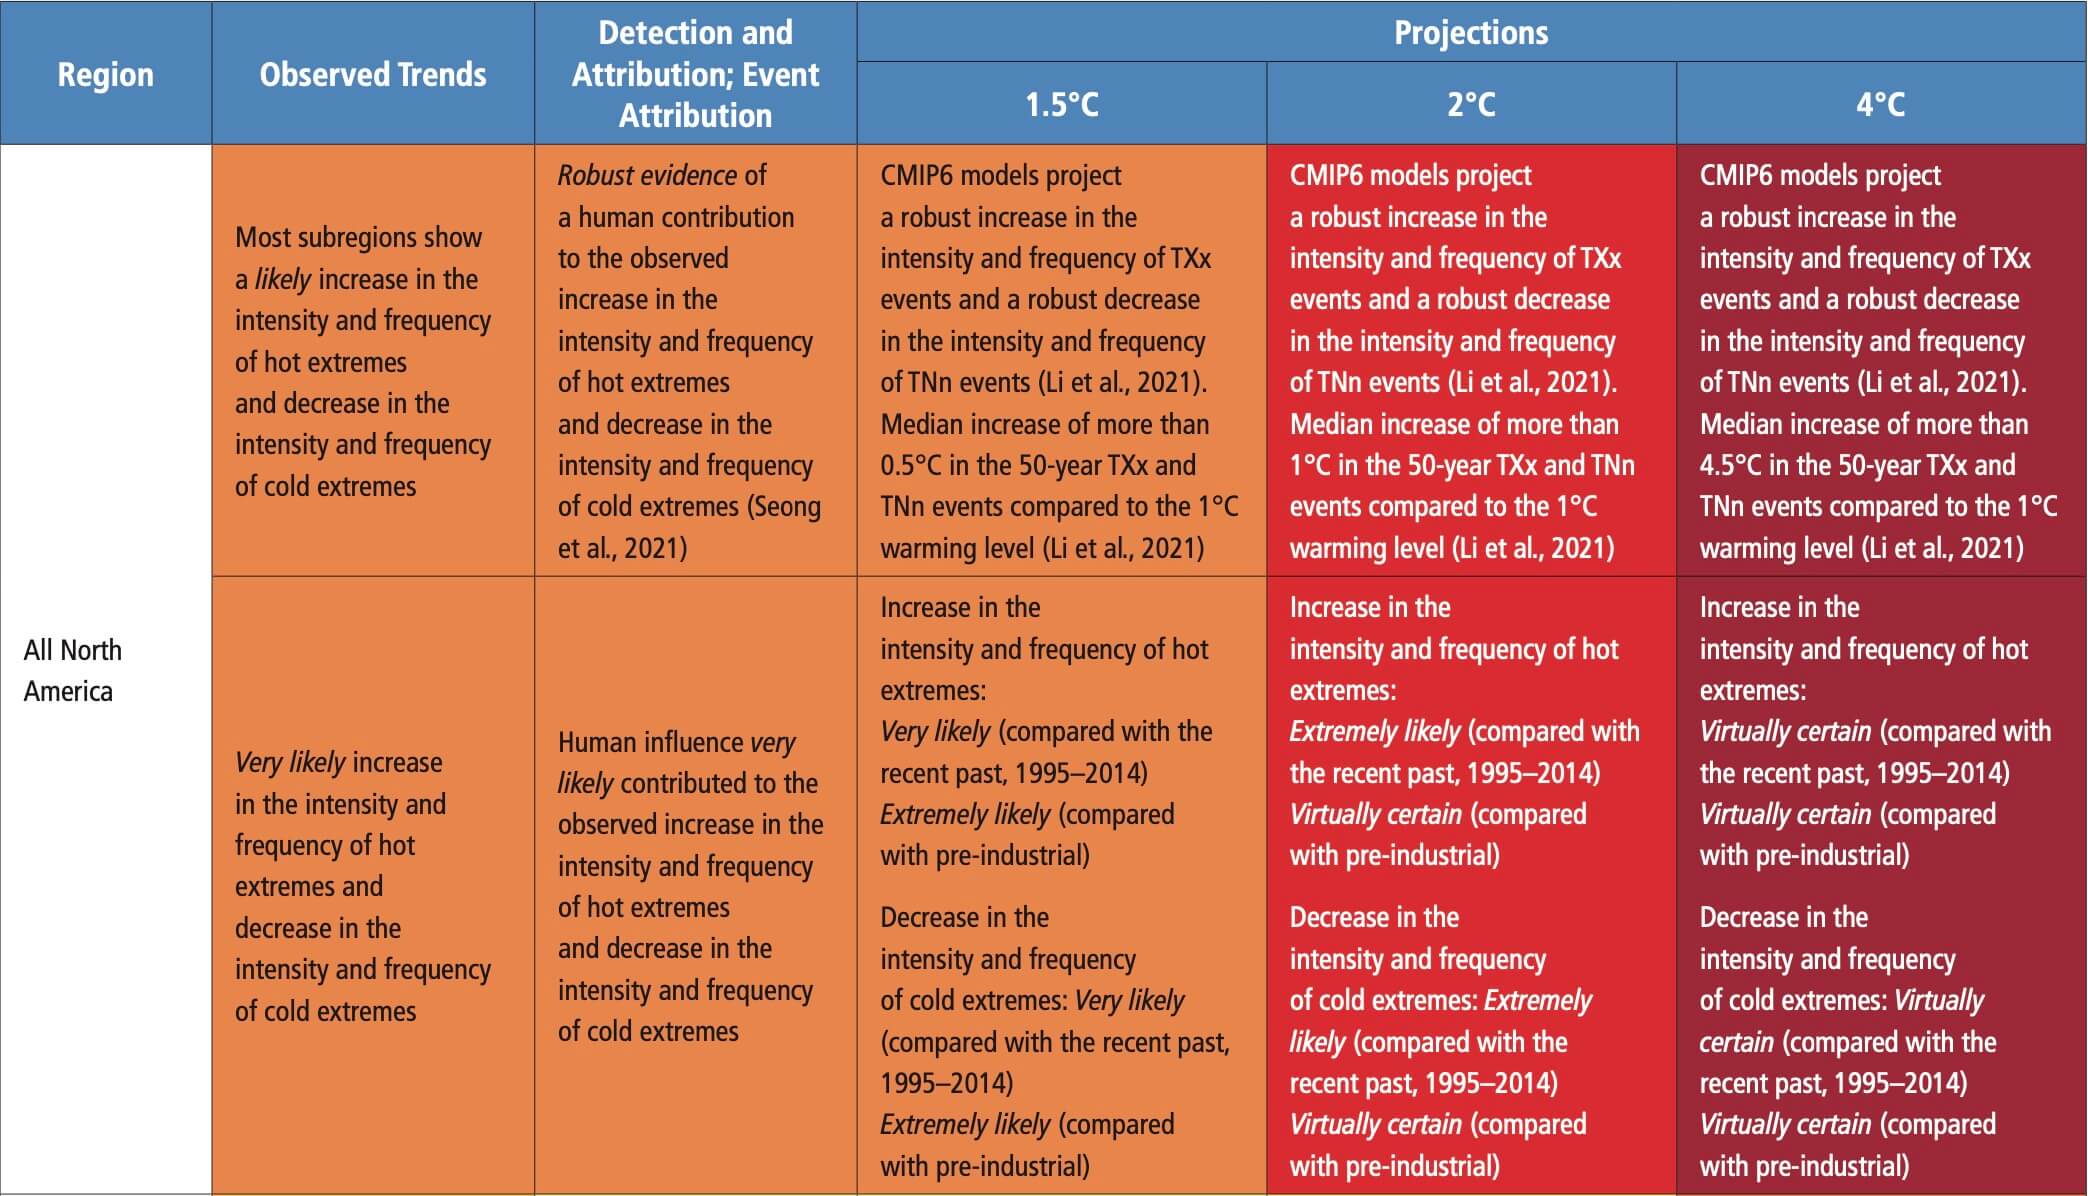
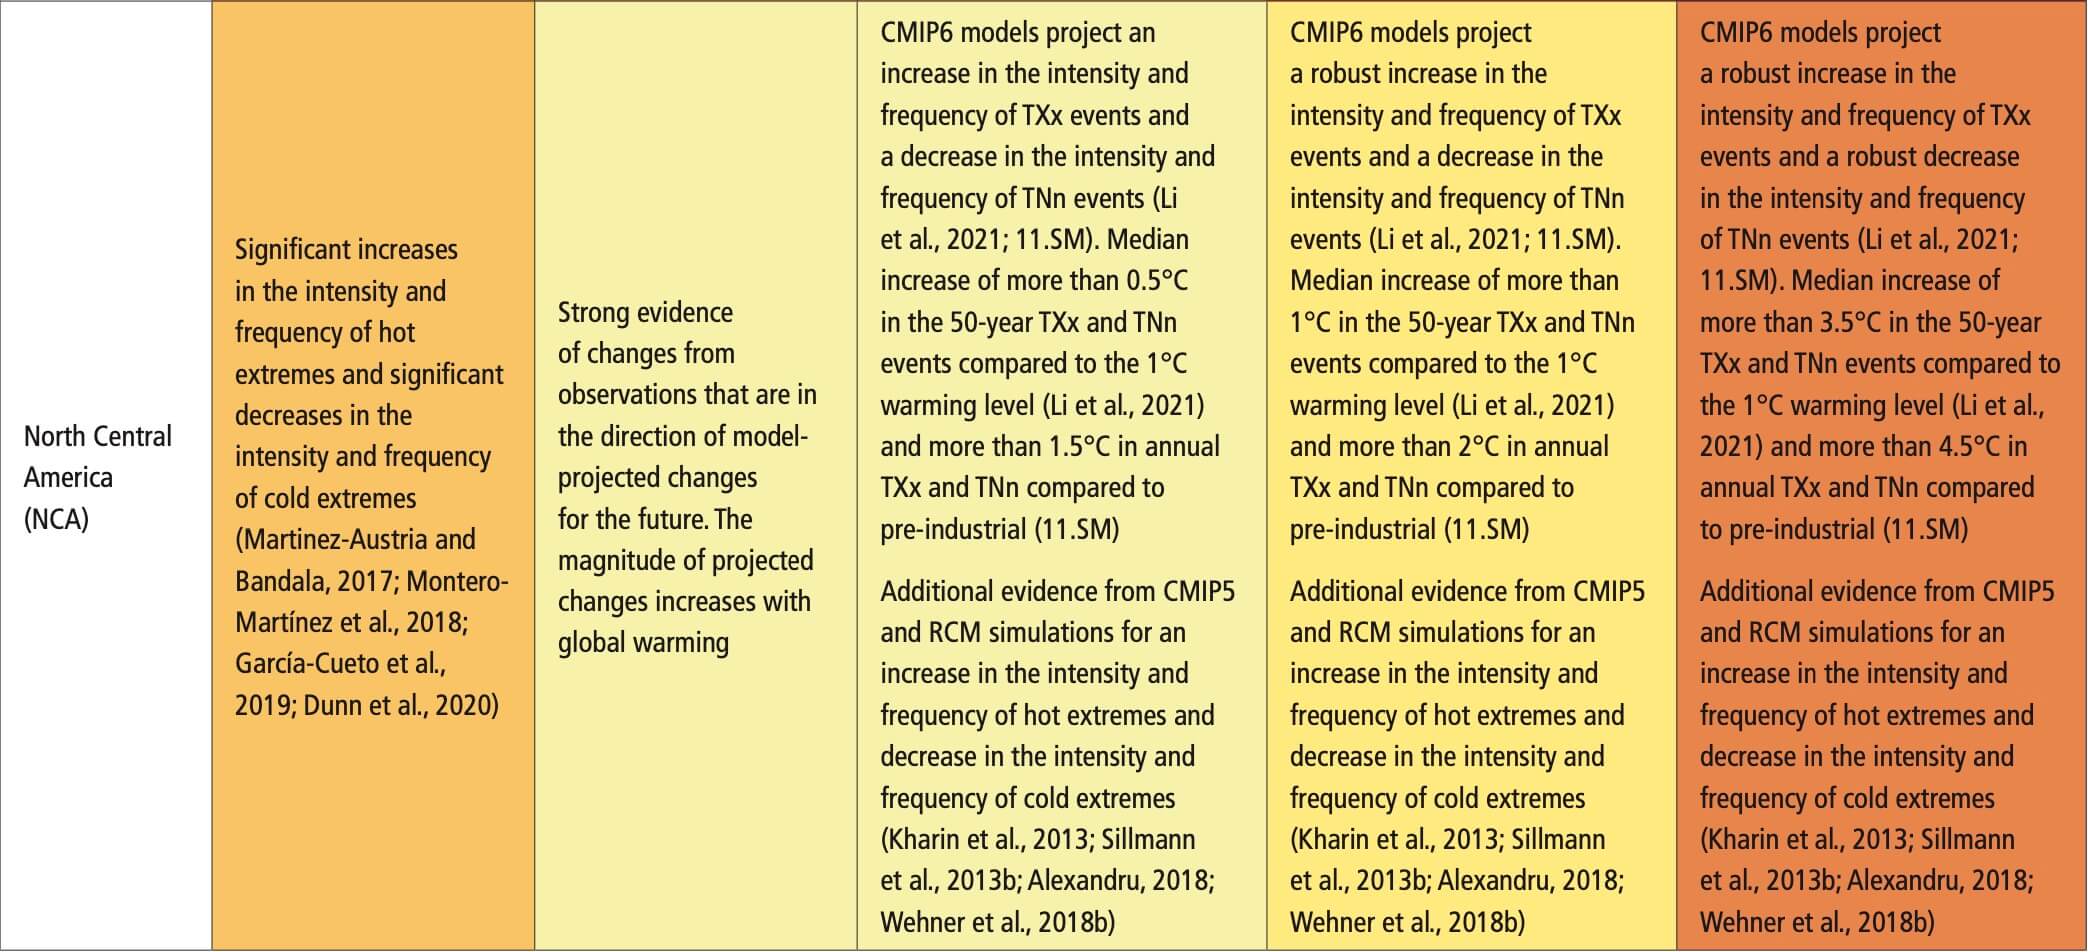
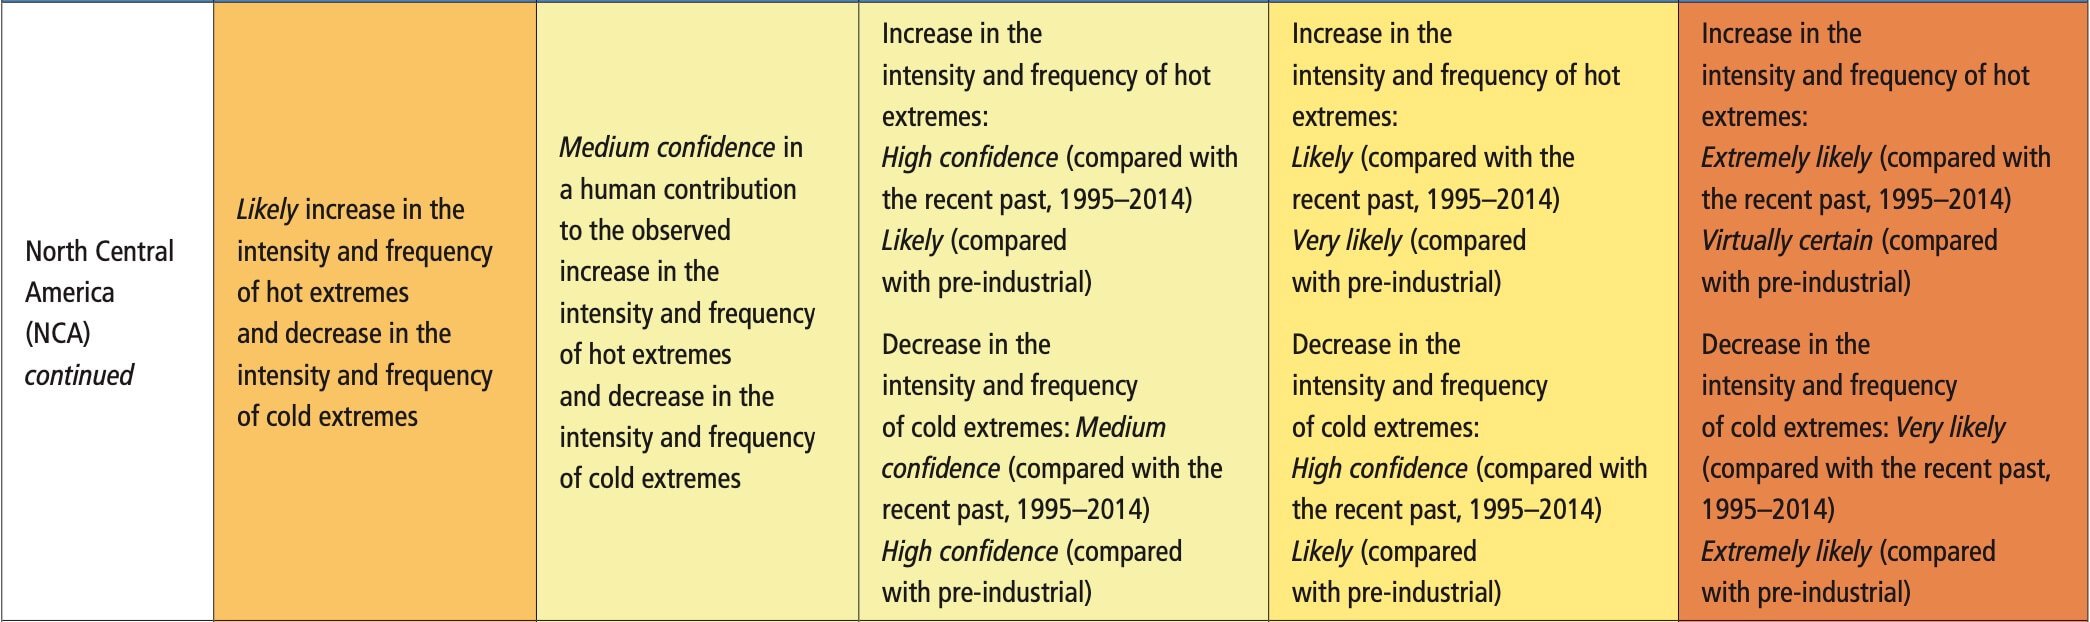
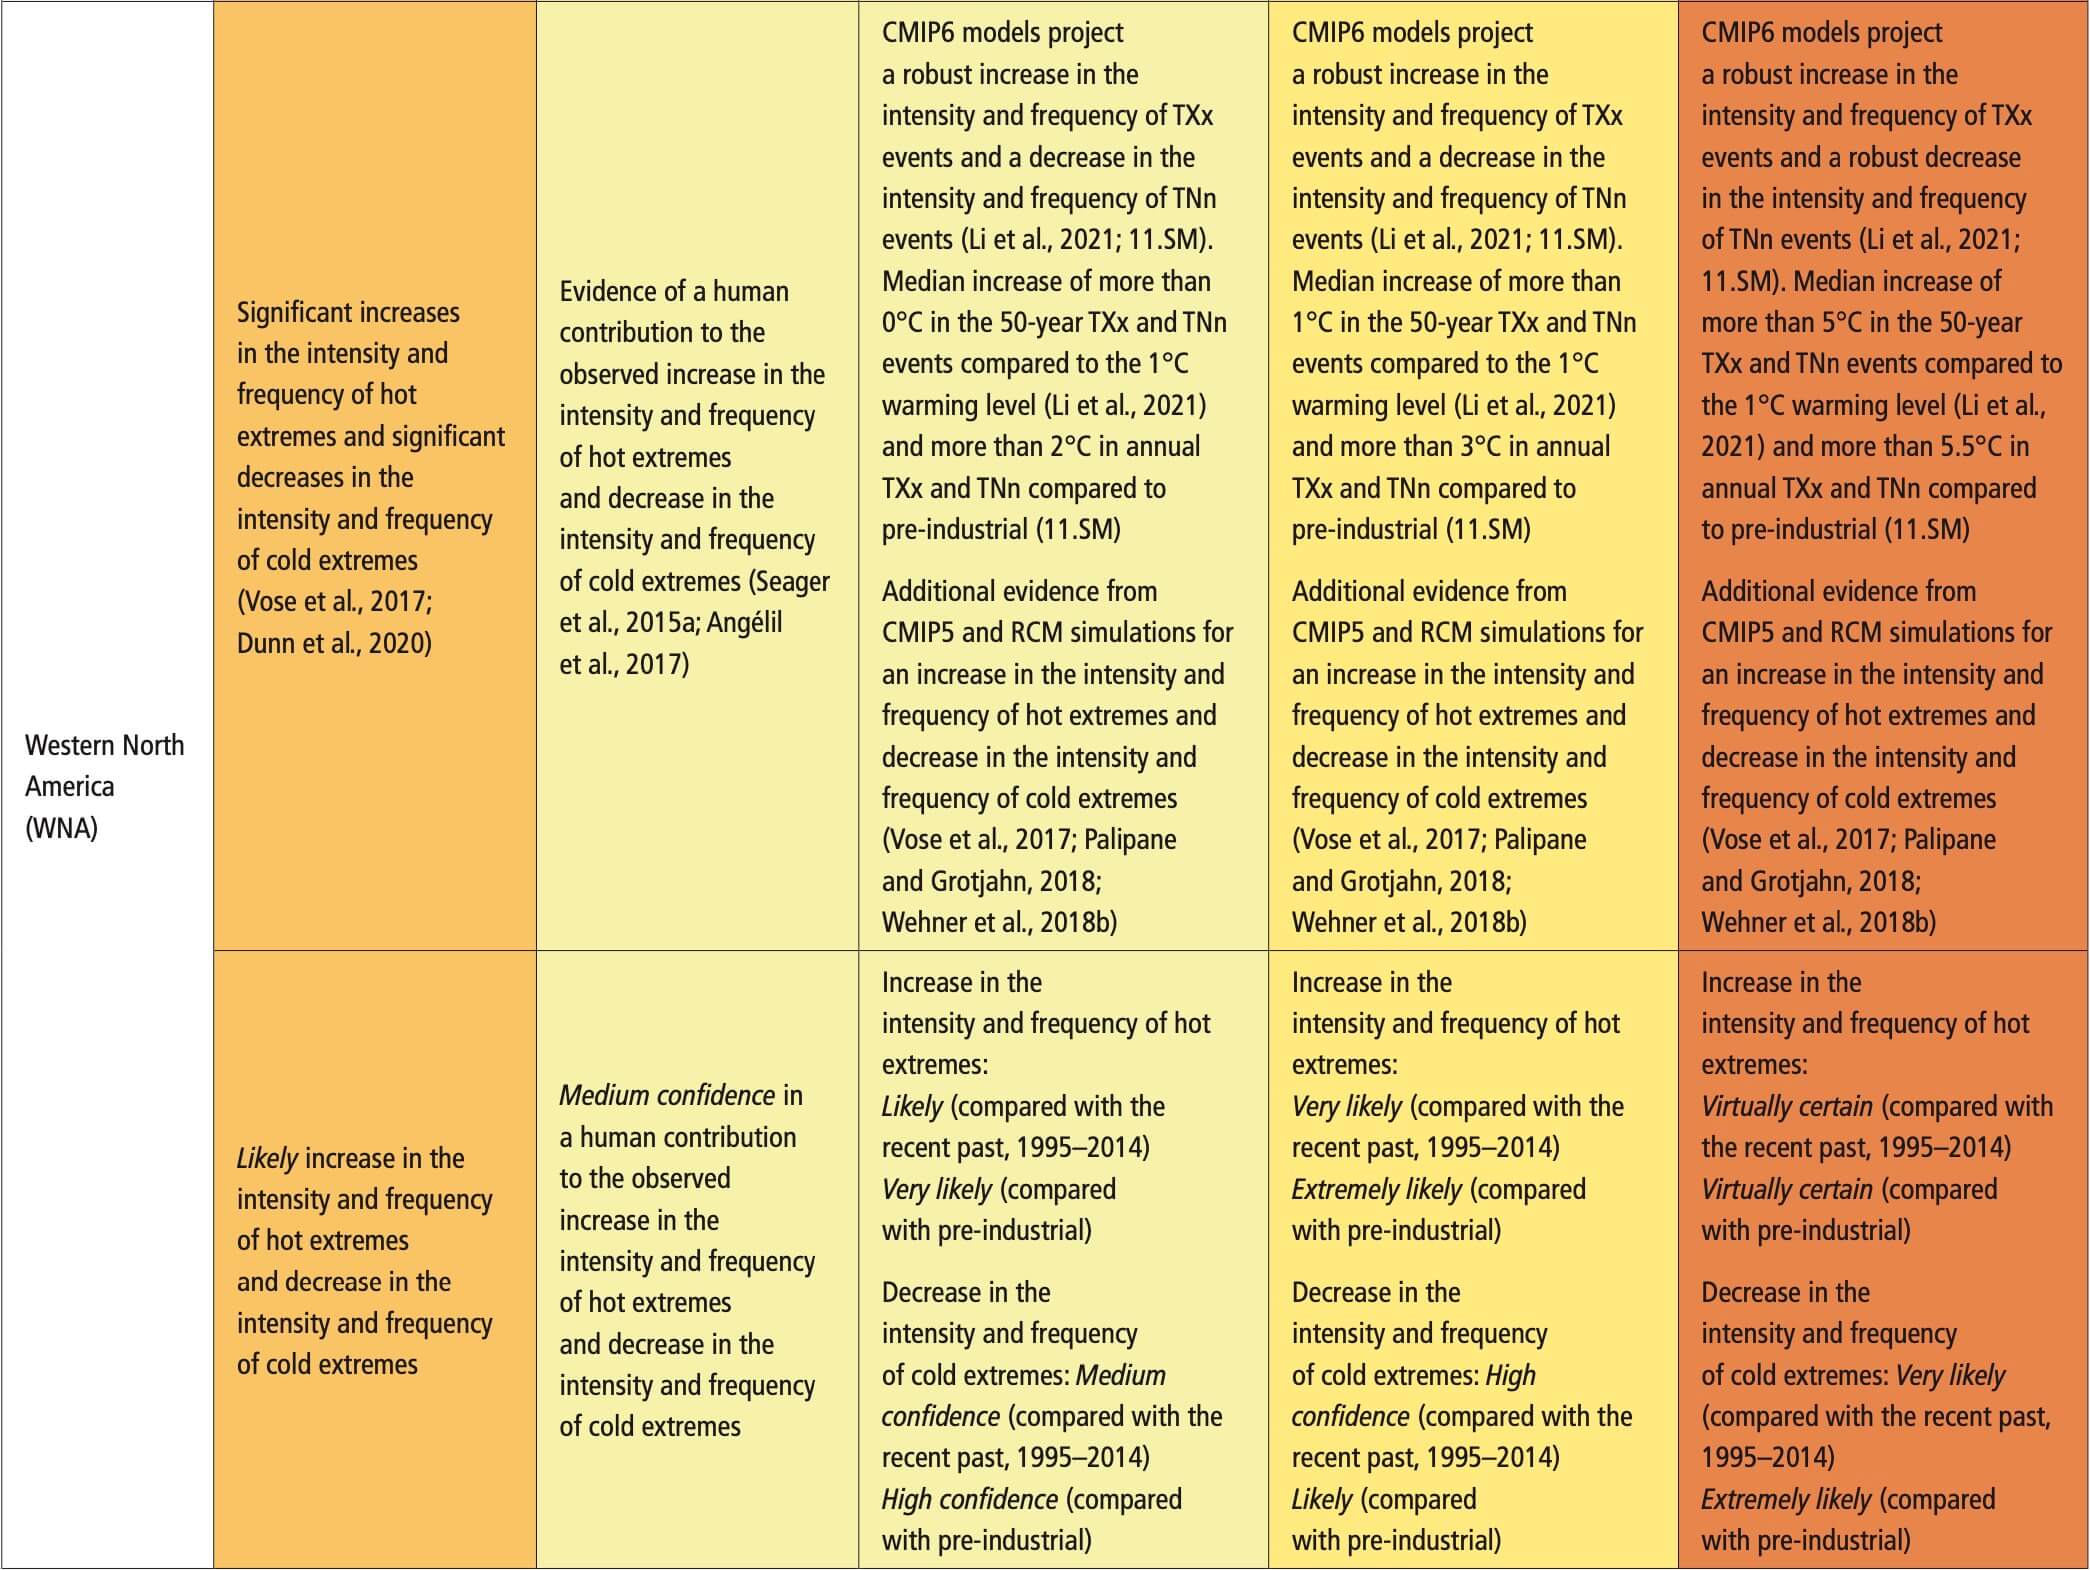
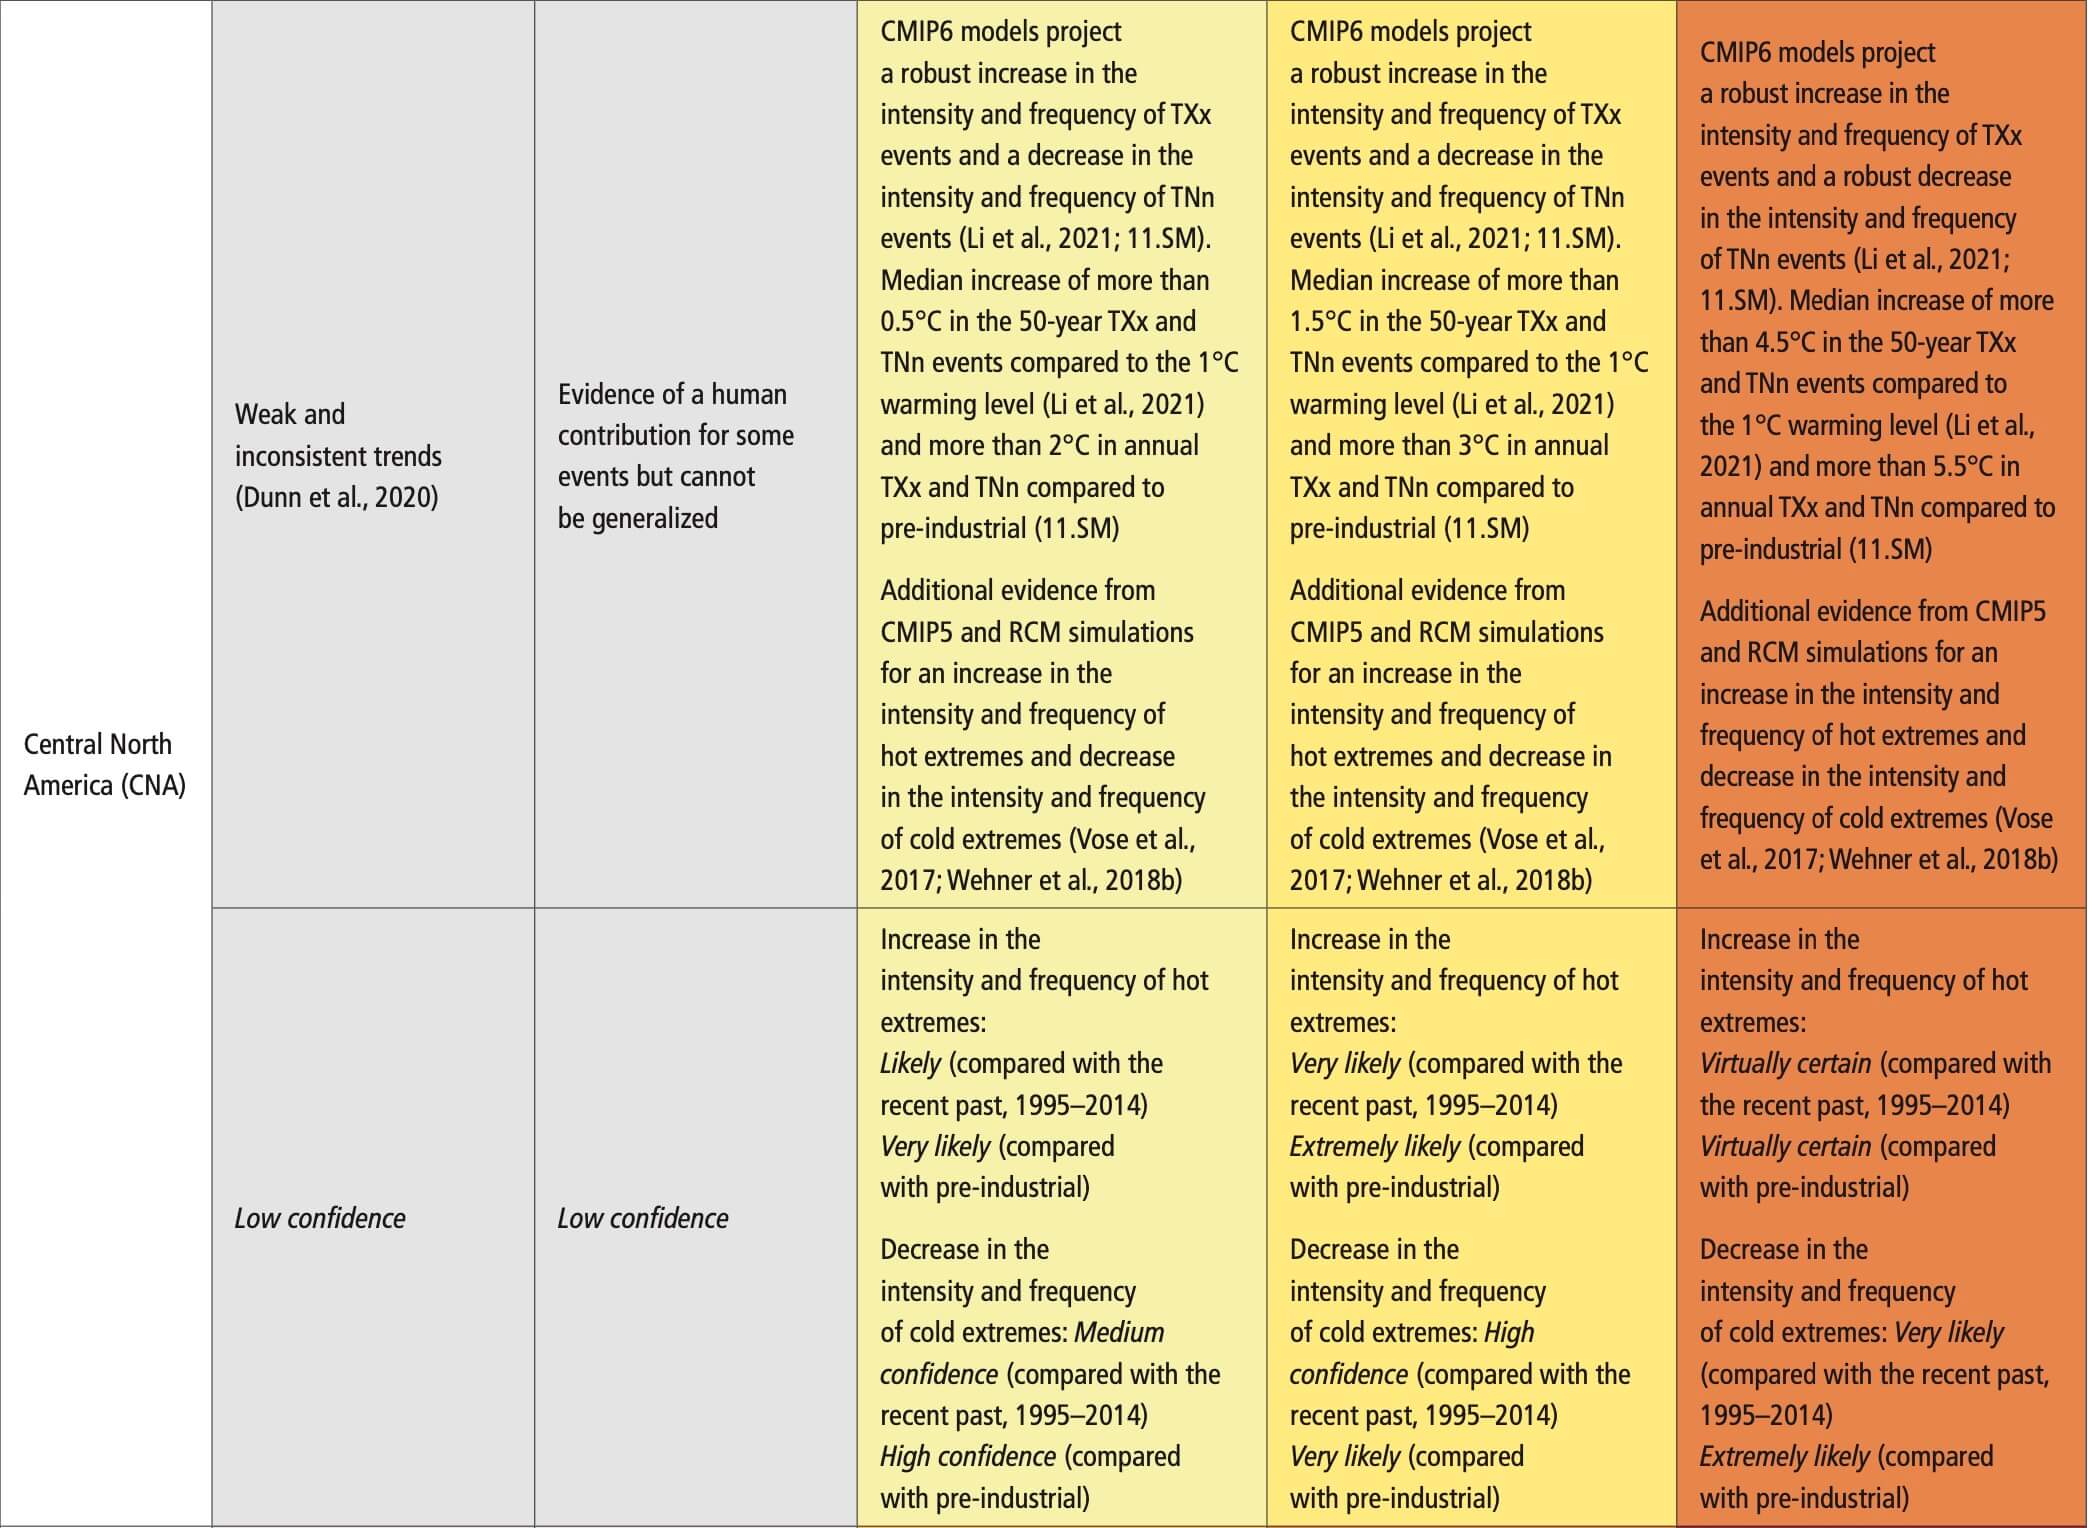
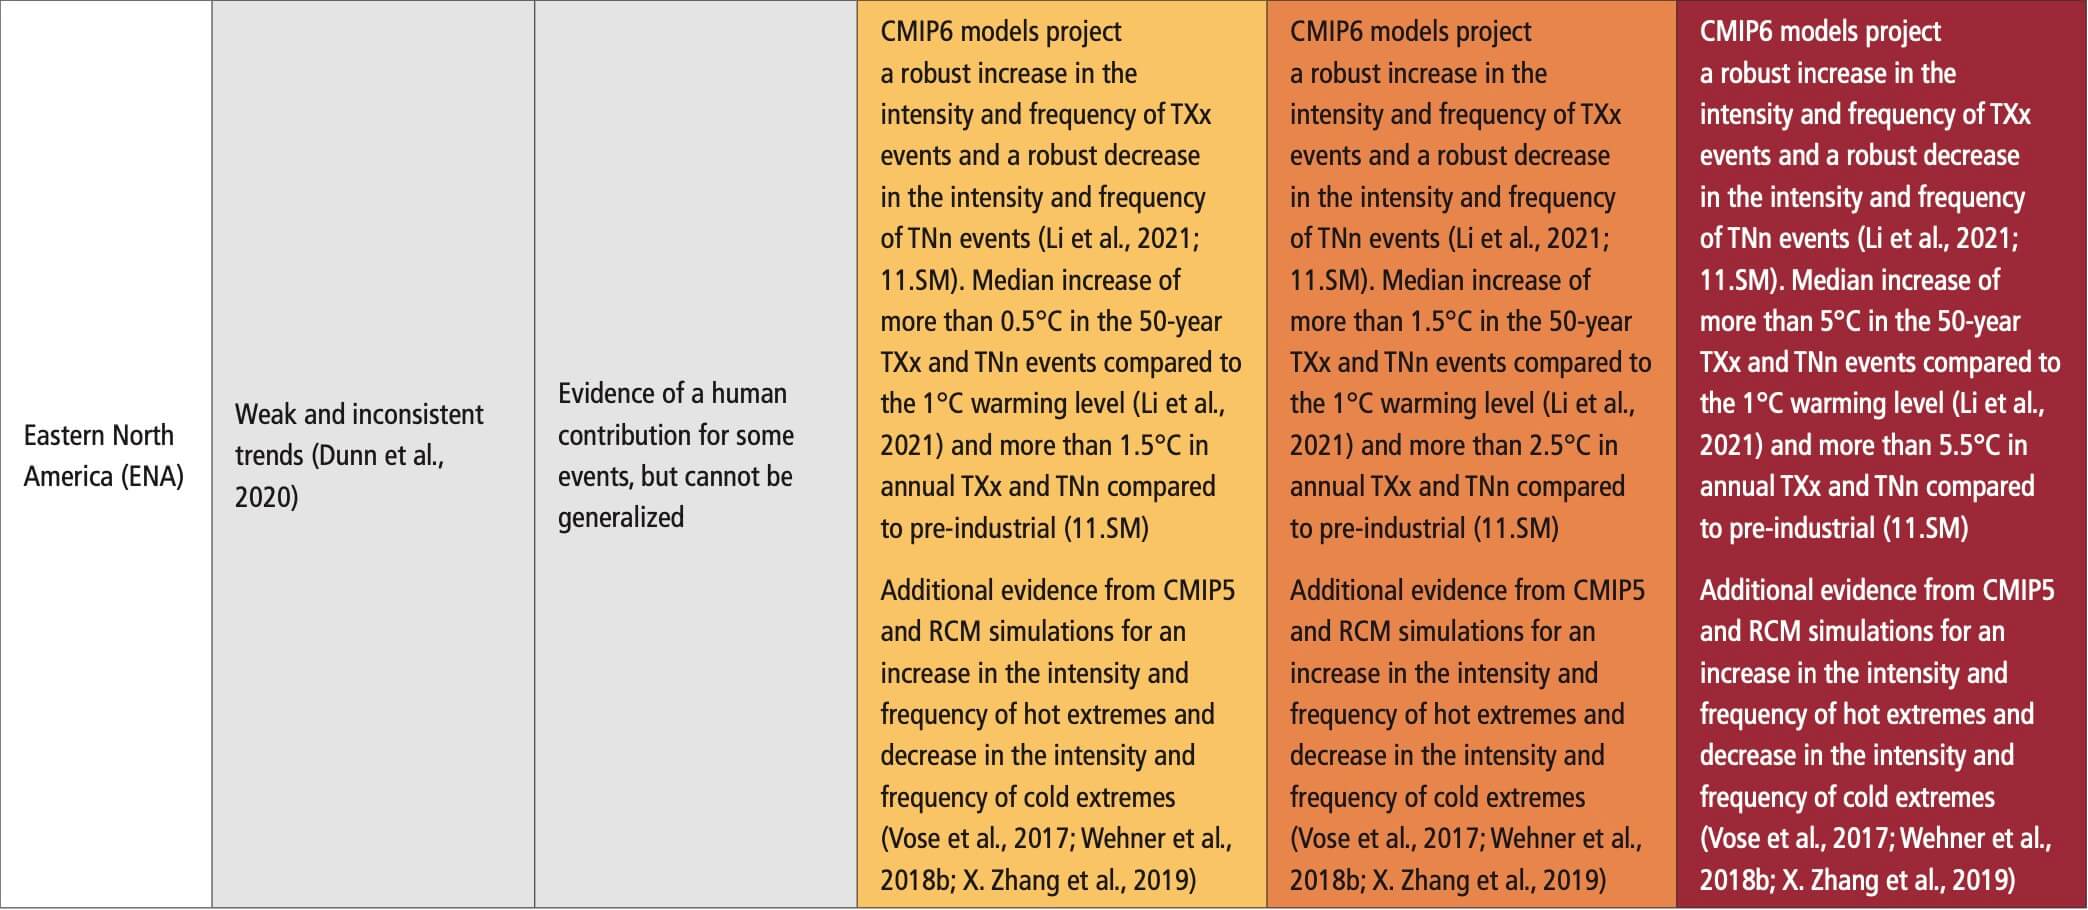
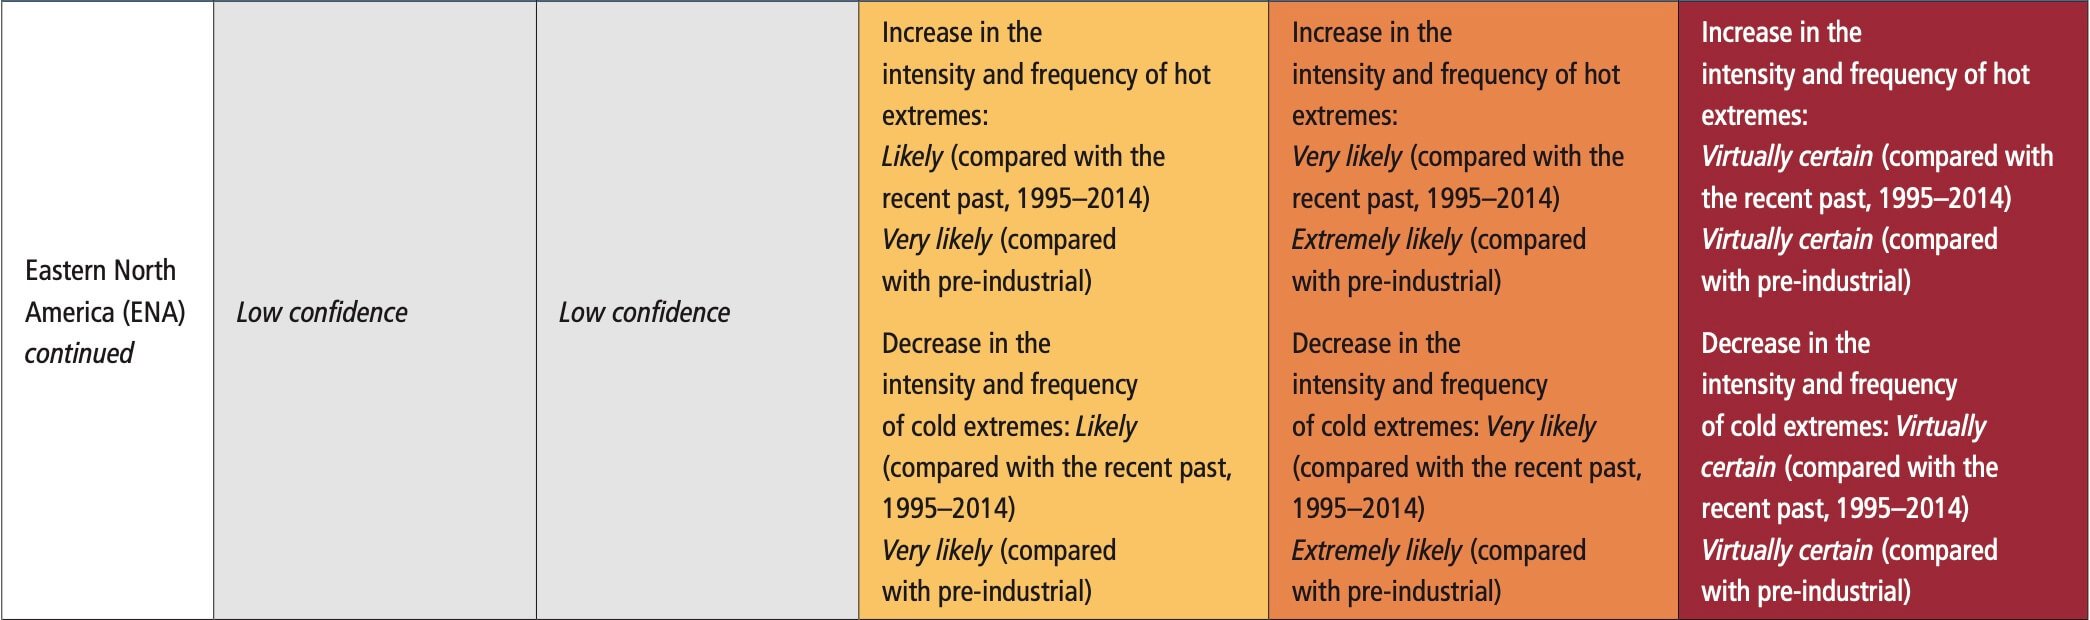
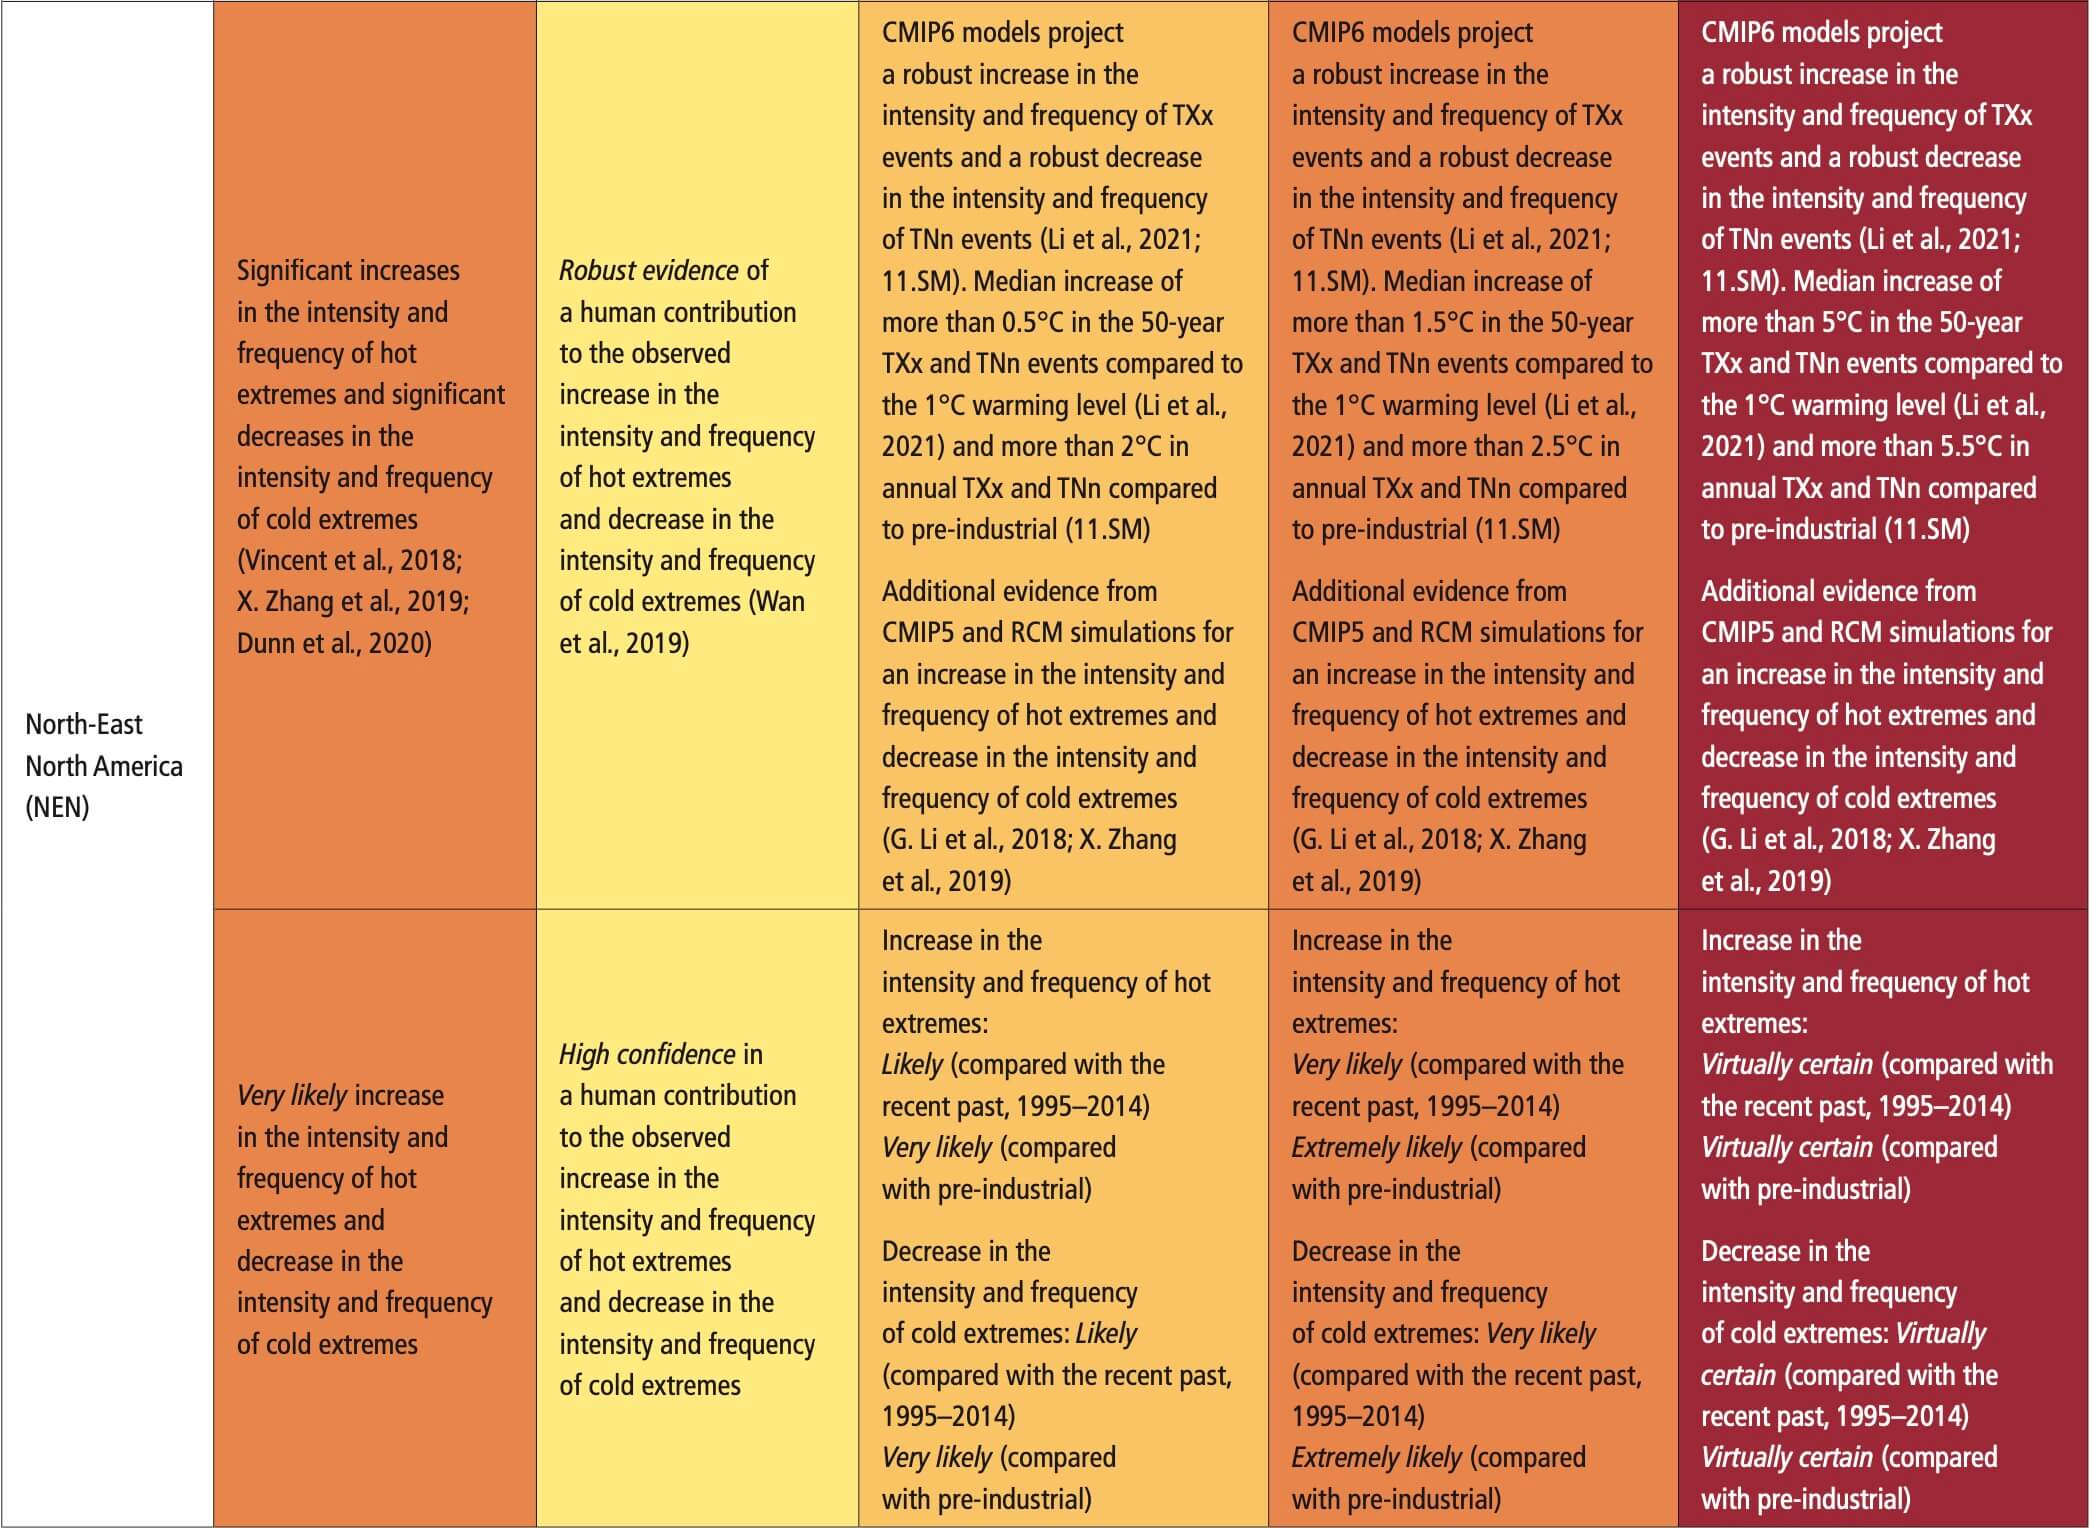
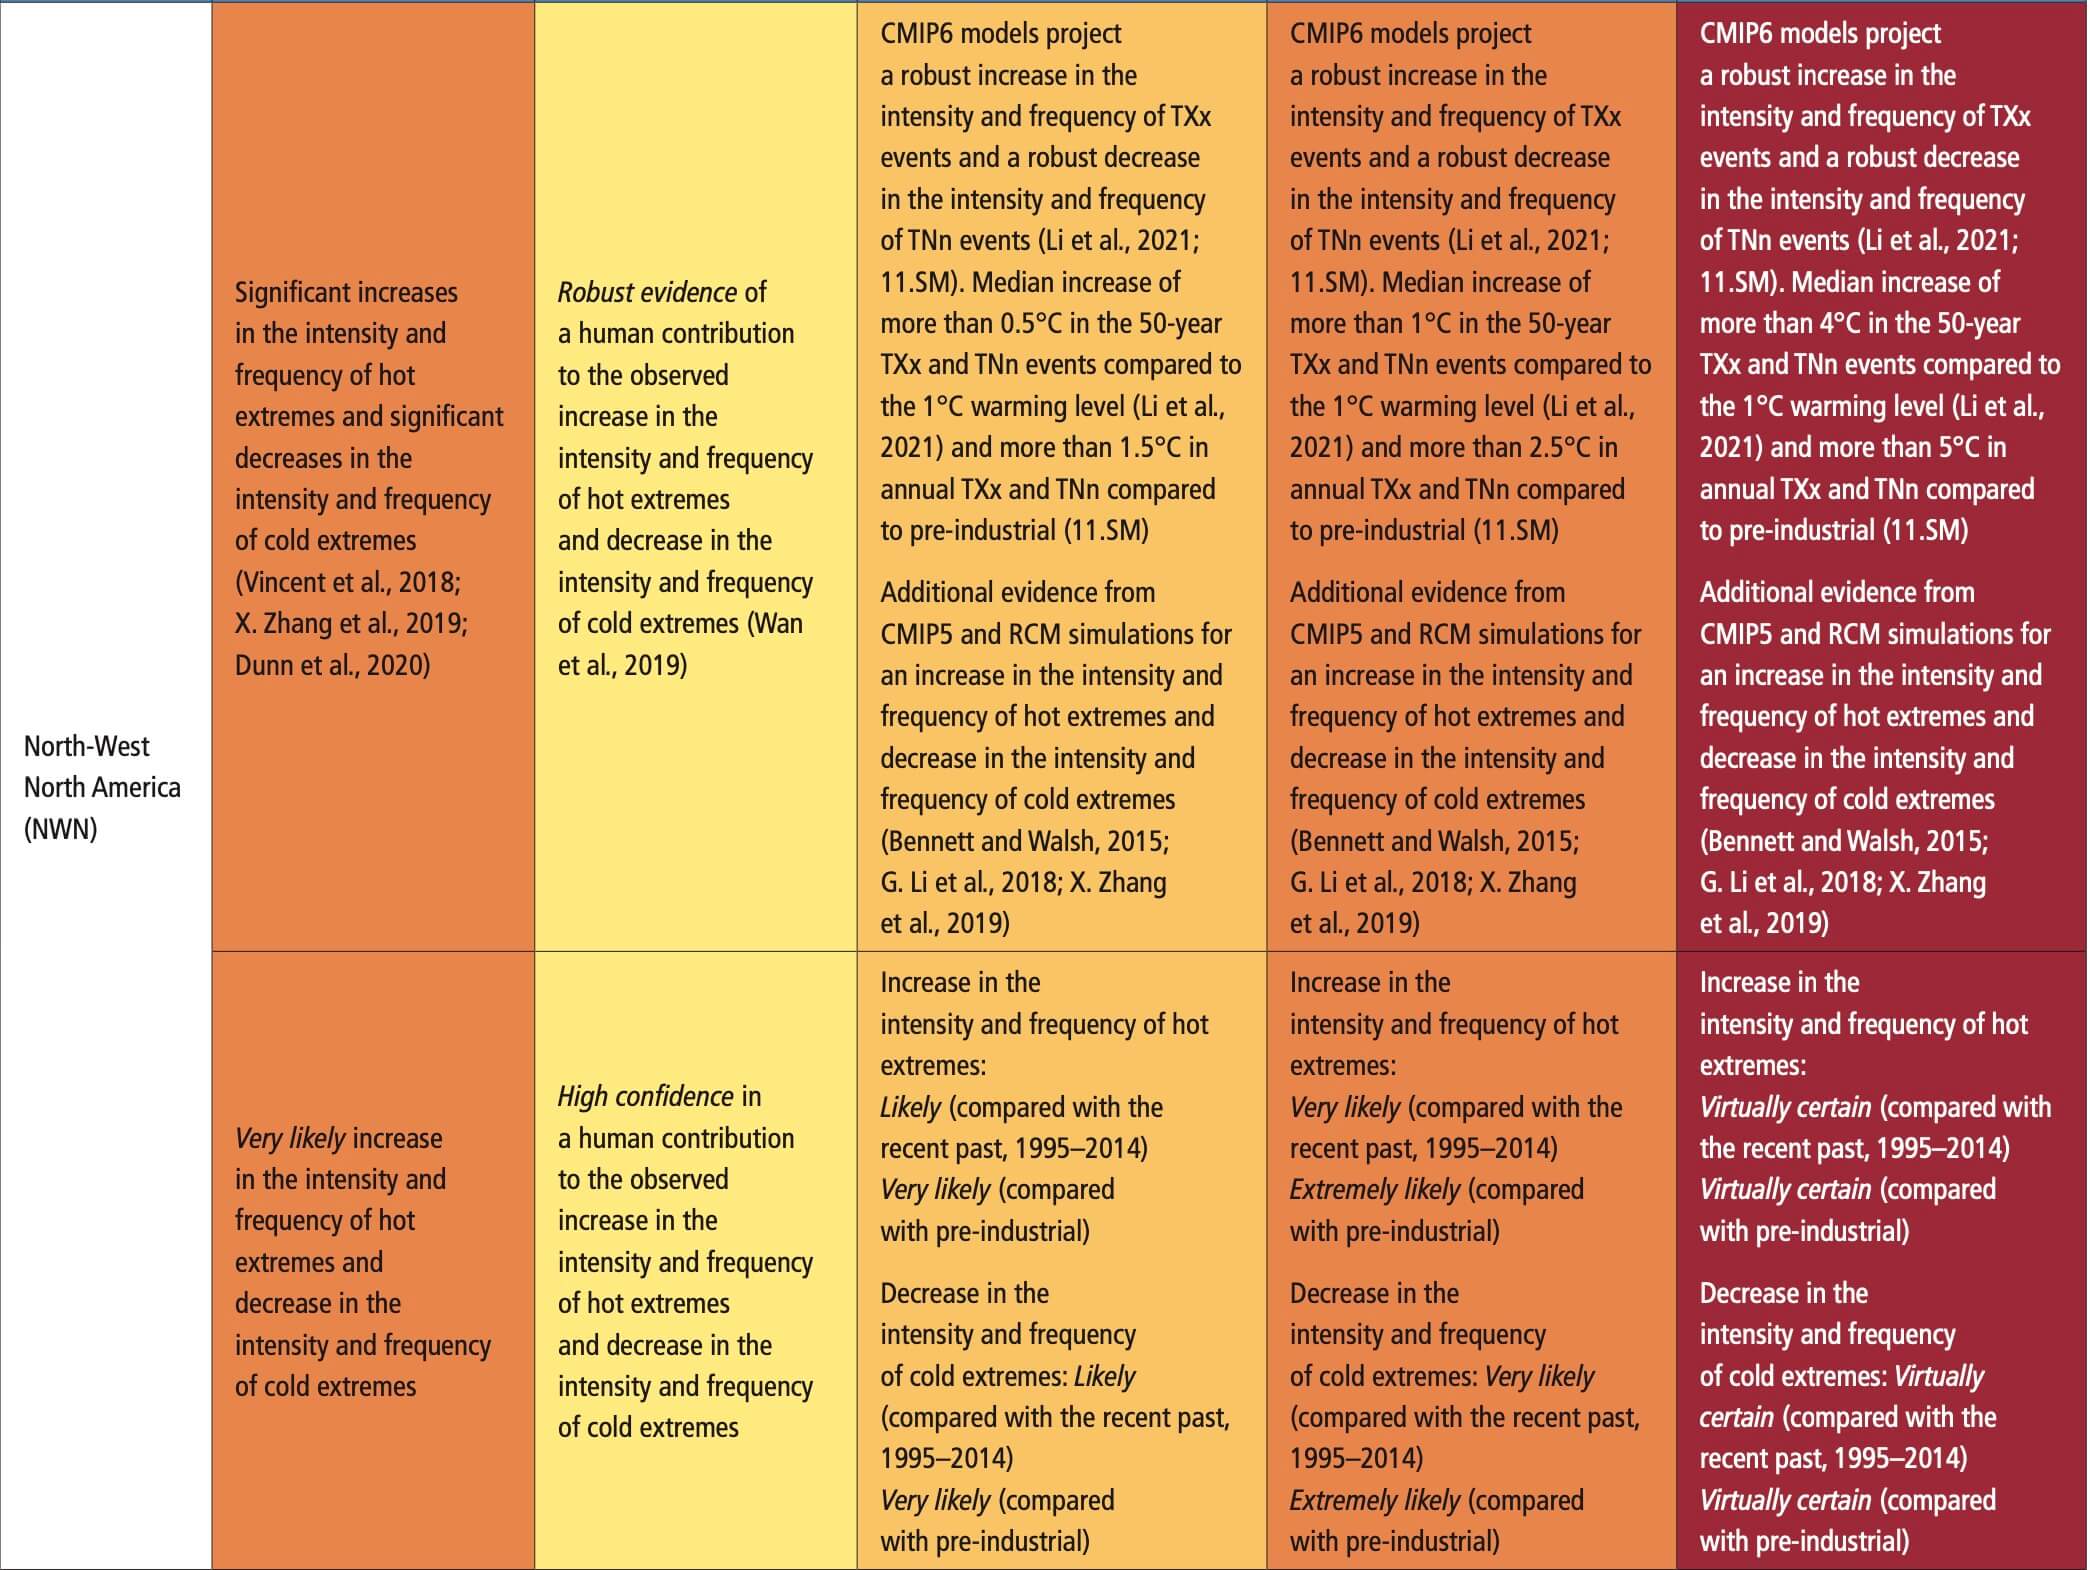
 Table 11.20 | Observed trends, human contribution to observed trends, and projected changes at 1.5°C, 2°C and 4°C of global warming for heavy precipitation in North America, subdivided by AR6 regions. See Sections 11.9.1 and 11.9.3 for details.
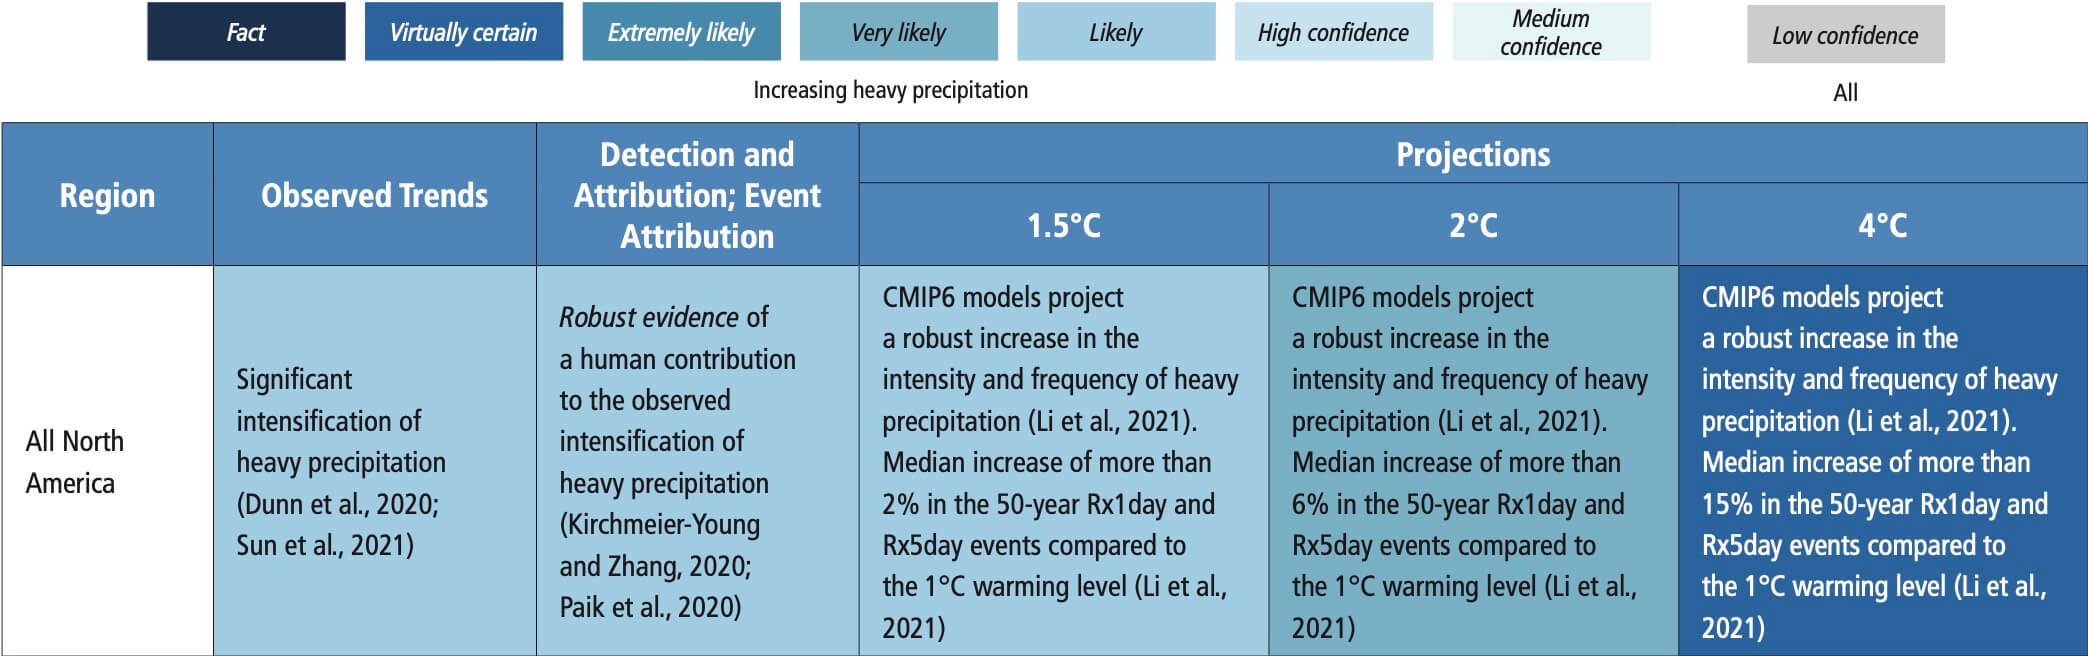
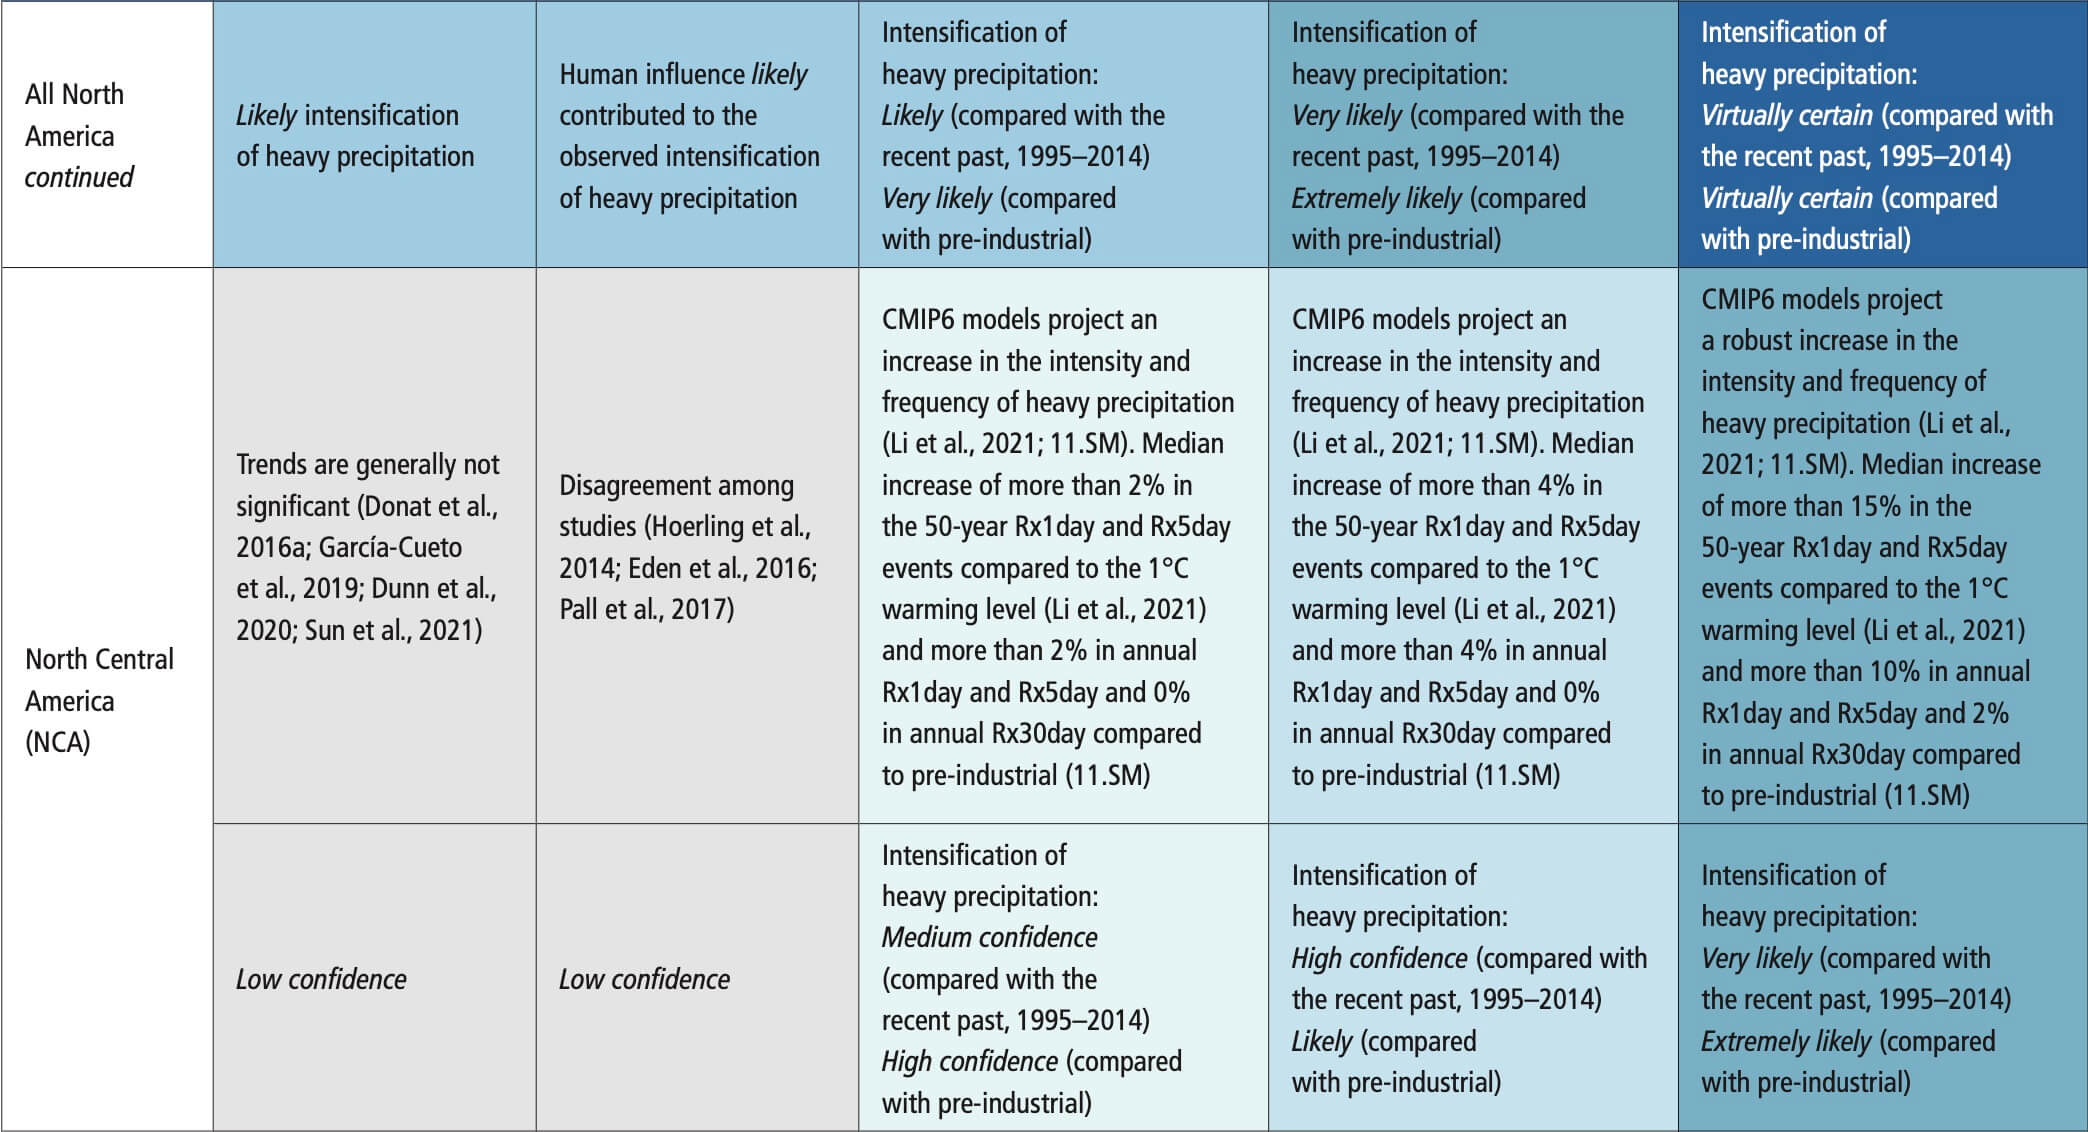
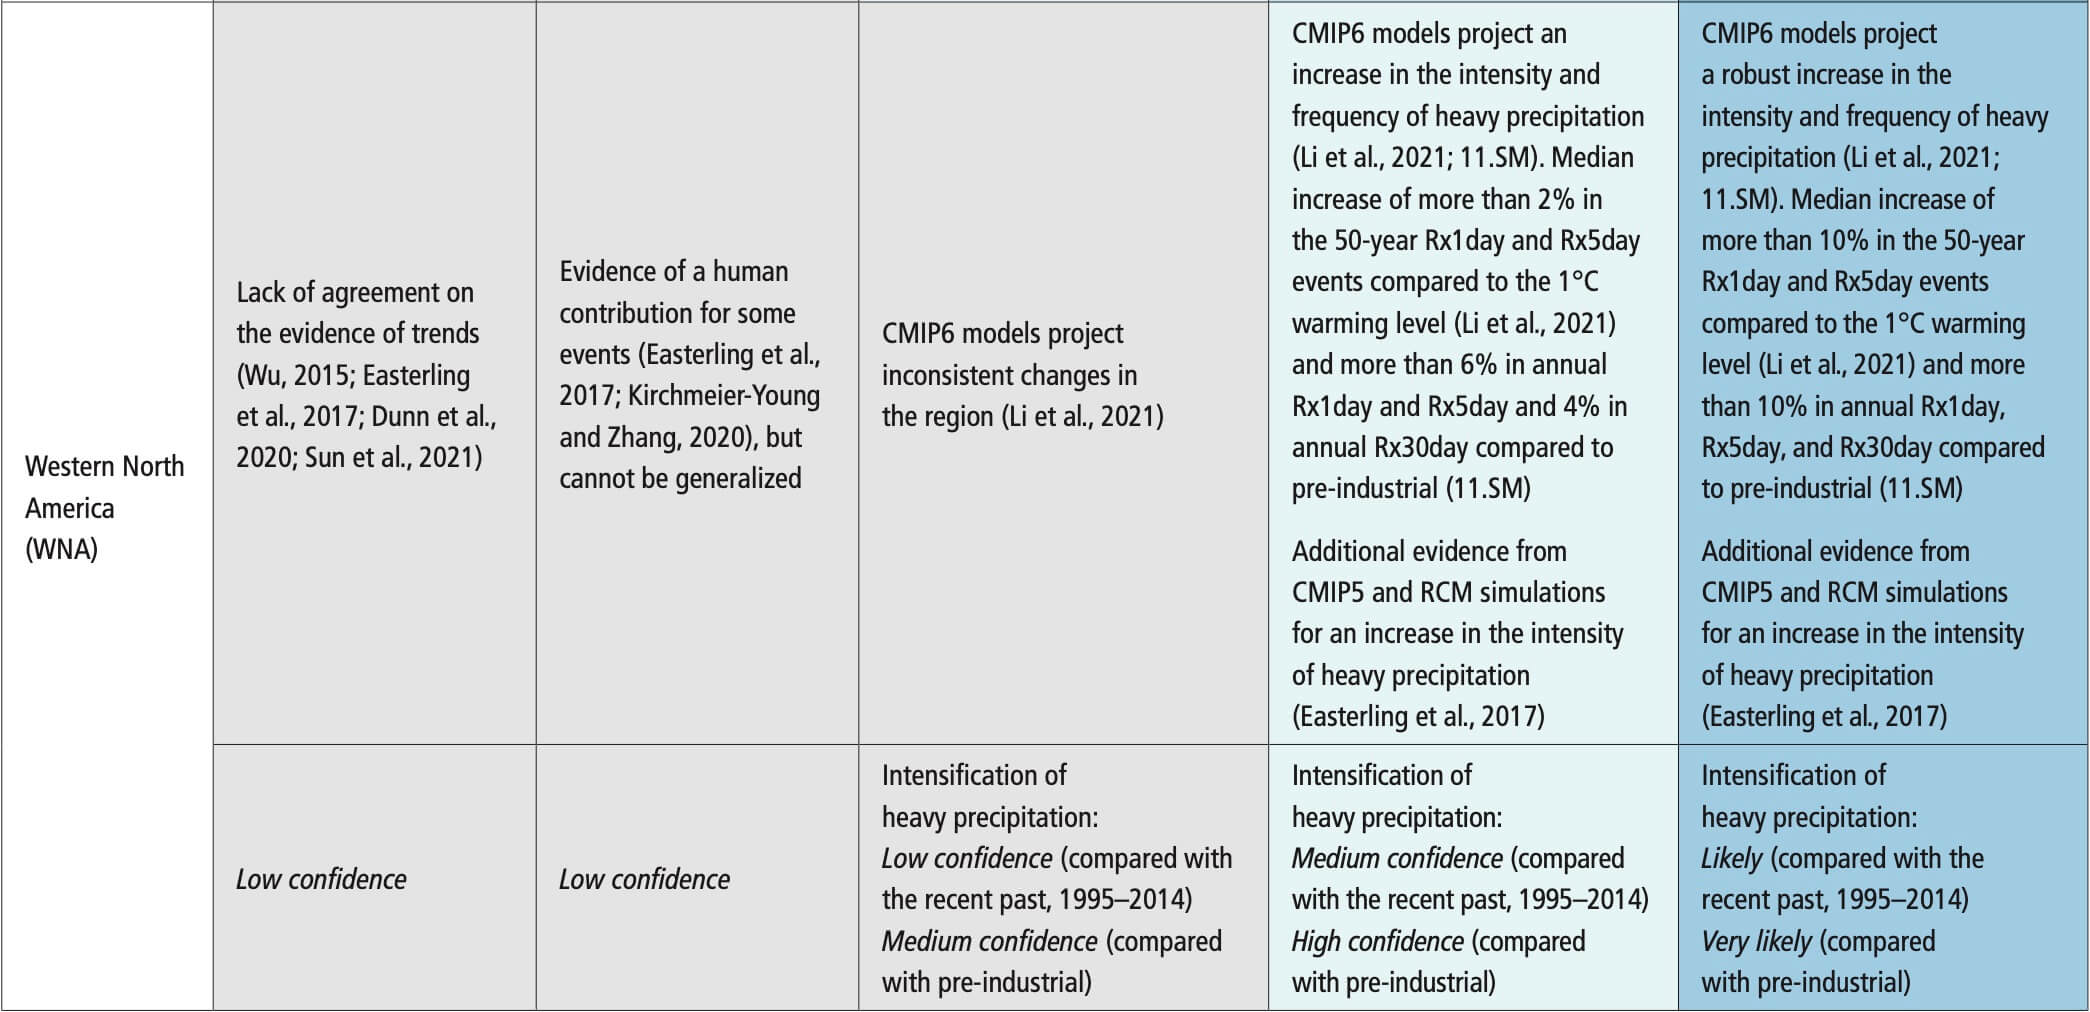
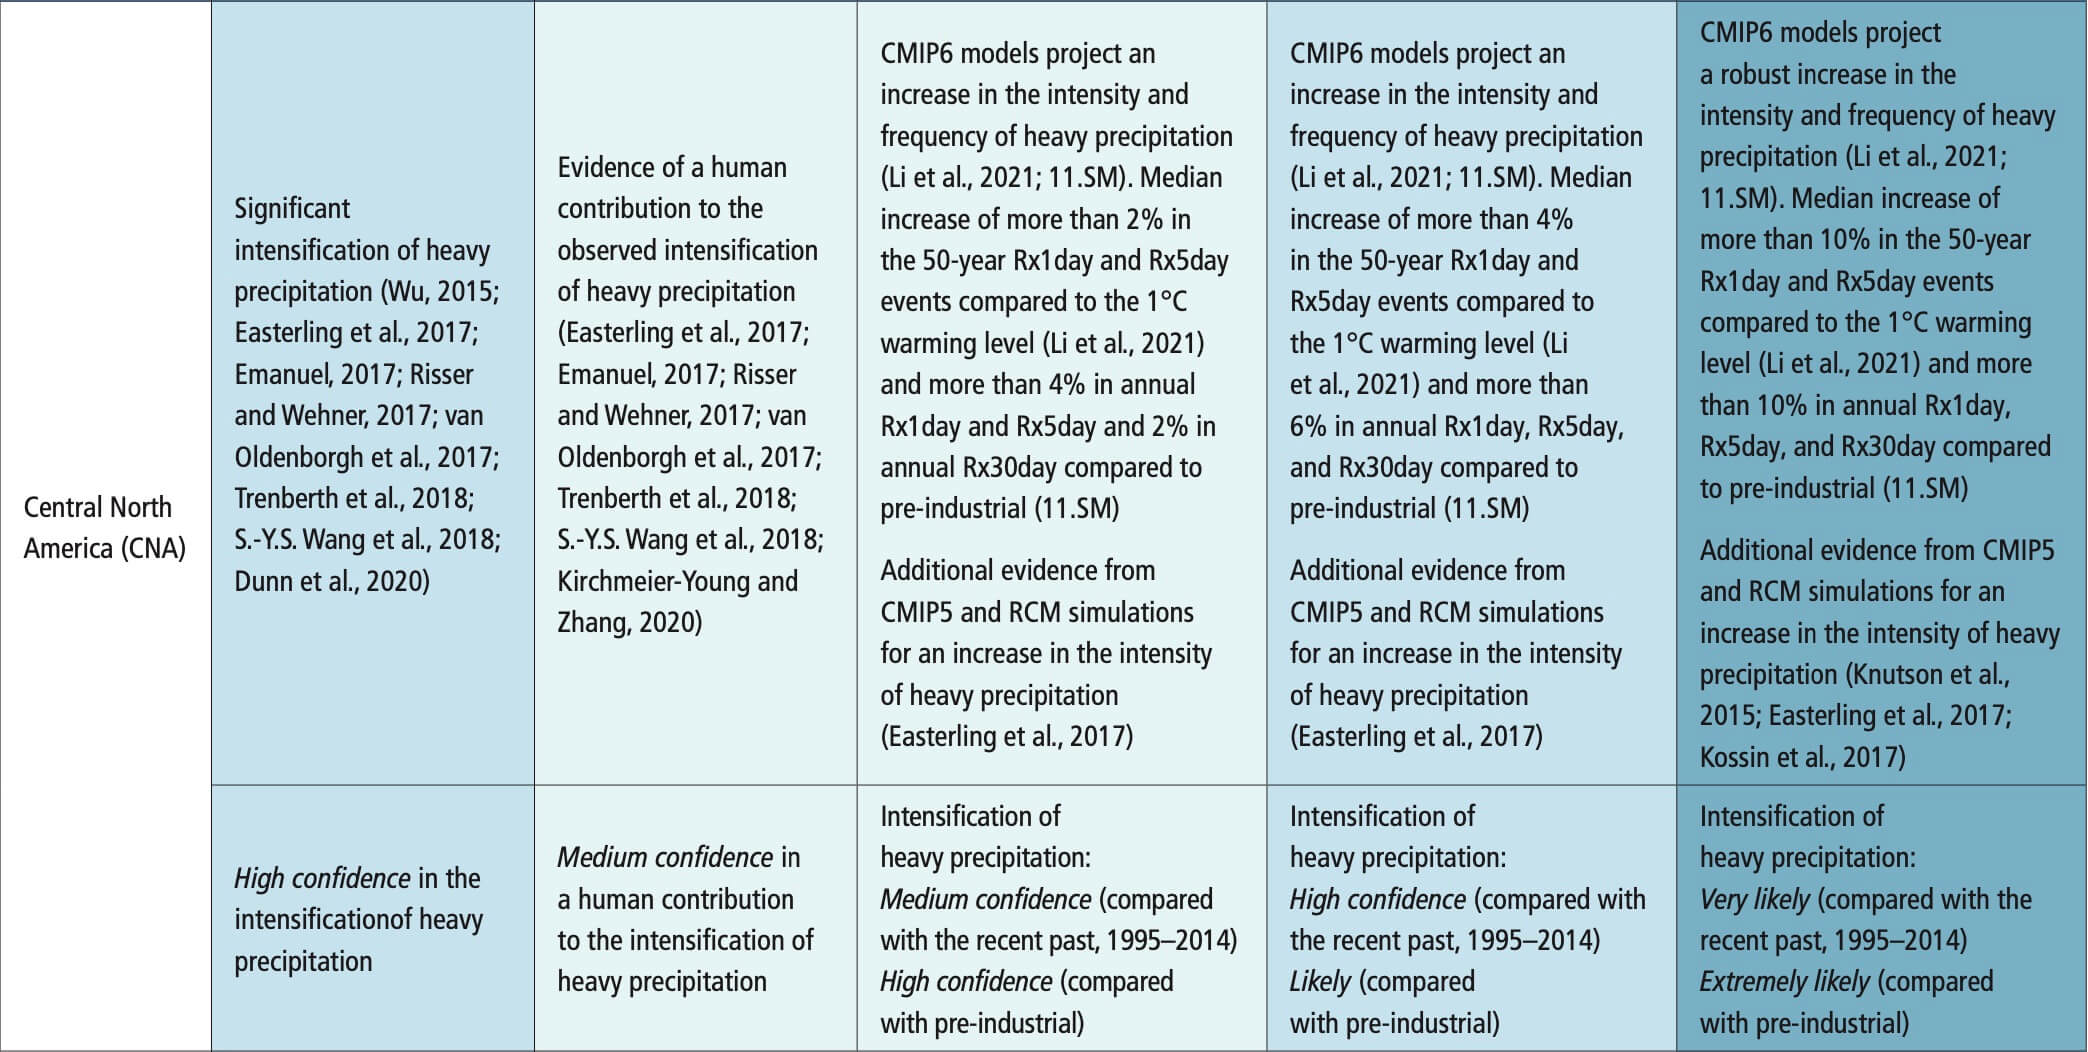
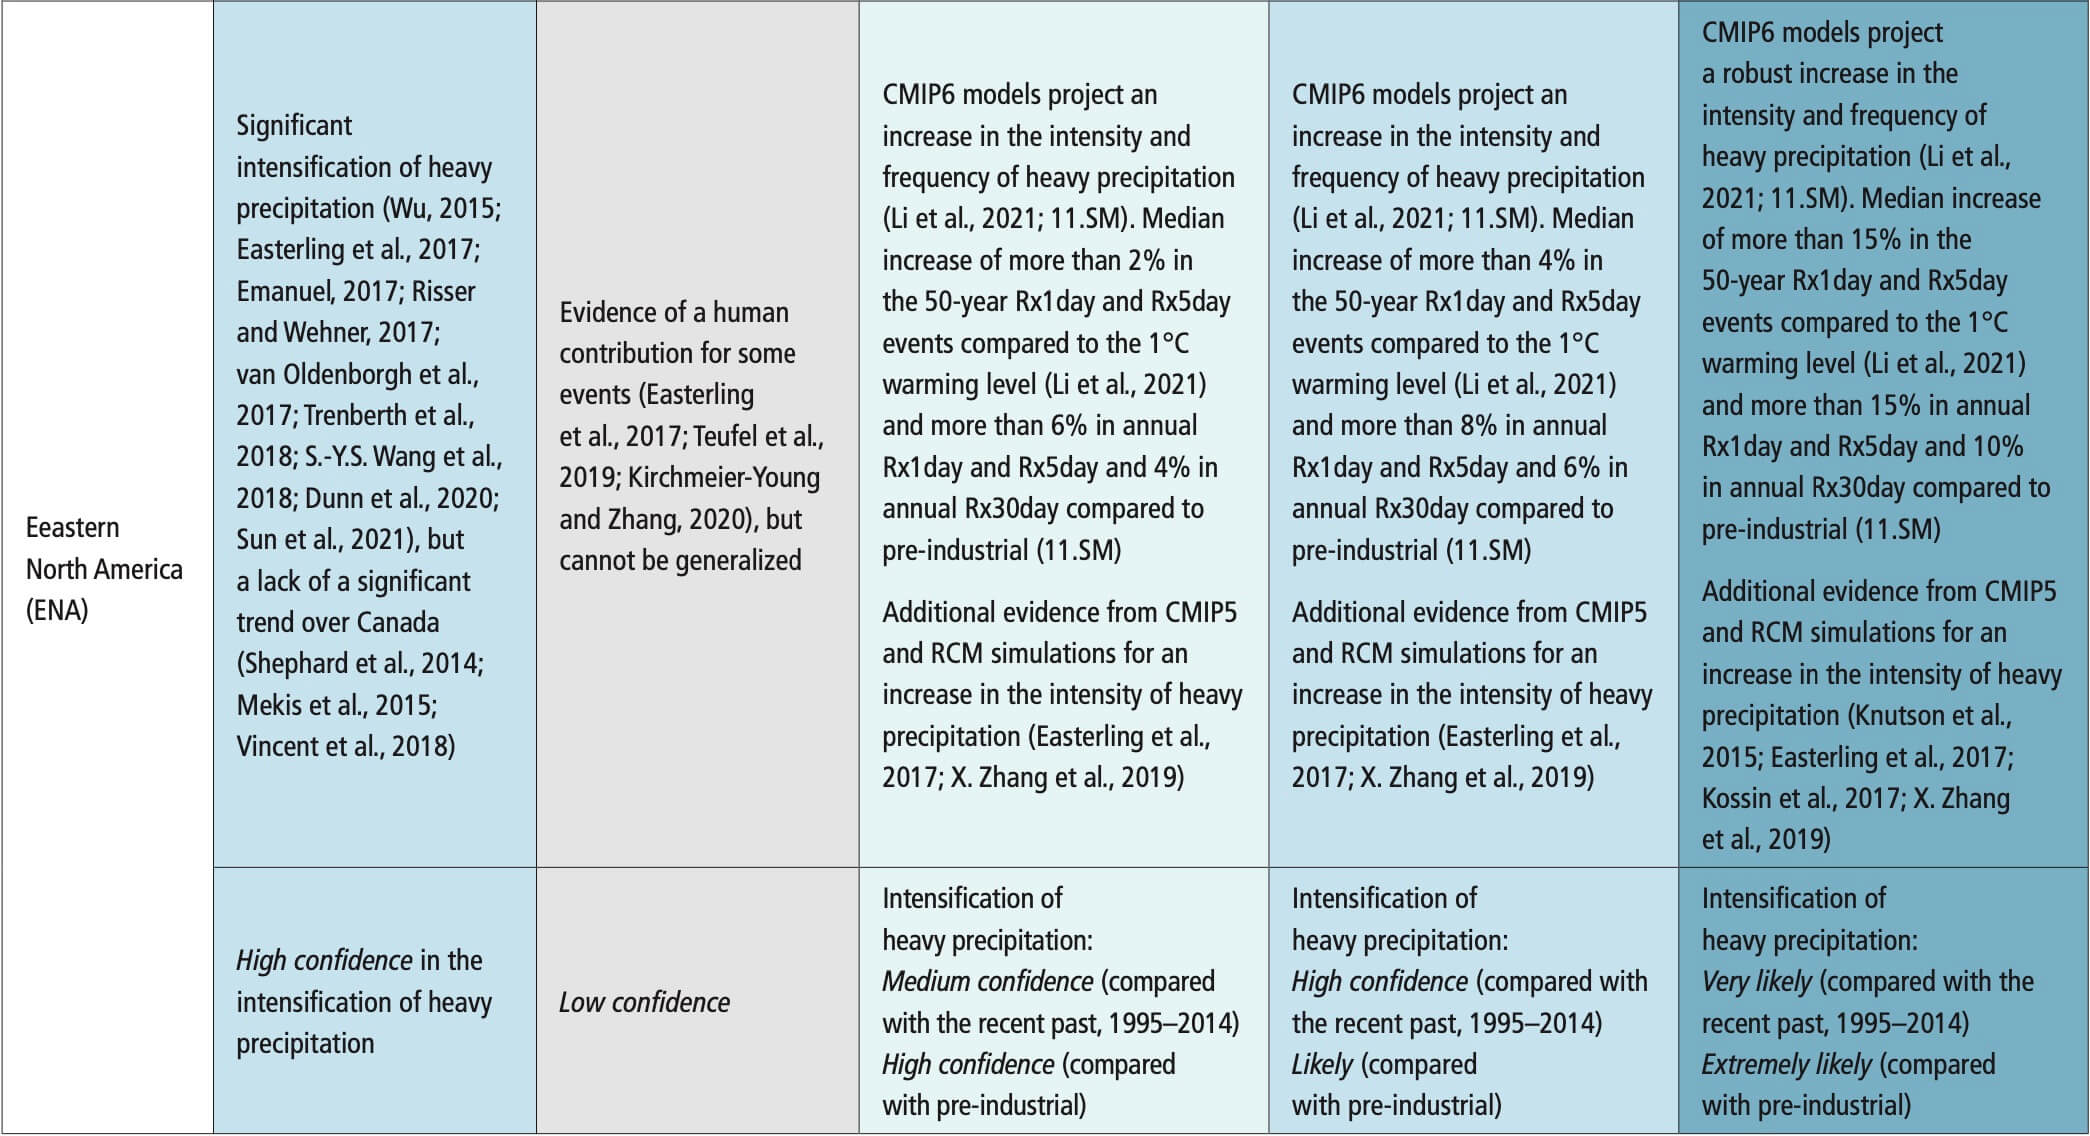
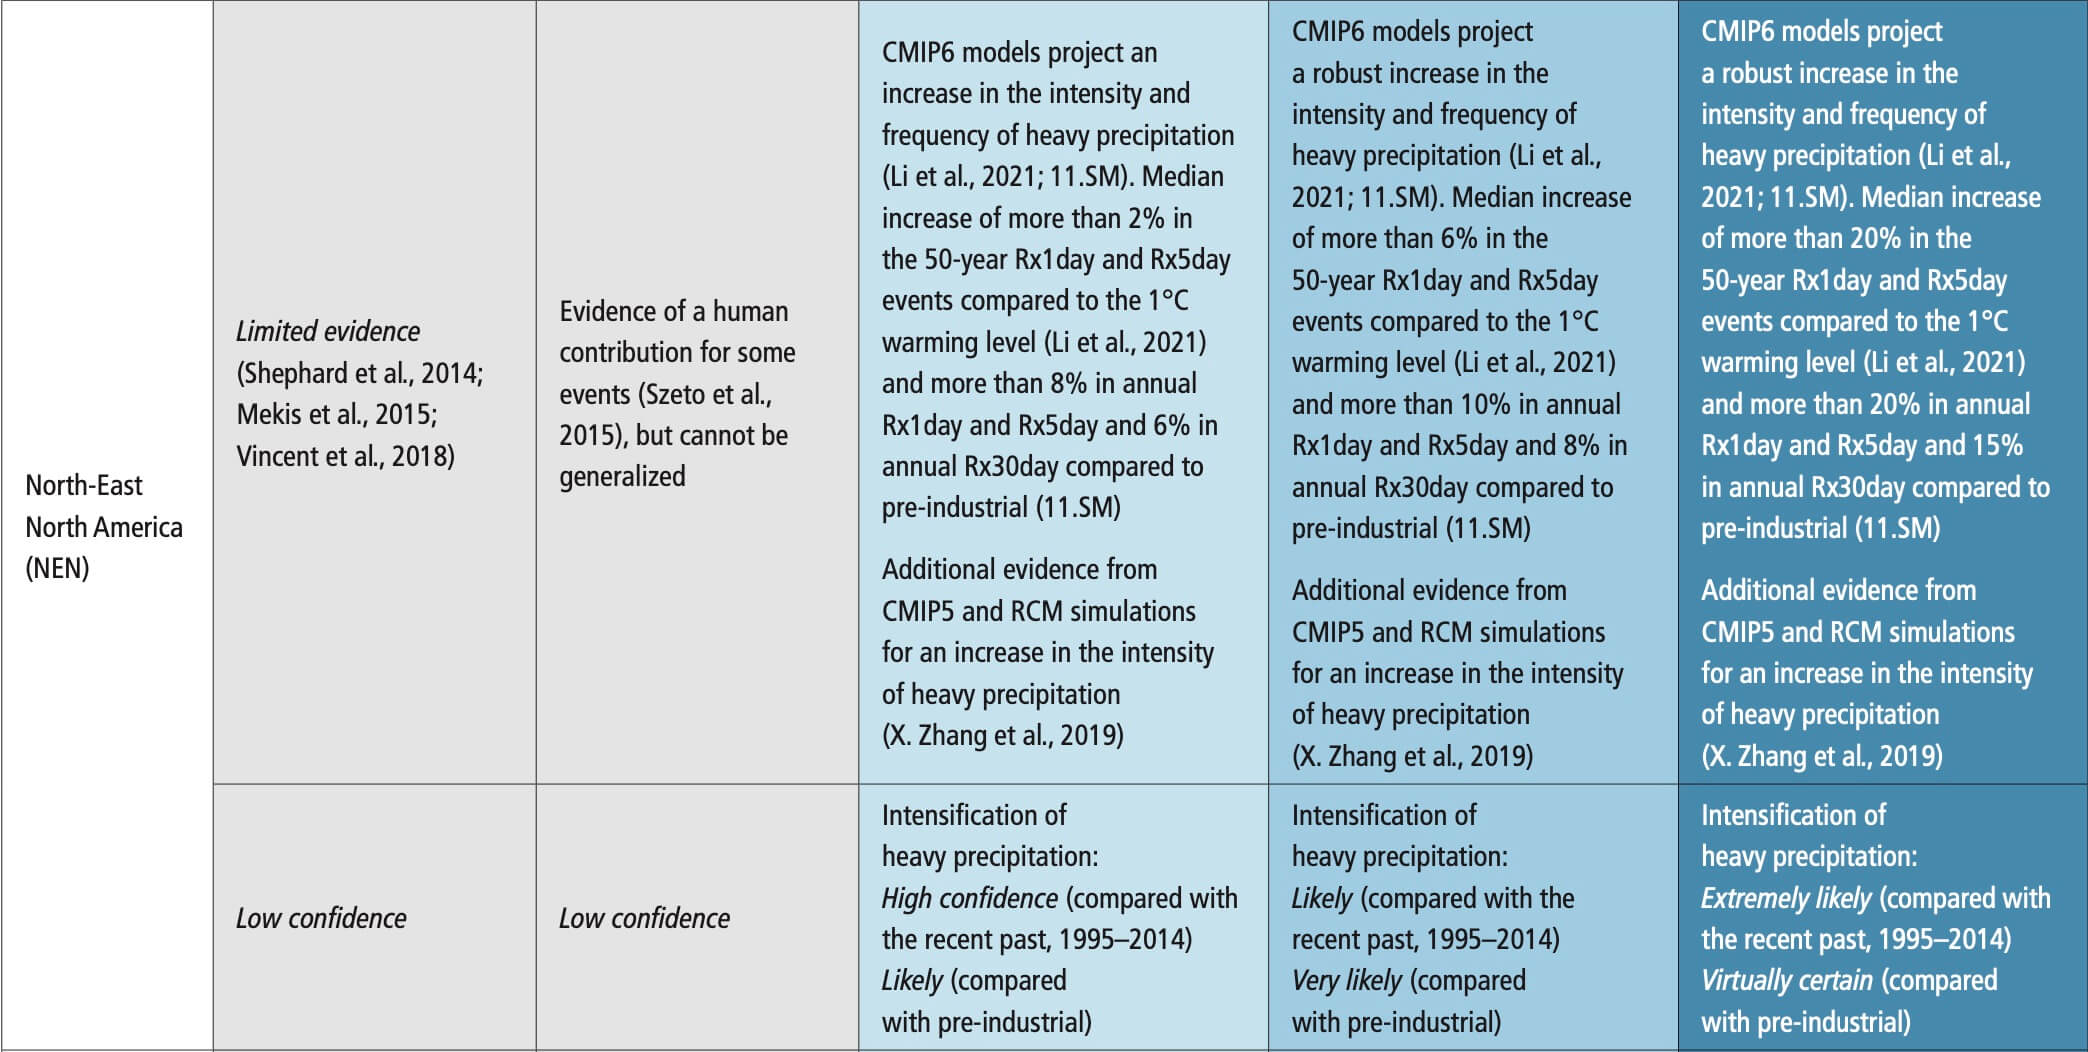
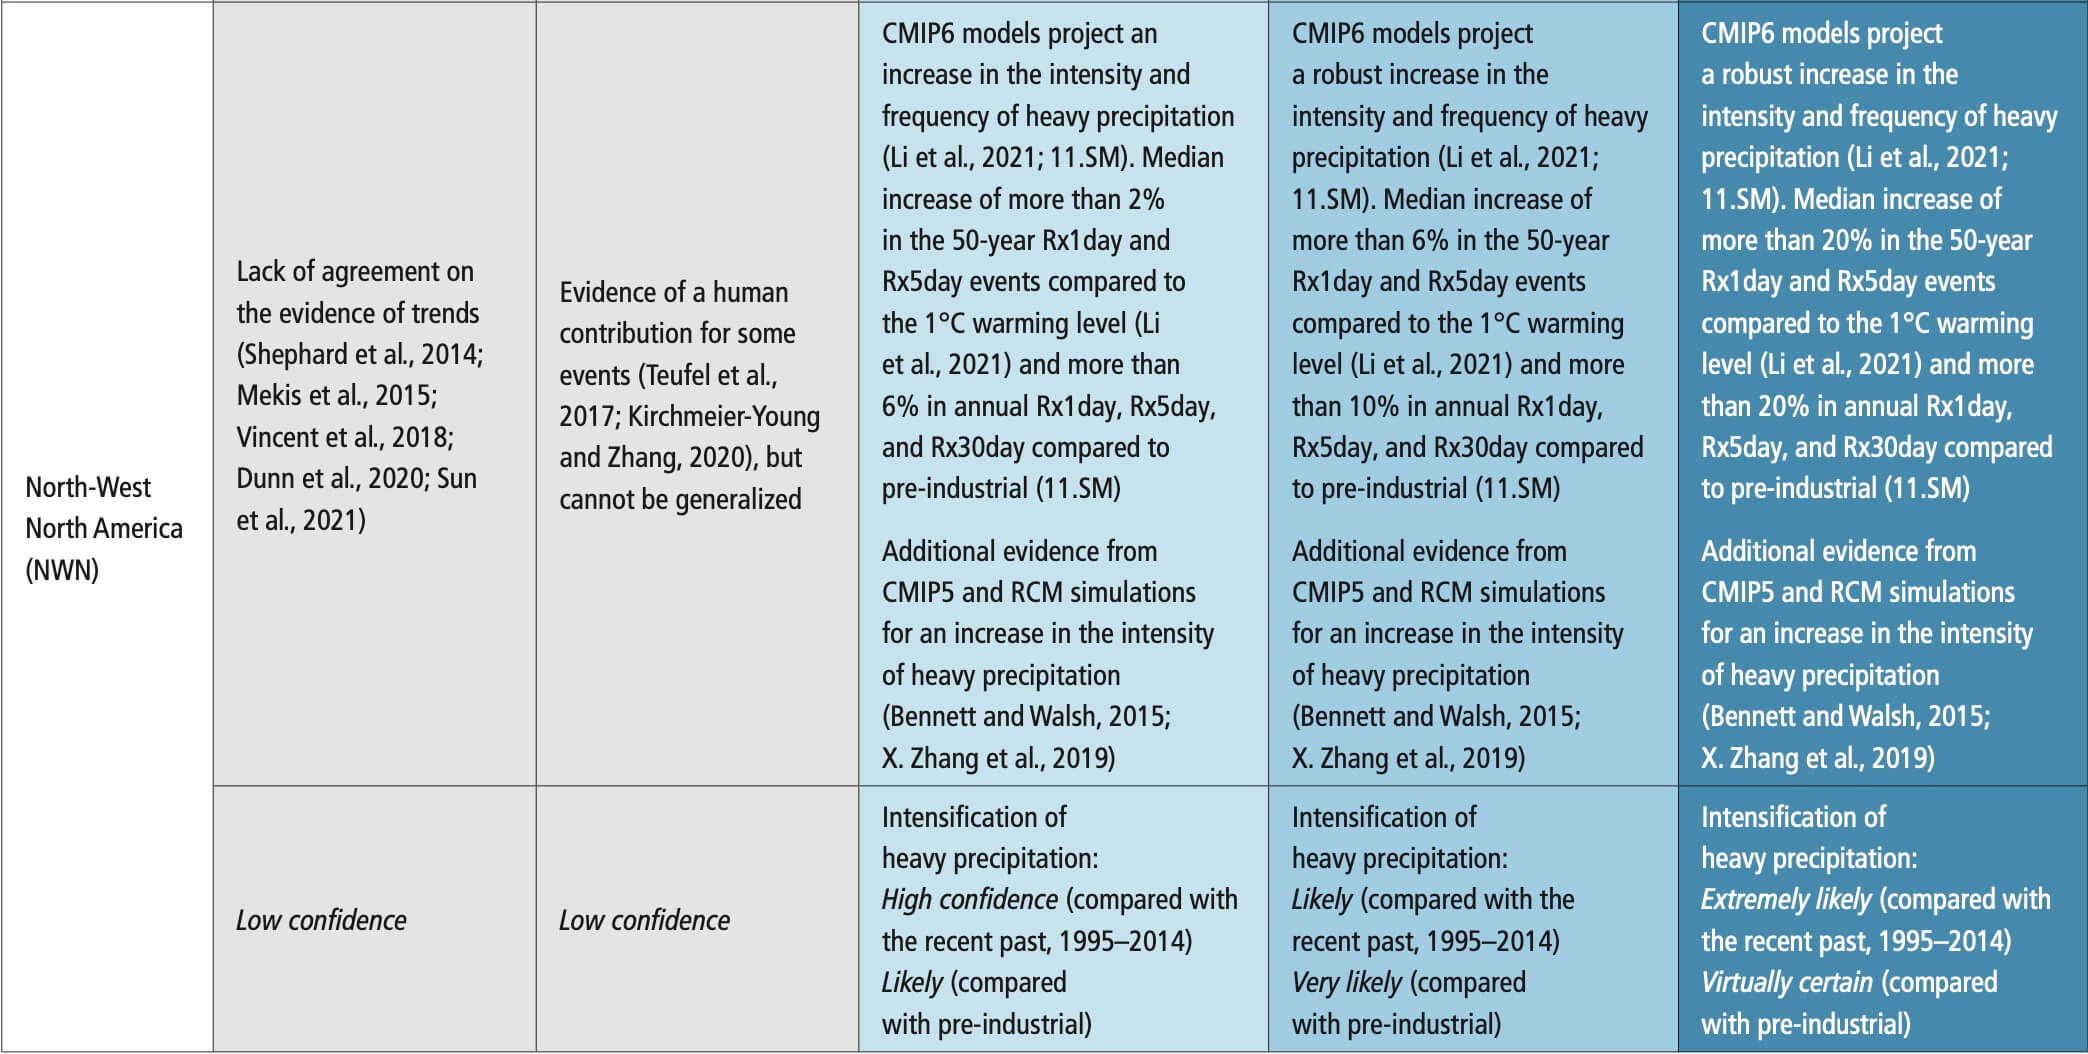 Table 11.21 | Observed trends, human contribution to observed trends, and projected changes at 1.5°C, 2°C and 4°C of global warming for meteorological droughts (MET), agricultural and ecological droughts (AGR/ECOL), and hydrological droughts (HYDR) in North America, subdivided by AR6 regions. See Sections 11.9.1 and 11.9.4 for details.
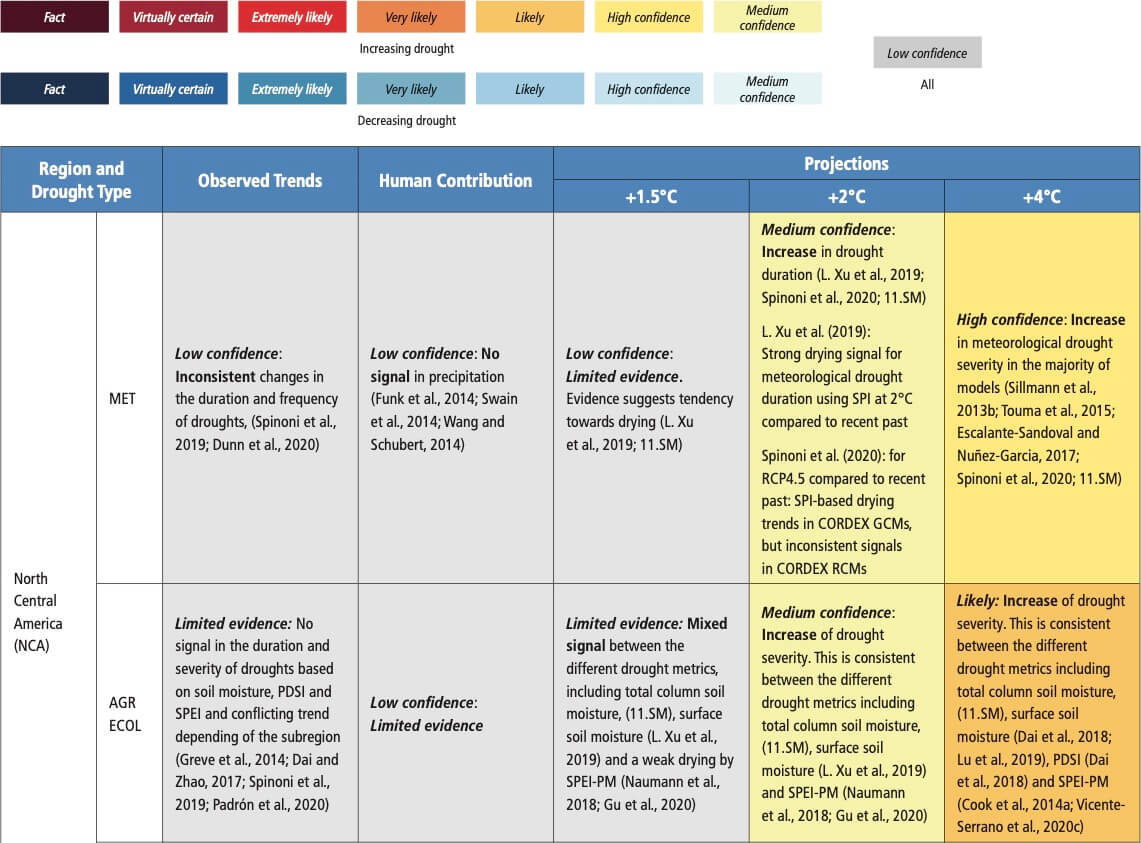
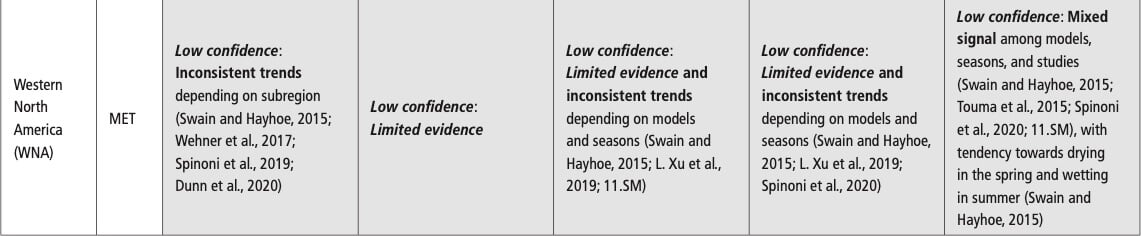
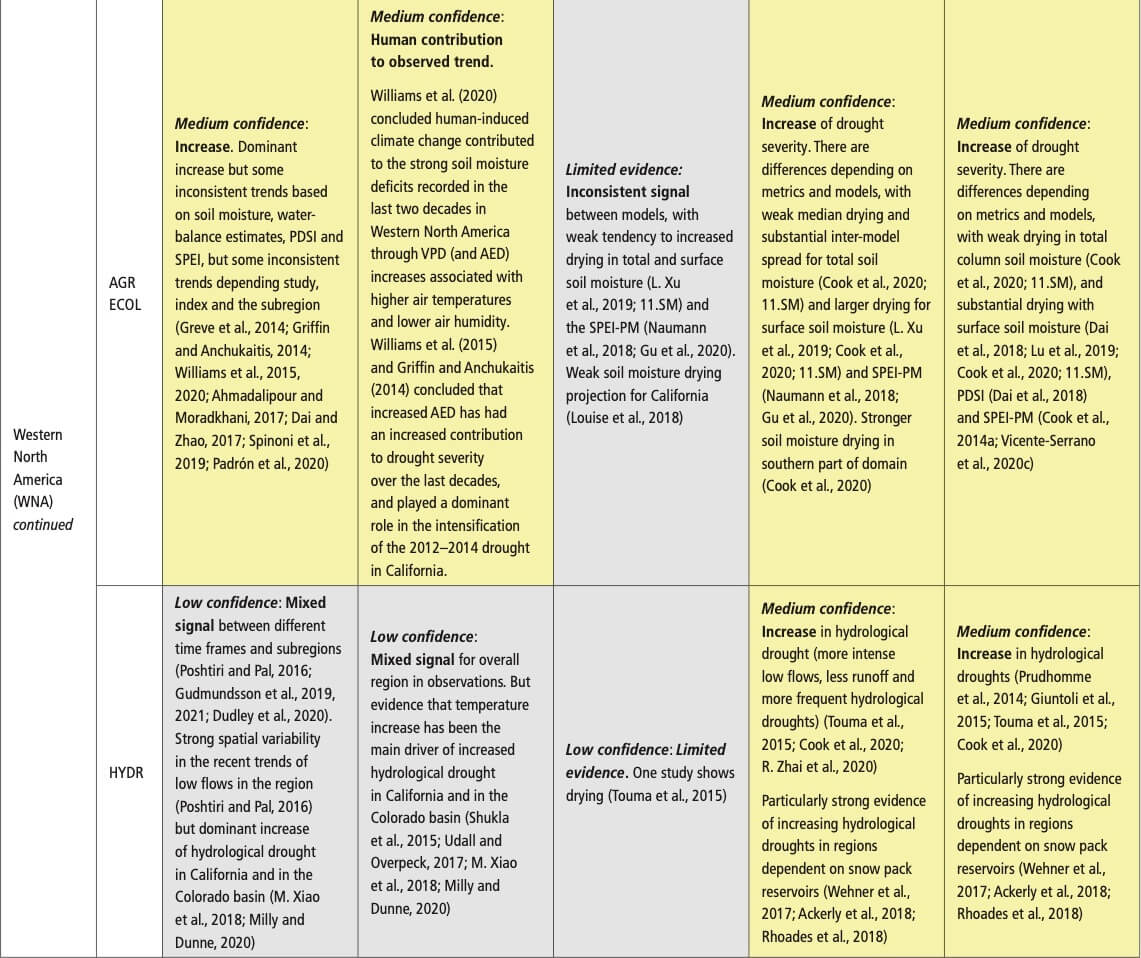
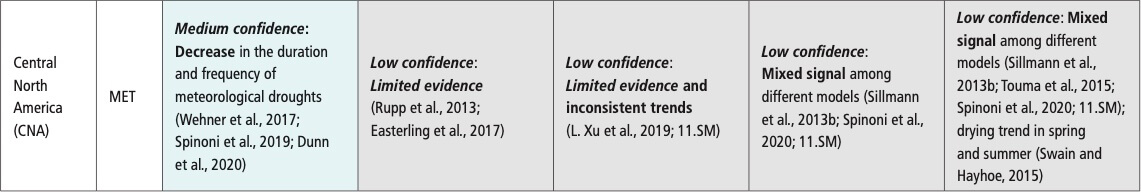
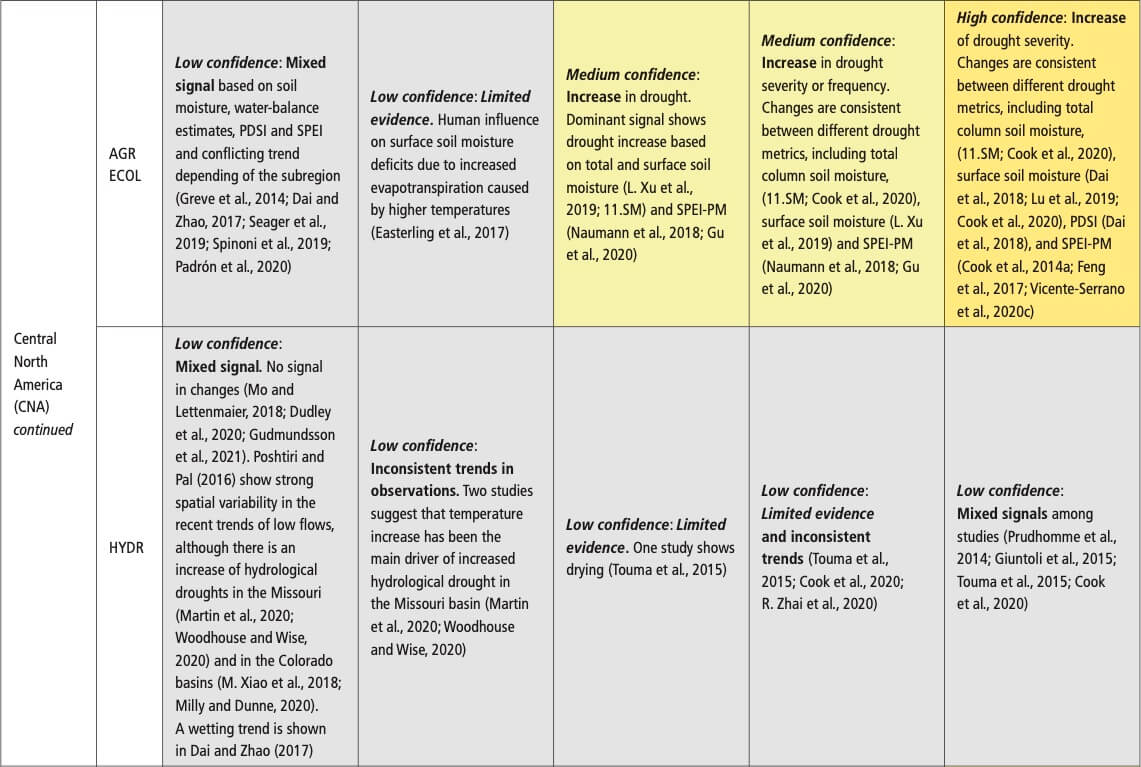
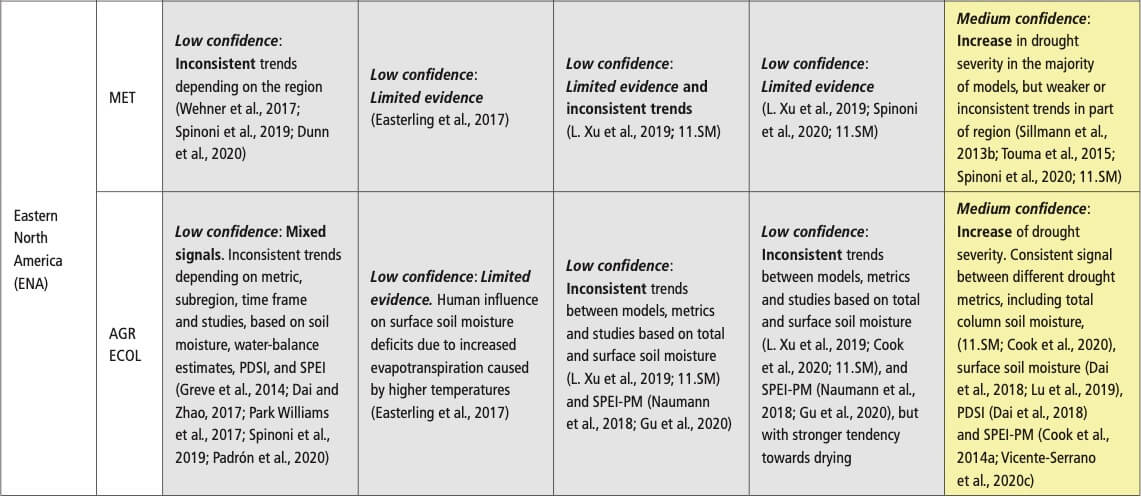
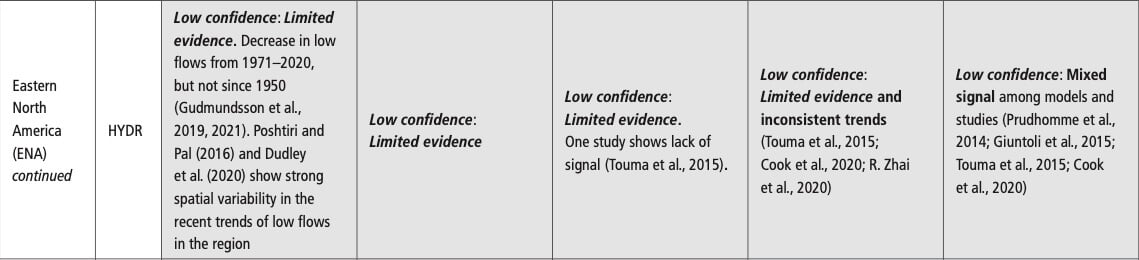
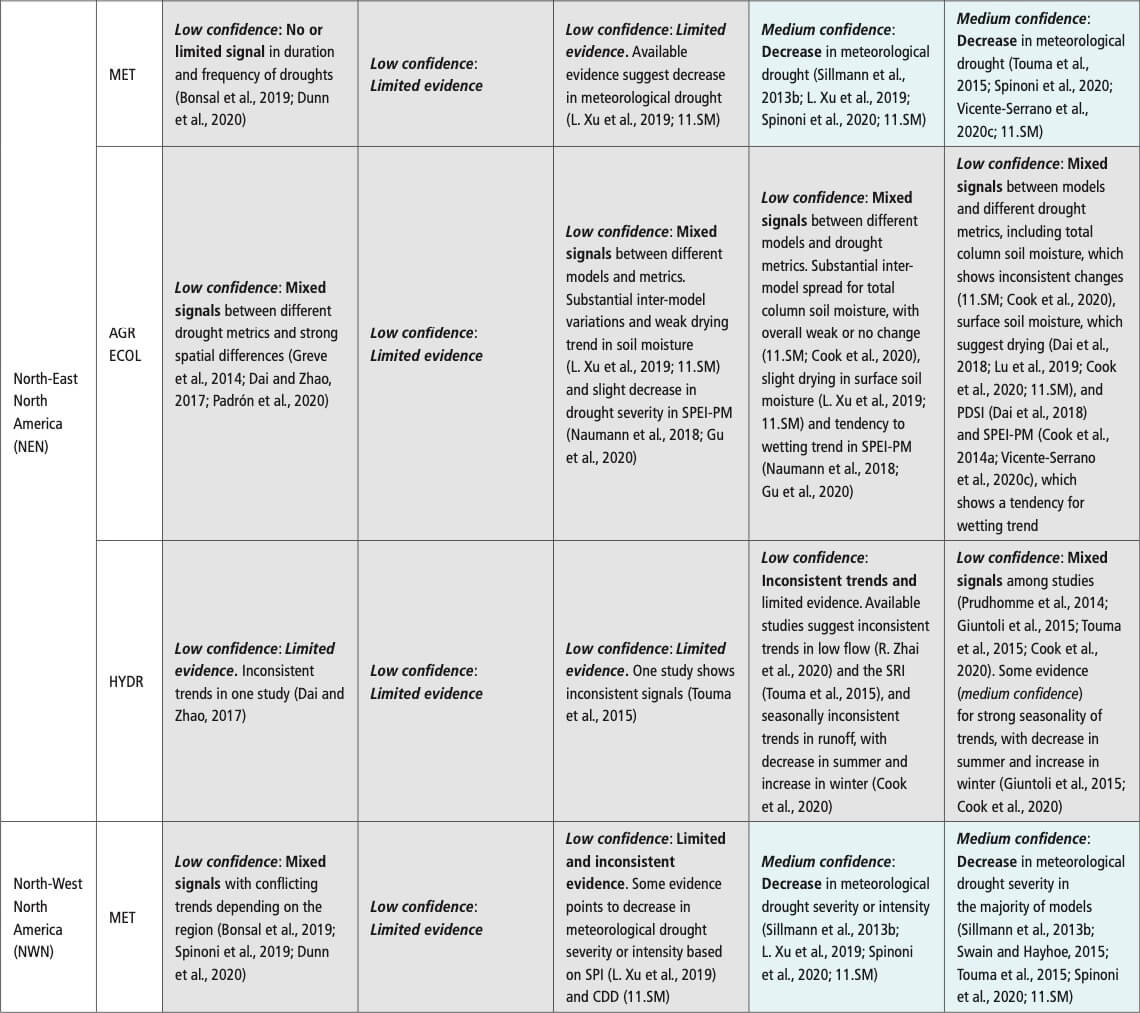
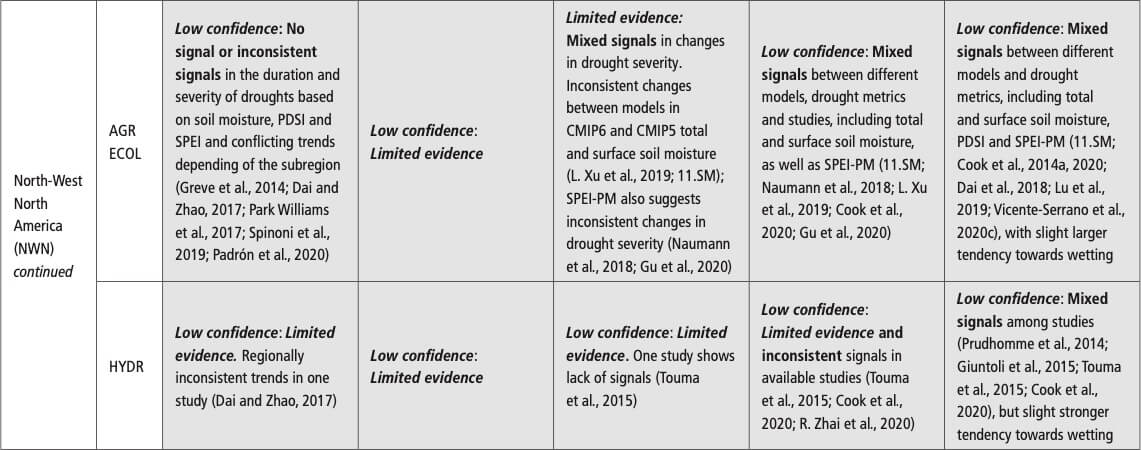
References
Abatzoglou, J.T. and A.P. Williams, 2016: Impact of anthropogenic climate change on wildfire across western US forests. Proceedings of the National Academy of Sciences, 113(42), 11770–11775, doi: 10.1073/pnas.1607171113.
Abaurrea, J., J. Asín, and A.C. Cebrián, 2018: Modelling the occurrence of heat waves in maximum and minimum temperatures over Spain and projections for the period 2031–60. Global and Planetary Change, 161, 244–260, doi: 10.1016/j.gloplacha.2017.11.015.
Abiodun, B.J., N. Makhanya, B. Petja, A.A. Abatan, and P.G. Oguntunde, 2019: Future projection of droughts over major river basins in Southern Africa at specific global warming levels. Theoretical and Applied Climatology, 137(3–4), 1785–1799, doi: 10.1007/s00704-018-2693-0.
Abiodun, B.J. et al., 2017: Potential impacts of climate change on extreme precipitation over four African coastal cities. Climatic Change, 143(3–4), 399–413, doi: 10.1007/s10584-017-2001-5.
Acar Deniz, Z. and B. Gönençgil, 2015: Trends of summer daily maximum temperature extremes in Turkey. Physical Geography, 36(4), 268–281, doi: 10.1080/02723646.2015.1045285.
Acero, F.J., J.A. García, M.C. Gallego, S. Parey, and D. Dacunha-Castelle, 2014: Trends in summer extreme temperatures over the Iberian Peninsula using nonurban station data. Journal of Geophysical Research: Atmospheres, 119(1), 39–53, doi: 10.1002/2013jd020590.
Ackerly, D., A. Jones, M. Stacey, and B. Riordan, 2018: San Francisco Bay Area Summary Report. In: California’s Fourth Climate Change Assessment. SUM-CCCA4-2018-005, University of California Berkeley, Berkeley, CA, USA, www.climateassessment.ca.gov/regions/.
Adnan, M., N. Rehman, and J. Shahbir, 2016: Predicting the Frequency and Intensity of Climate Extremes by Regression Models. Journal of Climatology & Weather Forecasting, 4(3), 1000185, doi: 10.4172/2332-2594.1000185.
Aerenson, T., C. Tebaldi, B. Sanderson, and J.-F. Lamarque, 2018: Changes in a suite of indicators of extreme temperature and precipitation under 1.5 and 2 degrees warming. Environmental Research Letters, 13(3), 035009, doi: 10.1088/1748-9326/aaafd6.
Aerts, J.C.J.H. et al., 2018: Integrating human behaviour dynamics into flood disaster risk assessment. Nature Climate Change, 8(3), 193–199, doi: 10.1038/s41558-018-0085-1.
Agard, V. and K. Emanuel, 2017: Clausius–Clapeyron scaling of peak CAPE in continental convective storm environments. Journal of the Atmospheric Sciences, 74(9), 3043–3054, doi: 10.1175/jas-d-16-0352.1.
Agel, L. and M. Barlow, 2020: How well do CMIP6 historical runs match observed northeast U.S. precipitation and extreme precipitation-related circulation?Journal of Climate, 33(22), 9835–9848, doi: 10.1175/jcli-d-19-1025.1.
AghaKouchak, A., 2014: A baseline probabilistic drought forecasting framework using standardized soil moisture index: Application to the 2012 United States drought. Hydrology and Earth System Sciences, 18(7), 2485–2492, doi: 10.5194/hess-18-2485-2014.
AghaKouchak, A., L. Cheng, O. Mazdiyasni, and A. Farahmand, 2014: Global warming and changes in risk of concurrent climate extremes: Insights from the 2014 California drought. Geophysical Research Letters, 41(24), 8847–8852, doi: 10.1002/2014gl062308.
AghaKouchak, A. et al., 2020: Climate Extremes and Compound Hazards in a Warming World. Annual Review of Earth and Planetary Sciences, 48(1), 519–548, doi: 10.1146/annurev-earth-071719-055228.
Aguilar, E. et al., 2005: Changes in precipitation and temperature extremes in Central America and northern South America, 1961–2003. Journal of Geophysical Research: Atmospheres, 110(D23), D23107, doi: 10.1029/2005jd006119.
Aguilar, E. et al., 2009: Changes in temperature and precipitation extremes in western central Africa, Guinea Conakry, and Zimbabwe, 1955–2006. Journal of Geophysical Research: Atmospheres, 114(D2), D02115, doi: 10.1029/2008jd011010.
Ahlswede, B. and R.Q. Thomas, 2017: Community Earth System Model Simulations Reveal the Relative Importance of Afforestation and Forest Management to Surface Temperature in Eastern North America. Forests, 8(12), 499, doi: 10.3390/f8120499.
Ahmadalipour, A. and H. Moradkhani, 2017: Analyzing the uncertainty of ensemble-based gridded observations in land surface simulations and drought assessment. Journal of Hydrology, 555, 557–568, doi: 10.1016/j.jhydrol.2017.10.059.
Ahmed, M. et al., 2013: Continental-scale temperature variability during the past two millennia. Nature Geoscience, 6(5), 339–346, doi: 10.1038/ngeo1797.
Ahn, J.-B. et al., 2016: Changes of precipitation extremes over South Korea projected by the 5 RCMs under RCP scenarios. Asia-Pacific Journal of Atmospheric Sciences, 52(2), 223–236, doi: 10.1007/s13143-016-0021-0.
Aich, V. et al., 2016: Flood projections within the Niger River Basin under future land use and climate change. Science of the Total Environment, 562, 666–677, doi: 10.1016/j.scitotenv.2016.04.021.
Akinsanola, A.A. and W. Zhou, 2019: Projections of West African summer monsoon rainfall extremes from two CORDEX models. Climate Dynamics, 52(3–4), 2017–2028, doi: 10.1007/s00382-018-4238-8.
Akinsanola, A.A., G.J. Kooperman, A.G. Pendergrass, W.M. Hannah, and K.A. Reed, 2020: Seasonal representation of extreme precipitation indices over the United States in CMIP6 present-day simulations. Environmental Research Letters, 15(9), 094003, doi: 10.1088/1748-9326/ab92c1.
Akinyemi, F.O. and B.J. Abiodun, 2019: Potential impacts of global warming levels 1.5°C and above on climate extremes in Botswana. Climatic Change, 154(3–4), 387–400, doi: 10.1007/s10584-019-02446-1.
Albergel, C. et al., 2013: Skill and Global Trend Analysis of Soil Moisture from Reanalyses and Microwave Remote Sensing. Journal of Hydrometeorology, 14(4), 1259–1277, doi: 10.1175/jhm-d-12-0161.1.
Alexander, L.V., 2016: Global observed long-term changes in temperature and precipitation extremes: A review of progress and limitations in IPCC assessments and beyond. Weather and Climate Extremes, 11, 4–16, doi: 10.1016/j.wace.2015.10.007.
Alexander, L.V. and J.M. Arblaster, 2017: Historical and projected trends in temperature and precipitation extremes in Australia in observations and CMIP5. Weather and Climate Extremes, 15, 34–56, doi: 10.1016/j.wace.2017.02.001.
Alexander, L.V. et al., 2019: On the use of indices to study extreme precipitation on sub-daily and daily timescales. Environmental Research Letters, 14(12), 125008, doi: 10.1088/1748-9326/ab51b6.
Alexandru, A., 2018: Consideration of land-use and land-cover changes in the projection of climate extremes over North America by the end of the twenty-first century. Climate Dynamics, 50(5–6), 1949–1973, doi: 10.1007/s00382-017-3730-x.
Alfieri, L. et al., 2017: Global projections of river flood risk in a warmer world. Earth’s Future, 5(2), 171–182, doi: 10.1002/2016ef000485.
Ali, H. and V. Mishra, 2018: Contributions of Dynamic and Thermodynamic Scaling in Subdaily Precipitation Extremes in India. Geophysical Research Letters, 45(5), 2352–2361, doi: 10.1002/2018gl077065.
Ali, H., P. Modi, and V. Mishra, 2019: Increased flood risk in Indian sub-continent under the warming climate. Weather and Climate Extremes, 25, 100212, doi: 10.1016/j.wace.2019.100212.
Ali, H., H.J. Fowler, G. Lenderink, E. Lewis, and D. Pritchard, 2021: Consistent Large-Scale Response of Hourly Extreme Precipitation to Temperature Variation Over Land. Geophysical Research Letters, 48(4), e2020GL090317, doi: 10.1029/2020gl090317.
Ali, S. et al., 2019: Assessment of climate extremes in future projections downscaled by multiple statistical downscaling methods over Pakistan. Atmospheric Research, 222, 114–133, doi: 10.1016/j.atmosres.2019.02.009.
Alizadeh, M.R. et al., 2020: A century of observations reveals increasing likelihood of continental-scale compound dry-hot extremes. Science Advances, 6(39), eaaz4571, doi: 10.1126/sciadv.aaz4571.
Alkama, R. and A. Cescatti, 2016: Biophysical climate impacts of recent changes in global forest cover. Science, 351(6273), 600–604, doi: 10.1126/science.aac8083.
Allan, R.P. et al., 2020: Advances in understanding large-scale responses of the water cycle to climate change. Annals of the New York Academy of Sciences, 1472(1), 49–75, doi: 10.1111/nyas.14337.
Allen, C.D., D.D. Breshears, and N.G. McDowell, 2015: On underestimation of global vulnerability to tree mortality and forest die-off from hotter drought in the Anthropocene. Ecosphere, 6(8), 1–55, doi: 10.1890/es15-00203.1.
Allen, J.T., 2018: Climate Change and Severe Thunderstorms. In: Oxford Research Encyclopedia of Climate Science. Oxford University Press, Oxford, UK, pp. 1–65, doi: 10.1093/acrefore/9780190228620.013.62.
Allen, M.R. et al., 2018: Framing and Context. In: Global Warming of 1.5°C. An IPCC Special Report on the impacts of global warming of 1.5°C abovepre-industriallevels and related global greenhouse gas emission pathways, in the context of strengthening the global response to the threat of climate change, sustainable development, and efforts to eradicate poverty[Masson-Delmotte, V., P. Zhai, H.-O. Pörtner, D. Roberts, J. Skea, P.R. Shukla, A. Pirani, W. Moufouma-Okia, C. Péan, R. Pidcock, S. Connors, J.B.R. Matthews, Y. Chen, X. Zhou, M.I. Gomis, E. Lonnoy, T. Maycock, M. Tignor, and T. Waterfield (eds.)]. In Press, pp. 49–92, www.ipcc.ch/sr15/chapter/chapter-1.
Almazroui, M., 2019a: Assessment of meteorological droughts over Saudi Arabia using surface rainfall observations during the period 1978–2017. Arabian Journal of Geosciences, 12(22), 694, doi: 10.1007/s12517-019-4866-2.
Almazroui, M., 2019b: Temperature Changes over the CORDEX-MENA Domain in the 21st Century Using CMIP5 Data Downscaled with RegCM4: A Focus on the Arabian Peninsula. Advances in Meteorology, 2019, 5395676, doi: 10.1155/2019/5395676.
Almazroui, M. and M.N. Islam, 2019: Coupled Model Inter-comparison Project Database to Calculate Drought Indices for Saudi Arabia: A Preliminary Assessment. Earth Systems and Environment, 3(3), 419–428, doi: 10.1007/s41748-019-00126-9.
Almazroui, M. and S. Saeed, 2020: Contribution of extreme daily precipitation to total rainfall over the Arabian Peninsula. Atmospheric Research, 231, 104672, doi: 10.1016/j.atmosres.2019.104672.
Almazroui, M., M.N. Islam, R. Dambul, and P.D. Jones, 2014: Trends of temperature extremes in Saudi Arabia. International Journal of Climatology, 34(3), 808–826, doi: 10.1002/joc.3722.
AlSarmi, S.H. and R. Washington, 2014: Changes in climate extremes in the Arabian Peninsula: analysis of daily data. International Journal of Climatology, 34(5), 1329–1345, doi: 10.1002/joc.3772.
Althoff, D., L.N. Rodrigues, and D.D. da Silva, 2020: Impacts of climate change on the evaporation and availability of water in small reservoirs in the Brazilian savannah. Climatic Change, 159(2), 215–232, doi: 10.1007/s10584-020-02656-y.
Altman, J. et al., 2018: Poleward migration of the destructive effects of tropical cyclones during the 20th century. Proceedings of the National Academy of Sciences, 115(45), 11543–11548, doi: 10.1073/pnas.1808979115.
Amann, B., S. Szidat, and M. Grosjean, 2015: A millennial-long record of warm season precipitation and flood frequency for the North-western Alps inferred from varved lake sediments: implications for the future. Quaternary Science Reviews, 115, 89–100, doi: 10.1016/j.quascirev.2015.03.002.
Andela, N. et al., 2017: A human-driven decline in global burned area. Science, 356(6345), 1356–1362, doi: 10.1126/science.aal4108.
Anderegg, W.R.L., J.M. Kane, and L.D.L. Anderegg, 2013: Consequences of widespread tree mortality triggered by drought and temperature stress. Nature Climate Change, 3(1), 30–36, doi: 10.1038/nclimate1635.
Anderegg, W.R.L., A.T. Trugman, G. Badgley, A.G. Konings, and J. Shaw, 2020: Divergent forest sensitivity to repeated extreme droughts. Nature Climate Change, 10(12), 1091–1095, doi: 10.1038/s41558-020-00919-1.
Anderegg, W.R.L. et al., 2012: The roles of hydraulic and carbon stress in a widespread climate-induced forest die-off. Proceedings of the National Academy of Sciences, 109(1), 233–237, doi: 10.1073/pnas.1107891109.
Anderegg, W.R.L. et al., 2016: Meta-analysis reveals that hydraulic traits explain cross-species patterns of drought-induced tree mortality across the globe. Proceedings of the National Academy of Sciences, 113(18), 5024–5029, doi: 10.1073/pnas.1525678113.
Anderson, R.G. et al., 2011: Biophysical considerations in forestry for climate protection. Frontiers in Ecology and the Environment, 9(3), 174–182, doi: 10.1890/090179.
Anderson, W.B., R. Seager, W. Baethgen, M. Cane, and L. You, 2019: Synchronous crop failures and climate-forced production variability. Science Advances, 5(7), eaaw1976, doi: 10.1126/sciadv.aaw1976.
Anderson-Teixeira, K.J. et al., 2012: Climate-regulation services of natural and agricultural ecoregions of the Americas. Nature Climate Change, 2(3), 177–181, doi: 10.1038/nclimate1346.
Añel, J.A. et al., 2014: The Extreme Snow Accumulation in the Western Spanish Pyrenees during Winter and Spring 2013 [in “Explaining Extreme Events of 2013 from a Climate Perspective”]. Bulletin of the American Meteorological Society, 95(9), S73–S76, doi: 10.1175/1520-0477-95.9.s1.1.
Angeles-Malaspina, M., J.E. González-Cruz, and N. Ramírez-Beltran, 2018: Projections of Heat Waves Events in the Intra-Americas Region Using Multimodel Ensemble. Advances in Meteorology, 2018, 1–16, doi: 10.1155/2018/7827984.
Angélil, O. et al., 2014: Attribution of extreme weather to anthropogenic greenhouse gas emissions: Sensitivity to spatial and temporal scales. Geophysical Research Letters, 41(6), 2150–2155, doi: 10.1002/2014gl059234.
Angélil, O. et al., 2016: Comparing regional precipitation and temperature extremes in climate model and reanalysis products. Weather and Climate Extremes, 13, 35–43, doi: 10.1016/j.wace.2016.07.001.
Angélil, O. et al., 2017: An Independent Assessment of Anthropogenic Attribution Statements for Recent Extreme Temperature and Rainfall Events. Journal of Climate, 30(1), 5–16, doi: 10.1175/jcli-d-16-0077.1.
Angélil, O. et al., 2018: On the nonlinearity of spatial scales in extreme weather attribution statements. Climate Dynamics, 50(7–8), 2739–2752, doi: 10.1007/s00382-017-3768-9.
Antonescu, B., D.M. Schultz, A. Holzer, and P. Groenemeijer, 2016a: Tornadoes in Europe: An Underestimated Threat. Bulletin of the American Meteorological Society, 98(4), 713–728, doi: 10.1175/bams-d-16-0171.1.
Antonescu, B., D.M. Schultz, F. Lomas, and T. Kühne, 2016b: Tornadoes in Europe: Synthesis of the Observational Datasets. Monthly Weather Review, 144(7), 2445–2480, doi: 10.1175/m wr-d-15-0298.1.
Apurv, T., M. Sivapalan, and X. Cai, 2017: Understanding the Role of Climate Characteristics in Drought Propagation. Water Resources Research, 53(11), 9304–9329, doi: 10.1002/2017wr021445.
Aragão, L.E.O.C. et al., 2018: 21st Century drought-related fires counteract the decline of Amazon deforestation carbon emissions. Nature Communications, 9(1), 536, doi: 10.1038/s41467-017-02771-y.
Arblaster, J.M. et al., 2014: Understanding Australia’s hottest September on record [in “Explaining Extreme Events of 2013 from a Climate Perspective”]. Bulletin of the American Meteorological Society, 95(9), S37–S41, doi: 10.1175/1520-0477-95.9.s1.1.
Archer, D.R. and H.J. Fowler, 2018: Characterising flash flood response to intense rainfall and impacts using historical information and gauged data in Britain. Journal of Flood Risk Management, 11(S1), S121–S133, doi: 10.1111/jfr3.12187.
Archer, D.R., G. Parkin, and H.J. Fowler, 2016: Assessing long term flash flooding frequency using historical information. Hydrology Research, 48(1), 1–16, doi: 10.2166/nh.2016.031.
Archfield, S.A., R.M. Hirsch, A. Viglione, and G. Blöschl, 2016: Fragmented patterns of flood change across the United States. Geophysical Research Letters, 43(19), 10232–10239, doi: 10.1002/2016gl070590.
Argüeso, D., A. Di Luca, and J.P. Evans, 2016: Precipitation over urban areas in the western Maritime Continent using a convection-permitting model. Climate Dynamics, 47(3–4), 1143–1159, doi: 10.1007/s00382-015-2893-6.
Argüeso, D., J.M. Hidalgo-Muñoz, S.R. Gámiz-Fortis, M.J. Esteban-Parra, and Y. Castro-Díez, 2012: Evaluation of WRF Mean and Extreme Precipitation over Spain: Present Climate (1970–99). Journal of Climate, 25(14), 4883–4897, doi: 10.1175/jcli-d-11-00276.1.
Armstrong, W.H., M.J. Collins, and N.P. Snyder, 2014: Hydroclimatic flood trends in the northeastern United States and linkages with large-scale atmospheric circulation patterns. Hydrological Sciences Journal, 59(9), 1636–1655, doi: 10.1080/02626667.2013.862339.
Arnell, N.W. and S.N. Gosling, 2016: The impacts of climate change on river flood risk at the global scale. Climatic Change, 134(3), 387–401, doi: 10.1007/s10584-014-1084-5.
Arnone, E., D. Pumo, F. Viola, L. Noto, and G. La Loggia, 2013: Rainfall statistics changes in Sicily. Hydrology and Earth System Sciences, 17(7), 2449–2458, doi: 10.5194/hess-17-2449-2013.
Ashabokov, B.A., A.A. Tashilova, L.A. Kesheva, and Z.A. Taubekova, 2017: Trends in precipitation parameters in the climate zones of southern Russia (1961–2011). Russian Meteorology and Hydrology, 42(3), 150–158, doi: 10.3103/s1068373917030025.
Asmerom, Y., V.J. Polyak, J.B.T. Rasmussen, S.J. Burns, and M. Lachniet, 2013: Multidecadal to multicentury scale collapses of Northern Hemisphere monsoons over the past millennium. Proceedings of the National Academy of Sciences, 110(24), 9651–9656, doi: 10.1073/pnas.1214870110.
Atif, R.M. et al., 2020: Extreme precipitation events over Saudi Arabia during the wet season and their associated teleconnections. Atmospheric Research, 231, 104655, doi: 10.1016/j.atmosres.2019.104655.
Ault, T.R., 2020: On the essentials of drought in a changing climate. Science, 368(6488), 256–260, doi: 10.1126/science.aaz5492.
Ault, T.R., J.E. Cole, J.T. Overpeck, G.T. Pederson, and D.M. Meko, 2014: Assessing the Risk of Persistent Drought Using Climate Model Simulations and Paleoclimate Data. Journal of Climate, 27(20), 7529–7549, doi: 10.1175/jcli-d-12-00282.1.
Avila, F.B. et al., 2015: Systematic investigation of gridding-related scaling effects on annual statistics of daily temperature and precipitation maxima: A case study for south-east Australia. Weather and Climate Extremes, 9, 6–16, doi: 10.1016/j.wace.2015.06.003.
Ávila, A., F. Justino, A. Wilson, D. Bromwich, and M. Amorim, 2016: Recent precipitation trends, flash floods and landslides in southern Brazil. Environmental Research Letters, 11(11), 114029, doi: 10.1088/1748-9326/11/11/114029.
Avila-Diaz, A., V. Benezoli, F. Justino, R. Torres, and A. Wilson, 2020: Assessing current and future trends of climate extremes across Brazil based on reanalyses and earth system model projections. Climate Dynamics, 55(5–6), 1403–1426, doi: 10.1007/s00382-020-05333-z.
Azorin-Molina, C. et al., 2015: Atmospheric evaporative demand observations, estimates and driving factors in Spain (1961–2011). Journal of Hydrology, 523, 262–277, doi: 10.1016/j.jhydrol.2015.01.046.
Azorin-Molina, C. et al., 2017: Assessing the impact of measurement time interval when calculating wind speed means and trends under the stilling phenomenon. International Journal of Climatology, 37(1), 480–492, doi: 10.1002/joc.4720.
Baburaj, P.P., S. Abhilash, K. Mohankumar, and A.K. Sahai, 2020: On the Epochal Variability in the Frequency of Cyclones during the Pre-Onset and Onset Phases of the Monsoon over the North Indian Ocean. Advances in Atmospheric Sciences, 37(6), 634–651, doi: 10.1007/s00376-020-9070-5.
Bacmeister, J.T. et al., 2018: Projected changes in tropical cyclone activity under future warming scenarios using a high-resolution climate model. Climatic Change, 146(3), 547–560, doi: 10.1007/s10584-016-1750-x.
Bador, M., L. Terray, and J. Boé, 2016: Detection of anthropogenic influence on the evolution of record-breaking temperatures over Europe. Climate Dynamics, 46(9–10), 2717–2735, doi: 10.1007/s00382-015-2725-8.
Bador, M. et al., 2020: Impact of Higher Spatial Atmospheric Resolution on Precipitation Extremes Over Land in Global Climate Models. Journal of Geophysical Research: Atmospheres, 125(13), e2019JD032184, doi: 10.1029/2019jd032184.
Baek, H.-J., M.-K. Kim, and W.-T. Kwon, 2017: Observed short- and long-term changes in summer precipitation over South Korea and their links to large-scale circulation anomalies. International Journal of Climatology, 37(2), 972–986, doi: 10.1002/joc.4753.
Baek, S.H., N.J. Steiger, J.E. Smerdon, and R. Seager, 2019: Oceanic Drivers of Widespread Summer Droughts in the United States Over the Common Era. Geophysical Research Letters, 46(14), 8271–8280, doi: 10.1029/2019gl082838.
Bai, P., X. Liu, K. Liang, and C. Liu, 2016: Investigation of changes in the annual maximum flood in the Yellow River basin, China. Quaternary International, 392, 168–177, doi: 10.1016/j.quaint.2015.04.053.
Balaguru, K., G.R. Foltz, and L.R. Leung, 2018: Increasing Magnitude of Hurricane Rapid Intensification in the Central and Eastern Tropical Atlantic. Geophysical Research Letters, 45(9), 4238–4247, doi: 10.1029/2018gl077597.
Balaji, M., A. Chakraborty, and M. Mandal, 2018: Changes in tropical cyclone activity in north Indian Ocean during satellite era (1981–2014). International Journal of Climatology, 38(6), 2819–2837, doi: 10.1002/joc.5463.
Ballesteros Cánovas, J.A., D. Trappmann, M. Shekhar, A. Bhattacharyya, and M. Stoffel, 2017: Regional flood-frequency reconstruction for Kullu district, Western Indian Himalayas. Journal of Hydrology, 546, 140–149, doi: 10.1016/j.jhydrol.2016.12.059.
Balsamo, G. et al., 2015: ERA-Interim/Land: a global land surface reanalysis data set. Hydrology and Earth System Sciences, 19(1), 389–407, doi: 10.5194/hess-19-389-2015.
Ban, N., J. Schmidli, and C. Schär, 2014: Evaluation of the convection-resolving regional climate modeling approach in decade-long simulations. Journal of Geophysical Research: Atmospheres, 119(13), 7889–7907, doi: 10.1002/2014jd021478.
Ban, N., J. Schmidli, and C. Schär, 2015: Heavy precipitation in a changing climate: Does short-term summer precipitation increase faster?Geophysical Research Letters, 42(4), 1165–1172, doi: 10.1002/2014gl062588.
Bandyopadhyay, N., C. Bhuiyan, and A.K. Saha, 2016: Heat waves, temperature extremes and their impacts on monsoon rainfall and meteorological drought in Gujarat, India. Natural Hazards, 82(1), 367–388, doi: 10.1007/s11069-016-2205-4.
Bao, J. and S.C. Sherwood, 2019: The Role of Convective Self-Aggregation in Extreme Instantaneous Versus Daily Precipitation. Journal of Advances in Modeling Earth Systems, 11(1), 19–33, doi: 10.1029/2018ms001503.
Bao, J., S.C. Sherwood, L. Alexander, and J.P. Evans, 2017: Future increases in extreme precipitation exceed observed scaling rates. Nature Climate Change, 7(2), 128–132, doi: 10.1038/nclimate3201.
Barbero, R., H.J. Fowler, G. Lenderink, and S. Blenkinsop, 2017: Is the intensification of precipitation extremes with global warming better detected at hourly than daily resolutions?Geophysical Research Letters, 44(2), 974–983, doi: 10.1002/2016gl071917.
Barcikowska, M.J. et al., 2018: Euro-Atlantic winter storminess and precipitation extremes under 1.5°C vs. 2°C warming scenarios. Earth System Dynamics, 9(2), 679–699, doi: 10.5194/esd-9-679-2018.
Bard, A. et al., 2015: Trends in the hydrologic regime of Alpine rivers. Journal of Hydrology, 529, 1823–1837, doi: 10.1016/j.jhydrol.2015.07.052.
Barella-Ortiz, A. and P. Quintana Seguí, 2019: Evaluation of drought representation and propagation in regional climate model simulations across Spain. Hydrology and Earth System Sciences, 23, 5111–5131, doi: 10.5194/hess-23-5111-2019.
Barichivich, J. et al., 2018: Recent intensification of Amazon flooding extremes driven by strengthened Walker circulation. Science Advances, 4(9), eaat8785, doi: 10.1126/sciadv.aat8785.
Barker, L.J., J. Hannaford, A. Chiverton, and C. Svensson, 2016: From meteorological to hydrological drought using standardised indicators. Hydrology and Earth System Sciences, 20(6), 2483–2505, doi: 10.5194/hess-20-2483-2016.
Barker, L.J. et al., 2019: Historic hydrological droughts 1891–2015: Systematic characterisation for a diverse set of catchments across the UK. Hydrology and Earth System Sciences, 23(11), 4583–4602, doi: 10.5194/hess-23-4583-2019.
Barkhordarian, A., S.S. Saatchi, A. Behrangi, P.C. Loikith, and C.R. Mechoso, 2019: A Recent Systematic Increase in Vapor Pressure Deficit over Tropical South America. Scientific Reports, 9(1), 15331, doi: 10.1038/s41598-019-51857-8.
Barlow, M. and A. Hoell, 2015: Drought in the Middle East and Central–Southwest Asia During Winter 2013/14. Bulletin of the American Meteorological Society, 96(12), S71–S76, doi: 10.1175/bams-d-15-00127.1.
Barlow, M. et al., 2016: A review of drought in the Middle East and southwest Asia. Journal of Climate, 29(23), 8547–8574, doi: 10.1175/jcli-d-13-00692.1.
Barnard, P.L. et al., 2017: Extreme oceanographic forcing and coastal response due to the 2015–2016 El Niño. Nature Communications, 8, 14365, doi: 10.1038/ncomms14365.
Barnhart, T.B. et al., 2016: Snowmelt rate dictates streamflow. Geophysical Research Letters, 43(15), 8006–8016, doi: 10.1002/2016gl069690.
Barraqué, B., 2017: The common property issue in flood control through land use in France. Journal of Flood Risk Management, 10(2), 182–194, doi: 10.1111/jfr3.12092.
Barriopedro, D., E.M. Fischer, J. Luterbacher, R.M. Trigo, and R. Garcia-Herrera, 2011: The Hot Summer of 2010: Redrawing the Temperature Record Map of Europe. Science, 332(6026), 220–224, doi: 10.1126/science.1201224.
Barros, V.R. et al., 2015: Climate change in Argentina: trends, projections, impacts and adaptation. WIREs Climate Change, 6(2), 151–169, doi: 10.1002/wcc.316.
Barry, A.A. et al., 2018: West Africa climate extremes and climate change indices. International Journal of Climatology, 38, e921–e938, doi: 10.1002/joc.5420.
Bartók, B. et al., 2017: Projected changes in surface solar radiation in CMIP5 global climate models and in EURO-CORDEX regional climate models for Europe. Climate Dynamics, 49(7–8), 2665–2683, doi: 10.1007/s00382-016-3471-2.
Basara, J.B. et al., 2019: The evolution, propagation, and spread of flash drought in the Central United States during 2012. Environmental Research Letters, 14(8), 084025, doi: 10.1088/1748-9326/ab2cc0.
Basconcillo, J. et al., 2016: Statistically Downscaled Projected Changes in Seasonal Mean Temperature and Rainfall in Cagayan Valley, Philippines. Journal of the Meteorological Society of Japan. Series II, 94, 151–164, doi: 10.2151/jmsj.2015-058.
Bathiany, S., V. Dakos, M. Scheffer, and T.M. Lenton, 2018: Climate models predict increasing temperature variability in poor countries. Science Advances, 4(5), eaar5809, doi: 10.1126/sciadv.aar5809.
Befort, D.J., S. Wild, T. Kruschke, U. Ulbrich, and G.C. Leckebusch, 2016: Different long-term trends of extra-tropical cyclones and windstorms in ERA-20C and NOAA-20CR reanalyses. Atmospheric Science Letters, 17(11), 586–595, doi: 10.1002/asl.694.
Beguería, S., S.M. Vicente-Serrano, F. Reig, and B. Latorre, 2014: Standardized precipitation evapotranspiration index (SPEI) revisited: Parameter fitting, evapotranspiration models, tools, datasets and drought monitoring. International Journal of Climatology, 34(10), 3001–3023, doi: 10.1002/joc.3887.
Bell, S.S. et al., 2019: Projections of southern hemisphere tropical cyclone track density using CMIP5 models. Climate Dynamics, 52(9–10), 6065–6079, doi: 10.1007/s00382-018-4497-4.
Bellprat, O. et al., 2015: Unusual past dry and wet rainy seasons over Southern Africa and South America from a climate perspective. Weather and Climate Extremes, 9, 36–46, doi: 10.1016/j.wace.2015.07.001.
Bellprat, O. et al., 2016: The Role of Arctic Sea Ice and Sea Surface Temperatures on the Cold 2015 February Over North America. Bulletin of the American Meteorological Society, 97(12), S36–S41, doi: 10.1175/bams-d-16-0159.1.
Belušić, D. et al., 2020: HCLIM38: a flexible regional climate model applicable for different climate zones from coarse to convection-permitting scales. Geoscientific Model Development, 13(3), 1311–1333, doi: 10.5194/gmd-13-1311-2020.
Benestad, R.E., K.M. Parding, H.B. Erlandsen, and A. Mezghani, 2019: A simple equation to study changes in rainfall statistics. Environmental Research Letters, 14(8), 84017, doi: 10.1088/1748-9326/ab2bb2.
Benestad, R.E. et al., 2018: Downscaling probability of long heatwaves based on seasonal mean daily maximum temperatures. Advances in Statistical Climatology, Meteorology and Oceanography, 4(1/2), 37–52, doi: 10.5194/ascmo-4-37-2018.
Benito, G., R. Brázdil, J. Herget, and M.J. Machado, 2015: Quantitative historical hydrology in Europe. Hydrology and Earth System Sciences, 19(8), 3517–3539, doi: 10.5194/hess-19-3517-2015.
Bennett, K.E. and J.E. Walsh, 2015: Spatial and temporal changes in indices of extreme precipitation and temperature for Alaska. International Journal of Climatology, 35(7), 1434–1452, doi: 10.1002/joc.4067.
Berg, A. and J. Sheffield, 2018: Climate Change and Drought: the Soil Moisture Perspective. Current Climate Change Reports, 4(2), 180–191, doi: 10.1007/s40641-018-0095-0.
Berg, A., J. Sheffield, and P.C.D. Milly, 2017a: Divergent surface and total soil moisture projections under global warming. Geophysical Research Letters, 44(1), 236–244, doi: 10.1002/2016gl071921.
Berg, A., B.R. Lintner, K. Findell, and A. Giannini, 2017b: Uncertain soil moisture feedbacks in model projections of Sahel precipitation. Geophysical Research Letters, 44(12), 6124–6133, doi: 10.1002/2017gl073851.
Berg, A. et al., 2015: Interannual Coupling between Summertime Surface Temperature and Precipitation over Land: Processes and Implications for Climate Change. Journal of Climate, 28(3), 1308–1328, doi: 10.1175/jcli-d-14-00324.1.
Berg, A. et al., 2016: Land–atmosphere feedbacks amplify aridity increase over land under global warming. Nature Climate Change, 6(9), 869–874, doi: 10.1038/nclimate3029.
Bergaoui, K. et al., 2015: The Contribution of Human-Induced Climate Change to the Drought of 2014 in the Southern Levant Region. Bulletin of the American Meteorological Society, 96(12), S66–S70, doi: 10.1175/bams-d-15-00129.1.
Berghuijs, W.R., R.A. Woods, C.J. Hutton, and M. Sivapalan, 2016: Dominant flood generating mechanisms across the United States. Geophysical Research Letters, 43(9), 4382–4390, doi: 10.1002/2016gl068070.
Berghuijs, W.R., E.E. Aalbers, J.R. Larsen, R. Trancoso, and R.A. Woods, 2017: Recent changes in extreme floods across multiple continents. Environmental Research Letters, 12(11), 114035, doi: 10.1088/1748-9326/aa8847.
Berthou, S. et al., 2019a: Larger Future Intensification of Rainfall in the West African Sahel in a Convection-Permitting Model. Geophysical Research Letters, 46(22), 13299–13307, doi: 10.1029/2019gl083544.
Berthou, S. et al., 2019b: Improved climatological precipitation characteristics over West Africa at convection-permitting scales. Climate Dynamics, 53(3), 1991–2011, doi: 10.1007/s00382-019-04759-4.
Bessho, K. et al., 2016: An Introduction to Himawari-8/9 – Japan’s New-Generation Geostationary Meteorological Satellites. Journal of the Meteorological Society of Japan. Series II, 94(2), 151–183, doi: 10.2151/jmsj.2016-009.
Betts, R.A. et al., 2018: Changes in climate extremes, fresh water availability and vulnerability to food insecurity projected at 1.5°C and 2°C global warming with a higher-resolution global climate model. Philosophical Transactions of the Royal Society A: Mathematical, Physical and Engineering Sciences, 376(2119), 20160452, doi: 10.1098/rsta.2016.0452.
Beusch, L., L. Gudmundsson, and S.I. Seneviratne, 2020: Emulating Earth system model temperatures with MESMER: From global mean temperature trajectories to grid-point-level realizations on land. Earth System Dynamics, 11(1), 139–159, doi: 10.5194/esd-11-139-2020.
Bevacqua, E., G. Zappa, and T.G. Shepherd, 2020a: Shorter cyclone clusters modulate changes in European wintertime precipitation extremes. Environmental Research Letters, 8(12), 808–812, doi: 10.1088/1748-9326/abbde7.
Bevacqua, E., M.I. Vousdoukas, T.G. Shepherd, and M. Vrac, 2020b: Brief communication: The role of using precipitation or river discharge data when assessing global coastal compound flooding. Natural Hazards and Earth System Sciences, 20(6), 1765–1782, doi: 10.5194/nhess-20-1765-2020.
Bevacqua, E. et al., 2019: Higher probability of compound flooding from precipitation and storm surge in Europe under anthropogenic climate change. Science Advances, 5(9), eaaw5531, doi: 10.1126/sciadv.aaw5531.
Bevacqua, E. et al., 2020c: More meteorological events that drive compound coastal flooding are projected under climate change. Communications Earth & Environment, 1(1), 47, doi: 10.1038/s43247-020-00044-z.
Bezerra, B.G., L.L. Silva, C.M. Santos e Silva, and G.G. de Carvalho, 2018: Changes of precipitation extremes indices in São Francisco River Basin, Brazil from 1947 to 2012. Theoretical and Applied Climatology, 135(1), 565–576, doi: 10.1007/s00704-018-2396-6.
Bhatia, K., G. Vecchi, H. Murakami, S. Underwood, and J. Kossin, 2018: Projected response of tropical cyclone intensity and intensification in a global climate model. Journal of Climate, 31(20), 8281–8303, doi: 10.1175/jcli-d-17-0898.1.
Bhatia, K.T. et al., 2019: Recent increases in tropical cyclone intensification rates. Nature Communications, 10(1), 1–9, doi: 10.1038/s41467-019-08471-z.
Bindoff, N.L. et al., 2013: Detection and Attribution of Climate Change: from Global to Regional. In: Climate Change 2013: The Physical Science Basis. Contribution of Working Group I to the Fifth Assessment Report of the Intergovernmental Panel on Climate Change[Stocker, T.F., D. Qin, G.-K. Plattner, M. Tignor, S.K. Allen, J. Boschung, A. Nauels, Y. Xia, V. Bex, and P.M. Midgley (eds.)]. Cambridge University Press, Cambridge, United Kingdom and New York, NY, USA, pp. 867–952, doi: 10.1017/cbo9781107415324.022.
Biscarini, C., S. Di Francesco, E. Ridolfi, and P. Manciola, 2016: On the Simulation of Floods in a Narrow Bending Valley: The Malpasset Dam Break Case Study. Water, 8(11), 545, doi: 10.3390/w8110545.
Bitencourt, D.P., M.V. Fuentes, P.A. Maia, and F.T. Amorim, 2016: Frequência, Duração, Abrangência Espacial e Intensidadedas Ondas de Calor no Brasil. Revista Brasileira de Meteorologia, 31(4), 506–517, doi: 10.1590/0102-778631231420150077.
Black, M.T. and D.J. Karoly, 2016: Southern Australia’s Warmest October on Record: The Role of ENSO and Climate Change. Bulletin of the American Meteorological Society, 97(12), S118–S121, doi: 10.1175/bams-d-16-0124.1.
Blamey, R.C., S.R. Kolusu, P. Mahlalela, M.C. Todd, and C.J.C. Reason, 2018: The role of regional circulation features in regulating El Niño climate impacts over southern Africa: A comparison of the 2015/2016 drought with previous events. International Journal of Climatology, 38(11), 4276–4295, doi: 10.1002/joc.5668.
Blanchet, J., G. Molinié, and J. Touati, 2018: Spatial analysis of trend in extreme daily rainfall in southern France. Climate Dynamics, 51(3), 799–812, doi: 10.1007/s00382-016-3122-7.
Bloomfield, J.P. and B.P. Marchant, 2013: Analysis of groundwater drought building on the standardised precipitation index approach. Hydrology and Earth System Sciences, 17(12), 4769–4787, doi: 10.5194/hess-17-4769-2013.
Bloomfield, J.P., B.P. Marchant, and A.A. McKenzie, 2019: Changes in groundwater drought associated with anthropogenic warming. Hydrology and Earth System Sciences, 23(3), 1393–1408, doi: 10.5194/hess-23-1393-2019.
Blöschl, G. et al., 2017: Changing climate shifts timing of European floods. Science, 357(6351), 588–590, doi: 10.1126/science.aan2506.
Blöschl, G. et al., 2019: Changing climate both increases and decreases European river floods. Nature, 573(7772), 108–111, doi: 10.1038/s41586-019-1495-6.
Blunden, J. and D.S. Arndt, 2016: State of the Climate in 2015. Bulletin of the American Meteorological Society, 97(8), Si–S275, doi: 10.1175/2016bamsstateoftheclimate.1.
Blunden, J. and D.S. Arndt, 2017: State of the Climate in 2016. Bulletin of the American Meteorological Society, 98(8), Si–S280, doi: 10.1175/2017bamsstateoftheclimate.1.
Boé, J., S. Somot, L. Corre, and P. Nabat, 2020: Large discrepancies in summer climate change over Europe as projected by global and regional climate models: causes and consequences. Climate Dynamics, 54(5–6), 2981–3002, doi: 10.1007/s00382-020-05153-1.
Boers, N. et al., 2019: Complex networks reveal global pattern of extreme-rainfall teleconnections. Nature, 566(7744), 373–377, doi: 10.1038/s41586-018-0872-x.
Boisier, J.P., R. Rondanelli, R.D. Garreaud, and F. Muñoz, 2016: Anthropogenic and natural contributions to the Southeast Pacific precipitation decline and recent megadrought in central Chile. Geophysical Research Letters, 43(1), 413–421, doi: 10.1002/2015gl067265.
Boisier, J.P. et al., 2018: Anthropogenic drying in central-southern Chile evidenced by long-term observations and climate model simulations. Elementa: Science of the Anthropocene, 6(1), 74, doi: 10.1525/elementa.328.
Bonan, G.B., M. Williams, R.A. Fisher, and K.W. Oleson, 2014: Modeling stomatal conductance in the earth system: linking leaf water-use efficiency and water transport along the soil–plant–atmosphere continuum. Geoscientific Model Development, 7(5), 2193–2222, doi: 10.5194/gmd-7-2193-2014.
Bonfils, C.J.W. et al., 2020: Human influence on joint changes in temperature, rainfall and continental aridity. Nature Climate Change, 10(8), 726–731, doi: 10.1038/s41558-020-0821-1.
Bonsal, B.R., R. Aider, P. Gachon, and S. Lapp, 2013: An assessment of Canadian prairie drought: Past, present, and future. Climate Dynamics, 41(2), 501–516, doi: 10.1007/s00382-012-1422-0.
Bonsal, B.R., D.L. Peters, F. Seglenieks, A. Rivera, and A. Berg, 2019: Changes in Freshwater Availability Across Canada. In: Canada’s Changing Climate Report[Bush, E. and D.S. Lemmen (eds.)]. Government of Canada, Ottawa, ON, Canada, pp. 261–342, doi: 10.4095/314614.
Booth, J.F., S. Wang, and L. Polvani, 2013: Midlatitude storms in a moister world: lessons from idealized baroclinic life cycle experiments. Climate Dynamics, 41(3), 787–802, doi: 10.1007/s00382-012-1472-3.
Borga, M., M. Stoffel, L. Marchi, F. Marra, and M. Jakob, 2014: Hydrogeomorphic response to extreme rainfall in headwater systems: Flash floods and debris flows. Journal of Hydrology, 518, 194–205, doi: 10.1016/j.jhydrol.2014.05.022.
Borodina, A., E.M. Fischer, and R. Knutti, 2017a: Models are likely to underestimate increase in heavy rainfall in the extratropical regions with high rainfall intensity. Geophysical Research Letters, 44(14), 7401–7409, doi: 10.1002/2017gl074530.
Borodina, A., E.M. Fischer, and R. Knutti, 2017b: Potential to Constrain Projections of Hot Temperature Extremes. Journal of Climate, 30(24), 9949–9964, doi: 10.1175/jcli-d-16-0848.1.
Bosshard, T. et al., 2013: Quantifying uncertainty sources in an ensemble of hydrological climate-impact projections. Water Resources Research, 49(3), 1523–1536, doi: 10.1029/2011wr011533.
Boyaj, A., K. Ashok, S. Ghosh, A. Devanand, and G. Dandu, 2018: The Chennai extreme rainfall event in 2015: The Bay of Bengal connection. Climate Dynamics, 50(7), 2867–2879, doi: 10.1007/s00382-017-3778-7.
Bozkurt, D., M. Rojas, J.P. Boisier, and J. Valdivieso, 2018: Projected hydroclimate changes over Andean basins in central Chile from downscaled CMIP5 models under the low and high emission scenarios. Climatic Change, 150(3–4), 131–147, doi: 10.1007/s10584-018-2246-7.
Bozkurt, D. et al., 2019: Dynamical downscaling over the complex terrain of southwest South America: present climate conditions and added value analysis. Climate Dynamics, 53(11), 6745–6767, doi: 10.1007/s00382-019-04959-y.
Brando, P.M. et al., 2019: Droughts, Wildfires, and Forest Carbon Cycling: A Pantropical Synthesis. Annual Review of Earth and Planetary Sciences, 47, 555–581, doi: 10.1146/annurev-earth-082517-010235.
Brandon, C.M., J.D. Woodruff, D.P. Lane, and J.P. Donnelly, 2013: Tropical cyclone wind speed constraints from resultant storm surge deposition: A 2500 year reconstruction of hurricane activity from St. Marks, FL. Geochemistry, Geophysics, Geosystems, 14(8), 2993–3008, doi: 10.1002/ggge.20217.
Bregy, J.C., D.J. Wallace, R.T. Minzoni, and V.J. Cruz, 2018: 2500-year paleotempestological record of intense storms for the northern Gulf of Mexico, United States. Marine Geology, 396, 26–42, doi: 10.1016/j.margeo.2017.09.009.
Breña-Naranjo, J.A., M. Laverde-Barajas, and A. Pedrozo-Acuña, 2017: Changes in pan evaporation in Mexico from 1961 to 2010. International Journal of Climatology, 37(1), 204–213, doi: 10.1002/joc.4698.
Breshears, D.D. et al., 2013: The critical amplifying role of increasing atmospheric moisture demand on tree mortality and associated regional die-off. Frontiers in Plant Science, 4, 266, doi: 10.3389/f pls.2013.00266.
Bright, R.M. et al., 2017: Local temperature response to land cover and management change driven by non-radiative processes. Nature Climate Change, 7(4), 296–302, doi: 10.1038/nclimate3250.
Brito, S.S.B. et al., 2018: Frequency, duration and severity of drought in the Semiarid Northeast Brazil region. International Journal of Climatology, 38(2), 517–529, doi: 10.1002/joc.5225.
Brocca, L. et al., 2011: Soil moisture estimation through ASCAT and AMSR-E sensors: An intercomparison and validation study across Europe. Remote Sensing of Environment, 115(12), 3390–3408, doi: 10.1016/j.rse.2011.08.003.
Brodribb, T.J., J. Powers, H. Cochard, and B. Choat, 2020: Hanging by a thread? Forests and drought. Science, 368(6488), 261–266, doi: 10.1126/science.aat7631.
Brooks, H.E., 2013: Severe thunderstorms and climate change. Atmospheric Research, 123, 129–138, doi: 10.1016/j.atmosres.2012.04.002.
Brooks, H.E., G.W. Carbin, and P.T. Marsh, 2014: Increased variability of tornado occurrence in the United States. Science, 346(6207), 349–352, doi: 10.1126/science.1257460.
Brown, S.J., 2020: Future changes in heatwave severity, duration and frequency due to climate change for the most populous cities. Weather and Climate Extremes, 30, 100278, doi: 10.1016/j.wace.2020.100278.
Brunner, L., G.C. Hegerl, and A.K. Steiner, 2017: Connecting atmospheric blocking to European temperature extremes in spring. Journal of Climate, 30(2), 585–594, doi: 10.1175/jcli-d-16-0518.1.
Brunner, L., N. Schaller, J. Anstey, J. Sillmann, and A.K. Steiner, 2018: Dependence of Present and Future European Temperature Extremes on the Location of Atmospheric Blocking. Geophysical Research Letters, 45(12), 6311–6320, doi: 10.1029/2018gl077837.
Brunner, M.I. and L.M. Tallaksen, 2019: Proneness of European Catchments to Multiyear Streamflow Droughts. Water Resources Research, 55(11), 8881–8894, doi: 10.1029/2019wr025903.
Bucchignani, E., A.L. Zollo, L. Cattaneo, M. Montesarchio, and P. Mercogliano, 2017: Extreme weather events over China: assessment of COSMO-CLM simulations and future scenarios. International Journal of Climatology, 37(3), 1578–1594, doi: 10.1002/joc.4798.
Büntgen, U. et al., 2015: Commentary to Wetter et al. (2014): Limited tree-ring evidence for a 1540 European ‘Megadrought’. Climatic Change, 131(2), 183–190, doi: 10.1007/s10584-015-1423-1.
Burdanowitz, J., S.A. Buehler, S. Bakan, and C. Klepp, 2019: The sensitivity of oceanic precipitation to sea surface temperature. Atmospheric Chemistry and Physics, 19(14), 9241–9252, doi: 10.5194/acp-19-9241-2019.
Burgman, R.J. and Y. Jang, 2015: Simulated U.S. drought response to interannual and decadal pacific SST variability. Journal of Climate, 28(12), 4688–4705, doi: 10.1175/jcli-d-14-00247.1.
Burke, C., P. Stott, A. Ciavarella, and Y. Sun, 2016: Attribution of Extreme Rainfall in Southeast China During May 2015. Bulletin of the American Meteorological Society, 97(12), S92–S96, doi: 10.1175/bams-d-16-0144.1.
Burn, D.H. and P.H. Whitfield, 2016: Changes in floods and flood regimes in Canada. Canadian Water Resources Journal, 41(1–2), 139–150, doi: 10.1080/07011784.2015.1026844.
Buttle, J.M. et al., 2016: Flood processes in Canada: Regional and special aspects. Canadian Water Resources Journal, 41(1–2), 7–30, doi: 10.1080/07011784.2015.1131629.
Byrne, M.P. and P.A. O’Gorman, 2015: The Response of Precipitation Minus Evapotranspiration to Climate Warming: Why the “Wet-Get-Wetter, Dry-Get-Drier” Scaling Does Not Hold over Land. Journal of Climate, 28(20), 8078–8092, doi: 10.1175/jcli-d-15-0369.1.
Byrne, M.P. and P.A. O’Gorman, 2018: Trends in continental temperature and humidity directly linked to ocean warming. Proceedings of the National Academy of Sciences, 115(19), 4863–4868, doi: 10.1073/pnas.1722312115.
Cabré, M.F., S. Solman, and M. Núñez, 2016: Regional climate change scenarios over southern South America for future climate (2080–2099) using the MM5 Model. Mean, interannual variability and uncertainties. Atmósfera, 29(1), 35–60, doi: 10.20937/atm.2016.29.01.04.
Cai, W. and T. Cowan, 2008: Evidence of impacts from rising temperature on inflows to the Murray-Darling Basin. Geophysical Research Letters, 35(7), 2–6, doi: 10.1029/2008gl033390.
Cai, W., A. Purich, T. Cowan, P. Van Rensch, and E. Weller, 2014a: Did Climate Change–Induced Rainfall Trends Contribute to the Australian Millennium Drought?Journal of Climate, 27(9), 3145–3168, doi: 10.1175/jcli-d-13-00322.1.
Cai, W. et al., 2014b: Increasing frequency of extreme El Niño events due to greenhouse warming. Nature Climate Change, 4(2), 111–116, doi: 10.1038/nclimate2100.
Cai, W. et al., 2015: ENSO and greenhouse warming. Nature Climate Change, 5(9), 849–859, doi: 10.1038/nclimate2743.
Cai, W. et al., 2018: Stabilised frequency of extreme positive Indian Ocean Dipole under 1.5°C warming. Nature Communications, 9(1), 4–11, doi: 10.1038/s41467-018-03789-6.
Caillouet, L., J.-P. Vidal, E. Sauquet, A. Devers, and B. Graff, 2017: Ensemble reconstruction of spatio-temporal extreme low-flow events in France since 1871. Hydrology and Earth System Sciences, 21(6), 2923–2951, doi: 10.5194/hess-21-2923-2017.
Callaghan, J. and S.B. Power, 2011: Variability and decline in the number of severe tropical cyclones making land-fall over eastern Australia since the late nineteenth century. Climate Dynamics, 37(3–4), 647–662, doi: 10.1007/s00382-010-0883-2.
Caloiero, T., 2015: Analysis of rainfall trend in New Zealand. Environmental Earth Sciences, 73(10), 6297–6310, doi: 10.1007/s12665-014-3852-y.
Caloiero, T., 2017: Trend of monthly temperature and daily extreme temperature during 1951–2012 in New Zealand. Theoretical and Applied Climatology, 129(1–2), 111–127, doi: 10.1007/s00704-016-1764-3.
Caloiero, T., S. Veltri, P. Caloiero, and F. Frustaci, 2018: Drought Analysis in Europe and in the Mediterranean Basin Using the Standardized Precipitation Index. Water, 10(8), 1043, doi: 10. 3390/w10081043.
Camargo, S.J., 2013: Global and regional aspects of tropical cyclone activity in the CMIP5 models. Journal of Climate, 26(24), 9880–9902, doi: 10.1175/jcli-d-12-00549.1.
Camargo, S.J. and A.A. Wing, 2016: Tropical cyclones in climate models. WIREs Climate Change, 7(2), 211–237, doi: 10.1002/wcc.373.
Camargo, S.J., K.A. Emanuel, and A.H. Sobel, 2007: Use of a Genesis Potential Index to Diagnose ENSO Effects on Tropical Cyclone Genesis. Journal of Climate, 20(19), 4819–4834, doi: 10.1175/jcli4282.1.
Camargo, S.J., M.C. Wheeler, and A.H. Sobel, 2009: Diagnosis of the MJO modulation of tropical cyclogenesis using an empirical index. Journal of the Atmospheric Sciences, 66(10), 3061–3074, doi: 10.1175/2009jas3101.1.
Camargo, S.J., M.K. Tippett, A.H. Sobel, G.A. Vecchi, and M. Zhao, 2014: Testing the performance of tropical cyclone genesis indices in future climates using the HiRAM model. Journal of Climate, 27(24), 9171–9196, doi: 10.1175/jcli-d-13-00505.1.
Camargo, S.J. et al., 2020: Characteristics of Model Tropical Cyclone Climatology and the Large-Scale Environment. Journal of Climate, 33(11), 4463–4487, doi: 10.1175/jcli-d-19-0500.1.
Camuffo, D. et al., 2013: Western Mediterranean precipitation over the last 300 years from instrumental observations. Climatic Change, 117(1–2), 85–101, doi: 10.1007/s10584-012-0539-9.
Cannon, A.J. and S. Innocenti, 2019: Projected intensification of sub-daily and daily rainfall extremes in convection-permitting climate model simulations over North America: implications for future intensity–duration–frequency curves. Natural Hazards and Earth System Sciences, 19(2), 421–440, doi: 10.5194/nhess-19-421-2019.
Cardell, M.F., A. Amengual, R. Romero, and C. Ramis, 2020: Future extremes of temperature and precipitation in Europe derived from a combination of dynamical and statistical approaches. International Journal of Climatology, 40(11), 4800–4827, doi: 10.1002/joc.6490.
Cardoso, R.M., P.M.M. Soares, D.C.A. Lima, and P.M.A. Miranda, 2019: Mean and extreme temperatures in a warming climate: EURO CORDEX and WRF regional climate high-resolution projections for Portugal. Climate Dynamics, 52(1–2), 129–157, doi: 10.1007/s00382-018-4124-4.
Carril, A.F. et al., 2016: Extreme events in the La Plata basin: a retrospective analysis of what we have learned during CLARIS-LPB project. Climate Research, 68(2–3), 95–116, doi: 10.3354/cr01374.
Casanueva, A., C. Rodríguez-Puebla, M.D. Frías, and N. González-Reviriego, 2014: Variability of extreme precipitation over Europe and its relationships with teleconnection patterns. Hydrology and Earth System Sciences, 18(2), 709–725, doi: 10.5194/hess-18-709-2014.
Cattiaux, J. and A. Ribes, 2018: Defining Single Extreme Weather Events in a Climate Perspective. Bulletin of the American Meteorological Society, 99(8), 1557–1568, doi: 10.1175/bams-d-17-0281.1.
Catto, J.L. and S. Pfahl, 2013: The importance of fronts for extreme precipitation. Journal of Geophysical Research: Atmospheres, 118(19), 10791–10801, doi: 10.1002/jgrd.50852.
Catto, J.L., C. Jakob, and N. Nicholls, 2015: Can the CMIP5 models represent winter frontal precipitation?Geophysical Research Letters, 42(20), 8596–8604, doi: 10.1002/2015gl066015.
Cavalcanti, I.F.A. et al., 2015: Precipitation extremes over La Plata Basin – Review and new results from observations and climate simulations. Journal of Hydrology, 523, 211–230, doi: 10.1016/j.jhydrol.2015.01.028.
Cavanaugh, N.R. and S.S.P. Shen, 2015: The Effects of Gridding Algorithms on the Statistical Moments and Their Trends of Daily Surface Air Temperature. Journal of Climate, 28(23), 9188–9205, doi: 10.1175/jcli-d-14-00668.1.
Cavicchia, L., H. von Storch, and S. Gualdi, 2014: Mediterranean Tropical-Like Cyclones in Present and Future Climate. Journal of Climate, 27(19), 7493–7501, doi: 10.1175/jcli-d-14-00339.1.
Ceccherini, G., S. Russo, I. Ameztoy, C.P. Romero, and C. Carmona-Moreno, 2016: Magnitude and frequency of heat and cold waves in recent decades: the case of South America. Natural Hazards and Earth System Sciences, 16(3), 821–831, doi: 10.5194/nhess-16-821-2016.
Ceccherini, G., S. Russo, I. Ameztoy, A.F. Marchese, and C. Carmona-Moreno, 2017: Heat waves in Africa 1981–2015, observations and reanalysis. Natural Hazards and Earth System Sciences, 17(1), 115–125, doi: 10.5194/nhess-17-115-2017.
Cha, E.J., T.R. Knutson, T.-C. Lee, M. Ying, and T. Nakaegawa, 2020: Third assessment on impacts of climate change on tropical cyclones in the Typhoon Committee Region – Part II: Future projections. Tropical Cyclone Research and Review, 9(2), 75–86, doi: 10.1016/j.tcrr.2020.04.005.
Chai, R., S. Sun, H. Chen, and S. Zhou, 2018: Changes in reference evapotranspiration over China during 1960–2012: Attributions and relationships with atmospheric circulation. Hydrological Processes, 32(19), 3032–3048, doi: 10. 1002/hyp.13252.
Chakraborty, D. et al., 2018: Changes in daily maximum temperature extremes across India over 1951–2014 and their relation with cereal crop productivity. Stochastic Environmental Research and Risk Assessment, 32(11), 3067–3081, doi: 10.1007/s00477-018-1604-3.
Chan, K.T.F. and J.C.L. Chan, 2015: Global climatology of tropical cyclone size as inferred from QuikSCAT data. International Journal of Climatology, 35(15), 4843–4848, doi: 10.1002/joc.4307.
Chan, K.T.F. and J.C.L. Chan, 2018: The Outer-Core Wind Structure of Tropical Cyclones. Journal of the Meteorological Society of Japan. Series II, 96(4), 297–315, doi: 10.2151/jmsj.2018-042.
Chan, S.C. et al., 2020: Europe-wide precipitation projections at convection permitting scale with the Unified Model. Climate Dynamics, 55(3), 409–428, doi: 10.1007/s00382-020-05192-8.
Chand, S.S. et al., 2019: Review of tropical cyclones in the Australian region: Climatology, variability, predictability, and trends. WIREs Climate Change, 10(5), e602, doi: 10.1002/wcc.602.
Chaney, N.W., J. Sheffield, G. Villarini, and E.F. Wood, 2014: Development of a High-Resolution Gridded Daily Meteorological Dataset over Sub-Saharan Africa: Spatial Analysis of Trends in Climate Extremes. Journal of Climate, 27(15), 5815–5835, doi: 10.1175/jcli-d-13-00423.1.
Chang, E.K.M., 2014: Impacts of background field removal on CMIP5 projected changes in Pacific winter cyclone activity. Journal of Geophysical Research: Atmospheres, 119(8), 4626–4639, doi: 10.1002/2013jd020746.
Chang, E.K.M., 2017: Projected Significant Increase in the Number of Extreme Extratropical Cyclones in the Southern Hemisphere. Journal of Climate, 30(13), 4915–4935, doi: 10.1175/jcli-d-16-0553.1.
Chang, E.K.M. and A.M.W. Yau, 2016: Northern Hemisphere winter storm track trends since 1959 derived from multiple reanalysis datasets. Climate Dynamics, 47(5–6), 1435–1454, doi: 10.1007/s00382-015-2911-8.
Chang, E.K.M., C.-G. Ma, C. Zheng, and A.M.W. Yau, 2016: Observed and projected decrease in Northern Hemisphere extratropical cyclone activity in summer and its impacts on maximum temperature. Geophysical Research Letters, 43(5), 2200–2208, doi: 10.1002/2016gl068172.
Chapman, S., J.E.M. Watson, A. Salazar, M. Thatcher, and C.A. McAlpine, 2017: The impact of urbanization and climate change on urban temperatures: a systematic review. Landscape Ecology, 32(10), 1921–1935, doi: 10.1007/s10980-017-0561-4.
Chavas, D.R. and K. Emanuel, 2014: Equilibrium tropical cyclone size in an idealized state of axisymmetric radiative–convective equilibrium. Journal of the Atmospheric Sciences, 71(5), 1663–1680, doi: 10.1175/jas-d-13-0155.1.
Chen, C.-T. and T. Knutson, 2008: On the Verification and Comparison of Extreme Rainfall Indices from Climate Models. Journal of Climate, 21(7), 1605–1621, doi: 10.1175/2007jcli1494.1.
Chen, D. et al., 2019: Mesoscale Convective Systems in the Asian Monsoon Region From Advanced Himawari Imager: Algorithms and Preliminary Results. Journal of Geophysical Research: Atmospheres, 124(4), 2210–2234, doi: 10.1029/2018jd029707.
Chen, G.-S., M. Notaro, Z. Liu, and Y. Liu, 2012: Simulated Local and Remote Biophysical Effects of Afforestation over the Southeast United States in Boreal Summer. Journal of Climate, 25(13), 4511–4522, doi: 10.1175/jcli-d-11-00317.1.
Chen, H. and J. Sun, 2015a: Assessing model performance of climate extremes in China: an intercomparison between CMIP5 and CMIP3. Climatic Change, 129(1), 197–211, doi: 10.1007/s10584-014-1319-5.
Chen, H. and J. Sun, 2015b: Changes in Drought Characteristics over China Using the Standardized Precipitation Evapotranspiration Index. Journal of Climate, 28(13), 5430–5447, doi: 10.1175/jcli-d-14-00707.1.
Chen, H. and J. Sun, 2017a: Anthropogenic warming has caused hot droughts more frequently in China. Journal of Hydrology, 544, 306–318, doi: 10.1016/j.jhydrol.2016.11.044.
Chen, H. and J. Sun, 2017b: Characterizing present and future drought changes over eastern China. International Journal of Climatology, 37, 138–156, doi: 10.1002/joc.4987.
Chen, H. and J. Sun, 2017c: Contribution of human influence to increased daily precipitation extremes over China. Geophysical Research Letters, 44(5), 2436–2444, doi: 10.1002/2016gl072439.
Chen, H., J. Sun, W. Lin, and H. Xu, 2020: Comparison of CMIP6 and CMIP5 models in simulating climate extremes. Science Bulletin, 65(17), 1415–1418, doi: 10.1016/j.scib.2020.05.015.
Chen, J., A. Dai, Y. Zhang, and K.L. Rasmussen, 2020a: Changes in Convective Available Potential Energy and Convective Inhibition under Global Warming. Journal of Climate, 33(6), 2025–2050, doi: 10.1175/jcli-d-19-0461.1.
Chen, J. et al., 2020b: Impacts of climate change on tropical cyclones and induced storm surges in the Pearl River Delta region using pseudo–global-warming method. Scientific Reports, 10(1), 1965, doi: 10.1038/s41598-020-58824-8.
Chen, L. and P.A. Dirmeyer, 2019: Global observed and modelled impacts of irrigation on surface temperature. International Journal of Climatology, 39(5), 2587–2600, doi: 10.1002/joc.5973.
Chen, L., D. Li, and S.C. Pryor, 2013: Wind speed trends over China: Quantifying the magnitude and assessing causality. International Journal of Climatology, 33(11), 2579–2590, doi: 10.1002/joc.3613.
Chen, R., Z. Wen, and R. Lu, 2016: Evolution of the circulation anomalies and the quasi-biweekly oscillations associated with extreme heat events in Southern China. Journal of Climate, 29(19), 6909–6921, doi: 10.1175/jcli-d-16-0160.1.
Chen, S., Y. Li, J. Kim, and S.W. Kim, 2017: Bayesian change point analysis for extreme daily precipitation. International Journal of Climatology, 37(7), 3123–3137, doi: 10.1002/joc.4904.
Chen, X. et al., 2020: Whole-plant water hydraulic integrity to predict drought-induced Eucalyptus urophylla mortality under drought stress. Forest Ecology and Management, 468, 118179, doi: 10.1016/j.foreco.2020.118179.
Chen, Y. and P. Zhai, 2017: Revisiting summertime hot extremes in China during 1961-2015: Overlooked compound extremes and significant changes. Geophysical Research Letters, 44(10), 5096–5103, doi: 10.1002/2016gl072281.
Chen, Y., W. Li, X. Jiang, P. Zhai, and Y. Luo, 2021: Detectable Intensification of Hourly and Daily Scale Precipitation Extremes across Eastern China. Journal of Climate, 34(3), 1185–1201, doi: 10.1175/jcli-d-20-0462.1.
Cheng, L., M. Hoerling, L. Smith, and J. Eischeid, 2018: Diagnosing Human-Induced Dynamic and Thermodynamic Drivers of Extreme Rainfall. Journal of Climate, 31(3), 1029–1051, doi: 10.1175/jcli-d-16-0919.1.
Cheng, S., X. Guan, J. Huang, F. Ji, and R. Guo, 2015: Long-term trend and variability of soil moisture over East Asia. Journal of Geophysical Research: Atmospheres, 120(17), 8658–8670, doi: 10.1002/2015jd023206.
Cheong, W.K. et al., 2018: Observed and modelled temperature and precipitation extremes over Southeast Asia from 1972 to 2010. International Journal of Climatology, 38, 3013–3027, doi: 10.1002/joc.5479.
Chevuturi, A., N.P. Klingaman, A.G. Turner, and S. Hannah, 2018: Projected Changes in the Asian-Australian Monsoon Region in 1.5°C and 2.0°C Global-Warming Scenarios. Earth’s Future, 6(3), 339–358, doi: 10.1002/2017ef000734.
Cho, C., R. Li, S.-Y. Wang, J.-H. Yoon, and R.R. Gillies, 2016: Anthropogenic footprint of climate change in the June 2013 northern India flood. Climate Dynamics, 46(3–4), 797–805, doi: 10.1007/s00382-015-2613-2.
Chou, S.C. et al., 2014a: Assessment of Climate Change over South America under RCP 4.5 and 8.5 Downscaling Scenarios. American Journal of Climate Change, 3(5), 512–527, doi: 10.4236/ajcc.2014.35043.
Chou, S.C. et al., 2014b: Evaluation of the Eta Simulations Nested in Three Global Climate Models. American Journal of Climate Change, 3(5), 438–454, doi: 10.4236/ajcc.2014.35039.
Choy, C.-W., S.-N. Chong, D. Kong, and E.O. Cayanan, 2015: A Discussion of the Most Intense Tropical Cyclones in the Western North Pacific From 1978 to 2013. Tropical Cyclone Research and Review, 4(1), 1–11, doi: 10.6057/2015tcrr01.01.
Christensen, J.H. et al., 2013: Climate Phenomena and their Relevance for Future Regional Climate Change. In: Climate Change 2013: The Physical Science Basis. Contribution of Working Group I to the Fifth Assessment Report of the Intergovernmental Panel on Climate Change[Stocker, T.F., D. Qin, G.-K. Plattner, M. Tignor, S.K. Allen, J. Boschung, A. Nauels, Y. Xia, V. Bex, and P.M. Midgley (eds.)]. Cambridge University Press, Cambridge, United Kingdom and New York, NY, USA, pp. 1217–1308, doi: 10.1017/cbo9781107415324.028.
Christensen, O.B. et al., 2015: Scalability of regional climate change in Europe for high-end scenarios. Climate Research, 64(1), 25–38, doi: 10.3354/cr01286.
Christiansen, B. et al., 2018: Was the Cold European Winter of 2009/10 Modified by Anthropogenic Climate Change? An Attribution Study. Journal of Climate, 31(9), 3387–3410, doi: 10.1175/jcli-d-17-0589.1.
Christidis, N. and P.A. Stott, 2014: Change in the Odds of Warm Years and Seasons Due to Anthropogenic Influence on the Climate. Journal of Climate, 27(7), 2607–2621, doi: 10.1175/jcli-d-13-00563.1.
Christidis, N. and P.A. Stott, 2016: Attribution analyses of temperature extremes using a set of 16 indices. Weather and Climate Extremes, 14, 24–35, doi: 10.1016/j.wace.2016.10.003.
Christidis, N., P.A. Stott, and A. Ciavarella, 2014: The effect of anthropogenic climate change on the cold spring of 2013 in the United Kingdom. Bulletin of the American Meteorological Society, 95(9), S15–S18, doi: 10.1175/1520-0477-95.9.s1.1.
Christidis, N., G.S. Jones, and P.A. Stott, 2015: Dramatically increasing chance of extremely hot summers since the 2003 European heatwave. Nature Climate Change, 5(1), 46–50, doi: 10.1038/nclimate2468.
Christidis, N., A. Ciavarella, and P.A. Stott, 2018: Different Ways of Framing Event Attribution Questions: The Example of Warm and Wet Winters in the United Kingdom Similar to 2015/16. Journal of Climate, 31(12), 4827–4845, doi: 10.1175/jcli-d-17-0464.1.
Christidis, N., P.A. Stott, D.J. Karoly, and A. Ciavarella, 2013a: An Attribution Study of the Heavy Rainfall Over Eastern Australia in March 2012 [in “Explaining Extreme Events of 2012 from a Climate Perspective”]. Bulletin of the American Meteorological Society, 94(9), S58–S61, doi: 10.1175/bams-d-13-00085.1.
Christidis, N. et al., 2013b: A New HadGEM3-A-Based System for Attribution of Weather- and Climate-Related Extreme Events. Journal of Climate, 26(9), 2756–2783, doi: 10.1175/jcli-d-12-00169.1.
Cioffi, F., U. Lall, E. Rus, and C.K.B. Krishnamurthy, 2015: Space-time structure of extreme precipitation in Europe over the last century. International Journal of Climatology, 35(8), 1749–1760, doi: 10.1002/joc.4116.
Clark, R.T. and S.J. Brown, 2013: Influences of Circulation and Climate Change on European Summer Heat Extremes. Journal of Climate, 26(23), 9621–9632, doi: 10.1175/jcli-d-12-00740.1.
Clark, R.T., S.J. Brown, and J.M. Murphy, 2006: Modeling Northern Hemisphere Summer Heat Extreme Changes and Their Uncertainties Using a Physics Ensemble of Climate Sensitivity Experiments. Journal of Climate, 19(17), 4418–4435, doi: 10.1175/jcli3877.1.
Clarke, H. and J.P. Evans, 2019: Exploring the future change space for fire weather in southeast Australia. Theoretical and Applied Climatology, 136(1–2), 513–527, doi: 10.1007/s00704-018-2507-4.
Colle, B.A. et al., 2013: Historical Evaluation and Future Prediction of Eastern North American and Western Atlantic Extratropical Cyclones in the CMIP5 Models during the Cool Season. Journal of Climate, 26(18), 6882–6903, doi: 10.1175/jcli-d-12-00498.1.
Collins, J.M. et al., 2016: The record-breaking 2015 hurricane season in the eastern North Pacific: An analysis of environmental conditions. Geophysical Research Letters, 43(17), 9217–9224, doi: 10.1002/2016gl070597.
Collins, M. et al., 2013: Long-term Climate Change: Projections, Commitments and Irreversibility. In: Climate Change 2013: The Physical Science Basis. Contribution of Working Group I to the Fifth Assessment Report of the Intergovernmental Panel on Climate Change[Stocker, T.F., D. Qin, G.-K. Plattner, M. Tignor, S.K. Allen, J. Boschung, A. Nauels, Y. Xia, V. Bex, and P.M. Midgley (eds.)]. Cambridge University Press, Cambridge, United Kingdom and New York, NY, USA, pp. 1029–1136, doi: 10.1017/cbo9781107415324.024.
Collins, M. et al., 2019: Extremes, Abrupt Changes and Managing Risks. In: IPCC Special Report on the Ocean and Cryosphere in a Changing Climate[Pörtner, H.-O., D.C. Roberts, V. Masson-Delmotte, P. Zhai, M. Tignor, E. Poloczanska, K. Mintenbeck, A. Alegría, M. Nicolai, A. Okem, J. Petzold, B. Rama, and N.M. Weyer (eds.)]. In Press, pp. 589–656, www.ipcc.ch/srocc/chapter/chapter-6.
Condon, L.E., A.L. Atchley, and R.M. Maxwell, 2020: Evapotranspiration depletes groundwater under warming over the contiguous United States. Nature Communications, 11(1), 873, doi: 10.1038/s41467-020-14688-0.
Contractor, S., M.G. Donat, and L. Alexander, 2020a: Changes in Observed Daily Precipitation Over Global Land Areas Since 1950. Journal of Climate, 34(1), 3–19, doi: 10.1175/jcli-d-19-0965.1.
Contractor, S. et al., 2020b: Rainfall Estimates on a Gridded Network (REGEN) – a global land-based gridded dataset of daily precipitation from 1950 to 2016. Hydrology and Earth System Sciences, 24(2), 919–943, doi: 10.5194/hess-24-919-2020.
Cook, B.I., T.R. Ault, and J.E. Smerdon, 2015: Unprecedented 21st century drought risk in the American Southwest and Central Plains. Science Advances, 1(1), e1400082, doi: 10.1126/sciadv.1400082.
Cook, B.I., J.S. Mankin, and K.J. Anchukaitis, 2018: Climate Change and Drought: From Past to Future. Current Climate Change Reports, 4(2), 164–179, doi: 10.1007/s40641-018-0093-2.
Cook, B.I., J.E. Smerdon, R. Seager, and S. Coats, 2014a: Global warming and 21st century drying. Climate Dynamics, 43(9–10), 2607–2627, doi: 10.1007/s00382-014-2075-y.
Cook, B.I., J.E. Smerdon, R. Seager, and E.R. Cook, 2014b: Pan-Continental Droughts in North America over the Last Millennium. Journal of Climate, 27(1), 383–397, doi: 10.1175/jcli-d-13-00100.1.
Cook, B.I., K.J. Anchukaitis, R. Touchan, D.M. Meko, and E.R. Cook, 2016a: Spatiotemporal drought variability in the Mediterranean over the last 900 years. Journal of Geophysical Research: Atmospheres, 121(5), 2060–2074, doi: 10.1002/2015jd023929.
Cook, B.I. et al., 2016b: North American megadroughts in the Common Era: Reconstructions and simulations. WIREs Climate Change, 7(3), 411–432, doi: 10.1002/wcc.394.
Cook, B.I. et al., 2016c: The paleoclimate context and future trajectory of extreme summer hydroclimate in eastern Australia. Journal of Geophysical Research: Atmospheres, 121(21), 12820–12838, doi: 10.1002/2016jd024892.
Cook, B.I. et al., 2019: Climate Change Amplification of Natural Drought Variability: The Historic Mid-Twentieth-Century North American Drought in a Warmer World. Journal of Climate, 32(17), 5417–5436, doi: 10.1175/jcli-d-18-0832.1.
Cook, B.I. et al., 2020: Twenty-First Century Drought Projections in the CMIP6 Forcing Scenarios. Earth’s Future, 8(6), e2019EF001461, doi: 10.1029/2019ef001461.
Cook, E.R., C.A. Woodhouse, C. Mark Eakin, D.M. Meko, and D.W. Stahle, 2004: Long-Term Aridity Changes in the Western United States. Science, 306(5698), 1015–1018, doi: 10.1126/science.1102586.
Coppola, E. et al., 2021a: Assessment of the European Climate Projections as Simulated by the Large EURO-CORDEX Regional and Global Climate Model Ensemble. Journal of Geophysical Research: Atmospheres, 126(4), e2019JD032356, doi: 10.1029/2019jd032356.
Coppola, E. et al., 2021b: Climate hazard indices projections based on CORDEX-CORE, CMIP5 and CMIP6 ensemble. Climate Dynamics, 57(5–6), 1293–1383, doi: 10.1007/s00382-021-05640-z.
Corbella, S. and D.D. Stretch, 2012: Multivariate return periods of sea storms for coastal erosion risk assessment. Natural Hazards and Earth System Sciences, 12(8), 2699–2708, doi: 10.5194/nhess-12-2699-2012.
Corrales-Suastegui, A., R. Fuentes-Franco, and E.G. Pavia, 2020: The mid-summer drought over Mexico and Central America in the 21st century. International Journal of Climatology, 40(3), 1703–1715, doi: 10.1002/joc.6296.
Couasnon, A. et al., 2020: Measuring compound flood potential from river discharge and storm surge extremes at the global scale. Natural Hazards and Earth System Sciences, 20(2), 489–504, doi: 10.5194/nhess-20-489-2020.
Coumou, D., J. Lehmann, and J. Beckmann, 2015: The weakening summer circulation in the Northern Hemisphere mid-latitudes. Science, 348(6232), 324–327, doi: 10.1126/science.1261768.
Coumou, D., G. Di Capua, S. Vavrus, L. Wang, and S. Wang, 2018: The influence of Arctic amplification on mid-latitude summer circulation. Nature Communications, 9(1), 2959, doi: 10.1038/s41467-018-05256-8.
Cowan, T., S. Undorf, G.C. Hegerl, L.J. Harrington, and F.E.L. Otto, 2020: Present-day greenhouse gases could cause more frequent and longer Dust Bowl heatwaves. Nature Climate Change, 10(6), 505–510, doi: 10.1038/s41558-020-0771-7.
Cowan, T. et al., 2014: More frequent, longer, and hotter heat waves for Australia in the Twenty-First Century. Journal of Climate, 27(15), 5851–5871, doi: 10.1175/jcli-d-14-00092.1.
Cowan, T. et al., 2016: Factors Contributing to Record-Breaking Heat Waves over the Great Plains during the 1930s Dust Bowl. Journal of Climate, 30(7), 2437–2461, doi: 10.1175/jcli-d-16-0436.1.
Crimp, S.J. et al., 2016: Recent changes in southern Australian frost occurrence: Implications for wheat production risk. Crop and Pasture Science, 67(8), 801–811, doi: 10.1071/cp16056.
Croitoru, A.-E. and A. Piticar, 2013: Changes in daily extreme temperatures in the extra-Carpathians regions of Romania. International Journal of Climatology, 33(8), 1987–2001, doi: 10.1002/joc.3567.
Croitoru, A.-E., A. Piticar, and D.C. Burada, 2016: Changes in precipitation extremes in Romania. Quaternary International, 415, 325–335, doi: 10.1016/j.quaint.2015.07.028.
Croitoru, A.-E., B.-C. Chiotoroiu, V. Ivanova Todorova, and V. Torică, 2013: Changes in precipitation extremes on the Black Sea Western Coast. Global and Planetary Change, 102, 10–19, doi: 10.1016/j.gloplacha.2013.01.004.
Crook, J. et al., 2019: Assessment of the Representation of West African Storm Lifecycles in Convection-Permitting Simulations. Earth and Space Science, 6(5), 818–835, doi: 10.1029/2018ea000491.
CSIRO and BOM, 2015: Climate change in Australia: Projections for Australia’s NRM regions. In: Climate Change in Australia: Information for Australia’s Natural Resource Management Regions. Commonwealth Scientific and Industrial Research Organisation (CSIRO) and Bureau of Meteorology (BOM), Australia, pp. 216, https://publications.csiro.au/rpr/download?pid=csiro:EP154327&dsid=DS2.
CSIRO and BOM, 2016: State of the Climate 2016. Commonwealth Scientific and Industrial Research Organisation (CSIRO) and Bureau of Meteorology (BOM), Australia, 22 pp, www.bom.gov.au/state-of-the-climate/2016/
Dadaser-Celik, F. and E. Cengiz, 2014: Wind speed trends over Turkey from 1975 to 2006. International Journal of Climatology, 34(6), 1913–1927, doi: 10.1002/joc.3810.
Dai, A., 2013: Increasing drought under global warming in observations and models. Nature Climate Change, 3, 52, doi: 10.1038/nclimate1633.
Dai, A., 2021: Hydroclimatic trends during 1950–2018 over global land. Climate Dynamics, 56(11–12), 4027–4049, doi: 10.1007/s00382-021-05684-1.
Dai, A. and T. Zhao, 2017: Uncertainties in historical changes and future projections of drought. Part I: estimates of historical drought changes. Climatic Change, 144(3), 519–533, doi: 10.1007/s10584-016-1705-2.
Dai, A., T. Zhao, and J. Chen, 2018: Climate Change and Drought: a Precipitation and Evaporation Perspective. Current Climate Change Reports, 4(3), 301–312, doi: 10.1007/s40641-018-0101-6.
Daloz, A.S. and S.J. Camargo, 2018: Is the poleward migration of tropical cyclone maximum intensity associated with a poleward migration of tropical cyclone genesis?Climate Dynamics, 50(1), 705–715, doi: 10.1007/s00382-017-3636-7.
Dankers, R. et al., 2014: First look at changes in flood hazard in the Inter-Sectoral Impact Model Intercomparison Project ensemble. Proceedings of the National Academy of Sciences, 111(9), 3257–3261, doi: 10.1073/pnas.1302078110.
Dashkhuu, D., J.P. Kim, J.A. Chun, and W.-S. Lee, 2015: Long-term trends in daily temperature extremes over Mongolia. Weather and Climate Extremes, 8, 26–33, doi: 10.1016/j.wace.2014.11.003.
Davin, E.L., S.I. Seneviratne, P. Ciais, A. Olioso, and T. Wang, 2014: Preferential cooling of hot extremes from cropland albedo management. Proceedings of the National Academy of Sciences, 111(27), 9757–9761, doi: 10.1073/pnas.1317323111.
de Lima, M.I.P., F.E. Santo, A.M. Ramos, and R.M. Trigo, 2015: Trends and correlations in annual extreme precipitation indices for mainland Portugal, 1941–2007. Theoretical and Applied Climatology, 119(1–2), 55–75, doi: 10.1007/s00704-013-1079-6.
De Luca, P., G. Messori, F.M.E. Pons, and D. Faranda, 2020a: Dynamical systems theory sheds new light on compound climate extremes in Europe and Eastern North America. Quarterly Journal of the Royal Meteorological Society, 146(729), 1636–1650, doi: 10.1002/qj.3757.
De Luca, P., G. Messori, R.L. Wilby, M. Mazzoleni, and G. Di Baldassarre, 2020b: Concurrent wet and dry hydrological extremes at the global scale. Earth System Dynamics, 11(1), 251–266, doi: 10.5194/esd-11-251-2020.
de Vrese, P., S. Hagemann, and M. Claussen, 2016: Asian irrigation, African rain: Remote impacts of irrigation. Geophysical Research Letters, 43(8), 3737–3745, doi: 10.1002/2016gl068146.
DeAngelis, A.M. et al., 2020: Prediction Skill of the 2012 U.S. Great Plains Flash Drought in Subseasonal Experiment (SubX) Models. Journal of Climate, 33(14), 6229–6253, doi: 10.1175/jcli-d-19-0863.1.
Degefie, D.T. et al., 2014: Climate extremes in South Western Siberia: past and future. Stochastic Environmental Research and Risk Assessment, 28(8), 2161–2173, doi: 10.1007/s00477-014-0872-9.
Delworth, T.L. and F. Zeng, 2014: Regional rainfall decline in Australia attributed to anthropogenic greenhouse gases and ozone levels. Nature Geoscience, 7(8), 583–587, doi: 10.1038/ngeo2201.
Deng, Y., W. Jiang, B. He, Z. Chen, and K. Jia, 2018: Change in Intensity and Frequency of Extreme Precipitation and its Possible Teleconnection With Large-Scale Climate Index Over the China From 1960 to 2015. Journal of Geophysical Research: Atmospheres, 123(4), 2068–2081, doi: 10.1002/2017jd027078.
Denniston, R.F. and M. Luetscher, 2017: Speleothems as high-resolution paleoflood archives. Quaternary Science Reviews, 170, 1–13, doi: 10.1016/j.quascirev.2017.05.006.
Déqué, M. et al., 2017: A multi-model climate response over tropical Africa at +2°C. Climate Services, 7, 87–95, doi: 10.1016/j.cliser.2016.06.002.
Dereczynski, C. et al., 2020: Downscaling of climate extremes over South America – Part I: Model evaluation in the reference climate. Weather and Climate Extremes, 29, 100273, doi: 10.1016/j.wace.2020.100273.
Deshpande, N.R., D.R. Kothawale, and A. Kulkarni, 2016: Changes in climate extremes over major river basins of India. International Journal of Climatology, 36(14), 4548–4559, doi: 10.1002/joc.4651.
Devanand, A., M. Huang, M. Ashfaq, B. Barik, and S. Ghosh, 2019: Choice of Irrigation Water Management Practice Affects Indian Summer Monsoon Rainfall and Its Extremes. Geophysical Research Letters, 46(15), 9126–9135, doi: 10.1029/2019gl083875.
Dey, R., S.C. Lewis, and N.J. Abram, 2019a: Investigating observed northwest Australian rainfall trends in Coupled Model Intercomparison Project phase 5 detection and attribution experiments. International Journal of Climatology, 39(1), 112–127, doi: 10.1002/joc.5788.
Dey, R., S.C. Lewis, J.M. Arblaster, and N.J. Abram, 2019b: A review of past and projected changes in Australia’s rainfall. WIREs Climate Change, 10(3), e577, doi: 10.1002/wcc.577.
Di Luca, A., R. de Elía, and R. Laprise, 2015: Challenges in the Quest for Added Value of Regional Climate Dynamical Downscaling. Current Climate Change Reports, 1(1), 10–21, doi: 10.1007/s40641-015-0003-9.
Di Luca, A., A.J. Pitman, and R. de Elía, 2020a: Decomposing Temperature Extremes Errors in CMIP5 and CMIP6 Models. Geophysical Research Letters, 47(14), 1–9, doi: 10.1029/2020gl088031.
Di Luca, A., R. de Elía, M. Bador, and D. Argüeso, 2020b: Contribution of mean climate to hot temperature extremes for present and future climates. Weather and Climate Extremes, 28, 100255, doi: 10.1016/j.wace.2020.100255.
Di Luca, A., J.P. Evans, A.S. Pepler, L.V. Alexander, and D. Argüeso, 2016: Evaluating the representation of Australian East Coast Lows in a regional climate model ensemble. Journal of Southern Hemisphere Earth System Science, 66(2), 108–124, doi: 10.22499/3.6602.003.
Diaconescu, E.P., A. Mailhot, R. Brown, and D. Chaumont, 2018: Evaluation of CORDEX-Arctic daily precipitation and temperature-based climate indices over Canadian Arctic land areas. Climate Dynamics, 50(5–6), 2061–2085, doi: 10.1007/s00382-017-3736-4.
Diallo, I., F. Giorgi, S. Sukumaran, F. Stordal, and G. Giuliani, 2015: Evaluation of RegCM4 driven by CAM4 over Southern Africa: mean climatology, interannual variability and daily extremes of wet season temperature and precipitation. Theoretical and Applied Climatology, 121(3–4), 749–766, doi: 10.1007/s00704-014-1260-6.
Diallo, I. et al., 2016: Projected changes of summer monsoon extremes and hydroclimatic regimes over West Africa for the twenty-first century. Climate Dynamics, 47(12), 3931–3954, doi: 10.1007/s00382-016-3052-4.
Diedhiou, A. et al., 2018: Changes in climate extremes over West and Central Africa at 1.5°C and 2°C global warming. Environmental Research Letters, 13(6), 065020, doi: 10.1088/1748-9326/aac3e5.
Dierauer, J.R., D.M. Allen, and P.H. Whitfield, 2019: Snow Drought Risk and Susceptibility in the Western United States and Southwestern Canada. Water Resources Research, 55(4), 3076–3091, doi: 10.1029/2018wr023229.
Diffenbaugh, N.S., M. Scherer, and R.J. Trapp, 2013: Robust increases in severe thunderstorm environments in response to greenhouse forcing. Proceedings of the National Academy of Sciences, 110(41), 16361–16366, doi: 10.1073/pnas.1307758110.
Diffenbaugh, N.S., D.L. Swain, and D. Touma, 2015: Anthropogenic warming has increased drought risk in California. Proceedings of the National Academy of Sciences, 112(13), 3931–3936, doi: 10.1073/pnas.1422385112.
Diffenbaugh, N.S. et al., 2017: Quantifying the influence of global warming on unprecedented extreme climate events. Proceedings of the National Academy of Sciences, 114(19), 4881–4886, doi: 10.1073/pnas.1618082114.
Dikšaitytė, A., A. Viršilė, J. Žaltauskaitė, I. Januškaitienė, and G. Juozapaitienė, 2019: Growth and photosynthetic responses inBrassica napusdiffer during stress and recovery periods when exposed to combined heat, drought and elevated CO2. Plant Physiology and Biochemistry, 142, 59–72, doi: 10.1016/j.plaphy.2019.06.026.
Dimri, A.P., 2019: Comparison of regional and seasonal changes and trends in daily surface temperature extremes over India and its subregions. Theoretical and Applied Climatology, 136(1), 265–286, doi: 10.1007/s00704-018-2486-5.
Dimri, A.P. et al., 2015: Western Disturbances: A review. Reviews of Geophysics, 53(2), 225–246, doi: 10.1002/2014rg000460.
Dimri, A.P. et al., 2017: Cloudbursts in Indian Himalayas: A review. Earth-Science Reviews, 168, 1–23, doi: 10.1016/j.earscirev.2017.03.006.
Dirmeyer, P.A., Y. Jin, B. Singh, and X. Yan, 2013: Trends in land–atmosphere interactions from CMIP5 simulations. Journal of Hydrometeorology, 14(3), 829–849, doi: 10.1175/jhm-d-12-0107.1.
Dirmeyer, P.A. et al., 2006: GSWP-2: Multimodel Analysis and Implications for Our Perception of the Land Surface. Bulletin of the American Meteorological Society, 87(10), 1381–1398, doi: 10.1175/bams-87-10-1381.
Diro, G.T., L. Sushama, and O. Huziy, 2018: Snow–atmosphere coupling and its impact on temperature variability and extremes over North America. Climate Dynamics, 50(7), 2993–3007, doi: 10.1007/s00382-017-3788-5.
Dittus, A.J., D.J. Karoly, S.C. Lewis, and L. Alexander, 2014: An investigation of some unexpected frost day increases in southern Australia. Australian Meteorological and Oceanographic Journal, 64(4), 261–271, doi: 10.22499/2.6404.002.
Dittus, A.J., D.J. Karoly, S.C. Lewis, L. Alexander, and M.G. Donat, 2016: A Multiregion Model Evaluation and Attribution Study of Historical Changes in the Area Affected by Temperature and Precipitation Extremes. Journal of Climate, 29(23), 8285–8299, doi: 10.1175/jcli-d-16-0164.1.
Dittus, A.J., D.J. Karoly, M.G. Donat, S.C. Lewis, and L. Alexander, 2018: Understanding the role of sea surface temperature-forcing for variability in global temperature and precipitation extremes. Weather and Climate Extremes, 21, 1–9, doi: 10.1016/j.wace.2018.06.002.
Do, H.X., S. Westra, and M. Leonard, 2017: A global-scale investigation of trends in annual maximum streamflow. Journal of Hydrology, 552, 28–43, doi: 10.1016/j.jhydrol.2017.06.015.
Do, H.X., Y. Mei, and A.D. Gronewold, 2020: To What Extent Are Changes in Flood Magnitude Related to Changes in Precipitation Extremes?Geophysical Research Letters, 47(18), e2020GL088684, doi: 10.1029/2020gl088684.
Dobricic, S., S. Russo, L. Pozzoli, J. Wilson, and E. Vignati, 2020: Increasing occurrence of heat waves in the terrestrial Arctic. Environmental Research Letters, 15(2), 024022, doi: 10.1088/1748-9326/ab6398.
Döll, P., H. Douville, A. Güntner, H. Müller Schmied, and Y. Wada, 2016: Modelling Freshwater Resources at the Global Scale: Challenges and Prospects. Surveys in Geophysics, 37(2), 195–221, doi: 10.1007/s10712-015-9343-1.
Döll, P. et al., 2018: Risks for the global freshwater system at 1.5°C and 2°C global warming. Environmental Research Letters, 13(4), 044038, doi: 10.1088/1748-9326/aab792.
Domínguez-Castro, F., R. García-Herrera, and S.M. Vicente-Serrano, 2018: Wet and dry extremes in Quito (Ecuador) since the 17th century. International Journal of Climatology, 38(4), 2006–2014, doi: 10.1002/joc.5312.
Donat, M.G., A.J. Pitman, and S.I. Seneviratne, 2017: Regional warming of hot extremes accelerated by surface energy fluxes. Geophysical Research Letters, 44(13), 7011–7019, doi: 10.1002/2017gl073733.
Donat, M.G., A.J. Pitman, and O. Angélil, 2018: Understanding and Reducing Future Uncertainty in Midlatitude Daily Heat Extremes Via Land Surface Feedback Constraints. Geophysical Research Letters, 45(19), 10627–10636, doi: 10.1029/2018gl079128.
Donat, M.G., L. Alexander, N. Herold, and A.J. Dittus, 2016a: Temperature and precipitation extremes in century-long gridded observations, reanalyses, and atmospheric model simulations. Journal of Geophysical Research: Atmospheres, 121(19), 11174–11189, doi: 10.1002/2016jd025480.
Donat, M.G., A.L. Lowry, L. Alexander, P.A. O’Gorman, and N. Maher, 2016b: More extreme precipitation in the world’s dry and wet regions. Nature Climate Change, 6(5), 508–513, doi: 10.1038/nclimate2941.
Donat, M.G. et al., 2013a: Global Land-Based Datasets for Monitoring Climatic Extremes. Bulletin of the American Meteorological Society, 94(7), 997–1006, doi: 10.1175/bams-d-12-00109.1.
Donat, M.G. et al., 2013b: Updated analyses of temperature and precipitation extreme indices since the beginning of the twentieth century: The HadEX2 dataset. Journal of Geophysical Research: Atmospheres, 118(5), 2098–2118, doi: 10.1002/jgrd.50150.
Donat, M.G. et al., 2014a: Changes in extreme temperature and precipitation in the Arab region: long-term trends and variability related to ENSO and NAO. International Journal of Climatology, 34(3), 581–592, doi: 10.1002/joc.3707.
Donat, M.G. et al., 2014b: Consistency of Temperature and Precipitation Extremes across Various Global Gridded In Situ and Reanalysis Datasets. Journal of Climate, 27(13), 5019–5035, doi: 10.1175/jcli-d-13-00405.1.
Dong, B. and A. Dai, 2015: The influence of the Interdecadal Pacific Oscillation on Temperature and Precipitation over the Globe. Climate Dynamics, 45(9), 2667–2681, doi: 10.1007/s00382-015-2500-x.
Dong, B., R. Sutton, and L. Shaffrey, 2014: The 2013 hot, dry, summer in western Europe [in “Explaining Extreme Events of 2013 from a Climate Perspective”]. Bulletin of the American Meteorological Society, 95(9), S62–S66, doi: 10.1175/1520-0477-95.9.s1.1.
Dong, B., R.T. Sutton, and L. Shaffrey, 2017: Understanding the rapid summer warming and changes in temperature extremes since the mid-1990s over Western Europe. Climate Dynamics, 48(5–6), 1537–1554, doi: 10.1007/s00382-016-3158-8.
Dong, B., R. Sutton, L. Shaffrey, and L. Wilcox, 2016a: The 2015 European Heat Wave. Bulletin of the American Meteorological Society, 97(12), S57–S62, doi: 10.1175/bams-d-16-0140.1.
Dong, B. et al., 2016b: Abrupt summer warming and changes in temperature extremes over Northeast Asia since the mid-1990s: Drivers and physical processes. Advances in Atmospheric Sciences, 33(9), 1005–1023, doi: 10.1007/s00376-016-5247-3.
Dong, S., Y. Xu, B. Zhou, and Y. Shi, 2015: Assessment of indices of temperature extremes simulated by multiple CMIP5 models over China. Advances in Atmospheric Sciences, 32(8), 1077–1091, doi: 10.1007/s00376-015-4152-5.
Dong, S. et al., 2018: Observed changes in temperature extremes over Asia and their attribution. Climate Dynamics, 51(1–2), 339–353, doi: 10.1007/s00382-017-3927-z.
Dong, S. et al., 2021: Attribution of Extreme Precipitation with Updated Observations and CMIP6 Simulations. Journal of Climate, 34(3), 871–881, doi: 10.1175/jcli-d-19-1017.1.
Donnelly, C. et al., 2017: Impacts of climate change on European hydrology at 1.5, 2 and 3 degrees mean global warming above preindustrial level. Climatic Change, 143(1–2), 13–26, doi: 10.1007/s10584-017-1971-7.
Donnelly, J.P. et al., 2001: 700 yr sedimentary record of intense hurricane landfalls in southern New England. Geological Society of America Bulletin, 113(6), 714–727, doi: 10.1130/0016-7606(2001)113<0714:ysroih>2.0.co;2.
Dookie, N., X.T. Chadee, and R.M. Clarke, 2019: Trends in extreme temperature and precipitation indices for the Caribbean small islands: Trinidad and Tobago. Theoretical and Applied Climatology, 136(1), 31–44, doi: 10.1007/s00704-018-2463-z.
Dorigo, W. et al., 2012: Evaluating global trends (1988–2010) in harmonized multi-satellite surface soil moisture. Geophysical Research Letters, 39(18), L18405, doi: 10.1029/2012gl052988.
Dorigo, W. et al., 2017: ESA CCI Soil Moisture for improved Earth system understanding: State-of-the art and future directions. Remote Sensing of Environment, 203, 185–215, doi: 10.1016/j.rse.2017.07.001.
Dorigo, W.A. et al., 2011: The International Soil Moisture Network: a data hosting facility for global in situ soil moisture measurements. Hydrology and Earth System Sciences, 15(5), 1675–1698, doi: 10.5194/hess-15-1675-2011.
Dorigo, W.A. et al., 2015: Evaluation of the ESA CCI soil moisture product using ground-based observations. Remote Sensing of Environment, 162, 380–395, doi: 10.1016/j.rse.2014.07.023.
Dosio, A., 2016: Projections of climate change indices of temperature and precipitation from an ensemble of bias-adjusted high-resolution EURO-CORDEX regional climate models. Journal of Geophysical Research: Atmospheres, 121(10), 5488–5511, doi: 10.1002/2015jd024411.
Dosio, A., 2017: Projection of temperature and heat waves for Africa with an ensemble of CORDEX Regional Climate Models. Climate Dynamics, 49(1–2), 493–519, doi: 10.1007/s00382-016-3355-5.
Dosio, A. and E.M. Fischer, 2018: Will Half a Degree Make a Difference? Robust Projections of Indices of Mean and Extreme Climate in Europe Under 1.5°C, 2°C, and 3°C Global Warming. Geophysical Research Letters, 45(2), 935–944, doi: 10.1002/2017gl076222.
Dosio, A., H.-J. Panitz, M. Schubert-Frisius, and D. Lüthi, 2015: Dynamical downscaling of CMIP5 global circulation models over CORDEX-Africa with COSMO-CLM: evaluation over the present climate and analysis of the added value. Climate Dynamics, 44, 2637–2661, doi: 10.1007/s00382-014-2262-x.
Dosio, A. et al., 2019: What can we know about future precipitation in Africa? Robustness, significance and added value of projections from a large ensemble of regional climate models. Climate Dynamics, 53(9–10), 5833–5858, doi: 10.1007/s00382-019-04900-3.
Douville, H. and M. Plazzotta, 2017: Midlatitude Summer Drying: An Underestimated Threat in CMIP5 Models?Geophysical Research Letters, 44(19), 9967–9975, doi: 10.1002/2017gl075353.
Douville, H., J. Colin, E. Krug, J. Cattiaux, and S. Thao, 2016: Midlatitude daily summer temperatures reshaped by soil moisture under climate change. Geophysical Research Letters, 43(2), 812–818, doi: 10.1002/2015gl066222.
Dowdy, A.J., 2018: Climatological Variability of Fire Weather in Australia. Journal of Applied Meteorology and Climatology, 57(2), 221–234, doi: 10.1175/jamc-d-17-0167.1.
Dowdy, A.J. and J.L. Catto, 2017: Extreme weather caused by concurrent cyclone, front and thunderstorm occurrences. Scientific Reports, 7, 1–8, doi: 10. 1038/srep40359.
Dowdy, A.J. et al., 2019: Review of Australian east coast low pressure systems and associated extremes. Climate Dynamics, 53(7–8), 4887–4910, doi: 10.1007/s00382-019-04836-8.
Drijfhout, S. et al., 2015: Catalogue of abrupt shifts in Intergovernmental Panel on Climate Change climate models. Proceedings of the National Academy of Sciences, 112(43), E5777–E5786, doi: 10.1073/pnas.1511451112.
Driouech, F., K. ElRhaz, W. Moufouma-Okia, K. Arjdal, and S. Balhane, 2020: Assessing Future Changes of Climate Extreme Events in the CORDEX-MENA Region Using Regional Climate Model ALADIN-Climate. Earth Systems and Environment, 4(3), 477–492, doi: 10.1007/s41748-020-00169-3.
Driouech, F. et al., 2021: Recent observed country-wide climate trends in Morocco. International Journal of Climatology, 41(S1), 1–20, doi: 10.1002/joc.6734.
Drobinski, P. et al., 2018: Scaling precipitation extremes with temperature in the Mediterranean: past climate assessment and projection in anthropogenic scenarios. Climate Dynamics, 51(3), 1237–1257, doi: 10.1007/s00382-016-3083-x.
Drouard, M., K. Kornhuber, and T. Woollings, 2019: Disentangling Dynamic Contributions to Summer 2018 Anomalous Weather Over Europe. Geophysical Research Letters, 46(21), 12537–12546, doi: 10.1029/2019gl084601.
Drumond, A., M. Stojanovic, R. Nieto, S.M. Vicente-Serrano, and L. Gimeno, 2019: Linking Anomalous Moisture Transport And Drought Episodes in the IPCC Reference Regions. Bulletin of the American Meteorological Society, 100(8), 1481–1498, doi: 10.1175/bams-d-18-0111.1.
Du, H. et al., 2019: Precipitation From Persistent Extremes is Increasing in Most Regions and Globally. Geophysical Research Letters, 46(11), 6041–6049, doi: 10.1029/2019gl081898.
Ducrocq, V., O. Nuissier, D. Ricard, C. Lebeaupin, and T. Thouvenin, 2008: A numerical study of three catastrophic precipitating events over southern France. II: Mesoscale triggering and stationarity factors. Quarterly Journal of the Royal Meteorological Society, 134(630), 131–145, doi: 10.1002/qj.199.
Dudley, R.W., G.A. Hodgkins, M.R. McHale, M.J. Kolian, and B. Renard, 2017: Trends in snowmelt-related streamflow timing in the conterminous United States. Journal of Hydrology, 547, 208–221, doi: 10.1016/j.jhydrol.2017.01.051.
Dudley, R.W., R.M. Hirsch, S.A. Archfield, A.G. Blum, and B. Renard, 2020: Low streamflow trends at human-impacted and reference basins in the United States. Journal of Hydrology, 580, 124254, doi: 10.1016/j.jhydrol.2019.124254.
Duffy, P.B., P. Brando, G.P. Asner, and C.B. Field, 2015: Projections of future meteorological drought and wet periods in the Amazon. Proceedings of the National Academy of Sciences, 112(43), 13172–13177, doi: 10.1073/pnas.1421010112.
Duke, N.C. et al., 2017: Large-scale dieback of mangroves in Australia’s Gulf of Carpentaria: a severe ecosystem response, coincidental with an unusually extreme weather event. Marine and Freshwater Research, 68(10), 1816–1829, doi: 10.1071/mf16322.
Dunn, R.J.H. et al., 2020: Development of an Updated Global Land In Situ-Based Data Set of Temperature and Precipitation Extremes: HadEX3. Journal of Geophysical Research: Atmospheres, 125(16), e2019JD032263, doi: 10.1029/2019jd032263.
Dunning, C.M., E. Black, and R.P. Allan, 2018: Later Wet Seasons with More Intense Rainfall over Africa under Future Climate Change. Journal of Climate, 31(23), 9719–9738, doi: 10.1175/jcli-d-18-0102.1.
Dunstone, N.J., D.M. Smith, B.B.B. Booth, L. Hermanson, and R. Eade, 2013: Anthropogenic aerosol forcing of Atlantic tropical storms. Nature Geoscience, 6(7), 534–539, doi: 10.1038/ngeo1854.
Durkee, J.D. and T.L. Mote, 2010: A climatology of warm-season mesoscale convective complexes in subtropical South America. International Journal of Climatology, 30(3), 418–431, doi: 10.1002/joc.1893.
Easterling, D.R., K.E. Kunkel, M.F. Wehner, and L. Sun, 2016: Detection and attribution of climate extremes in the observed record. Weather and Climate Extremes, 11, 17–27, doi: 10.1016/j.wace.2016.01.001.
Wuebbles, D.J., D.W. Fahey, K.A. Hibbard, D.J. Dokken, B.C. Stewart, and T.K. Maycock (eds.), 2017: Precipitation change in the United States. U.S. Global Change Research Program, Washington, DC, USA, 207-230 pp., doi: 10.7930/j0h993cc.
Eden, J.M., K. Wolter, F.E.L. Otto, and G. Jan van Oldenborgh, 2016: Multi-method attribution analysis of extreme precipitation in Boulder, Colorado. Environmental Research Letters, 11(12), 124009, doi: 10.1088/1748-9326/11/12/124009.
Edossa, D.C., Y.E. Woyessa, and W.A. Welderufael, 2016: Spatiotemporal analysis of droughts using self-calibrating Palmer’s Drought Severity Index in the central region of South Africa. Theoretical and Applied Climatology, 126(3–4), 643–657, doi: 10.1007/s00704-015-1604-x.
El Kenawy, A., J.I. López-Moreno, and S.M. Vicente-Serrano, 2013: Summer temperature extremes in northeastern Spain: Spatial regionalization and links to atmospheric circulation (1960–2006). Theoretical and Applied Climatology, 113(3–4), 387–405, doi: 10.1007/s00704-012-0797-5.
Elsner, J.B., J.P. Kossin, and T.H. Jagger, 2008: The increasing intensity of the strongest tropical cyclones. Nature, 455(7209), 92–95, doi: 10.1038/nature07234.
Elsner, J.B., S.C. Elsner, and T.H. Jagger, 2015: The increasing efficiency of tornado days in the United States. Climate Dynamics, 45(3), 651–659, doi: 10.1007/s00382-014-2277-3.
Elsner, J.B., T. Fricker, and Z. Schroder, 2019: Increasingly Powerful Tornadoes in the United States. Geophysical Research Letters, 46(1), 392–398, doi: 10.1029/2018gl080819.
Emanuel, K.A., 1987: The dependence of hurricane intensity on climate. Nature, 326(6112), 483–485, doi: 10.1038/326483a0.
Emanuel, K.A., 2013: Downscaling CMIP5 climate models shows increased tropical cyclone activity over the 21st century. Proceedings of the National Academy of Sciences, 110(30), 12219–12224, doi: 10.1073/pnas.1301293110.
Emanuel, K.A., 2017: Assessing the present and future probability of Hurricane Harvey's rainfall. Proceedings of the National Academy of Sciences, 114(48), 12681–12684, doi: 10.1073/pnas.1716222114.
Emanuel, K.A., 2021: Response of Global Tropical Cyclone Activity to Increasing CO2 : Results from Downscaling CMIP6 Models. Journal of Climate, 34(1), 57–70, doi: 10.1175/jcli-d-20-0367.1.
Emanuel, K.A., R. Sundararajan, and J. Williams, 2008: Hurricanes and global warming: Results from downscaling IPCC AR4 simulations. Bulletin of the American Meteorological Society, 89(3), 347–367, doi: 10.1175/bams-89-3-347.
Emanuel, K.A., S. Ravela, E. Vivant, and C. Risi, 2006: A statistical deterministic approach to hurricane risk assessment. Bulletin of the American Meteorological Society, 87(3), 299–314, doi: 10.1175/bams-87-3-299.
Emanuel, K.A. et al., 2018: On the Desirability and Feasibility of a Global Reanalysis of Tropical Cyclones. Bulletin of the American Meteorological Society, 99(2), 427–429, doi: 10.1175/bams-d-17-0226.1.
Endo, H., A. Kitoh, R. Mizuta, and M. Ishii, 2017: Future Changes in Precipitation Extremes in East Asia and Their Uncertainty Based on Large Ensemble Simulations with a High-Resolution AGCM. SOLA, 13, 7–12, doi: 10.2151/sola.2017-002.
Engelbrecht, F.A., J.L. McGregor, and C.J. Engelbrecht, 2009: Dynamics of the Conformal-Cubic Atmospheric Model projected climate-change signal over southern Africa. International Journal of Climatology, 29(7), 1013–1033, doi: 10.1002/joc.1742.
Engelbrecht, F.A. et al., 2015: Projections of rapidly rising surface temperatures over Africa under low mitigation. Environmental Research Letters, 10(8), 085004, doi: 10.1088/1748-9326/10/8/085004.
Engström, J. and D. Keellings, 2018: Drought in the Southeastern USA: an assessment of downscaled CMIP5 models. Climate Research, 74(3), 251–262, doi: 10.3354/cr01502.
Erdenebat, E. and T. Sato, 2016: Recent increase in heat wave frequency around Mongolia: role of atmospheric forcing and possible influence of soil moisture deficit. Atmospheric Science Letters, 17(2), 135–140, doi: 10.1002/asl.616.
Erfanian, A., G. Wang, and L. Fomenko, 2017: Unprecedented drought over tropical South America in 2016: significantly under-predicted by tropical SST. Scientific Reports, 7(1), 5811, doi: 10.1038/s41598-017-05373-2.
Erlat, E. and M. Türkeş, 2016: Dates of frost onset, frost end and the frost-free season in Turkey: Trends, variability and links to the North Atlantic and Arctic Oscillation indices, 1950–2013. Climate Research, 69(2), 155–176, doi: 10.3354/cr01397.
Escalante-Sandoval, C. and P. Nuñez-Garcia, 2017: Meteorological drought features in northern and northwestern parts of Mexico under different climate change scenarios. Journal of Arid Land, 9(1), 65–75, doi: 10.1007/s40333-016-0022-y.
Evan, A.T., J.P. Kossin, C.E. Chung, and V. Ramanathan, 2011: Arabian Sea tropical cyclones intensified by emissions of black carbon and other aerosols. Nature, 479(7371), 94–97, doi: 10.1038/nature10552.
Evans, J.P., D. Argueso, R. Olson, and A. Di Luca, 2017: Bias-corrected regional climate projections of extreme rainfall in south-east Australia. Theoretical and Applied Climatology, 130(3–4), 1085–1098, doi: 10.1007/s00704-016-1949-9.
Evans, J.P. et al., 2021: The CORDEX-Australasia ensemble: evaluation and future projections. Climate Dynamics, 57(5–6), 1385–1401, doi: 10.1007/s00382-020-05459-0.
Falconer, R.H. et al., 2009: Pluvial flooding: new approaches in flood warning, mapping and risk management. Journal of Flood Risk Management, 2(3), 198–208, doi: 10.1111/j.1753-318x.2009.01034.x.
Fantini, A. et al., 2018: Assessment of multiple daily precipitation statistics in ERA-Interim driven Med-CORDEX and EURO-CORDEX experiments against high resolution observations. Climate Dynamics, 51(3), 877–900, doi: 10.1007/s00382-016-3453-4.
Fazel, N., A. Torabi Haghighi, and B. Kløve, 2017: Analysis of land use and climate change impacts by comparing river flow records for headwaters and lowland reaches. Global and Planetary Change, 158, 47–56, doi: 10.1016/j.gloplacha.2017.09.014.
Feng, R., R. Yu, H. Zheng, and M. Gan, 2018: Spatial and temporal variations in extreme temperature in Central Asia. International Journal of Climatology, 38, e388–e400, doi: 10.1002/joc.5379.
Feng, S., M. Trnka, M. Hayes, and Y. Zhang, 2017: Why Do Different Drought Indices Show Distinct Future Drought Risk Outcomes in the U.S. Great Plains?Journal of Climate, 30(1), 265–278, doi: 10.1175/jcli-d-15-0590.1.
Feng, Z. et al., 2016: More frequent intense and long-lived storms dominate the springtime trend in central US rainfall. Nature Communications, 7, 13429, doi: 10.1038/ncomms13429.
Fenta, A.A., H. Yasuda, K. Shimizu, and N. Haregeweyn, 2017: Response of streamflow to climate variability and changes in human activities in the semiarid highlands of northern Ethiopia. Regional Environmental Change, 17(4), 1229–1240, doi: 10.1007/s10113-017-1103-y.
Feser, F. et al., 2015: Storminess over the North Atlantic and northwestern Europe – A review. Quarterly Journal of the Royal Meteorological Society, 141(687), 350–382, doi: 10.1002/qj.2364.
Ficklin, D.L., J.T. Abatzoglou, S.M. Robeson, S.E. Null, and J.H. Knouft, 2018: Natural and managed watersheds show similar responses to recent climate change. Proceedings of the National Academy of Sciences, 115(34), 8553–8557, doi: 10.1073/pnas.1801026115.
Field, R.D. et al., 2016: Indonesian fire activity and smoke pollution in 2015 show persistent nonlinear sensitivity to El Niño-induced drought. Proceedings of the National Academy of Sciences, 113(33), 9204–9209, doi: 10.1073/pnas.1524888113.
Filahi, S., M. Tanarhte, L. Mouhir, M. El Morhit, and Y. Tramblay, 2016: Trends in indices of daily temperature and precipitations extremes in Morocco. Theoretical and Applied Climatology, 124(3–4), 959–972, doi: 10.1007/s00704-015-1472-4.
Findell, K.L. et al., 2017: The impact of anthropogenic land use and land cover change on regional climate extremes. Nature Communications, 8(1), 989, doi: 10.1038/s41467-017-01038-w.
Findell, K.L. et al., 2019: Rising Temperatures Increase Importance of Oceanic Evaporation as a Source for Continental Precipitation. Journal of Climate, 32(22), 7713–7726, doi: 10.1175/jcli-d-19-0145.1.
Finney, D.L. et al., 2019: Implications of Improved Representation of Convection for the East Africa Water Budget Using a Convection-Permitting Model. Journal of Climate, 32(7), 2109–2129, doi: 10.1175/jcli-d-18-0387.1.
Finney, D.L. et al., 2020: Effects of Explicit Convection on Future Projections of Mesoscale Circulations, Rainfall, and Rainfall Extremes over Eastern Africa. Journal of Climate, 33(7), 2701–2718, doi: 10.1175/jcli-d-19-0328.1.
Fioravanti, G., E. Piervitali, and F. Desiato, 2016: Recent changes of temperature extremes over Italy: an index-based analysis. Theoretical and Applied Climatology, 123(3–4), 473–486, doi: 10.1007/s00704-014-1362-1.
Fischer, A.M. et al., 2015: Projected changes in precipitation intensity and frequency in Switzerland: a multi-model perspective. International Journal of Climatology, 35(11), 3204–3219, doi: 10.1002/joc.4162.
Fischer, E.M. and R. Knutti, 2014: Detection of spatially aggregated changes in temperature and precipitation extremes. Geophysical Research Letters, 41(2), 547–554, doi: 10.1002/2013gl058499.
Fischer, E.M. and R. Knutti, 2015: Anthropogenic contribution to global occurrence of heavy-precipitation and high-temperature extremes. Nature Climate Change, 5(6), 560–564, doi: 10.1038/nclimate2617.
Fischer, E.M. and R. Knutti, 2016: Observed heavy precipitation increase confirms theory and early models. Nature Climate Change, 6(11), 986–991, doi: 10.1038/nclimate3110.
Fischer, E.M., J. Sedláček, E. Hawkins, and R. Knutti, 2014: Models agree on forced response pattern of precipitation and temperature extremes. Geophysical Research Letters, 41(23), 8554–8562, doi: 10.1002/2014gl062018.
Fitchett, J.M., 2018: Recent emergence of CAT5 tropical cyclones in the South Indian Ocean. South African Journal of Science, 114(11/12), doi: 10.17159/sajs.2018/4426.
Fitzpatrick, R.G.J. et al., 2020: What Drives the Intensification of Mesoscale Convective Systems over the West African Sahel under Climate Change?Journal of Climate, 33(8), 3151–3172, doi: 10.1175/jcli-d-19-0380.1.
Flach, M. et al., 2017: Multivariate anomaly detection for Earth observations: a comparison of algorithms and feature extraction techniques. Earth System Dynamics, 8(3), 677–696, doi: 10.5194/esd-8-677-2017.
Flach, M. et al., 2018: Contrasting biosphere responses to hydrometeorological extremes: revisiting the 2010 western Russian heatwave. Biogeosciences, 15(20), 6067–6085, doi: 10.5194/bg-15-6067-2018.
Flannigan, M. et al., 2016: Fuel moisture sensitivity to temperature and precipitation: climate change implications. Climatic Change, 134, 59–71, doi: 10.1007/s10584-015-1521-0.
Flato, G. et al., 2013: Evaluation of Climate Models. In: Climate Change 2013: The Physical Science Basis. Contribution of Working Group I to the Fifth Assessment Report of the Intergovernmental Panel on Climate Change[Stocker, T.F., D. Qin, G.-K. Plattner, M. Tignor, S.K. Allen, J. Boschung, A. Nauels, Y. Xia, V. Bex, and P.M. Midgley (eds.)]. Cambridge University Press, Cambridge, United Kingdom and New York, NY, USA, pp. 741–866, doi: 10.1017/cbo9781107415324.020.
Fontaine, B., S. Janicot, and P.-A. Monerie, 2013: Recent changes in air temperature, heat waves occurrences, and atmospheric circulation in Northern Africa. Journal of Geophysical Research: Atmospheres, 118(15), 8536–8552, doi: 10.1002/jgrd.50667.
Fontes, C.G. et al., 2018: Dry and hot: The hydraulic consequences of a climate change–type drought for Amazonian trees. Philosophical Transactions of the Royal Society B: Biological Sciences, 373(1760), doi: 10.1098/rstb.2018.0209.
Ford, T.W. and S.M. Quiring, 2019: Comparison of Contemporary In Situ, Model, and Satellite Remote Sensing Soil Moisture With a Focus on Drought Monitoring. Water Resources Research, 55(2), 1565–1582, doi: 10.1029/2018wr024039.
Formayer, H. and A. Fritz, 2017: Temperature dependency of hourly precipitation intensities – surface versus cloud layer temperature. International Journal of Climatology, 37(1), 1–10, doi: 10.1002/joc.4678.
Formetta, G. and L. Feyen, 2019: Empirical evidence of declining global vulnerability to climate-related hazards. Global Environmental Change, 57, 101920, doi: 10.1016/j.gloenvcha.2019.05.004.
Forzieri, G. et al., 2014: Ensemble projections of future streamflow droughts in Europe. Hydrology and Earth System Sciences, 18(1), 85–108, doi: 10.5194/hess-18-85-2014.
Forzieri, G. et al., 2016: Multi-hazard assessment in Europe under climate change. Climatic Change, 137(1–2), 105–119, doi: 10.1007/s10584-016-1661-x.
Fotso-Nguemo, T.C. et al., 2018: Projected trends of extreme rainfall events from CMIP5 models over Central Africa. Atmospheric Science Letters, 19(2), e803, doi: 10.1002/asl.803.
Fotso-Nguemo, T.C. et al., 2019: Projected changes in the seasonal cycle of extreme rainfall events from CORDEX simulations over Central Africa. Climatic Change, 155(3), 339–357, doi: 10.1007/s10584-019-02492-9.
Fowler, H.J. et al., 2021: Anthropogenic intensification of short-duration rainfall extremes. Nature Reviews Earth & Environment, 2(2), 107–122, doi: 10.1038/s43017-020-00128-6.
Francis, J.A. and S.J. Vavrus, 2012: Evidence linking Arctic amplification to extreme weather in mid-latitudes. Geophysical Research Letters, 39(6), L06801, doi: 10.1029/2012gl051000.
Frank, D.C. et al., 2015: Water-use efficiency and transpiration across European forests during the Anthropocene. Nature Climate Change, 5(6), 579–583, doi: 10.1038/nclimate2614.
Freund, M., B.J. Henley, D.J. Karoly, K.J. Allen, and P.J. Baker, 2017: Multi-century cool- and warm-season rainfall reconstructions for Australia’s major climatic regions. Climate of the Past, 13(12), 1751–1770, doi: 10.5194/cp-13-1751-2017.
Freychet, N., H.-H. Hsu, C. Chou, and C.-H. Wu, 2015: Asian Summer Monsoon in CMIP5 Projections: A Link between the Change in Extreme Precipitation and Monsoon Dynamics. Journal of Climate, 28(4), 1477–1493, doi: 10.1175/jcli-d-14-00449.1.
Freychet, N., S.F.B. Tett, G.C. Hegerl, and J. Wang, 2018: Central-Eastern China Persistent Heat Waves: Evaluation of the AMIP Models. Journal of Climate, 31(9), 3609–3624, doi: 10.1175/jcli-d-17-0480.1.
Friedrich, K. et al., 2018: Reservoir evaporation in the Western United States. Bulletin of the American Meteorological Society, 99(1), 167–187, doi: 10.1175/bams-d-15-00224.1.
Frieler, K., M. Meinshausen, M. Mengel, N. Braun, and W. Hare, 2012: A Scaling Approach to Probabilistic Assessment of Regional Climate Change. Journal of Climate, 25(9), 3117–3144, doi: 10.1175/jcli-d-11-00199.1.
Frölicher, T.L., E.M. Fischer, and N. Gruber, 2018: Marine heatwaves under global warming. Nature, 560(7718), 360–364, doi: 10.1038/s41586-018-0383-9.
Fu, G. et al., 2013: Temporal variation of extreme rainfall events in China, 1961–2009. Journal of Hydrology, 487, 48–59, doi: 10.1016/j.jhydrol.2013.02.021.
Fu, Q. and S. Feng, 2014: Responses of terrestrial aridity to global warming. Journal of Geophysical Research: Atmospheres, 119(13), 7863–7875, doi: 10.1002/2014jd021608.
Fu, R. et al., 2013: Increased dry-season length over southern Amazonia in recent decades and its implication for future climate projection. Proceedings of the National Academy of Sciences, 110(45), 18110–18115, doi: 10.1073/pnas.1302584110.
Fuhrmann, C.M. et al., 2014: Ranking of Tornado Outbreaks across the United States and Their Climatological Characteristics. Weather and Forecasting, 29(3), 684–701, doi: 10.1175/waf-d-13-00128.1.
Fundel, F., S. Jörg-Hess, and M. Zappa, 2013: Monthly hydrometeorological ensemble prediction of streamflow droughts and corresponding drought indices. Hydrology and Earth System Sciences, 17(1), 395–407, doi: 10.5194/hess-17-395-2013.
Funk, C., A. Hoell, and D.A. Stone, 2014: Examining the contribution of the observed global warming trend to the California droughts of 2012/13 and 2013/14 [in “Explaining Extreme Events of 2013 from a Climate Perspective”]. Bulletin of the American Meteorological Society, 95(9), S11–S13, doi: 10.1175/1520-0477-95.9.s1.1.
Funk, C., S. Shukla, A. Hoell, and B. Livneh, 2015a: Assessing the contributions of east African and west pacific warming to the 2014 boreal spring east African drought. Bulletin of the American Meteorological Society, 96(12), S77–S82, doi: 10.1175/bams-d-15-00106.1.
Funk, C. et al., 2015b: The Centennial Trends Greater Horn of Africa precipitation dataset. Scientific Data, 2, 150050, doi: 10.1038/sdata.2015.50.
Funk, C. et al., 2016: Assessing the Contributions of Local and East Pacific Warming to the 2015 Droughts in Ethiopia and Southern Africa. Bulletin of the American Meteorological Society, 97(12), S75–S80, doi: 10.1175/bams-d-16-0167.1.
Funk, C. et al., 2018a: Anthropogenic Enhancement of Moderate-to-Strong El Niño Events Likely Contributed to Drought and Poor Harvests in Southern Africa During 2016. Bulletin of the American Meteorological Society, 99(1), S91–S96, doi: 10.1175/bams-d-17-0112.1.
Funk, C. et al., 2018b: Examining the role of unusually warm Indo-Pacific sea-surface temperatures in recent African droughts. Quarterly Journal of the Royal Meteorological Society, 144(S1), 360–383, doi: 10.1002/qj.3266.
Funk, C. et al., 2020: Algorithm and Data Improvements for Version 2.1 of the Climate Hazards Center’s InfraRed Precipitation with Stations Data Set. In: Satellite Precipitation Measurement: Volume 1[Levizzani, V., C. Kidd, D. Kirschbaum, C. Kummerow, K. Nakamura, and F. Turk (eds.)]. Springer, Cham, Switzerland, pp. 409–427, doi: 10.1007/978-3-030-24568-9_23.
Furrer, E.M., R.W. Katz, M.D. Walter, and R. Furrer, 2010: Statistical modeling of hot spells and heat waves. Climate Research, 43(3), 191–205, doi: 10.3354/cr00924.
Gaertner, M. et al., 2018: Simulation of medicanes over the Mediterranean Sea in a regional climate model ensemble: impact of ocean–atmosphere coupling and increased resolution. Climate Dynamics, 51(3), 1041–1057, doi: 10.1007/s00382-016-3456-1.
Gaertner, M.A. et al., 2007: Tropical cyclones over the Mediterranean Sea in climate change simulations. Geophysical Research Letters, 34(14), L14711, doi: 10.1029/2007gl029977.
Gajić-Čapka, M., K. Cindrić, and Z. Pasarić, 2015: Trends in precipitation indices in Croatia, 1961–2010. Theoretical and Applied Climatology, 121(1–2), 167–177, doi: 10.1007/s00704-014-1217-9.
Galarneau, T.J., L.F. Bosart, and R.S. Schumacher, 2010: Predecessor rain events ahead of tropical cyclones. Monthly Weather Review, 138(8), 3272–3297, doi: 10.1175/2010mwr3243.1.
Gallant, A.J.E., M.J. Reeder, J.S. Risbey, and K.J. Hennessy, 2013: The characteristics of seasonal-scale droughts in Australia, 1911–2009. International Journal of Climatology, 33(7), 1658–1672, doi: 10.1002/joc.3540.
Gallo, F. et al., 2019: High-resolution regional climate model projections of future tropical cyclone activity in the Philippines. International Journal of Climatology, 39(3), 1181–1194, doi: 10.1002/joc.5870.
Gálos, B., C. Mátyás, and D. Jacob, 2011: Regional characteristics of climate change altering effects of afforestation. Environmental Research Letters, 6(4), 044010, doi: 10.1088/1748-9326/6/4/044010.
Gálos, B. et al., 2013: Case study for the assessment of the biogeophysical effects of a potential afforestation in Europe. Carbon Balance and Management, 8(1), 3, doi: 10.1186/1750-0680-8-3.
Ganeshan, M. and R. Murtugudde, 2015: Nocturnal propagating thunderstorms may favor urban “hot-spots”: A model-based study over Minneapolis. Urban Climate, 14, 606–621, doi: 10.1016/j.uclim.2015.10.005.
Gao, J. et al., 2020: Influence of model resolution on bomb cyclones revealed by HighResMIP-PRIMAVERA simulations. Environmental Research Letters, 15(8), 084001, doi: 10.1088/1748-9326/ab88fa.
Gao, X. et al., 2017a: Performance of RegCM4 over major river basins in China. Advances in Atmospheric Sciences, 34(4), 441–455, doi: 10.1007/s00376-016-6179-7.
Gao, X. et al., 2017b: Temporal and spatial evolution of the standardized precipitation evapotranspiration index (SPEI) in the Loess Plateau under climate change from 2001 to 2050. Science of The Total Environment, 595, 191–200, doi: 10.1016/j.scitotenv.2017.03.226.
Gao, Y., L. Xiao, D. Chen, J. Xu, and H. Zhang, 2018: Comparison between past and future extreme precipitations simulated by global and regional climate models over the Tibetan Plateau. International Journal of Climatology, 38(3), 1285–1297, doi: 10.1002/joc.5243.
García-Cueto, O.R. et al., 2019: Trends of climate change indices in some Mexican cities from 1980 to 2010. Theoretical and Applied Climatology, 137(1–2), 775–790, doi: 10.1007/s00704-018-2620-4.
García-Garizábal, I., J. Causapé, R. Abrahao, and D. Merchan, 2014: Impact of Climate Change on Mediterranean Irrigation Demand: Historical Dynamics of Climate and Future Projections. Water Resources Management, 28(5), 1449–1462, doi: 10.1007/s11269-014-0565-7.
García-Herrera, R. et al., 2019: The European 2016/17 Drought. Journal of Climate, 32(11), 3169–3187, doi: 10.1175/jcli-d-18-0331.1.
Garner, A.J. et al., 2017: Impact of climate change on New York City’s coastal flood hazard: Increasing flood heights from the preindustrial to 2300 CE. Proceedings of the National Academy of Sciences, 114(45), 11861–11866, doi: 10.1073/pnas.1703568114.
Garreaud, R.D. et al., 2017: The 2010–2015 megadrought in central Chile: impacts on regional hydroclimate and vegetation. Hydrology and Earth System Sciences, 21(12), 6307–6327, doi: 10.5194/hess-21-6307-2017.
Garreaud, R.D. et al., 2020: The Central Chile Mega Drought (2010–2018): A climate dynamics perspective. International Journal of Climatology, 40(1), 421–439, doi: 10.1002/joc.6219.
Gaupp, F., J. Hall, D. Mitchell, and S. Dadson, 2019: Increasing risks of multiple breadbasket failure under 1.5 and 2°C global warming. Agricultural Systems, 175, 34–45, doi: 10.1016/j.agsy.2019.05.010.
Ge, G. et al., 2017: Analysis of precipitation extremes in the Qinghai-Tibetan plateau, China: Spatio-temporal characteristics and topography effects. Atmosphere, 8(7), 1–16, doi: 10.3390/atmos8070127.
Gebrechorkos, S.H., S. Hülsmann, and C. Bernhofer, 2018: Changes in temperature and precipitation extremes in Ethiopia, Kenya, and Tanzania. International Journal of Climatology, 39(1), 18–30, doi: 10.1002/joc.5777.
Gebremeskel Haile, G. et al., 2020: Long-term spatiotemporal variation of drought patterns over the Greater Horn of Africa. Science of The Total Environment, 704, 135299, doi: 10.1016/j.scitotenv.2019.135299.
Geirinhas, J.L., R.M. Trigo, R. Libonati, C.A.S. Coelho, and A.C. Palmeira, 2018: Climatic and synoptic characterization of heat waves in Brazil. International Journal of Climatology, 38(4), 1760–1776, doi: 10.1002/joc.5294.
Geng, X., W. Zhang, M.F. Stuecker, and F.F. Jin, 2017: Strong sub-seasonal wintertime cooling over East Asia and Northern Europe associated with super El Ninõ events. Scientific Reports, 7(1), 1–9, doi: 10.1038/s41598-017-03977-2.
Gensini, V.A. and T.L. Mote, 2015: Downscaled estimates of late 21st century severe weather from CCSM3. Climatic Change, 129(1), 307–321, doi: 10.1007/s10584-014-1320-z.
Gensini, V.A. and H.E. Brooks, 2018: Spatial trends in United States tornado frequency. npj Climate and Atmospheric Science, 1(1), 38, doi: 10.1038/s41612-018-0048-2.
Gergel, D.R., B. Nijssen, J.T. Abatzoglou, D.P. Lettenmaier, and M.R. Stumbaugh, 2017: Effects of climate change on snowpack and fire potential in the western USA. Climatic Change, 141(2), 287–299, doi: 10.1007/s10584-017-1899-y.
Gervais, M., L.B. Tremblay, J.R. Gyakum, and E. Atallah, 2014: Representing Extremes in a Daily Gridded Precipitation Analysis over the United States: Impacts of Station Density, Resolution, and Gridding Methods. Journal of Climate, 27(14), 5201–5218, doi: 10.1175/jcli-d-13-00319.1.
Ghausi, S.A. and S. Ghosh, 2020: Diametrically Opposite Scaling of Extreme Precipitation and Streamflow to Temperature in South and Central Asia. Geophysical Research Letters, 47(17), e2020GL089386, doi: 10.1029/2020gl089386.
Gibba, P. et al., 2019: State-of-the-art climate modeling of extreme precipitation over Africa: analysis of CORDEX added-value over CMIP5. Theoretical and Applied Climatology, 137(1), 1041–1057, doi: 10.1007/s00704-018-2650-y.
Gimeno, L. et al., 2012: Oceanic and terrestrial sources of continental precipitation. Reviews of Geophysics, 50(4), RG4003, doi: 10.1029/2012rg000389.
Gimeno, L. et al., 2020: Recent progress on the sources of continental precipitation as revealed by moisture transport analysis. Earth-Science Reviews, 201, 103070, doi: 10.1016/j.earscirev.2019.103070.
Giorgi, F., C. Jones, and G. Asrar, 2009: Addressing climate information needs at the regional level: the CORDEX framework. WMO Bulletin, 58(3), 175–183, https://public.wmo.int/en/bulletin/addressing-climate-information-needs-regional-level-cordex-framework.
Giorgi, F., F. Raffaele, and E. Coppola, 2019: The response of precipitation characteristics to global warming from climate projections. Earth System Dynamics, 10(1), 73–89, doi: 10.5194/esd-10-73-2019.
Giorgi, F. et al., 2014: Changes in extremes and hydroclimatic regimes in the CREMA ensemble projections. Climatic Change, 125(1), 39–51, doi: 10.1007/s10584-014-1117-0.
Giuntoli, I., B. Renard, J.-P. Vidal, and A. Bard, 2013: Low flows in France and their relationship to large-scale climate indices. Journal of Hydrology, 482, 105–118, doi: 10.1016/j.jhydrol.2012.12.038.
Giuntoli, I., J.-P. Vidal, C. Prudhomme, and D.M. Hannah, 2015: Future hydrological extremes: The uncertainty from multiple global climate and global hydrological models. Earth System Dynamics, 6(1), 267–285, doi: 10.5194/esd-6-267-2015.
Glas, R., D. Burns, and L. Lautz, 2019: Historical changes in New York State streamflow: Attribution of temporal shifts and spatial patterns from 1961 to 2016. Journal of Hydrology, 574, 308–323, doi: 10.1016/j.jhydrol.2019.04.060.
Gleixner, S., T. Demissie, and G.T. Diro, 2020: Did ERA5 Improve Temperature and Precipitation Reanalysis over East Africa?Atmosphere, 11(9), 996, doi: 10.3390/atmos11090996.
Gobiet, A. et al., 2014: 21st century climate change in the European Alps – A review. Science of The Total Environment, 493, 1138–1151, doi: 10.1016/j.scitotenv.2013.07.050.
Gocic, M. and S. Trajkovic, 2014: Analysis of trends in reference evapotranspiration data in a humid climate. Hydrological Sciences Journal, 59(1), 165–180, doi: 10.1080/02626667.2013.798659.
González-Alemán, J.J. et al., 2019: Potential Increase in Hazard From Mediterranean Hurricane Activity With Global Warming. Geophysical Research Letters, 46(3), 1754–1764, doi: 10.1029/2018gl081253.
González-Hidalgo, J.C. et al., 2018: High-resolution spatio-temporal analyses of drought episodes in the western Mediterranean basin (Spanish mainland, Iberian Peninsula). Acta Geophysica, 66(3), 381–392, doi: 10.1007/s11600-018-0138-x.
Gosling, S.N. et al., 2017: A comparison of changes in river runoff from multiple global and catchment-scale hydrological models under global warming scenarios of 1°C, 2°C and 3°C. Climatic Change, 141(3), 577–595, doi: 10.1007/s10584-016-1773-3.
Gou, X. et al., 2015: Millennium tree-ring reconstruction of drought variability in the eastern Qilian Mountains, northwest China. Climate Dynamics, 45(7–8), 1761–1770, doi: 10.1007/s00382-014-2431-y.
Govekar, P.D., C. Jakob, and J. Catto, 2014: The relationship between clouds and dynamics in Southern Hemisphere extratropical cyclones in the real world and a climate model. Journal of Geophysical Research: Atmospheres, 119(11), 6609–6628, doi: 10.1002/2013jd020699.
Graham, R.M. et al., 2017: Increasing frequency and duration of Arctic winter warming events. Geophysical Research Letters, 44(13), 6974–6983, doi: 10.1002/2017gl073395.
Green, J.K. et al., 2019: Large influence of soil moisture on long-term terrestrial carbon uptake. Nature, 565(7740), 476–479, doi: 10.1038/s41586-018-0848-x.
Greenbaum, N. et al., 2014: A 2000 year natural record of magnitudes and frequencies for the largest Upper Colorado River floods near Moab, Utah. Water Resources Research, 50(6), 5249–5269, doi: 10.1002/2013wr014835.
Greve, P., M.L. Roderick, and S.I. Seneviratne, 2017: Simulated changes in aridity from the last glacial maximum to 4xCO2. Environmental Research Letters, 12(11), 114021, doi: 10.1088/1748-9326/aa89a3.
Greve, P., L. Gudmundsson, and S.I. Seneviratne, 2018: Regional scaling of annual mean precipitation and water availability with global temperature change. Earth System Dynamics, 9(1), 227–240, doi: 10.3929/et hz-b-000251688.
Greve, P., M.L. Roderick, A.M. Ukkola, and Y. Wada, 2019: The aridity Index under global warming. Environmental Research Letters, 14(12), 124006, doi: 10.1088/1748-9326/ab5046.
Greve, P. et al., 2014: Global assessment of trends in wetting and drying over land. Nature Geoscience, 7(10), 716–721, doi: 10.1038/ngeo2247.
Griffin, D. and K.J. Anchukaitis, 2014: How unusual is the 2012–2014 California drought?Geophysical Research Letters, 41(24), 9017–9023, doi: 10.1002/2014gl062433.
Grillakis, M.G. et al., 2016: Initial soil moisture effects on flash flood generation – A comparison between basins of contrasting hydro-climatic conditions. Journal of Hydrology, 541, 206–217, doi: 10.1016/j.jhydrol.2016.03.007.
Grinsted, A., P. Ditlevsen, and J.H. Christensen, 2019: Normalized US hurricane damage estimates using area of total destruction, 1900–2018. Proceedings of the National Academy of Sciences, 116(48), 23942–23946, doi: 10.1073/pnas.1912277116.
Grose, M.R. et al., 2018: Severe Frosts in Western Australia in September 2016. Bulletin of the American Meteorological Society, 99(1), S150–S154, doi: 10.1175/bams-d-17-0088.1.
Grose, M.R. et al., 2020: Insights From CMIP6 for Australia’s Future Climate. Earth’s Future, 8(5), e2019EF001469, doi: 10.1029/2019ef001469.
Gross, M.H., M.G. Donat, L. Alexander, and S.C. Sherwood, 2020: Amplified warming of seasonal cold extremes relative to the mean in the Northern Hemisphere extratropics. Earth System Dynamics, 11(1), 97–111, doi: 10.5194/esd-11-97-2020.
Grossiord, C. et al., 2020: Plant responses to rising vapor pressure deficit. New Phytologist, 226(6), 1550–1566, doi: 10. 1111/nph.16485.
Grotjahn, R. et al., 2016: North American extreme temperature events and related large scale meteorological patterns: a review of statistical methods, dynamics, modeling, and trends. Climate Dynamics, 46(3–4), 1151–1184, doi: 10.1007/s00382-015-2638-6.
Gu, G. and R.F. Adler, 2018: Precipitation Intensity Changes in the Tropics from Observations and Models. Journal of Climate, 31(12), 4775–4790, doi: 10.1175/jcli-d-17-0550.1.
Gu, L. et al., 2020: Projected increases in magnitude and socioeconomic exposure of global droughts in 1.5 and 2°C warmer climates. Hydrology and Earth System Sciences, 24(1), 451–472, doi: 10.5194/hess-24-451-2020.
Gu, X., J. Li, Y.D. Chen, D. Kong, and J. Liu, 2019a: Consistency and Discrepancy of Global Surface Soil Moisture Changes From Multiple Model-Based Data Sets Against Satellite Observations. Journal of Geophysical Research: Atmospheres, 124(3), 1474–1495, doi: 10.1029/2018jd029304.
Gu, X. et al., 2019b: Attribution of Global Soil Moisture Drying to Human Activities: A Quantitative Viewpoint. Geophysical Research Letters, 46(5), 2573–2582, doi: 10.1029/2018gl080768.
Gudmundsson, L. and S.I. Seneviratne, 2016: Anthropogenic climate change affects meteorological drought risk in Europe. Environmental Research Letters, 11(4), 044005, doi: 10.1088/1748-9326/11/4/044005.
Gudmundsson, L., S.I. Seneviratne, and X. Zhang, 2017: Anthropogenic climate change detected in European renewable freshwater resources. Nature Climate Change, 7(11), 813–816, doi: 10.1038/nclimate3416.
Gudmundsson, L., M. Leonard, H.X. Do, S. Westra, and S.I. Seneviratne, 2019: Observed Trends in Global Indicators of Mean and Extreme Streamflow. Geophysical Research Letters, 46(2), 756–766, doi: 10.1029/2018gl079725.
Gudmundsson, L. et al., 2021: Globally observed trends in mean and extreme river flow attributed to climate change. Science, 371(6534), 1159–1162, doi: 10.1126/science.aba3996.
Guerreiro, S.B., R.J. Dawson, C. Kilsby, E. Lewis, and A. Ford, 2018a: Future heat-waves, droughts and floods in 571 European cities. Environmental Research Letters, 13(3), 034009, doi: 10.1088/1748-9326/aaaad3.
Guerreiro, S.B. et al., 2018b: Detection of continental-scale intensification of hourly rainfall extremes. Nature Climate Change, 8(9), 803–807, doi: 10.1038/s41558-018-0245-3.
Guhathakurta, P., P. Menon, P.M. Inkane, U. Krishnan, and S.T. Sable, 2017: Trends and variability of meteorological drought over the districts of India using standardized precipitation index. Journal of Earth System Science, 126, 120, doi: 10.1007/s12040-017-0896-x.
Guichard, F. and F. Couvreux, 2017: A short review of numerical cloud-resolving models. Tellus A: Dynamic Meteorology and Oceanography, 69(1), 1373578, doi: 10.1080/16000870.2017.1373578.
Guillod, B.P., B. Orlowsky, D.G. Miralles, A.J. Teuling, and S.I. Seneviratne, 2015: Reconciling spatial and temporal soil moisture effects on afternoon rainfall. Nature Communications, 6(1), 6443, doi: 10.1038/ncomms7443.
Guimberteau, M. et al., 2013: Future changes in precipitation and impacts on extreme streamflow over Amazonian sub-basins. Environmental Research Letters, 8(1), 014035, doi: 10.1088/1748-9326/8/1/014035.
Guo, J., G. Huang, X. Wang, Y. Li, and Q. Lin, 2018: Dynamically-downscaled projections of changes in temperature extremes over China. Climate Dynamics, 50(3–4), 1045–1066, doi: 10.1007/s00382-017-3660-7.
Guo, X., J. Huang, Y. Luo, Z. Zhao, and Y. Xu, 2016: Projection of precipitation extremes for eight global warming targets by 17 CMIP5 models. Natural Hazards, 84(3), 2299–2319, doi: 10.1007/s11069-016-2553-0.
Guo, X., J. Huang, Y. Luo, Z. Zhao, and Y. Xu, 2017: Projection of heat waves over China for eight different global warming targets using 12 CMIP5 models. Theoretical and Applied Climatology, 128(3–4), 507–522, doi: 10.1007/s00704-015-1718-1.
Gusain, A., S. Ghosh, and S. Karmakar, 2020: Added value of CMIP6 over CMIP5 models in simulating Indian summer monsoon rainfall. Atmospheric Research, 232, 104680, doi: 10.1016/j.atmosres.2019.104680.
Gutmann, E.D. et al., 2018: Changes in Hurricanes from a 13-Yr Convection-Permitting Pseudo–Global Warming Simulation. Journal of Climate, 31(9), 3643–3657, doi: 10.1175/jcli-d-17-0391.1.
Haarsma, R.J. et al., 2016: High Resolution Model Intercomparison Project (HighResMIP v1.0) for CMIP6. Geoscientific Model Development, 9(11), 4185–4208, doi: 10.5194/gmd-9-4185-2016.
Habib, S.M.A., T. Sato, and D. Hatsuzuka, 2019: Decreasing number of propagating mesoscale convective systems in Bangladesh and surrounding area during 1998–2015. Atmospheric Science Letters, 20(2), e879, doi: 10.1002/asl.879.
Haig, J., J. Nott, and G.-J. Reichart, 2014: Australian tropical cyclone activity lower than at any time over the past 550–1,500 years. Nature, 505(7485), 667–671, doi: 10.1038/nature12882.
Hall, A. and X. Qu, 2006: Using the current seasonal cycle to constrain snow albedo feedback in future climate change. Geophysical Research Letters, 33(3), L03502, doi: 10.1029/2005gl025127.
Hall, J. et al., 2014: Understanding flood regime changes in Europe: A state-of-the-art assessment. Hydrology and Earth System Sciences, 18(7), 2735–2772, doi: 10.5194/hess-18-2735-2014.
Hall, T.C. et al., 2013: Future climate of the Caribbean from a super-high-resolution atmospheric general circulation model. Theoretical and Applied Climatology, 113(1–2), 271–287, doi: 10.1007/s00704-012-0779-7.
Hall, T.M. and J.P. Kossin, 2019: Hurricane stalling along the North American coast and implications for rainfall. npj Climate and Atmospheric Science, 2(1), 1–9, doi: 10.1038/s41612-019-0074-8.
Hamada, A. and Y.N. Takayabu, 2018: Large-Scale Environmental Conditions Related to Midsummer Extreme Rainfall Events around Japan in the TRMM Region. Journal of Climate, 31(17), 6933–6945, doi: 10.1175/jcli-d-17-0632.1.
Hamada, A., Y.N. Takayabu, C. Liu, and E.J. Zipser, 2015: Weak linkage between the heaviest rainfall and tallest storms. Nature Communications, 6, 1–6, doi: 10.1038/ncomms7213.
Han, F., K.H. Cook, and E.K. Vizy, 2019: Changes in intense rainfall events and dry periods across Africa in the twenty-first century. Climate Dynamics, 53(5–6), 2757–2777, doi: 10.1007/s00382-019-04653-z.
Han, J.-Y., J.-J. Baik, and A.P. Khain, 2011: A Numerical Study of Urban Aerosol Impacts on Clouds and Precipitation. Journal of the Atmospheric Sciences, 69(2), 504–520, doi: 10.1175/jas-d-11-071.1.
Han, T., H. Chen, X. Hao, and H. Wang, 2018: Projected changes in temperature and precipitation extremes over the Silk Road Economic Belt regions by the Coupled Model Intercomparison Project Phase 5 multi-model ensembles. International Journal of Climatology, 38(11), 4077–4091, doi: 10.1002/joc.5553.
Hande, L.B., S.T. Siems, and M.J. Manton, 2012: Observed Trends in Wind Speed over the Southern Ocean. Geophysical Research Letters, 39(11), 1–5, doi: 10.1029/2012gl051734.
Hanel, M. et al., 2018: Revisiting the recent European droughts from a long-term perspective. Scientific Reports, 8(1), 9499, doi: 10.1038/s41598-018-27464-4.
Hannaford, J., 2015: Climate-driven changes in UK river flows: A review of the evidence. Progress in Physical Geography: Earth and Environment, 39(1), 29–48, doi: 10.1177/0309133314536755.
Hao, Y. et al., 2019: Interactive Effect of Meteorological Drought and Vegetation Types on Root Zone Soil Moisture and Runoff in Rangeland Watersheds. Water, 11(11), 2357, doi: 10. 3390/w11112357.
Hao, Z., F. Hao, V.P. Singh, and X. Zhang, 2018: Changes in the severity of compound drought and hot extremes over global land areas. Environmental Research Letters, 13(12), 124022, doi: 10.1088/1748-9326/aaee96.
Hari, V., O. Rakovec, Y. Markonis, M. Hanel, and R. Kumar, 2020: Increased future occurrences of the exceptional 2018–2019 Central European drought under global warming. Scientific Reports, 10(1), 12207, doi: 10.1038/s41598-020-68872-9.
Harrigan, S., J. Hannaford, K. Muchan, and T.J. Marsh, 2018: Designation and trend analysis of the updated UK Benchmark Network of river flow stations: The UKBN2 dataset. Hydrology Research, 49(2), 552–567, doi: 10.2166/nh.2017.058.
Harrington, L.J., 2017: Investigating differences between event-as-class and probability density-based attribution statements with emerging climate change. Climatic Change, 141(4), 641–654, doi: 10.1007/s10584-017-1906-3.
Harrington, L.J., 2020: Rethinking extreme heat in a cool climate: a New Zealand case study. Environmental Research Letters, 16, 034030, doi: 10.1088/1748-9326/abbd61.
Harrington, L.J. and J. Renwick, 2014: Secular changes in New Zealand rainfall characteristics 1950–2009. Weather and Climate, 34, 50, doi: 10.2307/26169744.
Harrington, L.J. and F.E.L. Otto, 2018a: Adapting attribution science to the climate extremes of tomorrow. Environmental Research Letters, 13(12), 123006, doi: 10.1088/1748-9326/aaf4cc.
Harrington, L.J. and F.E.L. Otto, 2018b: Changing population dynamics and uneven temperature emergence combine to exacerbate regional exposure to heat extremes under 1.5°C and 2°C of warming. Environmental Research Letters, 13(3), 034011, doi: 10.1088/1748-9326/aaaa99.
Harrington, L.J., S. Rosier, S.M. Dean, S. Stuart, and A. Scahill, 2014: The Role of Anthropogenic Climate Change in the 2013 Drought Over North Island, New Zealand [in “Explaining Extreme Events of 2013 from a Climate Perspective”]. Bulletin of the American Meteorological Society, 95(9), S45–S48, doi: 10.1175/1520-0477-95.9.s1.1.
Harrington, L.J. et al., 2016: Investigating event-specific drought attribution using self-organizing maps. Journal of Geophysical Research: Atmospheres, 121(21), 12766–12780, doi: 10.1002/2016jd025602.
Harris, L.M., S.J. Lin, and C.Y. Tu, 2016: High-resolution climate simulations using GFDL HiRAM with a stretched global grid. Journal of Climate, 29(11), 4293–4314, doi: 10.1175/jcli-d-15-0389.1.
Harrison, L., C. Funk, and P. Peterson, 2019: Identifying changing precipitation extremes in Sub-Saharan Africa with gauge and satellite products. Environmental Research Letters, 14(8), 085007, doi: 10.1088/1748-9326/ab2cae.
Hartmann, D.J. et al., 2013: Observations: Atmosphere and Surface. In: Climate Change 2013: The Physical Science Basis. Contribution of Working Group I to the Fifth Assessment Report of the Intergovernmental Panel on Climate Change[Stocker, T.F., D. Qin, G.-K. Plattner, M. Tignor, S.K. Allen, J. Boschung, A. Nauels, Y. Xia, V. Bex, and P.M. Midgley (eds.)]. Cambridge University Press, Cambridge, United Kingdom and New York, NY, USA, pp. 159–254, doi: 10.1017/cbo9781107415324.008.
Hartmann, F., J. Merten, M. Fink, and H. Faust, 2018: Indonesia’s Fire Crisis 2015 A Twofold Perturbation on the Ground. Pacific Geographies, 49, 4–11, doi: 10.23791/490411.
Hartmann, H., 2015: Carbon starvation during drought-induced tree mortality – are we chasing a myth?Journal of Plant Hydraulics, 2, e005, doi: 10.20870/jph.2015.e005.
Hartzell, S., M.S. Bartlett, and A. Porporato, 2017: The role of plant water storage and hydraulic strategies in relation to soil moisture availability. Plant and Soil, 419(1–2), 503–521, doi: 10.1007/s11104-017-3341-7.
Hasan, H.H., S.F. Mohd Razali, N.S. Muhammad, and A. Ahmad, 2019: Research Trends of Hydrological Drought: A Systematic Review. Water, 11(11), doi: 10. 3390/w11112252.
Hashimoto, A., J.M. Done, L.D. Fowler, and C.L. Bruyère, 2016: Tropical cyclone activity in nested regional and global grid-refined simulations. Climate Dynamics, 47(1), 497–508, doi: 10.1007/s00382-015-2852-2.
Haslinger, K. et al., 2019: Disentangling Drivers of Meteorological Droughts in the European Greater Alpine Region During the Last Two Centuries. Journal of Geophysical Research: Atmospheres, 124(23), 12404–12425, doi: 10.1029/2018jd029527.
Hassanzadeh, P. et al., 2020: Effects of climate change on the movement of future landfalling Texas tropical cyclones. Nature Communications, 11(1), 3319, doi: 10.1038/s41467-020-17130-7.
Hatsuzuka, D. and T. Sato, 2019: Future Changes in Monthly Extreme Precipitation in Japan Using Large-Ensemble Regional Climate Simulations. Journal of Hydrometeorology, 20(3), 563–574, doi: 10.1175/jhm-d-18-0095.1.
Hatsuzuka, D., T. Sato, K. Yoshida, M. Ishii, and R. Mizuta, 2020: Regional Projection of Tropical-Cyclone-Induced Extreme Precipitation around Japan Based on Large Ensemble Simulations. SOLA, 16, 23–29, doi: 10.2151/sola.2020-005.
Hauser, M., 2021: Mean temperature anomalies for CMIP5 and CMIP6 (Version v0.1.0). Zenodo. Retrieved from: https://zenodo.org/record/4600696.
Hauser, M., R. Orth, and S.I. Seneviratne, 2016: Role of soil moisture versus recent climate change for the 2010 heat wave in western Russia. Geophysical Research Letters, 43(6), 2819–2826, doi: 10.1002/2016gl068036.
Hauser, M., F. Engelbrecht, and E.M. Fischer, 2021: Transient global warming levels for CMIP5 and CMIP6 (Version v0.2.0). Zenodo. Retrieved from: https://zenodo.org/record/4600706.
Hauser, M. et al., 2017: Methods and Model Dependency of Extreme Event Attribution: The 2015 European Drought. Earth’s Future, 5(10), 1034–1043, doi: 10.1002/2017ef000612.
Hawcroft, M., E. Walsh, K. Hodges, and G. Zappa, 2018: Significantly increased extreme precipitation expected in Europe and North America from extratropical cyclones. Environmental Research Letters, 13(12), 124006, doi: 10.1088/1748-9326/aaed59.
Hayat, F., M.A. Ahmed, M. Zarebanadkouki, G. Cai, and A. Carminati, 2019: Measurements and simulation of leaf xylem water potential and root water uptake in heterogeneous soil water contents. Advances in Water Resources, 124, 96–105, doi: 10.1016/j.advwatres.2018.12.009.
Hazeleger, W. et al., 2015: Tales of future weather. Nature Climate Change, 5(2), 107–113, doi: 10.1038/nclimate2450.
He, B.-R. and P.-M. Zhai, 2018: Changes in persistent and non-persistent extreme precipitation in China from 1961 to 2016. Advances in Climate Change Research, 9(3), 177–184, doi: 10.1016/j.accre.2018.08.002.
He, F. and D.J. Posselt, 2015: Impact of Parameterized Physical Processes on Simulated Tropical Cyclone Characteristics in the Community Atmosphere Model. Journal of Climate, 28(24), 9857–9872, doi: 10.1175/jcli-d-15-0255.1.
He, X., Y. Wada, N. Wanders, and J. Sheffield, 2017: Intensification of hydrological drought in California by human water management. Geophysical Research Letters, 44(4), 1777–1785, doi: 10.1002/2016gl071665.
Helama, S., K. Sohar, A. Läänelaid, S. Bijak, and J. Jaagus, 2018: Reconstruction of precipitation variability in Estonia since the eighteenth century, inferred from oak and spruce tree rings. Climate Dynamics, 50(11), 4083–4101, doi: 10.1007/s00382-017-3862-z.
Held, I.M. and B.J. Soden, 2006: Robust responses of the hydrological cycle to global warming. Journal of Climate, 19(21), 5686–5699, doi: 10.1175/jcli3990.1.
Held, I.M. and M. Zhao, 2011: The Response of Tropical Cyclone Statistics to an Increase in CO2 with Fixed Sea Surface Temperatures. Journal of Climate, 24(20), 5353–5364, doi: 10.1175/jcli-d-11-00050.1.
Helsen, S. et al., 2020: Consistent scale-dependency of future increases in hourly extreme precipitation in two convection-permitting climate models. Climate Dynamics, 54(3), 1267–1280, doi: 10.1007/s00382-019-05056-w.
Herger, N., B.M. Sanderson, and R. Knutti, 2015: Improved pattern scaling approaches for the use in climate impact studies. Geophysical Research Letters, 42(9), 3486–3494, doi: 10.1002/2015gl063569.
Herger, N. et al., 2018: Calibrating Climate Model Ensembles for Assessing Extremes in a Changing Climate. Journal of Geophysical Research: Atmospheres, 123(11), 5988–6004, doi: 10.1029/2018jd028549.
Herold, N., M. Ekström, J. Kala, J. Goldie, and J.P. Evans, 2018: Australian climate extremes in the 21st century according to a regional climate model ensemble: Implications for health and agriculture. Weather and Climate Extremes, 20, 54–68, doi: 10.1016/j.wace.2018.01.001.
Herrera-Estrada, J.E. and J. Sheffield, 2017: Uncertainties in future projections of summer droughts and heat waves over the contiguous United States. Journal of Climate, 30(16), 6225–6246, doi: 10.1175/jcli-d-16-0491.1.
Herrera-Estrada, J.E., Y. Satoh, and J. Sheffield, 2017: Spatiotemporal dynamics of global drought. Geophysical Research Letters, 44(5), 2254–2263, doi: 10.1002/2016gl071768.
Herrera-Estrada, J.E. et al., 2019: Reduced Moisture Transport Linked to Drought Propagation Across North America. Geophysical Research Letters, 46(10), 5243–5253, doi: 10.1029/2019gl082475.
Herring, S.C., M.P. Hoerling, T.C. Peterson, and P. Stott, 2014: Explaining Extreme Events of 2013 from a Climate Perspective. Bulletin of the American Meteorological Society, 95(9), S1–S104, doi: 10.1175/1520-0477-95.9.s1.1.
Herring, S.C., M.P. Hoerling, J.P. Kossin, T.C. Peterson, and P.A. Stott, 2015: Explaining Extreme Events of 2014 from a Climate Perspective. Bulletin of the American Meteorological Society, 96(12), S1–S172, doi: 10.1175/bams-explainingextremeevents2014.1.
Herring, S.C., N. Christidis, A. Hoell, M.P. Hoerling, and P.A. Stott, 2019: Explaining Extreme Events of 2017 from a Climate Perspective. Bulletin of the American Meteorological Society, 100(1), S1–S117, doi: 10.1175/bams-explainingextremeevents2017.1.
Herring, S.C., N. Christidis, A. Hoell, M.P. Hoerling, and P.A. Stott, 2020: Explaining Extreme Events of 2018 from a Climate Perspective. Bulletin of the American Meteorological Society, 101(1), S1–S140, doi: 10.1175/bams-explainingextremeevents2018.1.
Herring, S.C. et al., 2016: Explaining Extreme Events of 2015 from a Climate Perspective. Bulletin of the American Meteorological Society, 97(12), S1–S145, doi: 10.1175/bams-explainingextremeevents2015.1.
Herring, S.C. et al., 2018: Explaining Extreme Events of 2016 from a Climate Perspective. Bulletin of the American Meteorological Society, 99(1), S1–S157, doi: 10.1175/bams-explainingextremeevents2016.1.
Hersbach, H. et al., 2020: The ERA5 global reanalysis. Quarterly Journal of the Royal Meteorological Society, 146(730), 1999–2049, doi: 10.1002/qj.3803.
Hertig, E. and Y. Tramblay, 2017: Regional downscaling of Mediterranean droughts under past and future climatic conditions. Global and Planetary Change, 151, 36–48, doi: 10.1016/j.gloplacha.2016.10.015.
Hettiarachchi, S., C. Wasko, and A. Sharma, 2018: Increase in flood risk resulting from climate change in a developed urban watershed – The role of storm temporal patterns. Hydrology and Earth System Sciences, 22(3), 2041–2056, doi: 10.5194/hess-22-2041-2018.
Hidalgo, H.G., E.J. Alfaro, and B. Quesada-Montano, 2017: Observed (1970–1999) climate variability in Central America using a high-resolution meteorological dataset with implication to climate change studies. Climatic Change, 141(1), 13–28, doi: 10.1007/s10584-016-1786-y.
Hillier, J.K., T. Matthews, R.L. Wilby, and C. Murphy, 2020: Multi-hazard dependencies can increase or decrease risk. Nature Climate Change, 10(7), 595–598, doi: 10.1038/s41558-020-0832-y.
Hirabayashi, Y. et al., 2013: Global flood risk under climate change. Nature Climate Change, 3(9), 816–821, doi: 10.1038/nclimate1911.
Hirsch, A.L., M. Wilhelm, E.L. Davin, W. Thiery, and S.I. Seneviratne, 2017: Can climate-effective land management reduce regional warming?Journal of Geophysical Research: Atmospheres, 122(4), 2269–2288, doi: 10.1002/2016jd026125.
Hirsch, A.L. et al., 2018: Biogeophysical Impacts of Land-Use Change on Climate Extremes in Low-Emission Scenarios: Results From HAPPI-Land. Earth’s Future, 6(3), 396–409, doi: 10.1002/2017ef000744.
Hirsch, A.L. et al., 2019: Amplification of Australian Heatwaves via Local Land-Atmosphere Coupling. Journal of Geophysical Research: Atmospheres, 124(24), 13625–13647, doi: 10.1029/2019jd030665.
Hobbins, M., D. McEvoy, and C. Hain, 2017: Evapotranspiration, Evaporative Demand, and Drought. In: Drought and Water Crises: Integrating Science, Management, and Policy (2nd Edition)[Wilhite, D.A. and R.S. Pulwarty (eds.)]. CRC Press, Boca Raton, FL, USA, pp. 259–287, doi: 10.1201/b22009.
Hobbins, M., A. Wood, D. Streubel, and K. Werner, 2012: What drives the variability of evaporative demand across the conterminous United States?Journal of Hydrometeorology, 13(4), 1195–1214, doi: 10.1175/jhm-d-11-0101.1.
Hobbins, M.T. et al., 2016: The evaporative demand drought index. Part I: Linking drought evolution to variations in evaporative demand. Journal of Hydrometeorology, 17(6), 1745–1761, doi: 10.1175/jhm-d-15-0121.1.
Hodgkins, G.A. et al., 2017: Climate-driven variability in the occurrence of major floods across North America and Europe. Journal of Hydrology, 552, 704–717, doi: 10.1016/j.jhydrol.2017.07.027.
Hodnebrog, Ø. et al., 2019: Intensification of summer precipitation with shorter time-scales in Europe. Environmental Research Letters, 14(12), 124050, doi: 10.1088/1748-9326/ab549c.
Hoegh-Guldberg, O. et al., 2018: Impacts of 1.5°C Global Warming on Natural and Human Systems. In: Global Warming of 1.5°C. An IPCC Special Report on the impacts of global warming of 1.5°C abovepre-industriallevels and related global greenhouse gas emission pathways, in the context of strengthening the global response to the threat of climate change, sustainable development, and efforts to eradicate poverty[Masson-Delmotte, V., P. Zhai, H.O. Pörtner, D. Roberts, J. Skea, P.R. Shukla, A. Pirani, W. Moufouma-Okia, C. Péan, R. Pidcock, S. Connors, J.B.R. Matthews, Y. Chen, X. Zhou, M.I. Gomis, E. Lonnoy, T. Maycock, M. Tignor, and T. Waterfield (eds.)]. In Press, pp. 175–312, www.ipcc.ch/sr15/chapter/chapter-3.
Hoerling, M. et al., 2012: On the Increased Frequency of Mediterranean Drought. Journal of Climate, 25(6), 2146–2161, doi: 10.1175/jcli-d-11-00296.1.
Hoerling, M. et al., 2013: Anatomy of an extreme event. Journal of Climate, 26(9), 2811–2832, doi: 10.1175/jcli-d-12-00270.1.
Hoerling, M. et al., 2014: Causes and Predictability of the 2012 Great Plains Drought. Bulletin of the American Meteorological Society, 95(2), 269–282, doi: 10.1175/bams-d-13-00055.1.
Hoerling, M. et al., 2016: Characterizing Recent Trends in U.S. Heavy Precipitation. Journal of Climate, 29(7), 2313–2332, doi: 10.1175/jcli-d-15-0441.1.
Hogeboom, R.J., L. Knook, and A.Y. Hoekstra, 2018: The blue water footprint of the world’s artificial reservoirs for hydroelectricity, irrigation, residential and industrial water supply, flood protection, fishing and recreation. Advances in Water Resources, 113, 285–294, doi: 10.1016/j.advwatres.2018.01.028.
Holland, G. and C.L. Bruyère, 2014: Recent intense hurricane response to global climate change. Climate Dynamics, 42(3–4), 617–627, doi: 10.1007/s00382-013-1713-0.
Holloway, C.E. et al., 2017: Observing Convective Aggregation. Surveys in Geophysics, 38(6), 1199–1236, doi: 10.1007/s10712-017-9419-1.
Holmes, C.R., T. Woollings, E. Hawkins, and H. de Vries, 2015: Robust Future Changes in Temperature Variability under Greenhouse Gas Forcing and the Relationship with Thermal Advection. Journal of Climate, 29(6), 2221–2236, doi: 10.1175/jcli-d-14-00735.1.
Hong, C.-C., M.-Y. Lee, H.-H. Hsu, and W.-L. Tseng, 2018: Distinct Influences of the ENSO-Like and PMM-Like SST Anomalies on the Mean TC Genesis Location in the Western North Pacific: The 2015 Summer as an Extreme Example. Journal of Climate, 31(8), 3049–3059, doi: 10.1175/jcli-d-17-0504.1.
Hoogewind, K.A., M.E. Baldwin, and R.J. Trapp, 2017: The Impact of Climate Change on Hazardous Convective Weather in the United States: Insight from High-Resolution Dynamical Downscaling. Journal of Climate, 30(24), 10081–10100, doi: 10.1175/jcli-d-16-0885.1.
Hoogewind, K.A., D.R. Chavas, B.A. Schenkel, and M.E. O’Neill, 2020: Exploring Controls on Tropical Cyclone Count through the Geography of Environmental Favorability. Journal of Climate, 33(5), 1725–1745, doi: 10.1175/jcli-d-18-0862.1.
Hope, P., E.-P. Lim, G. Wang, H.H. Hendon, and J.M. Arblaster, 2015: Contributors to the Record High Temperatures Across Australia in Late Spring 2014. Bulletin of the American Meteorological Society, 96(12), S149–S153, doi: 10.1175/bams-d-15-00096.1.
Hope, P., G. Wang, E.-P. Lim, H.H. Hendon, and J.M. Arblaster, 2016: What caused the record-breaking heat across Australia in October 2015? [in “Explaining Extreme Events of 2015 from a Climate Perspective”]. Bulletin of the American Meteorological Society, 97(12), S122–S126, doi: 10.1175/bams-explainingextremeevents2015.1.
Hope, P. et al., 2019: On Determining the Impact of Increasing Atmospheric CO2 on the Record Fire Weather in Eastern Australia in February 2017. Bulletin of the American Meteorological Society, 100(1), S111–S117, doi: 10.1175/bams-d-18-0135.1.
Horton, D.E. et al., 2015: Contribution of changes in atmospheric circulation patterns to extreme temperature trends. Nature, 522(7557), 465–469, doi: 10.1038/nature14550.
Hou, A.Y. et al., 2014: The Global Precipitation Measurement Mission. Bulletin of the American Meteorological Society, 95(5), 701–722, doi: 10.1175/bams-d-13-00164.1.
Howarth, M.E., C.D. Thorncroft, and L.F. Bosart, 2019: Changes in Extreme Precipitation in the Northeast United States: 1979–2014. Journal of Hydrometeorology, 20(4), 673–689, doi: 10.1175/jhm-d-18-0155.1.
Hsu, W.-C., C.M. Patricola, and P. Chang, 2019: The impact of climate model sea surface temperature biases on tropical cyclone simulations. Climate Dynamics, 53(1), 173–192, doi: 10.1007/s00382-018-4577-5.
Hu, T., Y. Sun, X. Zhang, S.-K. Min, and Y.-H. Kim, 2020: Human influence on frequency of temperature extremes. Environmental Research Letters, 15(6), 064014, doi: 10.1088/1748-9326/ab8497.
Hu, Z. et al., 2016: Climate changes in temperature and precipitation extremes in an alpine grassland of Central Asia. Theoretical and Applied Climatology, 126(3–4), 519–531, doi: 10.1007/s00704-015-1568-x.
Hua, W. et al., 2016: Possible causes of the Central Equatorial African long-term drought. Environmental Research Letters, 11(12), 124002, doi: 10.1088/1748-9326/11/12/124002.
Huang, H., J.M. Winter, E.C. Osterberg, R.M. Horton, and B. Beckage, 2017: Total and Extreme Precipitation Changes over the Northeastern United States. Journal of Hydrometeorology, 18(6), 1783–1798, doi: 10.1175/jhm-d-16-0195.1.
Huang, J. et al., 2018: Analysis of future drought characteristics in China using the regional climate model CCLM. Climate Dynamics, 50(1–2), 507–525, doi: 10.1007/s00382-017-3623-z.
Huang, S. et al., 2017a: Evaluation of an ensemble of regional hydrological models in 12 large-scale river basins worldwide. Climatic Change, 141(3), 381–397, doi: 10.1007/s10584-016-1841-8.
Huang, S. et al., 2017b: The propagation from meteorological to hydrological drought and its potential influence factors. Journal of Hydrology, 547, 184–195, doi: 10.1016/j.jhydrol.2017.01.041.
Huang, S. et al., 2018: Multimodel assessment of flood characteristics in four large river basins at global warming of 1.5, 2.0 and 3.0 K above the pre-industrial level. Environmental Research Letters, 13(12), 124005, doi: 10.1088/1748-9326/aae94b.
Huerta, A. and W. Lavado-Casimiro, 2021: Trends and variability of precipitation extremes in the Peruvian Altiplano (1971–2013). International Journal of Climatology, 41(1), 513–528, doi: 10.1002/joc.6635.
Hui, P. et al., 2018: Climate change projections over China using regional climate models forced by two CMIP5 global models. Part I: evaluation of historical simulations. International Journal of Climatology, 38, e57–e77, doi: 10.1002/joc.5351.
Huijnen, V. et al., 2016: Fire carbon emissions over maritime southeast Asia in 2015 largest since 1997. Scientific Reports, 6, 1–8, doi: 10. 1038/srep26886.
Humphrey, V. et al., 2018: Sensitivity of atmospheric CO2 growth rate to observed changes in terrestrial water storage. Nature, 560(7720), 628–631, doi: 10.1038/s41586-018-0424-4.
Hundecha, Y. et al., 2016: Inter-comparison of statistical downscaling methods for projection of extreme flow indices across Europe. Journal of Hydrology, 541, 1273–1286, doi: 10.1016/j.jhydrol.2016.08.033.
Huning, L.S. and A. AghaKouchak, 2020: Global snow drought hot spots and characteristics. Proceedings of the National Academy of Sciences, 117(33), 19753–19759, doi: 10.1073/pnas.1915921117.
Hunt, E.D. et al., 2014: Monitoring the effects of rapid onset of drought on non-irrigated maize with agronomic data and climate-based drought indices. Agricultural and Forest Meteorology, 191, 1–11, doi: 10.1016/j.agrformet.2014.02.001.
Hunt, K.M.R., A.G. Turner, and L.C. Shaffrey, 2018: Extreme Daily Rainfall in Pakistan and North India: Scale Interactions, Mechanisms, and Precursors. Monthly Weather Review, 146(4), 1005–1022, doi: 10.1175/m wr-d-17-0258.1.
Hussain, M.S. and S. Lee, 2013: The regional and the seasonal variability of extreme precipitation trends in Pakistan. Asia-Pacific Journal of Atmospheric Sciences, 49(4), 421–441, doi: 10.1007/s13143-013-0039-5.
Imada, Y., M. Watanabe, H. Kawase, H. Shiogama, and M. Arai, 2019: The July 2018 High Temperature Event in Japan Could Not Have Happened without Human-Induced Global Warming. SOLA, 15A, 8–12, doi: 10.2151/sola.15a-002.
Imada, Y. et al., 2013: Contribution of Atmospheric Circulation Change to the 2012 Heavy Rainfall in Southwestern Japan [in “Explaining Extreme Events of 2012 from a Climate Perspective”]. Bulletin of the American Meteorological Society, 94(9), S52–S54, doi: 10.1175/bams-d-13-00085.1.
Imada, Y. et al., 2014: The Contribution of anthropogenic forcing to the Japanese heat waves of 2013 [in “Explaining Extreme Events of 2013 from a Climate Perspective”]. Bulletin of the American Meteorological Society, 95(9), S52–S54, doi: 10.1175/1520-0477-95.9.s1.1.
Imada, Y. et al., 2017: Recent enhanced seasonal temperature contrast in Japan from large ensemble high-resolution climate simulations. Atmosphere, 8(3), 57, doi: 10.3390/atmos8030057.
Imada, Y. et al., 2018: Climate Change Increased the Likelihood of the 2016 Heat Extremes in Asia [in “Explaining Extreme Events of 2016 from a Climate Perspective”]. Bulletin of the American Meteorological Society, 99(1), S97–S101, doi: 10.1175/bams-d-17-0109.1.
Imada, Y. et al., 2020: Advanced risk-based event attribution for heavy regional rainfall events. npj Climate and Atmospheric Science, 3(1), 37, doi: 10.1038/s41612-020-00141-y.
Imbach, P. et al., 2018: Future climate change scenarios in Central America at high spatial resolution. PLOS ONE, 13(4), e0193570, doi: 10.1371/journal.pone.0193570.
INMET, 2017: Situação da Seca Observada nas Regiões Norte e Nordeste do Brasil em 2016. Instituto Nacional de Meteorologia (INMET), Brasília, Brazil, 8 pp., https://portal.inmet.gov.br/uploads/notastecnicas/trabalho_tecnico_02-2017.pdf .
Innocenti, S., A. Mailhot, M. Leduc, A.J. Cannon, and A. Frigon, 2019: Projected Changes in the Probability Distributions, Seasonality, and Spatiotemporal Scaling of Daily and Subdaily Extreme Precipitation Simulated by a 50-Member Ensemble Over Northeastern North America. Journal of Geophysical Research: Atmospheres, 124(19), 10427–10449, doi: 10.1029/2019jd031210.
IPCC, 2012: Managing the Risks of Extreme Events and Disasters to Advance Climate Change Adaptation. A Special Report of Working Groups I and II of the Intergovernmental Panel on Climate Change [Field, C.B. et al., (eds.)]. Cambridge University Press, Cambridge, United Kingdom and New York, NY, USA, 582 pp., www.ipcc.ch/report/managing-the-risks-of-extreme-events-and-disasters-to-advance-climate-change-adaptation.
IPCC, 2013: Climate Change 2013: The Physical Science Basis. Contribution of Working Group I to the Fifth Assessment Report of the Intergovernmental Panel on Climate Change [Stocker, T.F. et al., (eds.)]. Cambridge University Press, Cambridge, United Kingdom and New York, NY, USA, 1535 pp., doi: 10.1017/cbo9781107415324.
IPCC, 2014: Climate Change 2014: Impacts, Adaptation, and Vulnerability. Part A: Global and Sectoral Aspects. Contribution of Working Group II to the Fifth Assessment Report of the Intergovernmental Panel on Climate Change [Field, C.B. et al., (eds.)]. Cambridge University Press, Cambridge, United Kingdom and New York, NY, USA,, 1132 pp., www.ipcc.ch/report/ar5/wg2.
IPCC, 2018: Summary for Policymakers. In: Global Warming of 1.5°C. An IPCC Special Report on the impacts of global warming of 1.5°C abovepre-industriallevels and related global greenhouse gas emission pathways, in the context of strengthening the global response to the threat of climate change, sustainable development, and efforts to eradicate poverty[Masson-Delmotte, V., P. Zhai, H.-O. Pörtner, D. Roberts, J. Skea, P.R. Shukla, A. Pirani, W. Moufouma-Okia, C. Péan, R. Pidcock, S. Connors, J.B.R. Matthews, Y. Chen, X. Zhou, M.I. Gomis, E. Lonnoy, T. Maycock, M. Tignor, and T. Waterfield (eds.)]. In Press, 32 pp., www.ipcc.ch/sr15/chapter/spm.
IPCC, 2019a: Climate Change and Land: an IPCC special report on climate change, desertification, land degradation, sustainable land management, food security, and greenhouse gas fluxes in terrestrial ecosystems [Shukla, P.R., J. Skea, E.C. Buendia, V. Masson-Delmotte, H.-O. Pörtner, D.C. Roberts, P. Zhai, R. Slade, S. Connors, R. Diemen, M. Ferrat, E. Haughey, S. Luz, S. Neogi, M. Pathak, J. Petzold, J.P. Pereira, P. Vyas, E. Huntley, K. Kissick, M. Belkacemi, and J. Malley (eds.)]. In Press, 896 pp., www.ipcc.ch/srccl.
IPCC, 2019b: IPCC Special Report on the Ocean and Cryosphere in a Changing Climate [Pörtner, H.-O., D.C. Roberts, V. Masson-Delmotte, P. Zhai, M. Tignor, E. Poloczanska, K. Mintenbeck, A. Alegría, M. Nicolai, A. Okem, J. Petzold, B. Rama, and N.M. Weyer (eds.)]. In Press, 755 pp., www.ipcc.ch/srocc.
Irannezhad, M., D. Chen, B. Kløve, and H. Moradkhani, 2017: Analysing the variability and trends of precipitation extremes in Finland and their connection to atmospheric circulation patterns. International Journal of Climatology, 37, 1053–1066, doi: 10.1002/joc.5059.
Ishak, E.H., A. Rahman, S. Westra, A. Sharma, and G. Kuczera, 2013: Evaluating the non-stationarity of Australian annual maximum flood. Journal of Hydrology, 494, 134–145, doi: 10.1016/j.jhydrol.2013.04.021.
Ivancic, T.J. and S.B. Shaw, 2015: Examining why trends in very heavy precipitation should not be mistaken for trends in very high river discharge. Climatic Change, 133(4), 681–693, doi: 10.1007/s10584-015-1476-1.
Jacob, D. et al., 2018: Climate Impacts in Europe Under +1.5°C Global Warming. Earth’s Future, 6(2), 264–285, doi: 10.1002/2017ef000710.
Jacob, D. et al., 2020: Regional climate downscaling over Europe: perspectives from the EURO-CORDEX community. Regional Environmental Change, 20(2), 51, doi: 10.1007/s10113-020-01606-9.
Jakob, D. and D. Walland, 2016: Variability and long-term change in Australian temperature and precipitation extremes. Weather and Climate Extremes, 14, 36–55, doi: 10.1016/j.wace.2016.11.001.
James, R., R. Washington, C.-F. Schleussner, J. Rogelj, and D. Conway, 2017: Characterizing half-a-degree difference: a review of methods for identifying regional climate responses to global warming targets. WIREs Climate Change, 8(2), e457, doi: 10.1002/wcc.457.
Jehanzaib, M., S.A. Shah, J. Yoo, and T.-W. Kim, 2020: Investigating the impacts of climate change and human activities on hydrological drought using non-stationary approaches. Journal of Hydrology, 588, 125052, doi: 10.1016/j.jhydrol.2020.125052.
Jeon, S., C.J. Paciorek, and M.F. Wehner, 2016: Quantile-based bias correction and uncertainty quantification of extreme event attribution statements. Weather and Climate Extremes, 12, 24–32, doi: 10.1016/j.wace.2016.02.001.
Jeong, J.-H., J. Fan, C.R. Homeyer, and Z. Hou, 2020: Understanding Hailstone Temporal Variability and Contributing Factors over the U.S. Southern Great Plains. Journal of Climate, 33(10), 3947–3966, doi: 10.1175/jcli-d-19-0606.1.
Jeong, S.-J. et al., 2014: Effects of double cropping on summer climate of the North China Plain and neighbouring regions. Nature Climate Change, 4(7), 615–619, doi: 10.1038/nclimate2266.
Jézéquel, A. et al., 2018: Behind the veil of extreme event attribution. Climatic Change, 149(3–4), 367–383, doi: 10.1007/s10584-018-2252-9.
Jhajharia, D. et al., 2015: Reference evapotranspiration under changing climate over the Thar Desert in India. Meteorological Applications, 22(3), 425–435, doi: 10.1002/met.1471.
Ji, P. et al., 2020: Anthropogenic Contributions to the 2018 Extreme Flooding over the Upper Yellow River Basin in China. Bulletin of the American Meteorological Society, 101(1), S89–S94, doi: 10.1175/bams-d-19-0105.1.
Ji, Z. and S. Kang, 2015: Evaluation of extreme climate events using a regional climate model for China. International Journal of Climatology, 35(6), 888–902, doi: 10.1002/joc.4024.
Jia, B., J. Liu, Z. Xie, and C. Shi, 2018: Interannual Variations and Trends in Remotely Sensed and Modeled Soil Moisture in China. Journal of Hydrometeorology, 19(5), 831–847, doi: 10.1175/jhm-d-18-0003.1.
Jia, G. et al., 2019: Land–climate interactions. In: Climate Change and Land: an IPCC special report on climate change, desertification, land degradation, sustainable land management, food security, and greenhouse gas fluxes in terrestrial ecosystems[P.R. Shukla, J. Skea, E. Calvo Buendia, V. Masson-Delmotte, H.-O. Pörtner, D.C. Roberts, P. Zhai, R. Slade, S. Connors, R. Diemen, M. Ferrat, E. Haughey, S. Luz, S. Neogi, M. Pathak, J. Petzold, J.P. Pereira, P. Vyas, E. Huntley, K. Kissick, M. Belkacemi, and J. Malley (eds.)]. In press, pp. 131–248, www.ipcc.ch/srccl/chapter/chapter-2.
Jiang, F.-Q., R.-J. Hu, S.-P. Wang, Y.-W. Zhang, and L. Tong, 2013: Trends of precipitation extremes during 1960–2008 in Xinjiang, the Northwest China. Theoretical and Applied Climatology, 111(1), 133–148, doi: 10.1007/s00704-012-0657-3.
Jimenez Cisneros, B.E. et al., 2014: Freshwater resources. In: Climate Change 2014: Impacts, Adaptation, and Vulnerability. Part A: Global and Sectoral Aspects. Contribution of Working Group II to the Fifth Assessment Report of the Intergovernmental Panel on Climate Change[Field, C.B., V.R. Barros, D.J. Dokken, K.J. Mach, M.D. Mastrandrea, T.E. Bilir, M. Chatterjee, K.L. Ebi, Y.O. Estrada, R.C. Genova, B. Girma, E.S. Kissel, A.N. Levy, S. MacCracken, P.R. Mastrandrea, and L.L. White (eds.)]. Cambridge University Press, Cambridge, United Kingdom and New York, NY, USA, pp. 229–269, www.ipcc.ch/report/ar5/wg2.
Jiménez-Muñoz, J.C. et al., 2016: Record-breaking warming and extreme drought in the Amazon rainforest during the course of El Niño 2015–2016. Scientific Reports, 6(1), 33130, doi: 10. 1038/srep33130.
Johnson, N.C., S.P. Xie, Y. Kosaka, and X. Li, 2018: Increasing occurrence of cold and warm extremes during the recent global warming slowdown. Nature Communications, 9(1), 4–6, doi: 10.1038/s41467-018-04040-y.
Jolly, W.M. et al., 2015: Climate-induced variations in global wildfire danger from 1979 to 2013. Nature Communications, 6(1), 7537, doi: 10.1038/ncomms8537.
Junk, J., K. Goergen, and A. Krein, 2019: Future Heat Waves in Different European Capitals Based on Climate Change Indicators. International Journal of Environmental Research and Public Health, 16(20), 3959, doi: 10.3390/ijerph16203959.
Kamae, Y., H. Shiogama, M. Watanabe, and M. Kimoto, 2014: Attributing the increase in Northern Hemisphere hot summers since the late 20th century. Geophysical Research Letters, 41(14), 5192–5199, doi: 10.1002/2014gl061062.
Kamae, Y., W. Mei, S.P. Xie, M. Naoi, and H. Ueda, 2017a: Atmospheric rivers over the Northwestern Pacific: Climatology and interannual variability. Journal of Climate, 30(15), 5605–5619, doi: 10.1175/jcli-d-16-0875.1.
Kamae, Y. et al., 2017b: Forced response and internal variability of summer climate over western North America. Climate Dynamics, 49(1–2), 403–417, doi: 10.1007/s00382-016-3350-x.
Kambezidis, H.D. et al., 2012: Multi-decadal variation of the net downward shortwave radiation over south Asia: The solar dimming effect. Atmospheric Environment, 50, 360–372, doi: 10.1016/j.atmosenv.2011.11.008.
Kanada, S. and A. Wada, 2016: Sensitivity to Horizontal Resolution of the Simulated Intensifying Rate and Inner-Core Structure of Typhoon Ida, an Extremely Intense Typhoon. Journal of the Meteorological Society of Japan. Series II, 94A, 181–190, doi: 10.2151/jmsj.2015-037.
Kanada, S., A. Wada, and M. Sugi, 2013: Future changes in structures of extremely intense tropical cyclones using a 2-km mesh nonhydrostatic model. Journal of Climate, 26(24), 9986–10005, doi: 10.1175/jcli-d-12-00477.1.
Kanada, S. et al., 2017a: A multimodel intercomparison of an intense typhoon in future, warmer climates by Four 5-km-Mesh models. Journal of Climate, 30(15), 6017–6036, doi: 10.1175/jcli-d-16-0715.1.
Kanada, S. et al., 2017b: Impacts of SST Patterns on Rapid Intensification of Typhoon Megi (2010). Journal of Geophysical Research: Atmospheres, 122(24), 13245–13262, doi: 10.1002/2017jd027252.
Kang, N.Y. and J.B. Elsner, 2012: Consensus on climate trends in Western North pacific tropical cyclones. Journal of Climate, 25(21), 7564–7573, doi: 10.1175/jcli-d-11-00735.1.
Kaniewski, D., E. Van Campo, and H. Weiss, 2012: Drought is a recurring challenge in the Middle East. Proceedings of the National Academy of Sciences, 109(10), 3862–3867, doi: 10.1073/pnas.1116304109.
Kar-Man Chang, E., 2018: CMIP5 Projected Change in Northern Hemisphere Winter Cyclones with Associated Extreme Winds. Journal of Climate, 31(16), 6527–6542, doi: 10.1175/jcli-d-17-0899.1.
Karoly, D.J., M.T. Black, M.R. Grose, and A.D. King, 2016: The roles of climate change and El Niño in the record low rainfall in October 2015 in Tasmania, Australia [in “Explaining Extremes of 2015 from a Climate Perspective”]. Bulletin of the American Meteorological Society, 97(12), S127–S130, doi: 10.1175/bams-d-16-0139.1.
Kato, T., 2020: Quasi-Stationary Band-Shaped Precipitation Systems, Named as “Senjo-Kousuitai”, Causing Localized Heavy Rainfall in Japan. Journal of the Meteorological Society of Japan. Series II, 98(3), 485–509, doi: 10.2151/jmsj.2020-029.
Kattsov, V.M., I.M. Shkolnik, and S. Efimov, 2017: Climate change projections in Russian regions: The detailing in physical and probability spaces. Russian Meteorology and Hydrology, 42(7), 452–460, doi: 10.3103/s1068373917070044.
Kawase, H. et al., 2020: The Heavy Rain Event of July 2018 in Japan Enhanced by Historical Warming. Bulletin of the American Meteorological Society, 101(1), S109–S114, doi: 10.1175/bams-d-19-0173.1.
Kay, A.L., V.A. Bell, B.P. Guillod, R.G. Jones, and A.C. Rudd, 2018: National-scale analysis of low flow frequency: historical trends and potential future changes. Climatic Change, 147(3), 585–599, doi: 10.1007/s10584-018-2145-y.
Kay, J.E. et al., 2015: The Community Earth System Model (CESM) Large Ensemble Project: A Community Resource for Studying Climate Change in the Presence of Internal Climate Variability. Bulletin of the American Meteorological Society, 96(8), 1333–1349, doi: 10.1175/bams-d-13-00255.1.
Keellings, D. and P. Waylen, 2014: Increased risk of heat waves in Florida: Characterizing changes in bivariate heat wave risk using extreme value analysis. Applied Geography, 46, 90–97, doi: 10.1016/j.apgeog.2013.11.008.
Kelley, C., M. Ting, R. Seager, and Y. Kushnir, 2012: The relative contributions of radiative forcing and internal climate variability to the late 20th Century winter drying of the Mediterranean region. Climate Dynamics, 38(9), 2001–2015, doi: 10.1007/s00382-011-1221-z.
Kelley, C.P., S. Mohtadi, M.A. Cane, R. Seager, and Y. Kushnir, 2015: Climate change in the Fertile Crescent and implications of the recent Syrian drought. Proceedings of the National Academy of Sciences, 112(11), 3241–3246, doi: 10.1073/pnas.1421533112.
Kendon, E.J. et al., 2014: Heavier summer downpours with climate change revealed by weather forecast resolution model. Nature Climate Change, 4(7), 570–576, doi: 10.1038/nclimate2258.
Kendon, E.J. et al., 2017: Do Convection-Permitting Regional Climate Models Improve Projections of Future Precipitation Change?Bulletin of the American Meteorological Society, 98(1), 79–93, doi: 10.1175/bams-d-15-0004.1.
Kendon, E.J. et al., 2019: Enhanced future changes in wet and dry extremes over Africa at convection-permitting scale. Nature Communications, 10(1), 1794, doi: 10.1038/s41467-019-09776-9.
Kendon, M., 2014: Has there been a recent increase in UK weather records?Weather, 69(12), 327–332, doi: 10.1002/wea.2439.
Kew, S.F., F.M. Selten, G. Lenderink, and W. Hazeleger, 2013: The simultaneous occurrence of surge and discharge extremes for the Rhine delta. Natural Hazards and Earth System Sciences, 13(8), 2017–2029, doi: 10.5194/nhess-13-2017-2013.
Kew, S.F. et al., 2019: The Exceptional Summer Heat Wave in Southern Europe 2017 [in “Explaining Extreme Events of 2017 from a Climate Perspective”]. Bulletin of the American Meteorological Society, 100(1), S49–S53, doi: 10.1175/bams-d-18-0109.1.
Kew, S.F. et al., 2021: Impact of precipitation and increasing temperatures on drought trends in eastern Africa. Earth System Dynamics, 12(1), 17–35, doi: 10.5194/esd-12-17-2021.
Khan, N., S. Shahid, T. Ismail, and X.-J. Wang, 2019: Spatial distribution of unidirectional trends in temperature and temperature extremes in Pakistan. Theoretical and Applied Climatology, 136(3–4), 899–913, doi: 10.1007/s00704-018-2520-7.
Kharin, V., F.W. Zwiers, X. Zhang, and M. Wehner, 2013: Changes in temperature and precipitation extremes in the CMIP5 ensemble. Climatic Change, 119(2), 345–357, doi: 10.1007/s10584-013-0705-8.
Kharin, V. et al., 2018: Risks from Climate Extremes Change Differently from 1.5°C to 2.0°C Depending on Rarity. Earth’s Future, 6(5), 704–715, doi: 10.1002/2018ef000813.
Khlebnikova, E.I., Y.L. Rudakova, and I.M. Shkolnik, 2019a: Changes in precipitation regime over the territory of Russia: Data of regional climate modeling and observations. Russian Meteorology and Hydrology, 44(7), 431–439, doi: 10.3103/s106837391907001x.
Khlebnikova, E.I., Y.L. Rudakova, I.A. Sall’, S. Efimov, and I.M. Shkolnik, 2019b: Changes in indicators of temperature extremes in the 21st century: ensemble projections for the territory of Russia. Russian Meteorology and Hydrology, 44(3), 159–168, doi: 10.3103/s1068373919030014.
Khong, A., J.K. Wang, S.M. Quiring, and T.W. Ford, 2015: Soil moisture variability in Iowa. International Journal of Climatology, 35(10), 2837–2848, doi: 10.1002/joc.4176.
Khouakhi, A., G. Villarini, and G.A. Vecchi, 2016: Contribution of Tropical Cyclones to Rainfall at the Global Scale. Journal of Climate, 30(1), 359–372, doi: 10.1175/jcli-d-16-0298.1.
Kim, B. and B.F. Sanders, 2016: Dam-Break Flood Model Uncertainty Assessment: Case Study of Extreme Flooding with Multiple Dam Failures in Gangneung, South Korea. Journal of Hydraulic Engineering, 142(5), 05016002, doi: 10.1061/(asce)hy.1943-7900.0001097.
Kim, D. et al., 2018: Process-Oriented Diagnosis of Tropical Cyclones in High-Resolution GCMs. Journal of Climate, 31(5), 1685–1702, doi: 10.1175/jcli-d-17-0269.1.
Kim, G. et al., 2018: Future changes in extreme precipitation indices over Korea. International Journal of Climatology, 38, e862–e874, doi: 10.1002/joc.5414.
Kim, H.S. et al., 2014: Tropical cyclone simulation and response to CO2 doubling in the GFDL CM2.5 high-resolution coupled climate model. Journal of Climate, 27(21), 8034–8054, doi: 10.1175/jcli-d-13-00475.1.
Kim, I.-W., J. Oh, S. Woo, and R.H. Kripalani, 2019: Evaluation of precipitation extremes over the Asian domain: observation and modelling studies. Climate Dynamics, 52(3), 1317–1342, doi: 10.1007/s00382-018-4193-4.
Kim, J. et al., 2014: Evaluation of the CORDEX-Africa multi-RCM hindcast: systematic model errors. Climate Dynamics, 42(5–6), 1189–1202, doi: 10.1007/s00382-013-1751-7.
Kim, Y.H. et al., 2016: Attribution of extreme temperature changes during 1951–2010. Climate Dynamics, 46(5–6), 1769–1782, doi: 10.1007/s00382-015-2674-2.
Kim, Y.-H., S.-K. Min, D.A. Stone, H. Shiogama, and P. Wolski, 2018: Multi-model event attribution of the summer 2013 heat wave in Korea. Weather and Climate Extremes, 20, 33–44, doi: 10.1016/j.wace.2018.03.004.
Kim, Y.-H., S.-K. Min, X. Zhang, J. Sillmann, and M. Sandstad, 2020: Evaluation of the CMIP6 multi-model ensemble for climate extreme indices. Weather and Climate Extremes, 29, 100269, doi: 10.1016/j.wace.2020.100269.
King, A.D., 2017: Attributing Changing Rates of Temperature Record Breaking to Anthropogenic Influences. Earth’s Future, 5(11), 1156–1168, doi: 10.1002/2017ef000611.
King, A.D., D.J. Karoly, and G.J. van Oldenborgh, 2016a: Climate Change and El Niño Increase Likelihood of Indonesian Heat and Drought. Bulletin of the American Meteorological Society, 97(12), S113–S117, doi: 10.1175/bams-d-16-0164.1.
King, A.D., D.J. Karoly, M.G. Donat, and L.V. Alexander, 2014: Climate change turns Australia’s 2013 big dry into a year of record-breaking heat [in “Explaining Extreme Events of 2013 from a Climate Perspective”]. Bulletin of the American Meteorological Society, 95(9), S41–S45, doi: 10.1175/1520-0477-95.9.s41.
King, A.D., M.T. Black, D.J. Karoly, and M.G. Donat, 2015a: Increased Likelihood of Brisbane, Australia, G20 Heat Event Due to Anthropogenic Climate Change. Bulletin of the American Meteorological Society, 96(12), S141–S144, doi: 10.1175/bams-d-15-00098.1.
King, A.D., G. Jan van Oldenborgh, D.J. Karoly, S.C. Lewis, and H. Cullen, 2015b: Attribution of the record high Central England temperature of 2014 to anthropogenic influences. Environmental Research Letters, 10(5), 054002, doi: 10.1088/1748-9326/10/5/054002.
King, A.D. et al., 2016b: Emergence of heat extremes attributable to anthropogenic influences. Geophysical Research Letters, 43(7), 3438–3443, doi: 10.1002/2015gl067448.
King, A.D. et al., 2018: On the Linearity of Local and Regional Temperature Changes from 1.5°C to 2°C of Global Warming. Journal of Climate, 31(18), 7495–7514, doi: 10.1175/jcli-d-17-0649.1.
Kingston, D.G., J.H. Stagge, L.M. Tallaksen, and D.M. Hannah, 2015: European-scale drought: Understanding connections between atmospheric circulation and meteorological drought indices. Journal of Climate, 28(2), 505–516, doi: 10.1175/jcli-d-14-00001.1.
Kinter III, J.L. et al., 2013: Revolutionizing Climate Modeling with Project Athena: A Multi-institutional, International Collaboration. Bulletin of the American Meteorological Society, 94(2), 231–245, doi: 10.1175/bams-d-11-00043.1.
Kirchmeier-Young, M.C. and X. Zhang, 2020: Human influence has intensified extreme precipitation in North America. Proceedings of the National Academy of Sciences, 117(24), 13308–13313, doi: 10.1073/pnas.1921628117.
Kirchmeier-Young, M.C., H. Wan, X. Zhang, and S.I. Seneviratne, 2019: Importance of Framing for Extreme Event Attribution: The Role of Spatial and Temporal Scales. Earth’s Future, 7(10), 1192–1204, doi: 10.1029/2019ef001253.
Kirono, D.G.C., K.J. Hennessy, and M.R. Grose, 2017: Increasing risk of months with low rainfall and high temperature in southeast Australia for the past 150 years. Climate Risk Management, 16, 10–21, doi: 10.1016/j.crm.2017.04.001.
Kirono, D.G.C., V. Round, C. Heady, F.H.S. Chiew, and S. Osbrough, 2020: Drought projections for Australia: Updated results and analysis of model simulations. Weather and Climate Extremes, 30, 100280, doi: 10.1016/j.wace.2020.100280.
Kirshbaum, D.J., T.M. Merlis, J.R. Gyakum, and R. McTaggart-Cowan, 2017: Sensitivity of Idealized Moist Baroclinic Waves to Environmental Temperature and Moisture Content. Journal of the Atmospheric Sciences, 75(1), 337–360, doi: 10.1175/jas-d-17-0188.1.
Kishtawal, C.M., N. Jaiswal, R. Singh, and D. Niyogi, 2012: Tropical cyclone intensification trends during satellite era (1986–2010). Geophysical Research Letters, 39(10), 1–6, doi: 10.1029/2012gl051700.
Kitoh, A. and H. Endo, 2019: Future Changes in Precipitation Extremes Associated with Tropical Cyclones Projected by Large-Ensemble Simulations. Journal of the Meteorological Society of Japan. Series II, 97(1), 141–152, doi: 10.2151/jmsj.2019-007.
Kjeldsen, T.R. et al., 2014: Documentary evidence of past floods in Europe and their utility in flood frequency estimation. Journal of Hydrology, 517, 963–973, doi: 10.1016/j.jhydrol.2014.06.038.
Klerk, W.J., H.C. Winsemius, W.J. van Verseveld, A.M.R. Bakker, and F.L.M. Diermanse, 2015: The co-incidence of storm surges and extreme discharges within the Rhine–Meuse Delta. Environmental Research Letters, 10(3), 035005, doi: 10.1088/1748-9326/10/3/035005.
Klutse, N.A.B. et al., 2016: Daily characteristics of West African summer monsoon precipitation in CORDEX simulations. Theoretical and applied climatology, 123(1–2), 369–386, doi: 10.1007/s00704-014-1352-3.
Klutse, N.A.B. et al., 2018: Potential impact of 1.5°C and 2°C global warming on consecutive dry and wet days over West Africa. Environmental Research Letters, 13(5), 055013, doi: 10.1088/1748-9326/aab37b.
Knapp, K.R. et al., 2018: A Global Climatology of Tropical Cyclone Eyes. Monthly Weather Review, 146(7), 2089–2101, doi: 10.1175/m wr-d-17-0343.1.
Knighton, J., J. Conneely, and M.T. Walter, 2019: Possible Increases in Flood Frequency Due to the Loss of Eastern Hemlock in the Northeastern United States: Observational Insights and Predicted Impacts. Water Resources Research, 55(7), 5342–5359, doi: 10.1029/2018wr024395.
Knutson, T.R. and F. Zeng, 2018: Model Assessment of Observed Precipitation Trends over Land Regions: Detectable Human Influences and Possible Low Bias in Model Trends. Journal of Climate, 31(12), 4617–4637, doi: 10.1175/jcli-d-17-0672.1.
Knutson, T.R., F. Zeng, and A. Wittenberg, 2014a: Seasonal and annual mean precipitation extremes during during 2013: A U.S. focused analysis [in “Explaining Extreme Events of 2013 from a Climate Perspective”]. Bulletin of the American Meteorological Society, 95(9), S19–S23, doi: 10.1175/1520-0477-95.9.s1.1.
Knutson, T.R., F. Zeng, and A.T. Wittenberg, 2014b: Multimodel assessment of extreme annual-mean warm anomalies during 2013 over regions of Australia and the western tropical Pacific [in “Explaining Extreme Events of 2013 from a Climate Perspective”]. Bulletin of the American Meteorological Society, 95(9), S26–S30, doi: 10.1175/1520-0477-95.9.s1.1.
Knutson, T.R. et al., 2013: Dynamical Downscaling Projections of Twenty-First-Century Atlantic Hurricane Activity: CMIP3 and CMIP5 Model-Based Scenarios. Journal of Climate, 26(17), 6591–6617, doi: 10.1175/jcli-d-12-00539.1.
Knutson, T.R. et al., 2015: Global Projections of Intense Tropical Cyclone Activity for the Late Twenty-First Century from Dynamical Downscaling of CMIP5/RCP4.5 Scenarios. Journal of Climate, 28(18), 7203–7224, doi: 10.1175/jcli-d-15-0129.1.
Knutson, T.R. et al., 2019: Tropical Cyclones and Climate Change Assessment: Part I: Detection and Attribution. Bulletin of the American Meteorological Society, 100(10), 1987–2007, doi: 10.1175/bams-d-18-0189.1.
Knutson, T.R. et al., 2020: Tropical Cyclones and Climate Change Assessment: Part II. Projected Response to Anthropogenic Warming. Bulletin of the American Meteorological Society, 101, E303–E322, doi: 10.1175/bams-d-18-0194.1.
Kodama, C., B. Stevens, T. Mauritsen, T. Seiki, and M. Satoh, 2019: A New Perspective for Future Precipitation Change from Intense Extratropical Cyclones. Geophysical Research Letters, 46(21), 12435–12444, doi: 10.1029/2019gl084001.
Kodama, C. et al., 2015: A 20-year climatology of a NICAM AMIP-type simulation. Journal of the Meteorological Society of Japan. Series II, 93(4), 393–424, doi: 10.2151/jmsj.2015-024.
Kogan, F. and W. Guo, 2017: Strong 2015–2016 El Niño and implication to global ecosystems from space data. International Journal of Remote Sensing, 38(1), 161–178, doi: 10.1080/01431161.2016.1259679.
Konapala, G. and A. Mishra, 2017: Review of complex networks application in hydroclimatic extremes with an implementation to characterize spatio-temporal drought propagation in continental USA. Journal of Hydrology, 555, 600–620, doi: 10.1016/j.jhydrol.2017.10.033.
Konapala, G. and A. Mishra, 2020: Quantifying Climate and Catchment Control on Hydrological Drought in the Continental United States. Water Resources Research, 56(1), e2018WR024620, doi: 10.1029/2018wr024620.
Kong, Q., S.B. Guerreiro, S. Blenkinsop, X.-F. Li, and H.J. Fowler, 2020: Increases in summertime concurrent drought and heatwave in Eastern China. Weather and Climate Extremes, 28, 100242, doi: 10.1016/j.wace.2019.100242.
Konings, A.G., A.P. Williams, and P. Gentine, 2017: Sensitivity of grassland productivity to aridity controlled by stomatal and xylem regulation. Nature Geoscience, 10, 284, doi: 10.1038/ngeo2903.
Kooperman, G.J. et al., 2018: Plant Physiological Responses to Rising CO2 Modify Simulated Daily Runoff Intensity With Implications for Global-Scale Flood Risk Assessment. Geophysical Research Letters, 45(22), 12457–12466, doi: 10.1029/2018gl079901.
Kornhuber, K. et al., 2019: Extreme weather events in early summer 2018 connected by a recurrent hemispheric wave-7 pattern. Environmental Research Letters, 14(5), 54002, doi: 10.1088/1748-9326/ab13bf .
Kornhuber, K. et al., 2020: Amplified Rossby waves enhance risk of concurrent heatwaves in major breadbasket regions. Nature Climate Change, 10(1), 48–53, doi: 10.1038/s41558-019-0637-z.
Kossin, J.P., 2017: Hurricane intensification along United States coast suppressed during active hurricane periods. Nature, 541(7637), 390–393, doi: 10.1038/nature20783.
Kossin, J.P., 2018: A global slowdown of tropical-cyclone translation speed. Nature, 558(7708), 104–107, doi: 10.1038/s41586-018-0158-3.
Kossin, J.P., 2019: Reply to: Moon, I.-J. et al.; Lanzante, J. R. Nature, 570(7759), E16–E22, doi: 10.1038/s41586-019-1224-1.
Kossin, J.P., T.L. Olander, and K.R. Knapp, 2013: Trend analysis with a new global record of tropical cyclone intensity. Journal of Climate, 26(24), 9960–9976, doi: 10.1175/jcli-d-13-00262.1.
Kossin, J.P., K.A. Emanuel, and G.A. Vecchi, 2014: The poleward migration of the location of tropical cyclone maximum intensity. Nature, 509(7500), 349–352, doi: 10.1038/nature13278.
Kossin, J.P., K.A. Emanuel, and S.J. Camargo, 2016a: Past and Projected Changes in Western North Pacific Tropical Cyclone Exposure. Journal of Climate, 29(16), 5725–5739, doi: 10.1175/jcli-d-16-0076.1.
Kossin, J.P., K.A. Emanuel, and G.A. Vecchi, 2016b: Comment on ‘Roles of interbasin frequency changes in the poleward shifts of the maximum intensity location of tropical cyclones’. Environmental Research Letters, 11(6), 068001, doi: 10.1088/1748-9326/11/6/068001.
Kossin, J.P., K.R. Knapp, T.L. Olander, and C.S. Velden, 2020: Global increase in major tropical cyclone exceedance probability over the past four decades. Proceedings of the National Academy of Sciences, 117(22), 11975–11980, doi: 10.1073/pnas.1920849117.
Kossin, J.P. et al., 2017: Extreme Storms. In: Climate Science Special Report: Fourth National Climate Assessment, Volume I[Wuebbles, D.J., D.W. Fahey, K.A. Hibbard, D.J. Dokken, B.C. Stewart, and T.K. Maycock (eds.)]. U.S. Global Change Research Program, Washington, DC, USA, pp. 257–276, doi: 10.7930/j07s7kxx.
Koster, R.D., Y. Chang, H. Wang, and S.D. Schubert, 2016: Impacts of Local Soil Moisture Anomalies on the Atmospheric Circulation and on Remote Surface Meteorological Fields during Boreal Summer: A Comprehensive Analysis over North America. Journal of Climate, 29(20), 7345–7364, doi: 10.1175/jcli-d-16-0192.1.
Koster, R.D. et al., 2009: On the Nature of Soil Moisture in Land Surface Models. Journal of Climate, 22(16), 4322–4335, doi: 10.1175/2009jcli2832.1.
Koster, R.D. et al., 2011: The second phase of the global land–atmosphere coupling experiment: Soil moisture contributions to subseasonal forecast skill. Journal of Hydrometeorology, 12(5), 805–822, doi: 10.1175/2011jhm1365.1.
Krishnan, R. et al., 2016: Deciphering the desiccation trend of the South Asian monsoon hydroclimate in a warming world. Climate Dynamics, 47(3), 1007–1027, doi: 10.1007/s00382-015-2886-5.
Krueger, O., F. Schenk, F. Feser, and R. Weisse, 2013: Inconsistencies Between Long-Term Trends in Storminess Derived From the 20CR Reanalysis and Observations. Journal of Climate, 26(3), 868–874, doi: 10.1175/jcli-d-12-00309.1.
Krug, A., C. Primo, S. Fischer, A. Schumann, and B. Ahrens, 2020: On the temporal variability of widespread rain-on-snow floods. Meteorologische Zeitschrift, 29(2), 147–163, doi: 10.1127/metz/2020/0989.
Kruger, A.C. and S.S. Sekele, 2013: Trends in extreme temperature indices in South Africa: 1962–2009. International Journal of Climatology, 33(3), 661–676, doi: 10.1002/joc.3455.
Kruger, A.C. and M. Nxumalo, 2017: Surface temperature trends from homogenized time series in South Africa: 1931–2015. International Journal of Climatology, 37(5), 2364–2377, doi: 10.1002/joc.4851.
Kruger, A.C., H. Rautenbach, S. Mbatha, S. Ngwenya, and T.E. Makgoale, 2019: Historical and projected trends in near-surface temperature indices for 22 locations in South Africa. South African Journal of Science, 115(5/6), 4846, doi: 10.17159/sajs.2019/4846.
Krysanova, V. et al., 2017: Intercomparison of regional-scale hydrological models and climate change impacts projected for 12 large river basins worldwide – a synthesis. Environmental Research Letters, 12(10), 105002, doi: 10.1088/1748-9326/aa8359.
Kubota, H. et al., 2021: Tropical cyclones over the western north Pacific since the mid-nineteenth century. Climatic Change, 164(3), 29, doi: 10.1007/s10584-021-02984-7.
Kuleshov, Y. et al., 2010: Trends in tropical cyclones in the South Indian Ocean and the South Pacific Ocean. Journal of Geophysical Research: Atmospheres, 115(D1), D01101, doi: 10.1029/2009jd012372.
Kumar, S., R.P. Allan, F. Zwiers, D.M. Lawrence, and P.A. Dirmeyer, 2015: Revisiting trends in wetness and dryness in the presence of internal climate variability and water limitations over land. Geophysical Research Letters, 42(24), 10867–10875, doi: 10.1002/2015gl066858.
Kundzewicz, Z.W., I. Pin’skwar, and G.R. Brakenridge, 2018: Changes in river flood hazard in Europe: A review. Hydrology Research, 49(2), 294–302, doi: 10.2166/nh.2017.016.
Kunii, M., M. Otsuka, K. Shimoji, and H. Seko, 2016: Ensemble Data Assimilation and Forecast Experiments for the September 2015 Heavy Rainfall Event in Kanto and Tohoku Regions with Atmospheric Motion Vectors from Himawari-8. SOLA, 12(0), 209–214, doi: 10.2151/sola.2016-042.
Kunkel, K.E. et al., 2013: Monitoring and understanding trends in extreme storms: State of knowledge. Bulletin of the American Meteorological Society, 94(4), 499–514, doi: 10.1175/bams-d-11-00262.1.
Kusunoki, S., 2017: Future Changes in Global Precipitation Projected by the Atmospheric Model MRI-AGCM3.2H with a 60-km Size. Atmosphere, 8(5), 93, doi: 10.3390/atmos8050093.
Kusunoki, S., 2018a: Future changes in precipitation over East Asia projected by the global atmospheric model MRI-AGCM3.2. Climate Dynamics, 51(11–12), 4601–4617, doi: 10.1007/s00382-016-3499-3.
Kusunoki, S., 2018b: Is the global atmospheric model MRI-AGCM3.2 better than the CMIP5 atmospheric models in simulating precipitation over East Asia?Climate Dynamics, 51(11), 4489–4510, doi: 10.1007/s00382-016-3335-9.
Kusunoki, S. and R. Mizuta, 2013: Changes in precipitation intensity over East Asia during the 20th and 21st centuries simulated by a global atmospheric model with a 60 km grid size. Journal of Geophysical Research: Atmospheres, 118(19), 11007–11016, doi: 10.1002/jgrd.50877.
Kusunoki, S., T. Nakaegawa, R. Pinzón, J.E. Sanchez-Galan, and J.R. Fábrega, 2019: Future precipitation changes over Panama projected with the atmospheric global model MRI-AGCM3.2. Climate Dynamics, 53(7–8), 5019–5034, doi: 10.1007/s00382-019-04842-w.
Lackmann, G.M., 2013: The south-central U.S. flood of may 2010: Present and future. Journal of Climate, 26(13), 4688–4709, doi: 10.1175/jcli-d-12-00392.1.
Lackmann, G.M., 2015: Hurricane Sandy before 1900 and after 2100. Bulletin of the American Meteorological Society, 96(4), 547–560, doi: 10.1175/bams-d-14-00123.1.
Laliberté, F., S.E.L. Howell, and P.J. Kushner, 2015: Regional variability of a projected sea ice-free Arctic during the summer months. Geophysical Research Letters, 43(1), 256–263, doi: 10.1002/2015gl066855.
Landsea, C.W., 2015: Comments on “Monitoring and understanding trends in extreme storms: state of knowledge”. Bulletin of the American Meteorological Society, 96(7), 1175–1182, doi: 10.1175/1520-0477-96.7.1175.
Langerwisch, F. et al., 2013: Potential effects of climate change on inundation patterns in the Amazon Basin. Hydrology and Earth System Sciences, 17(6), 2247–2262, doi: 10.5194/hess-17-2247-2013.
Lanzante, J.R., 2019: Uncertainties in tropical-cyclone translation speed. Nature, 570(7759), E6–E15, doi: 10.1038/s41586-019-1223-2.
Lau, N.-C. and M.J. Nath, 2014: Model simulation and projection of European heat waves in present-day and future climates. Journal of Climate, 27(10), 3713–3730, doi: 10.1175/jcli-d-13-00284.1.
Lawal, K.A. et al., 2016: The Late Onset of the 2015 Wet Season in Nigeria. Bulletin of the American Meteorological Society, 97(12), S63–S69, doi: 10.1175/bams-d-16-0131.1.
Leach, N.J. et al., 2020: Anthropogenic Influence on the 2018 Summer Warm Spell in Europe: The Impact of Different Spatio-Temporal Scales. Bulletin of the American Meteorological Society, 101(1), S41–S46, doi: 10.1175/bams-d-19-0201.1.
Lee, C.Y., M.K. Tippett, A.H. Sobel, and S.J. Camargo, 2018: An environmentally forced tropical cyclone hazard model. Journal of Advances in Modeling Earth Systems, 10(1), 223–241, doi: 10.1002/2017ms001186.
Lee, C.-Y., S.J. Camargo, A.H. Sobel, and M.K. Tippett, 2020: Statistical–Dynamical Downscaling Projections of Tropical Cyclone Activity in a Warming Climate: Two Diverging Genesis Scenarios. Journal of Climate, 33(11), 4815–4834, doi: 10.1175/jcli-d-19-0452.1.
Lee, D., S.-K. Min, E. Fischer, H. Shiogama, and I. Bethke, 2018: Impacts of half a degree additional warming on the Asian summer monsoon rainfall characteristics. Environmental Research Letters, 13(4), 044033, doi: 10.1088/1748-9326/aab55d.
Lee, J. et al., 2014: Trends in Extreme U.S. Temperatures. Journal of Climate, 27(11), 4209–4225, doi: 10.1175/jcli-d-13-00283.1.
Lee, T.-C., T.R. Knutson, T. Nakaegawa, M. Ying, and E.J. Cha, 2020: Third assessment on impacts of climate change on tropical cyclones in the Typhoon Committee Region – Part I: Observed changes, detection and attribution. Tropical Cyclone Research and Review, 9(1), 1–22, doi: 10.1016/j.tcrr.2020.03.001.
Lee, W. et al., 2018: Temporal changes in mortality attributed to heat extremes for 57 cities in Northeast Asia. Science of The Total Environment, 616–617, 703–709, doi: 10.1016/j.scitotenv.2017.10.258.
Lehner, F. and T.F. Stocker, 2015: From local perception to global perspective. Nature Climate Change, 5(8), 731–734, doi: 10.1038/nclimate2660.
Lehner, F., C. Deser, I.R. Simpson, and L. Terray, 2018: Attributing the U.S. Southwest’s Recent Shift Into Drier Conditions. Geophysical Research Letters, 45(12), 6251–6261, doi: 10.1029/2018gl078312.
Lehner, F. et al., 2017: Projected drought risk in 1.5°C and 2°C warmer climates. Geophysical Research Letters, 44(14), 7419–7428, doi: 10.1002/2017gl074117.
Lejeune, Q., S.I. Seneviratne, and E.L. Davin, 2017: Historical Land-Cover Change Impacts on Climate: Comparative Assessment of LUCID and CMIP5 Multimodel Experiments. Journal of Climate, 30(4), 1439–1459, doi: 10.1175/jcli-d-16-0213.1.
Lejeune, Q., E.L. Davin, L. Gudmundsson, J. Winckler, and S.I. Seneviratne, 2018: Historical deforestation locally increased the intensity of hot days in northern mid-latitudes. Nature Climate Change, 8(5), 386–390, doi: 10.1038/s41558-018-0131-z.
Lelieveld, J. et al., 2016: Strongly increasing heat extremes in the Middle East and North Africa (MENA) in the 21st century. Climatic Change, 137(1–2), 245–260, doi: 10.1007/s10584-016-1665-6.
Lemordant, L., P. Gentine, M. Stéfanon, P. Drobinski, and S. Fatichi, 2016: Modification of land-atmosphere interactions by CO2 effects: Implications for summer dryness and heat wave amplitude. Geophysical Research Letters, 43(19), 10240–10248, doi: 10.1002/2016gl069896.
Lemordant, L., P. Gentine, A.S. Swann, B.I. Cook, and J. Scheff, 2018: Critical impact of vegetation physiology on the continental hydrologic cycle in response to increasing CO2. Proceedings of the National Academy of Sciences, 115(16), 4093–4098, doi: 10.1073/pnas.1720712115.
Lenderink, G., R. Barbero, J.M. Loriaux, and H.J. Fowler, 2017: Super-Clausius–Clapeyron Scaling of Extreme Hourly Convective Precipitation and Its Relation to Large-Scale Atmospheric Conditions. Journal of Climate, 30(15), 6037–6052, doi: 10.1175/jcli-d-16-0808.1.
Lewis, E. et al., 2019: GSDR: A Global Sub-Daily Rainfall Dataset. Journal of Climate, 32(15), 4715–4729, doi: 10.1175/jcli-d-18-0143.1.
Lewis, S.C. and D.J. Karoly, 2013: Anthropogenic contributions to Australia’s record summer temperatures of 2013. Geophysical Research Letters, 40(14), 3705–3709, doi: 10. 1002/grl.50673.
Lewis, S.C. and D.J. Karoly, 2014: The Role of Anthropogenic Forcing in the Record 2013 Australia-Wide Annual and Spring Temperatures [in “Explaining Extreme Events of 2013 from a Climate Perspective”]. Bulletin of the American Meteorological Society, 95(9), S31–S34, doi: 10.1175/1520-0477-95.9.s1.1.
Lewis, S.C. and A.D. King, 2015: Dramatically increased rate of observed hot record breaking in recent Australian temperatures. Geophysical Research Letters, 42(18), 7776–7784, doi: 10.1002/2015gl065793.
Lewis, S.C., A.D. King, and D.M. Mitchell, 2017a: Australia’s Unprecedented Future Temperature Extremes Under Paris Limits to Warming. Geophysical Research Letters, 44(19), 9947–9956, doi: 10.1002/2017gl074612.
Lewis, S.C., A.D. King, and S.E. Perkins-Kirkpatrick, 2017b: Defining a New Normal for Extremes in a Warming World. Bulletin of the American Meteorological Society, 98(6), 1139–1151, doi: 10.1175/bams-d-16-0183.1.
Lewis, S.C. et al., 2020: Deconstructing Factors Contributing to the 2018 Fire Weather in Queensland, Australia. Bulletin of the American Meteorological Society, 101(1), S115–S122, doi: 10.1175/bams-d-19-0144.1.
Lewis, S.L., P.M. Brando, O.L. Phillips, G.M.F. van der Heijden, and D. Nepstad, 2011: The 2010 Amazon Drought. Science, 331(6017), 554–554, doi: 10.1126/science.1200807.
Lhotka, O., J. Kyselý, and A. Farda, 2018: Climate change scenarios of heat waves in Central Europe and their uncertainties. Theoretical and Applied Climatology, 131(3–4), 1043–1054, doi: 10.1007/s00704-016-2031-3.
Li, C., F. Zwiers, X. Zhang, and G. Li, 2019a: How Much Information Is Required to Well Constrain Local Estimates of Future Precipitation Extremes?Earth’s Future, 7(1), 11–24, doi: 10.1029/2018ef001001.
Li, C., X. Zhang, F. Zwiers, Y. Fang, and A.M. Michalak, 2017: Recent Very Hot Summers in Northern Hemispheric Land Areas Measured by Wet Bulb Globe Temperature Will Be the Norm Within 20 Years. Earth’s Future, 5(12), 1203–1216, doi: 10.1002/2017ef000639.
Li, C. et al., 2018: Widespread persistent changes to temperature extremes occurred earlier than predicted. Scientific Reports, 8(1), 1007, doi: 10.1038/s41598-018-19288-z.
Li, C. et al., 2019b: Larger Increases in More Extreme Local Precipitation Events as Climate Warms. Geophysical Research Letters, 46(12), 6885–6891, doi: 10.1029/2019gl082908.
Li, C. et al., 2021: Changes in Annual Extremes of Daily Temperature and Precipitation in CMIP6 Models. Journal of Climate, 34(9), 3441–3460, doi: 10.1175/jcli-d-19-1013.1.
Li, D., D.P. Lettenmaier, S.A. Margulis, and K. Andreadis, 2019: The Role of Rain-on-Snow in Flooding Over the Conterminous United States. Water Resources Research, 55(11), 8492–8513, doi: 10.1029/2019wr024950.
Li, D., T. Zhou, L. Zou, W. Zhang, and L. Zhang, 2018: Extreme High-Temperature Events Over East Asia in 1.5°C and 2°C Warmer Futures: Analysis of NCAR CESM Low-Warming Experiments. Geophysical Research Letters, 45(3), 1541–1550, doi: 10.1002/2017gl076753.
Li, G. et al., 2018: Indices of Canada’s future climate for general and agricultural adaptation applications. Climatic Change, 148(1–2), 249–263, doi: 10.1007/s10584-018-2199-x.
Li, H. and R.L. Sriver, 2018: Tropical Cyclone Activity in the High-Resolution Community Earth System Model and the Impact of Ocean Coupling. Journal of Advances in Modeling Earth Systems, 10(1), 165–186, doi: 10.1002/2017ms001199.
Li, H., H. Chen, and H. Wang, 2017: Effects of anthropogenic activity emerging as intensified extreme precipitation over China. Journal of Geophysical Research: Atmospheres, 122(13), 6899–6914, doi: 10.1002/2016jd026251.
Li, L., D. She, H. Zheng, P. Lin, and Z.-L. Yang, 2020: Elucidating diverse drought characteristics from two meteorological drought indices (SPI and SPEI) in China. Journal of Hydrometeorology, 21(7), 1513–1530, doi: 10.1175/jhm-d-19-0290.s1.
Li, L. et al., 2019: Future projections of extreme temperature events in different sub-regions of China. Atmospheric Research, 217, 150–164, doi: 10.1016/j.atmosres.2018.10.019.
Li, M., T. Woollings, K. Hodges, and G. Masato, 2014: Extratropical cyclones in a warmer, moister climate: A recent Atlantic analogue. Geophysical Research Letters, 41(23), 8594–8601, doi: 10.1002/2014gl062186.
Li, M., L. Huang, Z.-Y. Yin, and X. Shao, 2017: Temperature reconstruction and volcanic eruption signal from tree-ring width and maximum latewood density over the past 304 years in the southeastern Tibetan Plateau. International Journal of Biometeorology, 61(11), 2021–2032, doi: 10.1007/s00484-017-1395-0.
Li, S., F.E.L. Otto, L.J. Harrington, S.N. Sparrow, and D.C.H. Wallom, 2020: A pan-South-America assessment of avoided exposure to dangerous extreme precipitation by limiting to 1.5°C warming. Environmental Research Letters, 15(5), 054005, doi: 10.1088/1748-9326/ab50a2.
Li, W., Z. Jiang, X. Zhang, and L. Li, 2018a: On the Emergence of Anthropogenic Signal in Extreme Precipitation Change Over China. Geophysical Research Letters, 45(17), 9179–9185, doi: 10.1029/2018gl079133.
Li, W., Z. Jiang, X. Zhang, L. Li, and Y. Sun, 2018b: Additional risk in extreme precipitation in China from 1.5°C to 2.0°C global warming levels. Science Bulletin, 63(4), 228–234, doi: 10.1016/j.scib.2017.12.021.
Li, X., X. Wang, and V. Babovic, 2018: Analysis of variability and trends of precipitation extremes in Singapore during 1980–2013. International Journal of Climatology, 38(1), 125–141, doi: 10.1002/joc.5165.
Li, X., L. Liu, H. Li, S. Wang, and J. Heng, 2020: Spatiotemporal soil moisture variations associated with hydro-meteorological factors over the Yarlung Zangbo River basin in Southeast Tibetan Plateau. International Journal of Climatology, 40(1), 188–206, doi: 10.1002/joc.6202.
Li, X. et al., 2019: Concurrent droughts and hot extremes in northwest China from 1961 to 2017. International Journal of Climatology, 39(4), 2186–2196, doi: 10.1002/joc.5944.
Li, Y. et al., 2015: Local cooling and warming effects of forests based on satellite observations. Nature Communications, 6(1), 6603, doi: 10.1038/ncomms7603.
Li, Z., Y. Chen, G. Fang, and Y. Li, 2017: Multivariate assessment and attribution of droughts in Central Asia. Scientific Reports, 7(1), 1316, doi: 10.1038/s41598-017-01473-1.
Li, Z., Y. Chen, Y. Shen, Y. Liu, and S. Zhang, 2013: Analysis of changing pan evaporation in the arid region of Northwest China. Water Resources Research, 49(4), 2205–2212, doi: 10.1002/wrcr.20202.
Lian, X. et al., 2020: Summer soil drying exacerbated by earlier spring greening of northern vegetation. Science Advances, 6(1), eaax0255, doi: 10.1126/sciadv.aax0255.
Liang, C. et al., 2020: Drying and Wetting Trends and Vegetation Covariations in the Drylands of China. Water, 12(4), 933, doi: 10. 3390/w12040933.
Liang, J., C. Wang, and K.I. Hodges, 2017: Evaluation of tropical cyclones over the South China Sea simulated by the 12 km MetUM regional climate model. Quarterly Journal of the Royal Meteorological Society, 143(704), 1641–1656, doi: 10.1002/qj.3035.
Libertino, A., D. Ganora, and P. Claps, 2019: Evidence for Increasing Rainfall Extremes Remains Elusive at Large Spatial Scales: The Case of Italy. Geophysical Research Letters, 46(13), 7437–7446, doi: 10.1029/2019gl083371.
Lin, C., K. Yang, J. Qin, and R. Fu, 2013: Observed Coherent Trends of Surface and Upper-Air Wind Speed over China since 1960. Journal of Climate, 26(9), 2891–2903, doi: 10.1175/jcli-d-12-00093.1.
Lin, L., Z. Wang, Y. Xu, and Q. Fu, 2016: Sensitivity of precipitation extremes to radiative forcing of greenhouse gases and aerosols. Geophysical Research Letters, 43(18), 9860–9868, doi: 10.1002/2016gl070869.
Lin, L., Z. Wang, Y. Xu, Q. Fu, and W. Dong, 2018: Larger Sensitivity of Precipitation Extremes to Aerosol Than Greenhouse Gas Forcing in CMIP5 Models. Journal of Geophysical Research: Atmospheres, 123(15), 8062–8073, doi: 10.1029/2018jd028821.
Lin, N., P. Lane, K.A. Emanuel, R.M. Sullivan, and J.P. Donnelly, 2014: Heightened hurricane surge risk in northwest Florida revealed from climatological–hydrodynamic modeling and paleorecord reconstruction. Journal of Geophysical Research: Atmospheres, 119(14), 8606–8623, doi: 10.1002/2014jd021584.
Lin, P. et al., 2017: Recent changes in daily climate extremes in an arid mountain region, a case study in northwestern China’s Qilian Mountains. Scientific Reports, 7(1), 1–15, doi: 10.1038/s41598-017-02345-4.
Lionello, P. and L. Scarascia, 2020: The relation of climate extremes with global warming in the Mediterranean region and its north versus south contrast. Regional Environmental Change, 20(1), 31, doi: 10.1007/s10113-020-01610-z.
Littell, J.S., D.L. Peterson, K.L. Riley, Y. Liu, and C.H. Luce, 2016: A review of the relationships between drought and forest fire in the United States. Global Change Biology, 22(7), 2353–2369, doi: 10. 1111/gcb.13275.
Little, C.M. et al., 2015: Joint projections of US East Coast sea level and storm surge. Nature Climate Change, 5(12), 1114, doi: 10.1038/nclimate2801.
Liu, B., C. Zhu, J. Su, S. Ma, and K. Xu, 2019: Record-Breaking Northward Shift of the Western North Pacific Subtropical High in July 2018. Journal of the Meteorological Society of Japan. Series II, 97(4), 913–925, doi: 10.2151/jmsj.2019-047.
Liu, C. and E.J. Zipser, 2015: The global distribution of largest, deepest, and most intense precipitation systems. Geophysical Research Letters, 42(9), 3591–3595, doi: 10.1002/2015gl063776.
Liu, L. et al., 2020: Soil moisture dominates dryness stress on ecosystem production globally. Nature Communications, 11(1), 4892, doi: 10.1038/s41467-020-18631-1.
Liu, M., G.A. Vecchi, J.A. Smith, and T.R. Knutson, 2019a: Causes of large projected increases in hurricane precipitation rates with global warming. npj Climate and Atmospheric Science, 2(1), 1–5, doi: 10.1038/s41612-019-0095-3.
Liu, M., Y. Shen, Y. Qi, Y. Wang, and X. Geng, 2019b: Changes in Precipitation and Drought Extremes over the Past Half Century in China. Atmosphere, 10(4), 203, doi: 10.3390/atmos10040203.
Liu, Q., A. Babanin, S. Zieger, I.R. Young, and C. Guan, 2016: Wind and wave climate in the Arctic Ocean as observed by altimeters. Journal of Climate, 29(22), 7957–7975, doi: 10.1175/jcli-d-16-0219.1.
Liu, T. et al., 2014: Extraordinary hydro-climatic events during 1800–1600 yr BP in the Jin–Shaan Gorges along the middle Yellow River, China. Palaeogeography, Palaeoclimatology, Palaeoecology, 410, 143–152, doi: 10.1016/j.palaeo.2014.05.039.
Liu, W. and F. Sun, 2016: Assessing estimates of evaporative demand in climate models using observed pan evaporation over China. Journal of Geophysical Research: Atmospheres, 121(14), 8329–8349, doi: 10.1002/2016jd025166.
Liu, W. and F. Sun, 2017: Projecting and Attributing Future Changes of Evaporative Demand over China in CMIP5 Climate Models. Journal of Hydrometeorology, 18(4), 977–991, doi: 10.1175/jhm-d-16-0204.1.
Liu, Y., G. Wu, R. Guo, and R. Wan, 2016: Changing landscapes by damming: the Three Gorges Dam causes downstream lake shrinkage and severe droughts. Landscape Ecology, 31(8), 1883–1890, doi: 10.1007/s10980-016-0391-9.
Liu, Y. et al., 2015: Agriculture intensifies soil moisture decline in Northern China. Scientific Reports, 5(1), 11261, doi: 10. 1038/srep11261.
Liuzzo, L., F. Viola, and L. Noto, 2016: Wind speed and temperature trends impacts on reference evapotranspiration in Southern Italy. Theoretical and Applied Climatology, 123(1–2), 43–62, doi: 10.1007/s00704-014-1342-5.
Livneh, B. and A.M. Badger, 2020: Drought less predictable under declining future snowpack. Nature Climate Change, 10(5), 452–458, doi: 10.1038/s41558-020-0754-8.
Llasat, M.C., R. Marcos, M. Turco, J. Gilabert, and M. Llasat-Botija, 2016: Trends in flash flood events versus convective precipitation in the Mediterranean region: The case of Catalonia. Journal of Hydrology, 541, 24–37, doi: 10.1016/j.jhydrol.2016.05.040.
Lloyd-Hughes, B., 2014: The impracticality of a universal drought definition. Theoretical and Applied Climatology, 117(3–4), 607–611, doi: 10.1007/s00704-013-1025-7.
Lok, C.C.F. and J.C.L. Chan, 2018: Changes of tropical cyclone landfalls in South China throughout the twenty-first century. Climate Dynamics, 51(7), 2467–2483, doi: 10.1007/s00382-017-4023-0.
López-Franca, N., P.G. Zaninelli, A.F. Carril, C.G. Menéndez, and E. Sánchez, 2016: Changes in temperature extremes for 21st century scenarios over South America derived from a multi-model ensemble of regional climate models. Climate Research, 68(2–3), 151–167, doi: 10.3354/cr01393.
Lorenz, R., Z. Stalhandske, and E.M. Fischer, 2019: Detection of a Climate Change Signal in Extreme Heat, Heat Stress, and Cold in Europe From Observations. Geophysical Research Letters, 46(14), 8363–8374, doi: 10.1029/2019gl082062.
Lorenz, R. et al., 2016: Influence of land–atmosphere feedbacks on temperature and precipitation extremes in the GLACE-CMIP5 ensemble. Journal of Geophysical Research: Atmospheres, 121(2), 607–623, doi: 10.1002/2015jd024053.
Lorenzo-Lacruz, J., C. Garcia, and E. Morán-Tejeda, 2017: Groundwater level responses to precipitation variability in Mediterranean insular aquifers. Journal of Hydrology, 552, 516–531, doi: 10.1016/j.jhydrol.2017.07.011.
Lorenzo-Lacruz, J., E. Morán-Tejeda, S.M. Vicente-Serrano, and J.I. López-Moreno, 2013: Streamflow droughts in the Iberian Peninsula between 1945 and 2005: spatial and temporal patterns. Hydrology and Earth System Sciences, 17(1), 119–134, doi: 10.5194/hess-17-119-2013.
Lott, F.C. and P.A. Stott, 2016: Evaluating Simulated Fraction of Attributable Risk Using Climate Observations. Journal of Climate, 29(12), 4565–4575, doi: 10.1175/jcli-d-15-0566.1.
Lott, F.C., N. Christidis, and P.A. Stott, 2013: Can the 2011 East African drought be attributed to human-induced climate change?Geophysical Research Letters, 40(6), 1177–1181, doi: 10. 1002/grl.50235.
Louise, B., D. Cayan, G. Franco, L. Fisher, and S. Ziaja, 2018: Statewide Summary Report. In: California’s Fourth Climate Change Assessment. SUM-CCCA4-2018-013, California Governor’s Office of Planning and Research, Scripps Institution of Oceanography, California Energy Commission, California Public Utilities Commission, pp. 1–133, www.energy.ca.gov/sites/default/files/2019-11/Statewide_Reports-SUM-CCCA4-2018-013_Statewide_Summary_Report_ADA.pdf .
Lovino, M.A., O. Müller, E.H. Berbery, and G. Müller, 2018: How have daily climate extremes changed in the recent past over northeastern Argentina?Global and Planetary Change, 168, 78–97, doi: 10.1016/j.gloplacha.2018.06.008.
Lu, C., Y. Sun, and X. Zhang, 2018: Multimodel detection and attribution of changes in warm and cold spell durations. Environmental Research Letters, 13(7), 074013, doi: 10.1088/1748-9326/aacb3e.
Lu, C., Y. Sun, H. Wan, X. Zhang, and H. Yin, 2016: Anthropogenic influence on the frequency of extreme temperatures in China. Geophysical Research Letters, 43(12), 6511–6518, doi: 10.1002/2016gl069296.
Lu, J., G.J. Carbone, and J.M. Grego, 2019: Uncertainty and hotspots in 21st century projections of agricultural drought from CMIP5 models. Scientific Reports, 9(1), 4922, doi: 10.1038/s41598-019-41196-z.
Lucas, C., B. Timbal, and H. Nguyen, 2014: The expanding tropics: a critical assessment of the observational and modeling studies. WIREs Climate Change, 5(1), 89–112, doi: 10.1002/wcc.251.
Luo, M. and N.-C. Lau, 2016: Heat Waves in Southern China: Synoptic Behavior, Long-Term Change, and Urbanization Effects. Journal of Climate, 30(2), 703–720, doi: 10.1175/jcli-d-16-0269.1.
Luterbacher, J. et al., 2016: European summer temperatures since Roman times. Environmental Research Letters, 11(2), 024001, doi: 10.1088/1748-9326/11/2/024001.
Ma, S., T. Zhou, A. Dai, and Z. Han, 2015: Observed Changes in the Distributions of Daily Precipitation Frequency and Amount over China from 1960 to 2013. Journal of Climate, 28(17), 6960–6978, doi: 10.1175/jcli-d-15-0011.1.
Ma, S. et al., 2017: Detectable Anthropogenic Shift toward Heavy Precipitation over Eastern China. Journal of Climate, 30(4), 1381–1396, doi: 10.1175/jcli-d-16-0311.1.
Macdonald, N. and H. Sangster, 2017: High-magnitude flooding across Britain since AD 1750. Hydrology and Earth System Sciences, 21(3), 1631–1650, doi: 10.5194/hess-21-1631-2017.
Maček, U., N. Bezak, and M. Šraj, 2018: Reference evapotranspiration changes in Slovenia, Europe. Agricultural and Forest Meteorology, 260–261, 183–192, doi: 10.1016/j.agrformet.2018.06.014.
Madhura, R.K., R. Krishnan, J. Revadekar, M. Mujumdar, and B.N. Goswami, 2015: Changes in western disturbances over the Western Himalayas in a warming environment. Climate Dynamics, 44(3), 1157–1168, doi: 10.1007/s00382-014-2166-9.
Madsen, H., D. Lawrence, M. Lang, M. Martinkova, and T.R. Kjeldsen, 2014: Review of trend analysis and climate change projections of extreme precipitation and floods in Europe. Journal of Hydrology, 519, 3634–3650, doi: 10.1016/j.jhydrol.2014.11.003.
Maggioni, V., P.C. Meyers, and M.D. Robinson, 2016: A Review of Merged High-Resolution Satellite Precipitation Product Accuracy during the Tropical Rainfall Measuring Mission (TRMM) Era. Journal of Hydrometeorology, 17(4), 1101–1117, doi: 10.1175/jhm-d-15-0190.1.
Magnusson, L. et al., 2014: Evaluation of Medium-Range Forecasts for Hurricane Sandy. Monthly Weather Review, 142(5), 1962–1981, doi: 10.1175/mwr-d-13-00228.1.
Mahoney, K., 2020: Extreme Hail Storms and Climate Change: Foretelling the Future In Tiny, Turbulent Crystal Balls?Bulletin of the American Meteorological Society, 95(9), S17–S22, doi: 10.1175/bams-d-19-0233.1.
Mahoney, K., M.A. Alexander, G. Thompson, J.J. Barsugli, and J.D. Scott, 2012: Changes in hail and flood risk in high-resolution simulations over Colorado’s mountains. Nature Climate Change, 2(2), 125–131, doi: 10.1038/nclimate1344.
Mahony, C.R. and A.J. Cannon, 2018: Wetter summers can intensify departures from natural variability in a warming climate. Nature Communications, 9(1), 783, doi: 10.1038/s41467-018-03132-z.
Mahto, S.S. and V. Mishra, 2019: Does ERA-5 Outperform Other Reanalysis Products for Hydrologic Applications in India?Journal of Geophysical Research: Atmospheres, 124(16), 9423–9441, doi: 10.1029/2019jd031155.
Maier, N., L. Breuer, A. Chamorro, P. Kraft, and T. Houska, 2018: Multi-Source Uncertainty Analysis in Simulating Floodplain Inundation under Climate Change. Water, 10(6), 809, doi: 10. 3390/w10060809.
Maksimović, Č. et al., 2009: Overland flow and pathway analysis for modelling of urban pluvial flooding. Journal of Hydraulic Research, 47(4), 512–523, doi: 10.1080/00221686.2009.9522027.
Malik, N., B. Bookhagen, and P.J. Mucha, 2016: Spatiotemporal patterns and trends of Indian monsoonal rainfall extremes. Geophysical Research Letters, 43(4), 1710–1717, doi: 10.1002/2016gl067841.
Mallakpour, I. and G. Villarini, 2015: The changing nature of flooding across the central United States. Nature Climate Change, 5(3), 250–254, doi: 10.1038/nclimate2516.
Manda, A. et al., 2014: Impacts of a warming marginal sea on torrential rainfall organized under the Asian summer monsoon. Scientific Reports, 4, 1–6, doi: 10. 1038/srep05741.
Mangini, W. et al., 2018: Detection of trends in magnitude and frequency of flood peaks across Europe. Hydrological Sciences Journal, 63(4), 493–512, doi: 10.1080/02626667.2018.1444766.
Mankin, J.S., R. Seager, J.E. Smerdon, B.I. Cook, and A.P. Williams, 2019: Mid-latitude freshwater availability reduced by projected vegetation responses to climate change. Nature Geoscience, 12(12), 983–988, doi: 10.1038/s41561-019-0480-x.
Mann, M.E. and P.H. Gleick, 2015: Climate change and California drought in the 21st century. Proceedings of the National Academy of Sciences, 112(13), 3858–3859, doi: 10.1073/pnas.1503667112.
Mann, M.E. et al., 2017: Influence of Anthropogenic Climate Change on Planetary Wave Resonance and Extreme Weather Events. Scientific Reports, 7, 45242, doi: 10. 1038/srep45242.
Marciano, C.G., G.M. Lackmann, and W.A. Robinson, 2015: Changes in U.S. East Coast cyclone dynamics with climate change. Journal of Climate, 28(2), 468–484, doi: 10.1175/jcli-d-14-00418.1.
Marengo, J.A. and J.C. Espinoza, 2016: Extreme seasonal droughts and floods in Amazonia: causes, trends and impacts. International Journal of Climatology, 36(3), 1033–1050, doi: 10.1002/joc.4420.
Marengo, J.A., R.R. Torres, and L.M. Alves, 2017: Drought in Northeast Brazil – past, present, and future. Theoretical and Applied Climatology, 129(3–4), 1189–1200, doi: 10.1007/s00704-016-1840-8.
Marin, L. et al., 2014: An overview of annual climatic changes in Romania: Trends in air temperature, precipitation, sunshine hours, cloud cover, relative humidity and wind speed during the 1961–2013 period. Carpathian Journal of Earth and Environmental Sciences, 9(4), 253–258, www.cjees.ro/viewTopic.php?topicId=489.
Mariotti, A., Y. Pan, N. Zeng, and A. Alessandri, 2015: Long-term climate change in the Mediterranean region in the midst of decadal variability. Climate Dynamics, 44(5–6), 1437–1456, doi: 10.1007/s00382-015-2487-3.
Markonis, Y. et al., 2021: The rise of compound warm-season droughts in Europe. Science Advances, 7(6), eabb9668, doi: 10.1126/sciadv.abb9668.
Martens, B., W. Waegeman, W.A. Dorigo, N.E.C. Verhoest, and D.G. Miralles, 2018: Terrestrial evaporation response to modes of climate variability. npj Climate and Atmospheric Science, 1(1), 43, doi: 10.1038/s41612-018-0053-5.
Marthews, T.R., F.E.L. Otto, D. Mitchell, S.J. Dadson, and R.G. Jones, 2015: The 2014 Drought in the Horn of Africa: Attribution of Meteorological Drivers [in “Explaining Extreme Events of 2014 from a Climate Perspective”]. Bulletin of the American Meteorological Society, 96(12), S83–S88, doi: 10.1175/bams-d-15-00115.1.
Martin, E.R., 2018: Future Projections of Global Pluvial and Drought Event Characteristics. Geophysical Research Letters, 45(21), 11913–11920, doi: 10.1029/2018gl079807.
Martin, J.T. et al., 2020: Increased drought severity tracks warming in the United States’ largest river basin. Proceedings of the National Academy of Sciences, 117(21), 11328–11336, doi: 10.1073/pnas.1916208117.
Martinez-Austria, P. and E. Bandala, 2017: Temperature and Heat-Related Mortality Trends in the Sonoran and Mojave Desert Region. Atmosphere, 8(12), 53, doi: 10.3390/atmos8030053.
Martins, E.S.P.R. et al., 2018: A Multimethod Attribution Analysis of the Prolonged Northeast Brazil Hydrometeorological Drought (2012–16). Bulletin of the American Meteorological Society, 99(1), S65–S69, doi: 10.1175/bams-d-17-0102.1.
Martius, O., S. Pfahl, and C. Chevalier, 2016: A global quantification of compound precipitation and wind extremes. Geophysical Research Letters, 43(14), 7709–7717, doi: 10.1002/2016gl070017.
Marvel, K. et al., 2019: Twentieth-century hydroclimate changes consistent with human influence. Nature, 569(7754), 59–65, doi: 10.1038/s41586-019-1149-8.
Marx, A. et al., 2018: Climate change alters low flows in Europe under global warming of 1.5, 2, and 3°C. Hydrology and Earth System Sciences, 22(2), 1017–1032, doi: 10.5194/hess-22-1017-2018.
Marzin, C. et al., 2015: Singapore 2nd National Climate Change Study – Phase 1. Meteorological Service Singapore, Singapore, http://ccrs.weather.gov.sg/Publications-Second-National-Climate-Change-Study-Science-Reports/.
Mascioli, N.R., A.M. Fiore, M. Previdi, and G. Correa, 2016: Temperature and Precipitation Extremes in the United States: Quantifying the Responses to Anthropogenic Aerosols and Greenhouse Gases. Journal of Climate, 29(7), 2689–2701, doi: 10.1175/jcli-d-15-0478.1.
Massey, N. et al., 2012: Have the odds of warm November temperature and of cold December temperatures in central England changed? [in “Explaining Extreme Events of 2011 from a Climate Perspective”]. Bulletin of the American Meteorological Society, 93(7), 1057–1059, doi: 10.1175/bams-d-12-00021.1.
Masson-Delmotte, V. et al., 2013: Information from Paleoclimate Archives. In: Climate Change 2013: The Physical Science Basis. Contribution of Working Group I to the Fifth Assessment Report of the Intergovernmental Panel on Climate Change[Stocker, T.F., D. Qin, G.-K. Plattner, M. Tignor, S.K. Allen, J. Boschung, A. Nauels, Y. Xia, V. Bex, and P.M. Midgley (eds.)]. Cambridge University Press, Cambridge, United Kingdom and New York, NY, USA, pp. 383–464, doi: 10.1017/cbo9781107415324.013.
Mateo, C.M.R. et al., 2017: Impacts of spatial resolution and representation of flow connectivity on large-scale simulation of floods. Hydrology and Earth System Sciences, 21(10), 5143–5163, doi: 10.5194/hess-21-5143-2017.
Mathbout, S., J.A. Lopez-Bustins, J. Martin-Vide, J. Bech, and F.S. Rodrigo, 2018a: Spatial and temporal analysis of drought variability at several time scales in Syria during 1961–2012. Atmospheric Research, 200, 153–168, doi: 10.1016/j.atmosres.2017.09.016.
Mathbout, S. et al., 2018b: Observed Changes in Daily Precipitation Extremes at Annual Timescale Over the Eastern Mediterranean During 1961–2012. Pure and Applied Geophysics, 175(11), 3875–3890, doi: 10.1007/s00024-017-1695-7.
Matthes, H., A. Rinke, and K. Dethloff, 2015: Recent changes in Arctic temperature extremes: Warm and cold spells during winter and summer. Environmental Research Letters, 10(11), 114020, doi: 10.1088/1748-9326/10/11/114020.
Matthews, T.K.R., R.L. Wilby, and C. Murphy, 2017: Communicating the deadly consequences of global warming for human heat stress. Proceedings of the National Academy of Sciences, 114(15), 3861–3866, doi: 10.1073/pnas.1617526114.
Mátyás, C. and G. Sun, 2014: Forests in a water limited world under climate change. Environmental Research Letters, 9(8), 085001, doi: 10.1088/1748-9326/9/8/085001.
Maúre, G. et al., 2018: The southern African climate under 1.5°C and 2°C of global warming as simulated by CORDEX regional climate models. Environmental Research Letters, 13(6), 065002, doi: 10.1088/1748-9326/aab190.
Maxwell, R.M. and L.E. Condon, 2016: Connections between groundwater flow and transpiration partitioning. Science, 353(6297), 377–380, doi: 10.1126/science.aaf7891.
Mazdiyasni, O. et al., 2017: Increasing probability of mortality during Indian heat waves. Science Advances, 3(6), e1700066, doi: 10.1126/sciadv.1700066.
Mba, W.P. et al., 2018: Consequences of 1.5°C and 2°C global warming levels for temperature and precipitation changes over Central Africa. Environmental Research Letters, 13(5), 055011, doi: 10.1088/1748-9326/aab048.
Mbokodo, I., M.-J. Bopape, H. Chikoore, F. Engelbrecht, and N. Nethengwe, 2020: Heatwaves in the Future Warmer Climate of South Africa. Atmosphere, 11(7), 712, doi: 10.3390/atmos11070712.
Mcbride, J. et al., 2015: The 2014 Record Dry Spell at Singapore: An Intertropical Convergence Zone (ITCZ) Drought. Bulletin of the American Meteorological Society, 96(12), S126–S130, doi: 10.1175/bams-d-15-00117.1.
McCollum, D.L., A. Gambhir, J. Rogelj, and C. Wilson, 2020: Energy modellers should explore extremes more systematically in scenarios. Nature Energy, 5(2), 104–107, doi: 10.1038/s41560-020-0555-3.
McDowell, N.G. and C.D. Allen, 2015: Darcy’s law predicts widespread forest mortality under climate warming. Nature Climate Change, 5(7), 669–672, doi: 10.1038/nclimate2641.
McDowell, N.G. et al., 2016: Multi-scale predictions of massive conifer mortality due to chronic temperature rise. Nature Climate Change, 6(3), 295–300, doi: 10.1038/nclimate2873.
McDowell, N.G. et al., 2020: Pervasive shifts in forest dynamics in a changing world. Science, 368(6494), eaaz9463, doi: 10.1126/science.aaz9463.
McEvoy, D.J. et al., 2016: The evaporative demand drought index. Part II: CONUS-wide assessment against common drought indicators. Journal of Hydrometeorology, 17(6), 1763–1779, doi: 10.1175/jhm-d-15-0122.1.
McGree, S. et al., 2019: Recent Changes in Mean and Extreme Temperature and Precipitation in the Western Pacific Islands. Journal of Climate, 32(16), 4919–4941, doi: 10.1175/jcli-d-18-0748.1.
McInnes, K.L. et al., 2014: Quantifying storm tide risk in Fiji due to climate variability and change. Global and Planetary Change, 116, 115–129, doi: 10.1016/j.gloplacha.2014.02.004.
McInnes, K.L. et al., 2016: Natural hazards in Australia: sea level and coastal extremes. Climatic Change, 139(1), 69–83, doi: 10.1007/s10584-016-1647-8.
McKenzie, D. and J.S. Littell, 2017: Climate change and the eco-hydrology of fire: Will area burned increase in a warming western USA. Ecological Applications, 27(1), 26–36, doi: 10.1002/eap.1420.
McLean, N.M., T.S. Stephenson, M.A. Taylor, and J.D. Campbell, 2015: Characterization of Future Caribbean Rainfall and Temperature Extremes across Rainfall Zones. Advances in Meteorology, 2015, 1–18, doi: 10.1155/2015/425987.
McMahon, T.A., M.C. Peel, L. Lowe, R. Srikanthan, and T.R. McVicar, 2013: Estimating actual, potential, reference crop and pan evaporation using standard meteorological data: A pragmatic synthesis. Hydrology and Earth System Sciences, 17(4), 1331–1363, doi: 10.5194/hess-17-1331-2013.
McVicar, T.R., M.L. Roderick, R.J. Donohue, and T.G. Van Niel, 2012a: Less bluster ahead? ecohydrological implications of global trends of terrestrial near-surface wind speeds. Ecohydrology, 5(4), 381–388, doi: 10.1002/eco.1298.
McVicar, T.R. et al., 2012b: Global review and synthesis of trends in observed terrestrial near-surface wind speeds: Implications for evaporation. Journal of Hydrology, 416–417, 182–205, doi: 10.1016/j.jhydrol.2011.10.024.
MedECC, 2020: MedECC 2020 Summary for Policymakers. In: Climate and Environmental Change in the Mediterranean Basin – Current Situation and Risks for the Future. First Mediterranean Assessment Report[Cramer, W., J. Guiot, K. Marini, M. Balzan, S. Cherif, E. Doblas-Miranda, and M.J.P. Dos Santos (eds.)]. Union for the Mediterranean, Plan Bleu, UNEP/MAP, Marseille, France, pp. 11–40, www.medecc.org/first-mediterranean-assessment-report-mar1/.
Mediero, L. et al., 2015: Identification of coherent flood regions across Europe by using the longest streamflow records. Journal of Hydrology, 528, 341–360, doi: 10.1016/j.jhydrol.2015.06.016.
Meehl, G.A., C. Tebaldi, and D. Adams-Smith, 2016: US daily temperature records past, present, and future. Proceedings of the National Academy of Sciences, 113(49), 13977–13982, doi: 10.1073/pnas.1606117113.
Mei, W. and S.P. Xie, 2016: Intensification of landfalling typhoons over the northwest Pacific since the late 1970s. Nature Geoscience, 9(10), 753–757, doi: 10.1038/ngeo2792.
Mekis, É, L.A. Vincent, M.W. Shephard, and X. Zhang, 2015: Observed Trends in Severe Weather Conditions Based on Humidex, Wind Chill, and Heavy Rainfall Events in Canada for 1953–2012. Atmosphere-Ocean, 53(4), 383–397, doi: 10.1080/07055900.2015.1086970.
Menezes-Silva, P.E. et al., 2019: Different ways to die in a changing world: Consequences of climate change for tree species performance and survival through an ecophysiological perspective. Ecology and Evolution, 9(20), 11979–11999, doi: 10. 1002/ece3.5663.
Menkes, C.E. et al., 2012: Comparison of tropical cyclogenesis indices on seasonal to interannual timescales. Climate Dynamics, 38(1), 301–321, doi: 10.1007/s00382-011-1126-x.
Meredith, E.P., V.A. Semenov, D. Maraun, W. Park, and A. Chernokulsky, 2015: Crucial role of Black Sea warming in amplifying the 2012 Krymsk precipitation extreme. Nature Geoscience, 8(8), 615–619, doi: 10.1038/ngeo2483.
Mernild, S.H., E. Hanna, J.C. Yde, J. Cappelen, and J.K. Malmros, 2014: Coastal Greenland air temperature extremes and trends 1890–2010: annual and monthly analysis. International Journal of Climatology, 34(5), 1472–1487, doi: 10.1002/joc.3777.
Meseguer-Ruiz, O., P.I. Ponce-Philimon, A.S. Quispe-Jofré, J.A. Guijarro, and P. Sarricolea, 2018: Spatial behaviour of daily observed extreme temperatures in Northern Chile (1966–2015): data quality, warming trends, and its orographic and latitudinal effects. Stochastic Environmental Research and Risk Assessment, 32(12), 3503–3523, doi: 10.1007/s00477-018-1557-6.
MfE, 2018: Climate Change Projections for New Zealand: Atmosphere Projections Based on Simulations from the IPCC Fifth Assessment, 2nd Edition. New Zealand Ministry for the Environment (MfE), Wellington, NZ, 131 pp., www.mfe.govt.nz/sites/default/files/media/Climate Change/climate-projections-snapshot.pdf .
MfE and Stats NZ, 2020: New Zealand’s Environmental Reporting Series: Our atmosphere and climate 2020. ME 1523, New Zealand Ministry for the Environment (MfE) and Stats NZ, 84 pp., www.mfe.govt.nz/publications/environmental-reporting/our-atmosphere-and-climate-2020.
Michaelis, A.C., J. Willison, G.M. Lackmann, and W.A. Robinson, 2017: Changes in winter North Atlantic extratropical cyclones in high-resolution regional pseudo–global warming simulations. Journal of Climate, 30(17), 6905–6925, doi: 10.1175/jcli-d-16-0697.1.
Miglietta, M.M. and R. Rotunno, 2019: Development mechanisms for Mediterranean tropical-like cyclones (medicanes). Quarterly Journal of the Royal Meteorological Society, 145(721), 1444–1460, doi: 10.1002/qj.3503.
Milly, P.C.D. and K.A. Dunne, 2016: Potential evapotranspiration and continental drying. Nature Climate Change, 6(10), 946–949, doi: 10.1038/nclimate3046.
Milly, P.C.D. and K.A. Dunne, 2020: Colorado River flow dwindles as warming-driven loss of reflective snow energizes evaporation. Science, 367(6483), 1252–1255, doi: 10.1126/science.aax0194.
Min, S.-K. et al., 2020: Quantifying Human Impact on the 2018 Summer Longest Heat Wave in South Korea. Bulletin of the American Meteorological Society, 101(1), S103–S108, doi: 10.1175/bams-d-19-0151.1.
Miralles, D.G., A.J. Teuling, C.C. Van Heerwaarden, and J.V.G. De Arellano, 2014a: Mega-heatwave temperatures due to combined soil desiccation and atmospheric heat accumulation. Nature Geoscience, 7(5), 345–349, doi: 10.1038/ngeo2141.
Miralles, D.G., P. Gentine, S.I. Seneviratne, and A.J. Teuling, 2019: Land-atmospheric feedbacks during droughts and heatwaves: state of the science and current challenges. Annals of the New York Academy of Sciences, 1436(1), 19–35, doi: 10.1111/nyas.13912.
Miralles, D.G. et al., 2014b: El Niño–La Niña cycle and recent trends in continental evaporation. Nature Climate Change, 4(2), 122–126, doi: 10.1038/nclimate2068.
Mishra, V., 2020: Long-term (1870–2018) drought reconstruction in context of surface water security in India. Journal of Hydrology, 580, 124228, doi: 10.1016/j.jhydrol.2019.124228.
Mishra, V., R. Shah, and B. Thrasher, 2014a: Soil Moisture Droughts under the Retrospective and Projected Climate in India. Journal of Hydrometeorology, 15(6), 2267–2292, doi: 10.1175/jhm-d-13-0177.1.
Mishra, V., S. Mukherjee, R. Kumar, and D.A. Stone, 2017: Heat wave exposure in India in current, 1.5°C, and 2.0°C worlds. Environmental Research Letters, 12(12), 124012, doi: 10.1088/1748-9326/aa9388.
Mishra, V. et al., 2014b: Reliability of regional and global climate models to simulate precipitation extremes over India. Journal of Geophysical Research: Atmospheres, 119(15), 9301–9323, doi: 10.1002/2014jd021636.
Mitchell, P.J., A.P. O’Grady, K.R. Hayes, and E.A. Pinkard, 2014: Exposure of trees to drought-induced die-off is defined by a common climatic threshold across different vegetation types. Ecology and Evolution, 4(7), 1088–1101, doi: 10. 1002/ece3.1008.
Mitchell, T.D., 2003: Pattern Scaling. An Examination of the Accuracy of the Technique for Describing Future Climates. Climatic Change, 60(3), 217–242, doi: 10.1023/a:1026035305597.
Mizuta, R. and H. Endo, 2020: Projected Changes in Extreme Precipitation in a 60-km AGCM Large Ensemble and Their Dependence on Return Periods. Geophysical Research Letters, 47(13), 1–8, doi: 10.1029/2019gl086855.
Mo, K.C. and D.P. Lettenmaier, 2018: Drought variability and trends over the central United States in the instrumental record. Journal of Hydrometeorology, 19(7), 1149–1166, doi: 10.1175/jhm-d-17-0225.1.
Moftakhari, H.R., G. Salvadori, A. AghaKouchak, B.F. Sanders, and R.A. Matthew, 2017: Compounding effects of sea level rise and fluvial flooding. Proceedings of the National Academy of Sciences, 114(37), 9785–9790, doi: 10.1073/pnas.1620325114.
Mohammed, R. and M. Scholz, 2016: Impact of climate variability and streamflow alteration on groundwater contribution to the base flow of the Lower Zab River (Iran and Iraq). Environmental Earth Sciences, 75(21), 1392, doi: 10.1007/s12665-016-6205-1.
Molina, M.O., E. Sánchez, and C. Gutiérrez, 2020: Future heat waves over the Mediterranean from an Euro-CORDEX regional climate model ensemble. Scientific Reports, 10(1), 8801, doi: 10.1038/s41598-020-65663-0.
Molnar, P., S. Fatichi, L. Gaál, J. Szolgay, and P. Burlando, 2015: Storm type effects on super Clausius–Clapeyron scaling of intense rainstorm properties with air temperature. Hydrology and Earth System Sciences, 19(4), 1753–1766, doi: 10.5194/hess-19-1753-2015.
Monjo, R., E. Gaitán, J. Pórtoles, J. Ribalaygua, and L. Torres, 2016: Changes in extreme precipitation over Spain using statistical downscaling of CMIP5 projections. International Journal of Climatology, 36(2), 757–769, doi: 10.1002/joc.4380.
Montero-Martínez, M.J., J.S. Santana-Sepúlveda, N.I. Pérez-Ortiz, Pita-Díaz, and S. Castillo-Liñan, 2018: Comparing climate change indices between a northern (arid) and a southern (humid) basin in Mexico during the last decades. Advances in Science and Research, 15, 231–237, doi: 10.5194/asr-15-231-2018.
Moon, H., L. Gudmundsson, and S.I. Seneviratne, 2018: Drought Persistence Errors in Global Climate Models. Journal of Geophysical Research: Atmospheres, 123(7), 3483–3496, doi: 10.1002/2017jd027577.
Moon, H., B.P. Guillod, L. Gudmundsson, and S.I. Seneviratne, 2019: Soil Moisture Effects on Afternoon Precipitation Occurrence in Current Climate Models. Geophysical Research Letters, 46(3), 1861–1869, doi: 10.1029/2018gl080879.
Moon, I.-J., S.-H. Kim, P. Klotzbach, and J.C.L. Chan, 2015: Roles of interbasin frequency changes in the poleward shifts of the maximum intensity location of tropical cyclones. Environmental Research Letters, 10(10), 104004, doi: 10.1088/1748-9326/10/10/104004.
Moon, I.-J., S.-H. Kim, P. Klotzbach, and J.C.L. Chan, 2016: Reply to Comment on ‘Roles of interbasin frequency changes in the poleward shifts of maximum intensity location of tropical cyclones’. Environmental Research Letters, 11(6), 068002, doi: 10.1088/1748-9326/11/6/068002.
Moon, Y. et al., 2020: Azimuthally Averaged Wind and Thermodynamic Structures of Tropical Cyclones in Global Climate Models and Their Sensitivity to Horizontal Resolution. Journal of Climate, 33(4), 1575–1595, doi: 10.1175/jcli-d-19-0172.1.
Moore, G.W.K., 2016: The December 2015 North Pole Warming Event and the Increasing Occurrence of Such Events. Scientific Reports, 6(1), 39804, doi: 10. 1038/srep39084.
Mora, C. et al., 2018: Broad threat to humanity from cumulative climate hazards intensified by greenhouse gas emissions. Nature Climate Change, 8(12), 1062–1071, doi: 10.1038/s41558-018-0315-6.
Moravec, V., Y. Markonis, O. Rakovec, R. Kumar, and M. Hanel, 2019: A 250-Year European Drought Inventory Derived From Ensemble Hydrologic Modeling. Geophysical Research Letters, 46(11), 5909–5917, doi: 10.1029/2019gl082783.
Morgan, J.A. et al., 2011: C4grasses prosper as carbon dioxide eliminates desiccation in warmed semi-arid grassland. Nature, 476(7359), 202–205, doi: 10.1038/nature10274.
Mori, N., N. Ariyoshi, T. Shimura, T. Miyashita, and J. Ninomiya, 2021: Future projection of maximum potential storm surge height at three major bays in Japan using the maximum potential intensity of a tropical cyclone. Climatic Change, 164(3), 25, doi: 10.1007/s10584-021-02980-x.
Mori, N. et al., 2019: Future changes in extreme storm surges based on mega-ensemble projection using 60-km resolution atmospheric global circulation model. Coastal Engineering Journal, 61(3), 295–307, doi: 10.1080/21664250.2019.1586290.
Moron, V., B. Oueslati, B. Pohl, S. Rome, and S. Janicot, 2016: Trends of mean temperatures and warm extremes in northern tropical Africa (1961–2014) from observed and PPCA-reconstructed time series. Journal of Geophysical Research: Atmospheres, 121(10), 5298–5319, doi: 10.1002/2015jd024303.
Morrison, A., G. Villarini, W. Zhang, and E. Scoccimarro, 2019: Projected changes in extreme precipitation at sub-daily and daily time scales. Global and Planetary Change, 182, 103004, doi: 10.1016/j.gloplacha.2019.103004.
Mostafa, A.N. et al., 2019: Past (1950–2017) and future (–2100) temperature and precipitation trends in Egypt. Weather and Climate Extremes, 26, 100225, doi: 10.1016/j.wace.2019.100225.
Mote, P.W. et al., 2016: Perspectives on the causes of exceptionally low 2015 snowpack in the western United States. Geophysical Research Letters, 43(20), 10980–10988, doi: 10.1002/2016gl069965.
Mouhamed, L., S.B. Traore, A. Alhassane, and B. Sarr, 2013: Evolution of some observed climate extremes in the West African Sahel. Weather and Climate Extremes, 1, 19–25, doi: 10.1016/j.wace.2013.07.005.
Mozny, M. et al., 2020: Past (1971–2018) and future (2021–2100) pan evaporation rates in the Czech Republic. Journal of Hydrology, 590, 125390, doi: 10.1016/j.jhydrol.2020.125390.
Mtongori, H.I., F. Stordal, and R.E. Benestad, 2016: Evaluation of Empirical Statistical Downscaling Models’ Skill in Predicting Tanzanian Rainfall and Their Application in Providing Future Downscaled Scenarios. Journal of Climate, 29(9), 3231–3252, doi: 10.1175/jcli-d-15-0061.1.
Mueller, B. and S. Seneviratne, 2014: Systematic land climate and evapotranspiration biases in CMIP5 simulations. Geophysical Research Letters, 41(1), 128–134, doi: 10.1002/2013gl058055.
Mueller, B. and X. Zhang, 2016: Causes of drying trends in northern hemispheric land areas in reconstructed soil moisture data. Climatic Change, 134(1–2), 255–267, doi: 10.1007/s10584-015-1499-7.
Mueller, B., X. Zhang, and F.W. Zwiers, 2016: Historically hottest summers projected to be the norm for more than half of the world’s population within 20 years. Environmental Research Letters, 11(4), 1–15, doi: 10.1088/1748-9326/11/4/044011.
Mueller, N.D. et al., 2016: Cooling of US Midwest summer temperature extremes from cropland intensification. Nature Climate Change, 6(3), 317–322, doi: 10.1038/nclimate2825.
Muerth, M.J. et al., 2013: On the need for bias correction in regional climate scenarios to assess climate change impacts on river runoff. Hydrology and Earth System Sciences, 17(3), 1189–1204, doi: 10.5194/hess-17-1189-2013.
Mukherjee, S., A. Mishra, and K.E. Trenberth, 2018a: Climate Change and Drought: a Perspective on Drought Indices. Current Climate Change Reports, 4(2), 145–163, doi: 10.1007/s40641-018-0098-x.
Mukherjee, S., S. Aadhar, D. Stone, and V. Mishra, 2018b: Increase in extreme precipitation events under anthropogenic warming in India. Weather and Climate Extremes, 20, 45–53, doi: 10.1016/j.wace.2018.03.005.
Muller, J., J.M. Collins, S. Gibson, and L. Paxton, 2017: Recent Advances in the Emerging Field of Paleotempestology. In: Hurricanes and Climate Change: Volume 3[Collins, J.M. and K. Walsh (eds.)]. Springer, Cham, Switzerland, pp. 1–33, doi: 10.1007/978-3-319-47594-3_1.
Müller, W.A., L. Borchert, and R. Ghosh, 2020: Observed Subdecadal Variations of European Summer Temperatures. Geophysical Research Letters, 47(1), e2019GL086043, doi: 10.1029/2019gl086043.
Murakami, H., T. Li, and P.C. Hsu, 2014: Contributing factors to the recent high level of accumulated cyclone energy (ACE) and power dissipation index (PDI) in the North Atlantic. Journal of Climate, 27(8), 3023–3034, doi: 10.1175/jcli-d-13-00394.1.
Murakami, H., G.A. Vecchi, and S. Underwood, 2017a: Increasing frequency of extremely severe cyclonic storms over the Arabian Sea. Nature Climate Change, 7(12), 885–889, doi: 10.1038/s41558-017-0008-6.
Murakami, H., E. Levin, T.L. Delworth, R. Gudgel, and P.-C. Hsu, 2018: Dominant effect of relative tropical Atlantic warming on major hurricane occurrence. Science, 362(6416), 794–799, doi: 10.1126/science.aat6711.
Murakami, H. et al., 2012: Future changes in tropical cyclone activity projected by the new high-resolution MRI-AGCM. Journal of Climate, 25(9), 3237–3260, doi: 10.1175/jcli-d-11-00415.1.
Murakami, H. et al., 2015: Simulation and prediction of category 4 and 5 hurricanes in the high-resolution GFDL HiFLOR coupled climate model. Journal of Climate, 28(23), 9058–9079, doi: 10.1175/jcli-d-15-0216.1.
Murakami, H. et al., 2017b: Dominant Role of Subtropical Pacific Warming in Extreme Eastern Pacific Hurricane Seasons: 2015 and the Future. Journal of Climate, 30(1), 243–264, doi: 10.1175/jcli-d-16-0424.1.
Murakami, H. et al., 2020: Detected climatic change in global distribution of tropical cyclones. Proceedings of the National Academy of Sciences, 117(20), 10706–10714, doi: 10.1073/pnas.1922500117.
Muramatsu, T., T. Kato, M. Nakazato, H. Endo, and A. Kitoh, 2016: Future Change of Tornadogenesis-Favorable Environmental Conditions in Japan Estimated by a 20-km-Mesh Atmospheric General Circulation Model. Journal of the Meteorological Society of Japan. Series II, 94A, 105–120, doi: 10.2151/jmsj.2015-053.
Murari, K.K., S. Ghosh, A. Patwardhan, E. Daly, and K. Salvi, 2015: Intensification of future severe heat waves in India and their effect on heat stress and mortality. Regional Environmental Change, 15(4), 569–579, doi: 10.1007/s10113-014-0660-6.
Murata, A., H. Sasaki, H. Kawase, and M. Nosaka, 2017: Evaluation of precipitation over an oceanic region of Japan in convection-permitting regional climate model simulations. Climate Dynamics, 48(5–6), 1779–1792, doi: 10.1007/s00382-016-3172-x.
Murata, A. et al., 2015: Projection of Future Climate Change over Japan in Ensemble Simulations with a High-Resolution Regional Climate Model. SOLA, 11, 90–94, doi: 10.2151/sola.2015-022.
Myhre, G. et al., 2019: Frequency of extreme precipitation increases extensively with event rareness under global warming. Scientific Reports, 9(1), 16063, doi: 10.1038/s41598-019-52277-4.
Nabat, P., S. Somot, M. Mallet, A. Sanchez-Lorenzo, and M. Wild, 2014: Contribution of anthropogenic sulfate aerosols to the changing Euro-Mediterranean climate since 1980. Geophysical Research Letters, 41(15), 5605–5611, doi: 10.1002/2014gl060798.
Nackley, L.L. et al., 2018: CO2 enrichment does not entirely ameliorateVachellia karroodrought inhibition: A missing mechanism explaining savanna bush encroachment. Environmental and Experimental Botany, 155, 98–106, doi: 10.1016/j.envexpbot.2018.06.018.
Naik, M. and B.J. Abiodun, 2020: Projected changes in drought characteristics over the Western Cape, South Africa. Meteorological Applications, 27(1), e1802, doi: 10.1002/met.1802.
Nakaegawa, T., A. Kitoh, H. Murakami, and S. Kusunoki, 2014: Annual maximum 5-day rainfall total and maximum number of consecutive dry days over Central America and the Caribbean in the late twenty-firth century projected by an atmospheric general circulation model with three different horizontal resolutions. Theoretical and Applied Climatology, 116(1–2), 155–168, doi: 10.1007/s00704-013-0934-9.
Nakamura, J. et al., 2017: Western North Pacific Tropical Cyclone Model Tracks in Present and Future Climates. Journal of Geophysical Research: Atmospheres, 122(18), 9721–9744, doi: 10.1002/2017jd027007.
Nakano, M. et al., 2017: Global 7km mesh nonhydrostatic Model Intercomparison Project for improving TYphoon forecast (TYMIP-G7): Experimental design and preliminary results. Geoscientific Model Development, 10(3), 1368–1381, doi: 10.5194/gmd-10-1363-2017.
Nakayama, T. and D. Shankman, 2013: Impact of the Three-Gorges Dam and water transfer project on Changjiang floods. Global and Planetary Change, 100, 38–50, doi: 10.1016/j.gloplacha.2012.10.004.
Nangombe, S., T. Zho, L. Zhang, and W. Zhang, 2020: Attribution of the 2018 October–December Drought Over South Southern Africa. Bulletin of the American Meteorological Society, 101(1), S135–S140, doi: 10.1175/bams-d-19-0179.1.
Nangombe, S. et al., 2018: Record-breaking climate extremes in Africa under stabilized 1.5°C and 2°C global warming scenarios. Nature Climate Change, 8(5), 375–380, doi: 10.1038/s41558-018-0145-6.
NASEM, 2016: Attribution of Extreme Weather Events in the Context of Climate Change. National Academies of Sciences Engineering and Medicine (NASEM). The National Academies Press, Washington, DC, USA, 186 pp., doi: 10.17226/21852.
Nasim, W. et al., 2018: Future risk assessment by estimating historical heat wave trends with projected heat accumulation using SimCLIM climate model in Pakistan. Atmospheric Research, 205, 118–133, doi: 10.1016/j.atmosres.2018.01.009.
Nasrollahi, N. et al., 2015: How well do CMIP5 climate simulations replicate historical trends and patterns of meteorological droughts?Water Resources Research, 51(4), 2847–2864, doi: 10.1002/2014wr016318.
Nastos, P.T. and J. Kapsomenakis, 2015: Regional climate model simulations of extreme air temperature in Greece. Abnormal or common records in the future climate?Atmospheric Research, 152, 43–60, doi: 10.1016/j.atmosres.2014.02.005.
Naumann, G. et al., 2018: Global Changes in Drought Conditions Under Different Levels of Warming. Geophysical Research Letters, 45(7), 3285–3296, doi: 10.1002/2017gl076521.
Nayak, S. and K. Dairaku, 2016: Future changes in extreme precipitation intensities associated with temperature under SRES A1B scenario. Hydrological Research Letters, 10(4), 139–144, doi: 10.3178/hrl.10.139.
Nayak, S., K. Dairaku, I. Takayabu, A. Suzuki-Parker, and N.N. Ishizaki, 2017: Extreme precipitation linked to temperature over Japan: current evaluation and projected changes with multi-model ensemble downscaling. Climate Dynamics, 51(11), 1–17, doi: 10.1007/s00382-017-3866-8.
Nazrul Islam, M., M. Almazroui, R. Dambul, P.D. Jones, and A.O. Alamoudi, 2015: Long-term changes in seasonal temperature extremes over Saudi Arabia during 1981–2010. International Journal of Climatology, 35(7), 1579–1592, doi: 10.1002/joc.4078.
Neri, A., G. Villarini, L.J. Slater, and F. Napolitano, 2019: On the statistical attribution of the frequency of flood events across the U.S. Midwest. Advances in Water Resources, 127, 225–236, doi: 10.1016/j.advwatres.2019.03.019.
Neu, U. et al., 2013: IMILAST: A Community Effort to Intercompare Extratropical Cyclone Detection and Tracking Algorithms. Bulletin of the American Meteorological Society, 94(4), 529–547, doi: 10.1175/bams-d-11-00154.1.
Neukom, R. et al., 2014: Inter-hemispheric temperature variability over the past millennium. Nature Climate Change, 4(5), 362–367, doi: 10.1038/nclimate2174.
Neumann, B., A.T. Vafeidis, J. Zimmermann, and R.J. Nicholls, 2015: Future Coastal Population Growth and Exposure to Sea-Level Rise and Coastal Flooding – A Global Assessment. PLOS ONE, 10(3), e0118571, doi: 10.1371/journal.pone.0118571.
Newman, M., A.T. Wittenberg, L. Cheng, G.P. Compo, and C.A. Smith, 2018: The Extreme 2015/16 El Niño, in the Context of Historical Climate Variability and Change. Bulletin of the American Meteorological Society, 99(1), S16–S20, doi: 10.1175/bams-d-17-0116.1.
Nguvava, M., B.J. Abiodun, and F. Otieno, 2019: Projecting drought characteristics over East African basins at specific global warming levels. Atmospheric Research, 228, 41–54, doi: 10.1016/j.atmosres.2019.05.008.
Nicholson, S.E., 2017: Climate and climatic variability of rainfall over eastern Africa. Reviews of Geophysics, 55(3), 590–635, doi: 10.1002/2016rg000544.
Nicolai-Shaw, N., M. Hirschi, H. Mittelbach, and S.I. Seneviratne, 2015: Spatial representativeness of soil moisture using in situ, remote sensing, and land reanalysis data. Journal of Geophysical Research: Atmospheres, 120(19), 9955–9964, doi: 10.1002/2015jd023305.
Nie, J., A.H. Sobel, D.A. Shaevitz, and S. Wang, 2018: Dynamic amplification of extreme precipitation sensitivity. Proceedings of the National Academy of Sciences, 115(38), 9467–9472, doi: 10.1073/pnas.1800357115.
Nied, M. et al., 2014: On the relationship between hydro-meteorological patterns and flood types. Journal of Hydrology, 519, 3249–3262, doi: 10.1016/j.jhydrol.2014.09.089.
Nikulin, G. et al., 2018: The effects of 1.5 and 2 degrees of global warming on Africa in the CORDEX ensemble. Environmental Research Letters, 13(6), 065003, doi: 10.1088/1748-9326/aab1b1.
Niranjan Kumar, K., M. Rajeevan, D.S. Pai, A.K. Srivastava, and B. Preethi, 2013: On the observed variability of monsoon droughts over India. Weather and Climate Extremes, 1, 42–50, doi: 10.1016/j.wace.2013.07.006.
Nissen, K.M. and U. Ulbrich, 2017: Increasing frequencies and changing characteristics of heavy precipitation events threatening infrastructure in Europe under climate change. Natural Hazards and Earth System Sciences, 17(7), 1177–1190, doi: 10.5194/nhess-17-1177-2017.
Niu, X. et al., 2018: Ensemble evaluation and projection of climate extremes in China using RMIP models. International Journal of Climatology, 38(4), 2039–2055, doi: 10.1002/joc.5315.
Nolan, R.H. et al., 2020: Causes and consequences of eastern Australia’s 2019–20 season of mega-fires. Global Change Biology, 26(3), 1039–1041, doi: 10. 1111/gcb.14987.
Norrant, C. and A. Douguédroit, 2006: Monthly and daily precipitation trends in the Mediterranean (1950–2000). Theoretical and Applied Climatology, 83(1–4), 89–106, doi: 10.1007/s00704-005-0163-y.
Nott, J., S. Smithers, K. Walsh, and E. Rhodes, 2009: Sand beach ridges record 6000 year history of extreme tropical cyclone activity in northeastern Australia. Quaternary Science Reviews, 28(15–16), 1511–1520, doi: 10.1016/j.quascirev.2009.02.014.
O’Gorman, P.A., 2014: Contrasting responses of mean and extreme snowfall to climate change. Nature, 512(7515), 416–418, doi: 10.1038/nature13625.
Odoulami, R.C., B.J. Abiodun, and A.E. Ajayi, 2019: Modelling the potential impacts of afforestation on extreme precipitation over West Africa. Climate Dynamics, 52(3), 2185–2198, doi: 10.1007/s00382-018-4248-6.
Oey, L.-Y. and S.C. Chou, 2016: Evidence of rising and poleward shift of storm surge in western North Pacific in recent decades. Journal of Geophysical Research: Oceans, 121, 5181–5192, doi: 10.1002/2015jc011516.
Ogata, T., R. Mizuta, Y. Adachi, H. Murakami, and T. Ose, 2015: Effect of air–sea coupling on the frequency distribution of intense tropical cyclones over the northwestern Pacific. Geophysical Research Letters, 42(23), 10415–10421, doi: 10.1002/2015gl066774.
Ogata, T., R. Mizuta, Y. Adachi, H. Murakami, and T. Ose, 2016: Atmosphere–Ocean Coupling Effect on Intense Tropical Cyclone Distribution and its Future Change with 60 km-AOGCM. Scientific Reports, 6, 29800, doi: 10. 1038/srep29800.
Oguntunde, P.G., B.J. Abiodun, G. Lischeid, and A.A. Abatan, 2020: Droughts projection over the Niger and Volta River basins of West Africa at specific global warming levels. International Journal of Climatology, 40(13), 5688–5699, doi: 10.1002/joc.6544.
Oh, H., K.-J. Ha, and A. Timmermann, 2018: Disentangling Impacts of Dynamic and Thermodynamic Components on Late Summer Rainfall Anomalies in East Asia. Journal of Geophysical Research: Atmospheres, 123(16), 8623–8633, doi: 10.1029/2018jd028652.
Ohba, M. and S. Sugimoto, 2019: Differences in climate change impacts between weather patterns: possible effects on spatial heterogeneous changes in future extreme rainfall. Climate Dynamics, 52(7–8), 4177–4191, doi: 10.1007/s00382-018-4374-1.
Ohba, M. and S. Sugimoto, 2020: Impacts of climate change on heavy wet snowfall in Japan. Climate Dynamics, 54, 3151–3164, doi: 10.1007/s00382-020-05163-z.
Oizumi, T. et al., 2018: Ultra-High-Resolution Numerical Weather Prediction with a Large Domain Using the K Computer: A Case Study of the Izu Oshima Heavy Rainfall Event on October 15–16, 2013. Journal of the Meteorological Society of Japan. Series II, 96(1), 25–54, doi: 10.2151/jmsj.2018-006.
Olmo, M., M.L. Bettolli, and M. Rusticucci, 2020: Atmospheric circulation influence on temperature and precipitation individual and compound daily extreme events: Spatial variability and trends over southern South America. Weather and Climate Extremes, 29, 100267, doi: 10.1016/j.wace.2020.100267.
Olsson, J. and K. Foster, 2013: Short-term precipitation extremes in regional climate simulations for Sweden. Hydrology Research, 45(3), 479–489, doi: 10.2166/nh.2013.206.
Omondi, P.A. et al., 2014: Changes in temperature and precipitation extremes over the Greater Horn of Africa region from 1961 to 2010. International Journal of Climatology, 34(4), 1262–1277, doi: 10.1002/joc.3763.
Ongoma, V., H. Chen, and C. Gao, 2018a: Projected changes in mean rainfall and temperature over East Africa based on CMIP5 models. International Journal of Climatology, 38(3), 1375–1392, doi: 10.1002/joc.5252.
Ongoma, V., H. Chen, C. Gao, A.M. Nyongesa, and F. Polong, 2018b: Future changes in climate extremes over Equatorial East Africa based on CMIP5 multimodel ensemble. Natural Hazards, 90(2), 901–920, doi: 10.1007/s11069-017-3079-9.
Orlowsky, B. and S.I. Seneviratne, 2013: Elusive drought: Uncertainty in observed trends and short- and long-term CMIP5 projections. Hydrology and Earth System Sciences, 17(5), 1765–1781, doi: 10.5194/hess-17-1765-2013.
Ortega, J.A., L. Razola, and G. Garzón, 2014: Recent human impacts and change in dynamics and morphology of ephemeral rivers. Natural Hazards and Earth System Sciences, 14(3), 713–730, doi: 10.5194/nhess-14-713-2014.
Orth, R., J. Zscheischler, and S.I. Seneviratne, 2016a: Record dry summer in 2015 challenges precipitation projections in Central Europe. Scientific Reports, 6, 28334, doi: 10. 1038/srep28334.
Orth, R., M.M. Vogel, J. Luterbacher, C. Pfister, and S.I. Seneviratne, 2016b: Did European temperatures in 1540 exceed present-day records?Environmental Research Letters, 11(11), 114021, doi: 10.1088/1748-9326/11/11/114021.
Osima, S. et al., 2018: Projected climate over the Greater Horn of Africa under 1.5°C and 2°C global warming. Environmental Research Letters, 13(6), 065004, doi: 10.1088/1748-9326/aaba1b.
Otkin, J.A. et al., 2016: Assessing the evolution of soil moisture and vegetation conditions during the 2012 United States flash drought. Agricultural and Forest Meteorology, 218–219, 230–242, doi: 10.1016/j.agrformet.2015.12.065.
Otkin, J.A. et al., 2018: Flash droughts: A review and assessment of the challenges imposed by rapid-onset droughts in the United States. Bulletin of the American Meteorological Society, 99(5), 911–919, doi: 10.1175/bams-d-17-0149.1.
Otto, F.E.L., 2017: Attribution of Weather and Climate Events. Annual Review of Environment and Resources, 42(1), 627–646, doi: 10.1146/annurev-environ-102016-060847.
Otto, F.E.L., R.G. Jones, K. Halladay, and M.R. Allen, 2013: Attribution of changes in precipitation patterns in African rainforests. Philosophical Transactions of the Royal Society B: Biological Sciences, 368(1625), 20120299, doi: 10.1098/rstb.2012.0299.
Otto, F.E.L., N. Massey, G.J. van Oldenborgh, R.G. Jones, and M.R. Allen, 2012: Reconciling two approaches to attribution of the 2010 Russian heat wave. Geophysical Research Letters, 39(4), L04702, doi: 10.1029/2011gl050422.
Otto, F.E.L. et al., 2015a: Attribution of extreme weather events in Africa: a preliminary exploration of the science and policy implications. Climatic Change, 132(4), 531–543, doi: 10.1007/s10584-015-1432-0.
Otto, F.E.L. et al., 2015b: Factors Other Than Climate Change, Main Drivers of 2014/15 Water Shortage in Southeast Brazil. Bulletin of the American Meteorological Society, 96(12), S35–S40, doi: 10.1175/bams-d-15-00120.1.
Otto, F.E.L. et al., 2015c: Attribution analysis of high precipitation events in summer in England and Wales over the last decade. Climatic Change, 132(1), 77–91, doi: 10.1007/s10584-014-1095-2.
Otto, F.E.L. et al., 2016: The attribution question. Nature Climate Change, 6(9), 813–816, doi: 10.1038/nclimate3089.
Otto, F.E.L. et al., 2018a: Attributing high-impact extreme events across timescales – a case study of four different types of events. Climatic Change, 149(3–4), 399–412, doi: 10.1007/s10584-018-2258-3.
Otto, F.E.L. et al., 2018b: Climate change increases the probability of heavy rains in Northern England/Southern Scotland like those of storm Desmond – a real-time event attribution revisited. Environmental Research Letters, 13(2), 024006, doi: 10.1088/1748-9326/aa9663.
Otto, F.E.L. et al., 2018c: Anthropogenic influence on the drivers of the Western Cape drought 2015–2017. Environmental Research Letters, 13(12), 124010, doi: 10.1088/1748-9326/aae9f9.
Otto, F.E.L. et al., 2020: Challenges to Understanding Extreme Weather Changes in Lower Income Countries. Bulletin of the American Meteorological Society, 101(10), E1851–E1860, doi: 10.1175/bams-d-19-0317.1.
Ozturk, T., Z.P. Ceber, M. Türkeş, and M.L. Kurnaz, 2015: Projections of climate change in the Mediterranean Basin by using downscaled global climate model outputs. International Journal of Climatology, 35(14), 4276–4292, doi: 10.1002/joc.4285.
Paciorek, C.J., D.A. Stone, and M.F. Wehner, 2018: Quantifying statistical uncertainty in the attribution of human influence on severe weather. Weather and Climate Extremes, 20, 69–80, doi: 10.1016/j.wace.2018.01.002.
Padrón, R.S., L. Gudmundsson, and S.I. Seneviratne, 2019: Observational Constraints Reduce Likelihood of Extreme Changes in Multidecadal Land Water Availability. Geophysical Research Letters, 46(2), 736–744, doi: 10.1029/2018gl080521.
Padrón, R.S. et al., 2020: Observed changes in dry-season water availability attributed to human-induced climate change. Nature Geoscience, 13(7), 477–481, doi: 10.1038/s41561-020-0594-1.
Pai, D.S., L. Sridhar, M.R. Badwaik, and M. Rajeevan, 2015: Analysis of the daily rainfall events over India using a new long period (1901–2010) high resolution (0.25° × 0.25°) gridded rainfall data set. Climate Dynamics, 45(3–4), 755–776, doi: 10.1007/s00382-014-2307-1.
Paik, S. and S.-K. Min, 2018: Assessing the Impact of Volcanic Eruptions on Climate Extremes Using CMIP5 Models. Journal of Climate, 31(14), 5333–5349, doi: 10.1175/jcli-d-17-0651.1.
Paik, S. et al., 2020: Determining the Anthropogenic Greenhouse Gas Contribution to the Observed Intensification of Extreme Precipitation. Geophysical Research Letters, 47(12), e2019GL086875, doi: 10.1029/2019gl086875.
Pal, J.S. and E.A.B. Eltahir, 2016: Future temperature in southwest Asia projected to exceed a threshold for human adaptability. Nature Climate Change, 6(2), 197–200, doi: 10.1038/nclimate2833.
Palazzi, E., J. Hardenberg, and A. Provenzale, 2013: Precipitation in the Hindu-Kush Karakoram Himalaya: Observations and future scenarios. Journal of Geophysical Research: Atmospheres, 118(1), 85–100, doi: 10.1029/2012jd018697.
Palipane, E. and R. Grotjahn, 2018: Future Projections of the Large-Scale Meteorology Associated with California Heat Waves in CMIP5 Models. Journal of Geophysical Research: Atmospheres, 123, 8500–8517, doi: 10.1029/2018jd029000.
Pall, P., L.M. Tallaksen, and F. Stordal, 2019: A climatology of rain-on-snow events for Norway. Journal of Climate, 32(20), 6995–7016, doi: 10.1175/jcli-d-18-0529.1.
Pall, P. et al., 2017: Diagnosing conditional anthropogenic contributions to heavy Colorado rainfall in September 2013. Weather and Climate Extremes, 17, 1–6, doi: 10.1016/j.wace.2017.03.004.
Paltan, H., M. Allen, K. Haustein, L. Fuldauer, and S. Dadson, 2018: Global implications of 1.5°C and 2°C warmer worlds on extreme river flows. Environmental Research Letters, 13(9), 94003, doi: 10.1088/1748-9326/aad985.
Panisset, J.S. et al., 2018: Contrasting patterns of the extreme drought episodes of 2005, 2010 and 2015 in the Amazon Basin. International Journal of Climatology, 38(2), 1096–1104, doi: 10.1002/joc.5224.
Park, C. and S.-K. Min, 2019: Multi-RCM near-term projections of summer climate extremes over East Asia. Climate Dynamics, 52(7–8), 4937–4952, doi: 10.1007/s00382-018-4425-7.
Park, C. et al., 2016: Evaluation of multiple regional climate models for summer climate extremes over East Asia. Climate Dynamics, 46(7–8), 2469–2486, doi: 10.1007/s00382-015-2713-z.
Park Williams, A. et al., 2017: The 2016 Southeastern U.S. Drought: An Extreme Departure From Centennial Wetting and Cooling. Journal of Geophysical Research: Atmospheres, 122(20), 10888–10905, doi: 10.1002/2017jd027523.
Parker, H.R. et al., 2017: A comparison of model ensembles for attributing 2012 West African rainfall. Environmental Research Letters, 12(1), 14019, doi: 10.1088/1748-9326/aa5386.
Parker, T.J., G.J. Berry, M.J. Reeder, and N. Nicholls, 2014: Modes of climate variability and heat waves in Victoria, southeastern Australia. Geophysical Research Letters, 41(19), 6926–6934, doi: 10.1002/2014gl061736.
Pascale, S., S.B. Kapnick, T.L. Delworth, and W.F. Cooke, 2020: Increasing risk of another Cape Town “Day Zero” drought in the 21st century. Proceedings of the National Academy of Sciences, 117(47), 29495–29503, doi: 10.1073/pnas.2009144117.
Pascale, S., V. Lucarini, X. Feng, A. Porporato, and S. ul Hasson, 2016: Projected changes of rainfall seasonality and dry spells in a high greenhouse gas emissions scenario. Climate Dynamics, 46(3–4), 1331–1350, doi: 10.1007/s00382-015-2648-4.
Paschalis, A., S. Fatichi, P. Molnar, S. Rimkus, and P. Burlando, 2014: On the effects of small scale space–time variability of rainfall on basin flood response. Journal of Hydrology, 514, 313–327, doi: 10.1016/j.jhydrol.2014.04.014.
Patarčić, M., M. Gajić-Čapka, K. Cindrić, and C. Branković, 2014: Recent and near-future changes in precipitation-extreme indices over the Croatian Adriatic coast. Climate Research, 61(2), 157–176, doi: 10.3354/cr01250.
Patra, P.K. et al., 2017: The Orbiting Carbon Observatory (OCO-2) tracks 2–3 peta-gram increase in carbon release to the atmosphere during the 2014–2016 El Niño. Scientific Reports, 7(1), 13567, doi: 10.1038/s41598-017-13459-0.
Patricola, C.M. and M.F. Wehner, 2018: Anthropogenic influences on major tropical cyclone events. Nature, 563(7731), 339–346, doi: 10.1038/s41586-018-0673-2.
Patricola, C.M., R. Saravanan, and P. Chang, 2018: The Response of Atlantic Tropical Cyclones to Suppression of African Easterly Waves. Geophysical Research Letters, 45(1), 471–479, doi: 10.1002/2017gl076081.
Pattanayak, S., R.S. Nanjundiah, and D.N. Kumar, 2017: Linkage between global sea surface temperature and hydroclimatology of a major river basin of India before and after 1980. Environmental Research Letters, 12(12), 124002, doi: 10.1088/1748-9326/aa9664.
Paul, S. et al., 2018: Increased Spatial Variability and Intensification of Extreme Monsoon Rainfall due to Urbanization. Scientific Reports, 8(1), 3918, doi: 10.1038/s41598-018-22322-9.
Paulo, A., D. Martins, and L.S. Pereira, 2016: Influence of Precipitation Changes on the SPI and Related Drought Severity. An Analysis Using Long-Term Data Series. Water Resources Management, 30(15), 5737–5757, doi: 10.1007/s11269-016-1388-5.
Paxian, A. et al., 2014: Present-day and future mediterranean precipitation extremes assessed by different statistical approaches. Climate Dynamics, 44(3–4), 845–860, doi: 10.1007/s00382-014-2428-6.
Pedron, I.T., M.A.F. Silva Dias, S. de Paula Dias, L.M. Carvalho, and E.D. Freitas, 2017: Trends and variability in extremes of precipitation in Curitiba – Southern Brazil. International Journal of Climatology, 37(3), 1250–1264, doi: 10.1002/joc.4773.
Peña-Angulo, D. et al., 2020a: ECTACI: European Climatology and Trend (Atlas of Climate Indices (1979–2017). Journal of Geophysical Research: Atmospheres, 125(16), e2020JD032798, doi: 10.1029/2020jd032798.
Peña-Angulo, D. et al., 2020b: Long-term precipitation in Southwestern Europe reveals no clear trend attributable to anthropogenic forcing. Environmental Research Letters, 15(9), 094070, doi: 10.1088/1748-9326/ab9c4f .
Pendergrass, A.G., 2018: What precipitation is extreme?Science, 360(6393), 1072–1073, doi: 10.1126/science.aat1871.
Pendergrass, A.G., F. Lehner, B.M. Sanderson, and Y. Xu, 2015: Does extreme precipitation intensity depend on the emissions scenario?Geophysical Research Letters, 42(20), 8767–8774, doi: 10.1002/2015gl065854.
Pendergrass, A.G. et al., 2019: Nonlinear Response of Extreme Precipitation to Warming in CESM1. Geophysical Research Letters, 46(17–18), 10551–10560, doi: 10.1029/2019gl084826.
Pendergrass, A.G. et al., 2020: Flash droughts present a new challenge for subseasonal-to-seasonal prediction. Nature Climate Change, 10(3), 191–199, doi: 10.1038/s41558-020-0709-0.
Pepler, A.S., L. Ashcroft, and B. Trewin, 2018: The relationship between the subtropical ridge and Australian temperatures. Journal of Southern Hemisphere Earth System Science, 68(1), 201–214, doi: 10.22499/3.6801.011.
Pepler, A.S. et al., 2015: Impact of Identification Method on the Inferred Characteristics and Variability of Australian East Coast Lows. Monthly Weather Review, 143(3), 864–877, doi: 10.1175/mwr-d-14-00188.1.
Pepler, A.S. et al., 2016: Projected changes in east Australian midlatitude cyclones during the 21st century. Geophysical Research Letters, 43(1), 334–340, doi: 10.1002/2015gl067267.received.
Pereira, L.S., R.G. Allen, M. Smith, and D. Raes, 2015: Crop evapotranspiration estimation with FAO56: Past and future. Agricultural Water Management, 147, 4–20, doi: 10.1016/j.agwat.2014.07.031.
Perkins, S.E., 2015: A review on the scientific understanding of heatwaves – Their measurement, driving mechanisms, and changes at the global scale. Atmospheric Research, 164–165, 242–267, doi: 10.1016/j.atmosres.2015.05.014.
Perkins, S.E. and L. Alexander, 2013: On the Measurement of Heat Waves. Journal of Climate, 26(13), 4500–4517, doi: 10.1175/jcli-d-12-00383.1.
Perkins, S.E. and P.B. Gibson, 2015: Increased Risk of the 2014 Australian May Heatwave Due to Anthropogenic Activity. Bulletin of the American Meteorological Society, 96(12), S154–S157, doi: 10.1175/bams-d-15-00074.1.
Perkins, S.E., S.C. Lewis, A.D. King, and L. Alexander, 2014: Increased simulated risk of the hot Australian summer of 2012–2013 due to anthropogenic activity as measured by heatwave frequency and intensity [in “Explaining Extreme Events of 2013 from a Climate Perspective”]. Bulletin of the American Meteorological Society, 95(9), S34–S37, doi: 10.1175/1520-0477-95.9.s1.1.
Perkins-Kirkpatrick, S.E. and P.B. Gibson, 2017: Changes in regional heatwave characteristics as a function of increasing global temperature. Scientific Reports, 7(1), 12256, doi: 10.1038/s41598-017-12520-2.
Perkins-Kirkpatrick, S.E. and S.C. Lewis, 2020: Increasing trends in regional heatwaves. Nature Communications, 11(1), 1–8, doi: 10.1038/s41467-020-16970-7.
Perkins-Kirkpatrick, S.E. et al., 2016: Natural hazards in Australia: heatwaves. Climatic Change, 139(1), 101–114, doi: 10.1007/s10584-016-1650-0.
Persad, G.G. and K. Caldeira, 2018: Divergent global-scale temperature effects from identical aerosols emitted in different regions. Nature Communications, 9(1), 3289, doi: 10.1038/s41467-018-05838-6.
Peterson, T.C., P.A. Stott, and S. Herring, 2012: Explaining Extreme Events of 2011 from a Climate Perspective. Bulletin of the American Meteorological Society, 93(7), 1041–1067, doi: 10.1175/bams-d-12-00021.1.
Peterson, T.C., M.P. Hoerling, P.A. Stott, and S.C. Herring, 2013a: Explaining Extreme Events of 2012 from a Climate Perspective. Bulletin of the American Meteorological Society, 94(9), S1–S74, doi: 10.1175/bams-d-13-00085.1.
Peterson, T.C. et al., 2013b: Monitoring and Understanding Changes in Heat Waves, Cold Waves, Floods, and Droughts in the United States: State of Knowledge. Bulletin of the American Meteorological Society, 94(6), 821–834, doi: 10.1175/bams-d-12-00066.1.
Pfahl, S. and H. Wernli, 2012: Quantifying the relevance of cyclones for precipitation extremes. Journal of Climate, 25(19), 6770–6780, doi: 10.1175/jcli-d-11-00705.1.
Pfahl, S., P.A. O’Gorman, and E.M. Fischer, 2017: Understanding the regional pattern of projected future changes in extreme precipitation. Nature Climate Change, 7, 423, doi: 10.1038/nclimate3287.
Phelan, P.E. et al., 2015: Urban Heat Island: Mechanisms, Implications, and Possible Remedies. Annual Review of Environment and Resources, 40(1), 285–307, doi: 10.1146/annurev-environ-102014-021155.
Phibbs, S. and R. Toumi, 2016: The dependence of precipitation and its footprint on atmospheric temperature in idealized extratropical cyclones. Journal of Geophysical Research: Atmospheres, 121(15), 8743–8754, doi: 10.1002/2015jd024286.
Philip, S. et al., 2018a: Validation of a Rapid Attribution of the May/June 2016 Flood-Inducing Precipitation in France to Climate Change. Journal of Hydrometeorology, 19(11), 1881–1898, doi: 10.1175/jhm-d-18-0074.1.
Philip, S. et al., 2018b: Attribution Analysis of the Ethiopian Drought of 2015. Journal of Climate, 31(6), 2465–2486, doi: 10.1175/jcli-d-17-0274.1.
Philip, S. et al., 2019: Attributing the 2017 Bangladesh floods from meteorological and hydrological perspectives. Hydrology and Earth System Sciences, 23(3), 1409–1429, doi: 10.5194/hess-23-1409-2019.
Philip, S. et al., 2020: A protocol for probabilistic extreme event attribution analyses. Advances in Statistical Climatology, Meteorology and Oceanography, 6(2), 177–203, doi: 10.5194/ascmo-6-177-2020.
Piaget, N. et al., 2015: Dynamics of a local Alpine flooding event in October 2011: moisture source and large-scale circulation. Quarterly Journal of the Royal Meteorological Society, 141(690), 1922–1937, doi: 10.1002/qj.2496.
Pinto, I., C. Jack, and B. Hewitson, 2018: Process-based model evaluation and projections over southern Africa from Coordinated Regional Climate Downscaling Experiment and Coupled Model Intercomparison Project Phase 5 models. International Journal of Climatology, 38(11), 4251–4261, doi: 10.1002/joc.5666.
Pinto, I. et al., 2016: Evaluation and projections of extreme precipitation over southern Africa from two CORDEX models. Climatic Change, 135(3–4), 655–668, doi: 10.1007/s10584-015-1573-1.
Pisaniello, J.D., J. Tingey-Holyoak, and R.L. Burritt, 2012: Appropriate small dam management for minimizing catchment-wide safety threats: International benchmarked guidelines and demonstrative cases studies. Water Resources Research, 48(1), W01546, doi: 10.1029/2011wr011155.
Pithan, F. and T. Mauritsen, 2014: Arctic amplification dominated by temperature feedbacks in contemporary climate models. Nature Geoscience, 7(3), 181–184, doi: 10.1038/ngeo2071.
Piticar, A., 2018: Changes in heat waves in Chile. Global and Planetary Change, 169, 234–246, doi: 10.1016/j.gloplacha.2018.08.007.
Piticar, A. et al., 2016: Spatiotemporal distribution of reference evapotranspiration in the Republic of Moldova. Theoretical and Applied Climatology, 124(3–4), 1133–1144, doi: 10.1007/s00704-015-1490-2.
Podschwit, H.R., N.K. Larkin, E.A. Steel, A. Cullen, and E. Alvarado, 2018: Multi-model forecasts of very-large fire occurences during the end of the 21st century. Climate, 6(4), 1–21, doi: 10.3390/cli6040100.
Pokhrel, Y. et al., 2021: Global terrestrial water storage and drought severity under climate change. Nature Climate Change, 11(3), 226–233, doi: 10.1038/s41558-020-00972-w.
Poshtiri, M.P. and I. Pal, 2016: Patterns of hydrological drought indicators in major U.S. River basins. Climatic Change, 134(4), 549–563, doi: 10.1007/s10584-015-1542-8.
Potopová, V. et al., 2018: Projected changes in the evolution of drought on various timescales over the Czech Republic according to Euro-CORDEX models. International Journal of Climatology, 38, e939–e954, doi: 10.1002/joc.5421.
Preimesberger, W., T. Scanlon, C.-H. Su, A. Gruber, and W. Dorigo, 2021: Homogenization of Structural Breaks in the Global ESA CCI Soil Moisture Multisatellite Climate Data Record. IEEE Transactions on Geoscience and Remote Sensing, 59(4), 2845–2862, doi: 10.1109/tgrs.2020.3012896.
Prein, A.F. and G.J. Holland, 2018: Global estimates of damaging hail hazard. Weather and Climate Extremes, 22, 10–23, doi: 10.1016/j.wace.2018.10.004.
Prein, A.F. et al., 2015: A review on regional convection-permitting climate modeling: Demonstrations, prospects, and challenges. Reviews of Geophysics, 53(2), 323–361, doi: 10.1002/2014rg000475.
Prein, A.F. et al., 2016a: Precipitation in the EURO-CORDEX 0.11° and 0.44° simulations: high resolution, high benefits?Climate Dynamics, 46(1–2), 383–412, doi: 10.1007/s00382-015-2589-y.
Prein, A.F. et al., 2016b: The future intensification of hourly precipitation extremes. Nature Climate Change, 7(1), 48, doi: 10.1038/nclimate3168.
Prein, A.F. et al., 2017: Increased rainfall volume from future convective storms in the US. Nature Climate Change, 7(12), 880–884, doi: 10.1038/s41558-017-0007-7.
Prein, A.F. et al., 2020: Simulating North American mesoscale convective systems with a convection-permitting climate model. Climate Dynamics, 55(1–2), 95–110, doi: 10.1007/s00382-017-3993-2.
Priestley, M.D.K. et al., 2020: An Overview of the Extratropical Storm Tracks in CMIP6 Historical Simulations. Journal of Climate, 33(15), 6315–6343, doi: 10.1175/jcli-d-19-0928.1.
Priya, P., R. Krishnan, M. Mujumdar, and R.A. Houze, 2017: Changing monsoon and midlatitude circulation interactions over the Western Himalayas and possible links to occurrences of extreme precipitation. Climate Dynamics, 49(7), 2351–2364, doi: 10.1007/s00382-016-3458-z.
Prudhomme, C. et al., 2014: Hydrological droughts in the 21st century, hotspots and uncertainties from a global multimodel ensemble experiment. Proceedings of the National Academy of Sciences, 111(9), 3262–3267, doi: 10.1073/pnas.1222473110.
Púčik, T. et al., 2017: Future Changes in European Severe Convection Environments in a Regional Climate Model Ensemble. Journal of Climate, 30(17), 6771–6794, doi: 10.1175/jcli-d-16-0777.1.
Qasmi, S., E. Sanchez-Gomez, Y. Ruprich-Robert, J. Boé, and C. Cassou, 2021: Modulation of the Occurrence of Heatwaves over the Euro-Mediterranean Region by the Intensity of the Atlantic Multidecadal Variability. Journal of Climate, 34(3), 1099–1114, doi: 10.1175/jcli-d-19-0982.1.
Qian, C., X. Zhang, and Z. Li, 2019: Linear trends in temperature extremes in China, with an emphasis on non-Gaussian and serially dependent characteristics. Climate Dynamics, 53(1–2), 533–550, doi: 10.1007/s00382-018-4600-x.
Qian, C. et al., 2018: Human Influence on the Record-breaking Cold Event in January of 2016 in Eastern China [in “Explaining Extreme Events of 2016 from a Climate Perspective”]. Bulletin of the American Meteorological Society, 99(1), S118–S122, doi: 10.1175/bams-d-17-0095.1.
Qin, N. et al., 2015: Spatial and temporal variations of extreme precipitation and temperature events for the Southwest China in 1960–2009. Geoenvironmental Disasters, 2(1), 4, doi: 10.1186/s40677-015-0014-9.
Qin, Y., D. Yang, H. Lei, K. Xu, and X. Xu, 2015: Comparative analysis of drought based on precipitation and soil moisture indices in Haihe basin of North China during the period of 1960–2010. Journal of Hydrology, 526, 55–67, doi: 10.1016/j.jhydrol.2014.09.068.
Qiu, J., Q. Gao, S. Wang, and Z. Su, 2016: Comparison of temporal trends from multiple soil moisture data sets and precipitation: The implication of irrigation on regional soil moisture trend. International Journal of Applied Earth Observation and Geoinformation, 48, 17–27, doi: 10.1016/j.jag.2015.11.012.
Quintana-Seguí, P., A. Barella-Ortiz, S. Regueiro-Sanfiz, and G. Miguez-Macho, 2020: The Utility of Land-Surface Model Simulations to Provide Drought Information in a Water Management Context Using Global and Local Forcing Datasets. Water Resources Management, 34(7), 2135–2156, doi: 10.1007/s11269-018-2160-9.
Quiring, S.M. et al., 2016: The North American Soil Moisture Database: Development and Applications. Bulletin of the American Meteorological Society, 97(8), 1441–1459, doi: 10.1175/bams-d-13-00263.1.
Ragone, F., M. Mariotti, A. Parodi, J. von Hardenberg, and C. Pasquero, 2018: A Climatological Study of Western Mediterranean Medicanes in Numerical Simulations with Explicit and Parameterized Convection. Atmosphere, 9(10), 397, doi: 10.3390/atmos9100397.
Rahimi, M. and S. Hejabi, 2018: Spatial and temporal analysis of trends in extreme temperature indices in Iran over the period 1960–2014. International Journal of Climatology, 38(1), 272–282, doi: 10.1002/joc.5175.
Rahimi, M. and S.S. Fatemi, 2019: Mean versus Extreme Precipitation Trends in Iran over the Period 1960–2017. Pure and Applied Geophysics, 176(8), 3717–3735, doi: 10.1007/s00024-019-02165-9.
Rahimi, M., N. Mohammadian, A.R. Vanashi, and K. Whan, 2018: Trends in Indices of Extreme Temperature and Precipitation in Iran over the Period 1960–2014. Open Journal of Ecology, 8(7), 396–415, doi: 10.4236/oje.2018.87024.
Rai, P., A. Choudhary, and A.P. Dimri, 2019: Future precipitation extremes over India from the CORDEX-South Asia experiments. Theoretical and Applied Climatology, 137(3–4), 2961–2975, doi: 10.1007/s00704-019-02784-1.
Rajbhandari, R., A.B. Shrestha, A. Kulkarni, S.K. Patwardhan, and S.R. Bajracharya, 2015: Projected changes in climate over the Indus river basin using a high resolution regional climate model (PRECIS). Climate Dynamics, 44(1), 339–357, doi: 10.1007/s00382-014-2183-8.
Rajczak, J. and C. Schär, 2017: Projections of Future Precipitation Extremes Over Europe: A Multimodel Assessment of Climate Simulations. Journal of Geophysical Research: Atmospheres, 122(20), 10773–10800, doi: 10.1002/2017jd027176.
Rajczak, J., P. Pall, and C. Schär, 2013: Projections of extreme precipitation events in regional climate simulations for Europe and the Alpine Region. Journal of Geophysical Research: Atmospheres, 118(9), 3610–3626, doi: 10.1002/jgrd.50297.
Rajsekhar, D. and S.M. Gorelick, 2017: Increasing drought in Jordan: Climate change and cascading Syrian land-use impacts on reducing transboundary flow. Science Advances, 3(8), 1–15, doi: 10.1126/sciadv.1700581.
Ralph, F.M., M.D. Dettinger, M.M. Cairns, T.J. Galarneau, and J. Eylander, 2018: Defining “Atmospheric River”: How the Glossary of Meteorology Helped Resolve a Debate. Bulletin of the American Meteorological Society, 99(4), 837–839, doi: 10.1175/bams-d-17-0157.1.
Ramos, A.M., R. Tomé, R.M. Trigo, M.L.R. Liberato, and J.G. Pinto, 2016: Projected changes in atmospheric rivers affecting Europe in CMIP5 models. Geophysical Research Letters, 43(17), 9315–9323, doi: 10.1002/2016gl070634.
Rasmijn, L.M. et al., 2018: Future equivalent of 2010 Russian heatwave intensified by weakening soil moisture constraints. Nature Climate Change, 8(5), 381–385, doi: 10.1038/s41558-018-0114-0.
Rasmussen, K.L. and R.A. Houze, 2011: Orogenic Convection in Subtropical South America as Seen by the TRMM Satellite. Monthly Weather Review, 139(8), 2399–2420, doi: 10.1175/mwr-d-10-05006.1.
Rasmussen, K.L., A.F. Prein, R.M. Rasmussen, K. Ikeda, and C. Liu, 2020: Changes in the convective population and thermodynamic environments in convection-permitting regional climate simulations over the United States. Climate Dynamics, 55(1–2), 383–408, doi: 10.1007/s00382-017-4000-7.
Ratnam, J., S.K. Behera, S.B. Ratna, M. Rajeevan, and T. Yamagata, 2016: Anatomy of Indian heatwaves. Scientific Reports, 6, 1–11, doi: 10. 1038/srep24395.
Rauniyar, S.P. and S.B. Power, 2020: The impact of anthropogenic forcing and natural processes on past, present, and future rainfall over Victoria, Australia. Journal of Climate, 33(18), 8087–8106, doi: 10.1175/jcli-d-19-0759.1.
Raymond, C. et al., 2020: Understanding and managing connected extreme events. Nature Climate Change, 10(7), 611–621, doi: 10.1038/s41558-020-0790-4.
Raymond, F., A. Ullmann, P. Camberlin, B. Oueslati, and P. Drobinski, 2018: Atmospheric conditions and weather regimes associated with extreme winter dry spells over the Mediterranean basin. Climate Dynamics, 50(11–12), 4437–4453, doi: 10.1007/s00382-017-3884-6.
Raymond, F., A. Ullmann, Y. Tramblay, P. Drobinski, and P. Camberlin, 2019: Evolution of Mediterranean extreme dry spells during the wet season under climate change. Regional Environmental Change, 19(8), 2339–2351, doi: 10.1007/s10113-019-01526-3.
Reale, M. and P. Lionello, 2013: Synoptic climatology of winter intense precipitation events along the Mediterranean coasts. Natural Hazards and Earth System Sciences, 13(7), 1707–1722, doi: 10.5194/nhess-13-1707-2013.
Reboita, M.S., R.P. da Rocha, T. Ambrizzi, and C.D. Gouveia, 2015: Trend and teleconnection patterns in the climatology of extratropical cyclones over the Southern Hemisphere. Climate Dynamics, 45(7–8), 1929–1944, doi: 10.1007/s00382-014-2447-3.
Reboita, M.S. et al., 2021: Future changes in the wintertime cyclonic activity over the CORDEX-CORE southern hemisphere domains in a multi-model approach. Climate Dynamics, 57(5–6), 1533–1549, doi: 10.1007/s00382-020-05317-z.
Redmond, G., K.I. Hodges, C. Mcsweeney, R. Jones, and D. Hein, 2015: Projected changes in tropical cyclones over Vietnam and the South China Sea using a 25 km regional climate model perturbed physics ensemble. Climate Dynamics, 45(7–8), 1983–2000, doi: 10.1007/s00382-014-2450-8.
Reed, K.A. and C. Jablonowski, 2011: Impact of physical parameterizations on idealized tropical cyclones in the Community Atmosphere Model. Geophysical Research Letters, 38(4), L04805, doi: 10.1029/2010gl046297.
Reed, K.A., A.M. Stansfield, M.F. Wehner, and C.M. Zarzycki, 2020: Forecasted attribution of the human influence on Hurricane Florence. Science Advances, 6(1), eaaw9253, doi: 10.1126/sciadv.aaw9253.
Reed, K.A. et al., 2015: Impact of the dynamical core on the direct simulation of tropical cyclones in a high-resolution global model. Geophysical Research Letters, 42(9), 3603–3608, doi: 10.1002/2015gl063974.
Reed, K.A. et al., 2019: Exploring the Impact of Dust on North Atlantic Hurricanes in a High-Resolution Climate Model. Geophysical Research Letters, 46(2), 1105–1112, doi: 10.1029/2018gl080642.
Rehbein, A., T. Ambrizzi, and C.R. Mechoso, 2018: Mesoscale convective systems over the Amazon basin. Part I: climatological aspects. International Journal of Climatology, 38(1), 215–229, doi: 10.1002/joc.5171.
Rehman, S., 2013: Long-term wind speed analysis and detection of its trends using Mann–Kendall test and linear regression method. Arabian Journal for Science and Engineering, 38(2), 421–437, doi: 10.1007/s13369-012-0445-5.
Reichle, R.H. et al., 2017: Assessment of MERRA-2 Land Surface Hydrology Estimates. Journal of Climate, 30(8), 2937–2960, doi: 10.1175/jcli-d-16-0720.1.
Ren, L. et al., 2020: Attribution of the record-breaking heat event over Northeast Asia in summer 2018: The role of circulation. Environmental Research Letters, 15(5), 054018, doi: 10.1088/1748-9326/ab8032.
Reyer, C.P.O. et al., 2017: Climate change impacts in Central Asia and their implications for development. Regional Environmental Change, 17(6), 1639–1650, doi: 10.1007/s10113-015-0893-z.
Rhoades, A.M., P.A. Ullrich, and C.M. Zarzycki, 2018: Projecting 21st century snowpack trends in western USA mountains using variable-resolution CESM. Climate Dynamics, 50(1), 261–288, doi: 10.1007/s00382-017-3606-0.
Ribal, A. and I.R. Young, 2019: 33 Years of Globally Calibrated Wave Height and Wind Speed Data Based on Altimeter Observations. Scientific data, 6(1), 77, doi: 10.1038/s41597-019-0083-9.
Ribeiro, I.O. et al., 2018: Biomass burning and carbon monoxide patterns in Brazil during the extreme drought years of 2005, 2010, and 2015. Environmental Pollution, 243, 1008–1014, doi: 10.1016/j.envpol.2018.09.022.
Ribes, A. et al., 2019: Observed increase in extreme daily rainfall in the French Mediterranean. Climate Dynamics, 52(1–2), 1095–1114, doi: 10.1007/s00382-018-4179-2.
Ridder, N.N., H. de Vries, and S. Drijfhout, 2018: The role of atmospheric rivers in compound events consisting of heavy precipitation and high storm surges along the Dutch coast. Natural Hazards and Earth System Sciences, 18(12), 3311–3326, doi: 10.5194/nhess-18-3311-2018.
Ridder, N.N. et al., 2020: Global hotspots for the occurrence of compound events. Nature Communications, 11(1), 5956, doi: 10.1038/s41467-020-19639-3.
Ridley, J., A. Wiltshire, and C. Mathison, 2013: More frequent occurrence of westerly disturbances in Karakoram up to 2100. Science of The Total Environment, 468–469, S31–S35, doi: 10.1016/j.scitotenv.2013.03.074.
Ringard, J. et al., 2016: The intensification of thermal extremes in west Africa. Global and Planetary Change, 139, 66–77, doi: 10.1016/j.gloplacha.2015.12.009.
Risser, M.D. and M.F. Wehner, 2017: Attributable Human-Induced Changes in the Likelihood and Magnitude of the Observed Extreme Precipitation during Hurricane Harvey. Geophysical Research Letters, 44(24), 12457–12464, doi: 10.1002/2017gl075888.
Rivera, J.A. and O.C. Penalba, 2018: Spatio-temporal assessment of streamflow droughts over Southern South America: 1961–2006. Theoretical and Applied Climatology, 133(3), 1021–1033, doi: 10.1007/s00704-017-2243-1.
Rivera, J.A. and G. Arnould, 2020: Evaluation of the ability of CMIP6 models to simulate precipitation over Southwestern South America: Climatic features and long-term trends (1901–2014). Atmospheric Research, 241, 104953, doi: 10.1016/j.atmosres.2020.104953.
Roberts, M.J. et al., 2018: The Benefits of Global High Resolution for Climate Simulation: Process Understanding and the Enabling of Stakeholder Decisions at the Regional Scale. Bulletin of the American Meteorological Society, 99(11), 2341–2359, doi: 10.1175/bams-d-15-00320.1.
Roberts, M.J. et al., 2020a: Impact of Model Resolution on Tropical Cyclone Simulation Using the HighResMIP–PRIMAVERA Multimodel Ensemble. Journal of Climate, 33(7), 2557–2583, doi: 10.1175/jcli-d-19-0639.1.
Roberts, M.J. et al., 2020b: Projected Future Changes in Tropical Cyclones Using the CMIP6 HighResMIP Multimodel Ensemble. Geophysical Research Letters, 47(14), e2020GL088662, doi: 10.1029/2020gl088662.
Rodell, M. et al., 2018: Emerging trends in global freshwater availability. Nature, 557(7707), 651–659, doi: 10.1038/s41586-018-0123-1.
Roderick, M.L., P. Greve, and G.D. Farquhar, 2015: On the assessment of aridity with changes in atmospheric CO2. Water Resources Research, 51(7), 5450–5463, doi: 10.1002/2015wr017031.
Rogelj, J., 2013: Uncertainties of low greenhouse gas emission scenarios. PhD Thesis, ETH, Zurich, Switzerland, 217 pp., doi: 10.3929/et hz-a-009915210.
Rogger, M. et al., 2017: Land use change impacts on floods at the catchment scale: Challenges and opportunities for future research. Water Resources Research, 53(7), 5209–5219, doi: 10.1002/2017wr020723.
Rohat, G. et al., 2019: Influence of changes in socioeconomic and climatic conditions on future heat-related health challenges in Europe. Global and Planetary Change, 172, 45–59, doi: 10.1016/j.gloplacha.2018.09.013.
Rohini, P., M. Rajeevan, and A.K. Srivastava, 2016: On the Variability and Increasing Trends of Heat Waves over India. Scientific Reports, 6(1), 26153, doi: 10. 1038/srep26153.
Romera, R. et al., 2017: Climate change projections of medicanes with a large multi-model ensemble of regional climate models. Global and Planetary Change, 151, 134–143, doi: 10.1016/j.gloplacha.2016.10.008.
Romero, R. and K. Emanuel, 2013: Medicane risk in a changing climate. Journal of Geophysical Research: Atmospheres, 118(12), 5992–6001, doi: 10.1002/jgrd.50475.
Romero, R. and K. Emanuel, 2017: Climate change and hurricane-like extratropical cyclones: Projections for North Atlantic polar lows and medicanes based on CMIP5 models. Journal of Climate, 30(1), 279–299, doi: 10.1175/jcli-d-16-0255.1.
Romps, D.M., 2016: Clausius–Clapeyron Scaling of CAPE from Analytical Solutions to RCE. Journal of the Atmospheric Sciences, 73(9), 3719–3737, doi: 10.1175/jas-d-15-0327.1.
Rosenzweig, B.R. et al., 2018: Pluvial flood risk and opportunities for resilience. WIREs Water, 5(6), e1302, doi: 10. 1002/wat2.1302.
Rosier, S. et al., 2015: Extreme Rainfall in Early July 2014 in Northland, New Zealand – Was There an Anthropogenic Influence?Bulletin of the American Meteorological Society, 96(12), S136–S140, doi: 10.1175/bams-d-15-00105.1.
Roth, M., G. Jongbloed, and A. Buishand, 2019: Monotone trends in the distribution of climate extremes. Theoretical and Applied Climatology, 136(3–4), 1175–1184, doi: 10.1007/s00704-018-2546-x.
Roth, M., T.A. Buishand, G. Jongbloed, A.M.G. Klein Tank, and J.H. van Zanten, 2014: Projections of precipitation extremes based on a regional, non-stationary peaks-over-threshold approach: A case study for the Netherlands and north-western Germany. Weather and Climate Extremes, 4, 1–10, doi: 10.1016/j.wace.2014.01.001.
Roudier, P. et al., 2016: Projections of future floods and hydrological droughts in Europe under a +2°C global warming. Climatic Change, 135(2), 341–355, doi: 10.1007/s10584-015-1570-4.
Rowell, D.P., B.B.B. Booth, S.E. Nicholson, and P. Good, 2015: Reconciling Past and Future Rainfall Trends over East Africa. Journal of Climate, 28(24), 9768–9788, doi: 10.1175/jcli-d-15-0140.1.
Rowland, L. et al., 2015: Death from drought in tropical forests is triggered by hydraulics not carbon starvation. Nature, 528(7580), 119–122, doi: 10.1038/nature15539.
Roxy, M.K. et al., 2017: A threefold rise in widespread extreme rain events over central India. Nature Communications, 8(1), 708, doi: 10.1038/s41467-017-00744-9.
Roy, J. et al., 2019: Exploring Futures of the Hindu Kush Himalaya: Scenarios and Pathways. In: The Hindu Kush Himalaya Assessment: Mountains, Climate Change, Sustainability and People[Wester, P., A. Mishra, A. Mukherji, and A.B. Shrestha (eds.)]. Springer, Cham, Switzerland, pp. 99–125, doi: 10.1007/978-3-319-92288-1_4.
Ruffault, J., T. Curt, N.K. Martin-StPaul, V. Moron, and R.M. Trigo, 2018: Extreme wildfire events are linked to global-change-type droughts in the northern Mediterranean. Natural Hazards and Earth System Sciences, 18(3), 847–856, doi: 10.5194/nhess-18-847-2018.
Ruml, M. et al., 2017: Observed changes of temperature extremes in Serbia over the period 1961–2010. Atmospheric Research, 183, 26–41, doi: 10.1016/j.atmosres.2016.08.013.
Ruosteenoja, K., T. Markkanen, A. Venäläinen, P. Räisänen, and H. Peltola, 2018: Seasonal soil moisture and drought occurrence in Europe in CMIP5 projections for the 21st century. Climate Dynamics, 50(3–4), 1177–1192, doi: 10.1007/s00382-017-3671-4.
Rupp, D.E., P.W. Mote, N. Massey, F.E.L. Otto, and M.R. Allen, 2013: Human influence on the probability of low precipitation in the central United States in 2012 [in “Explaining Extreme Events of 2012 from a Climate Perspective”]. Bulletin of the American Meteorological Society, 94(9), S2–S6, doi: 10.1175/bams-d-13-00085.1.
Ruprich-Robert, Y. et al., 2018: Impacts of the Atlantic Multidecadal Variability on North American Summer Climate and Heat Waves. Journal of Climate, 31(9), 3679–3700, doi: 10.1175/jcli-d-17-0270.1.
Russo, S., J. Sillmann, and E.M. Fischer, 2015: Top ten European heatwaves since 1950 and their occurrence in the coming decades. Environmental Research Letters, 10(12), 124003, doi: 10.1088/1748-9326/10/12/124003.
Russo, S., A.F. Marchese, J. Sillmann, and G. Immé, 2016: When will unusual heat waves become normal in a warming Africa?Environmental Research Letters, 11(5), 054016, doi: 10.1088/1748-9326/11/5/054016.
Russo, S., A. Dosio, A. Sterl, P. Barbosa, and J. Vogt, 2013: Projection of occurrence of extreme dry-wet years and seasons in Europe with stationary and nonstationary Standardized Precipitation Indices. Journal of Geophysical Research: Atmospheres, 118(14), 7628–7639, doi: 10.1002/jgrd.50571.
Rusticucci, M., M. Barrucand, and S. Collazo, 2017: Temperature extremes in the Argentina central region and their monthly relationship with the mean circulation and ENSO phases. International Journal of Climatology, 37(6), 3003–3017, doi: 10.1002/joc.4895.
Sabeerali, C.T., S.A. Rao, A.R. Dhakate, K. Salunke, and B.N. Goswami, 2015: Why ensemble mean projection of south Asian monsoon rainfall by CMIP5 models is not reliable?Climate Dynamics, 45(1), 161–174, doi: 10.1007/s00382-014-2269-3.
Saha, A., S. Ghosh, A.S. Sahana, and E.P. Rao, 2014: Failure of CMIP5 climate models in simulating post-1950 decreasing trend of Indian monsoon. Geophysical Research Letters, 41(20), 7323–7330, doi: 10.1002/2014gl061573.
Sahoo, B. and P.K. Bhaskaran, 2016: Assessment on historical cyclone tracks in the Bay of Bengal, east coast of India. International Journal of Climatology, 36(1), 95–109, doi: 10.1002/joc.4331.
Salinger, M.J. and A.S. Porteous, 2014: New Zealand Climate: Patterns of Drought 1941/42 – 2012/13. Weather and Climate, 34(1985), 2–19, doi: 10.2307/26169741.
Salnikov, V., G. Tutulina, S. Polyakova, Y. Petrova, and A. Skakova, 2015: Climate change in Kazakhstan during the past 70 years. Quaternary International, 358, 77–82, doi: 10.1016/j.quaint.2014.09.008.
Salvador, M.A. and J.I.B. de Brito, 2018: Trend of annual temperature and frequency of extreme events in the MATOPIBA region of Brazil. Theoretical and Applied Climatology, 133(1–2), 253–261, doi: 10.1007/s00704-017-2179-5.
Salvi, K. and S. Ghosh, 2016: Projections of Extreme Dry and Wet Spells in the 21st Century India Using Stationary and Non-stationary Standardized Precipitation Indices. Climatic Change, 139(3), 667–681, doi: 10.1007/s10584-016-1824-9.
Samaniego, L. et al., 2017: Propagation of forcing and model uncertainties on to hydrological drought characteristics in a multi-model century-long experiment in large river basins. Climatic Change, 141(3), 435–449, doi: 10.1007/s10584-016-1778-y.
Samaniego, L. et al., 2018: Anthropogenic warming exacerbates European soil moisture droughts. Nature Climate Change, 8(5), 421–426, doi: 10.1038/s41558-018-0138-5.
Samouly, A. et al., 2018: Performance of multi-model ensembles for the simulation of temperature variability over Ontario, Canada. Environmental Earth Sciences, 77(13), 524, doi: 10.1007/s12665-018-7701-2.
Samset, B.H. et al., 2018: Climate Impacts From a Removal of Anthropogenic Aerosol Emissions. Geophysical Research Letters, 45(2), 1020–1029, doi: 10.1002/2017gl076079.
Samset, B.H. et al., 2019: How Daily Temperature and Precipitation Distributions Evolve With Global Surface Temperature. Earth’s Future, 7(12), 1323–1336, doi: 10.1029/2019ef001160.
Samuels, R. et al., 2018: Evaluation and projection of extreme precipitation indices in the Eastern Mediterranean based on CMIP5 multi-model ensemble. International Journal of Climatology, 38(5), 2280–2297, doi: 10.1002/joc.5334.
Sánchez-Benítez, A., D. Barriopedro, and R. García-Herrera, 2020: Tracking Iberian heatwaves from a new perspective. Weather and Climate Extremes, 28, 100238, doi: 10.1016/j.wace.2019.100238.
Sanchez-Lorenzo, A. et al., 2015: Reassessment and update of long-term trends in downward surface shortwave radiation over Europe (1939–2012). Journal of Geophysical Research: Atmospheres, 120(18), 9555–9569, doi: 10.1002/2015jd023321.
Sanderson, B.M. et al., 2017: Community climate simulations to assess avoided impacts in 1.5 and 2°C futures. Earth System Dynamics, 8(3), 827–847, doi: 10.5194/esd-8-827-2017.
Sanderson, M., T. Economou, K. Salmon, and S. Jones, 2017: Historical Trends and Variability in Heat Waves in the United Kingdom. Atmosphere, 8(12), 117–191, doi: 10.3390/atmos8100191.
Sandvik, M.I., A. Sorteberg, and R. Rasmussen, 2018: Sensitivity of historical orographically enhanced extreme precipitation events to idealized temperature perturbations. Climate Dynamics, 50(1), 143–157, doi: 10.1007/s00382-017-3593-1.
Sanginés de Cárcer, P. et al., 2018: Vapor-pressure deficit and extreme climatic variables limit tree growth. Global Change Biology, 24(3), 1108–1122, doi: 10. 1111/gcb.13973.
Sanogo, S. et al., 2015: Spatio-temporal characteristics of the recent rainfall recovery in West Africa. International Journal of Climatology, 35(15), 4589–4605, doi: 10.1002/joc.4309.
Santanello Jr., J.A. et al., 2018: Land–Atmosphere Interactions: The LoCo Perspective. Bulletin of the American Meteorological Society, 99(6), 1253–1272, doi: 10.1175/bams-d-17-0001.1.
Sarangi, C., S.N. Tripathi, V.P. Kanawade, I. Koren, and D.S. Pai, 2017: Investigation of the aerosol–cloud–rainfall association over the Indian summer monsoon region. Atmospheric Chemistry and Physics, 17(8), 5185–5204, doi: 10.5194/acp-17-5185-2017.
Sarhadi, A., M.C. Ausín, M.P. Wiper, D. Touma, and N.S. Diffenbaugh, 2018: Multidimensional risk in a nonstationary climate: Joint probability of increasingly severe warm and dry conditions. Science Advances, 4(11), eaau3487, doi: 10.1126/sciadv.aau3487.
Sato, T. and T. Nakamura, 2019: Intensification of hot Eurasian summers by climate change and land–atmosphere interactions. Scientific Reports, 9(1), 10866, doi: 10.1038/s41598-019-47291-5.
Satoh, M., Y. Yamada, M. Sugi, C. Komada, and A.T. Noda, 2015: Constraint on Future Change in Global Frequency of Tropical Cyclones due to Global Warming. Journal of the Meteorological Society of Japan. Series II, 93(4), 489–500, doi: 10.2151/jmsj.2015-025.
Satoh, M. et al., 2017: Outcomes and challenges of global high-resolution non-hydrostatic atmospheric simulations using the K computer. Progress in Earth and Planetary Science, 4(1), 13, doi: 10.1186/s40645-017-0127-8.
Satoh, M. et al., 2019: Global Cloud-Resolving Models. Current Climate Change Reports, 5(3), 172–184, doi: 10.1007/s40641-019-00131-0.
Saurral, R.I., I.A. Camilloni, and V.R. Barros, 2017: Low-frequency variability and trends in centennial precipitation stations in southern South America. International Journal of Climatology, 37(4), 1774–1793, doi: 10.1002/joc.4810.
Scaife, A.A. et al., 2017: Predictability of European winter 2015/2016. Atmospheric Science Letters, 18(2), 38–44, doi: 10.1002/asl.721.
Schaller, N. et al., 2014: The heavy precipitation event of May–June 2013 in the upper Danube and Elbe basins [in “Explaining Extreme Events of 2013 from a Climate Perspective”]. Bulletin of the American Meteorological Society, 95(9), S69–S72, doi: 10.1175/1520-0477-95.9.s1.1.
Schaller, N. et al., 2016: Human influence on climate in the 2014 southern England winter floods and their impacts. Nature Climate Change, 6(6), 627–634, doi: 10.1038/nclimate2927.
Schaller, N. et al., 2018: Influence of blocking on Northern European and Western Russian heatwaves in large climate model ensembles. Environmental Research Letters, 13(5), 054015, doi: 10.1088/1748-9326/aaba55.
Schaller, N. et al., 2020: The role of spatial and temporal model resolution in a flood event storyline approach in western Norway. Weather and Climate Extremes, 29, 100259, doi: 10.1016/j.wace.2020.100259.
Scheff, J., 2018: Drought Indices, Drought Impacts, CO2, and Warming: a Historical and Geologic Perspective. Current Climate Change Reports, 4(2), 202–209, doi: 10.1007/s40641-018-0094-1.
Scheff, J. and D.M.W. Frierson, 2015: Terrestrial aridity and its response to greenhouse warming across CMIP5 climate models. Journal of Climate, 28(14), 5583–5600, doi: 10.1175/jcli-d-14-00480.1.
Scheff, J., R. Seager, H. Liu, and S. Coats, 2017: Are glacials dry? Consequences for paleoclimatology and for greenhouse warming. Journal of Climate, 30(17), 6593–6609, doi: 10.1175/jcli-d-16-0854.1.
Scheff, J., J.S. Mankin, S. Coats, and H. Liu, 2021: CO2 -plant effects do not account for the gap between dryness indices and projected dryness impacts in CMIP6 or CMIP5. Environmental Research Letters, 16(3), 34018, doi: 10.1088/1748-9326/abd8fd.
Scher, S., R.J. Haarsma, H. de Vries, S.S. Drijfhout, and A.J. van Delden, 2017: Resolution dependence of extreme precipitation and deep convection over the Gulf Stream. Journal of Advances in Modeling Earth Systems, 9(2), 1186–1194, doi: 10.1002/2016ms000903.
Scherrer, S.C. et al., 2016: Emerging trends in heavy precipitation and hot temperature extremes in Switzerland. Journal of Geophysical Research: Atmospheres, 121(6), 2626–2637, doi: 10.1002/2015jd024634.
Schewe, J. et al., 2014: Multimodel assessment of water scarcity under climate change. Proceedings of the National Academy of Sciences, 111(9), 3245–3250, doi: 10.1073/pnas.1222460110.
Schleussner, C.-F. et al., 2016: Differential climate impacts for policy-relevant limits to global warming: the case of 1.5°C and 2°C. Earth System Dynamics, 7(2), 327–351, doi: 10.5194/esd-7-327-2016.
Schmid, P.E. and D. Niyogi, 2017: Modeling Urban Precipitation Modification by Spatially Heterogeneous Aerosols. Journal of Applied Meteorology and Climatology, 56(8), 2141–2153, doi: 10.1175/jamc-d-16-0320.1.
Schneider, D., C. Huggel, A. Cochachin, S. Guillén, and J. García, 2014: Mapping hazards from glacier lake outburst floods based on modelling of process cascades at Lake 513, Carhuaz, Peru. Advances in Geosciences, 35, 145–155, doi: 10.5194/adgeo-35-145-2014.
Schneider, T., T. Bischoff, and H. Płotka, 2015: Physics of Changes in Synoptic Midlatitude Temperature Variability. Journal of Climate, 28(6), 2312–2331, doi: 10.1175/jcli-d-14-00632.1.
Schoetter, R., J. Cattiaux, and H. Douville, 2015: Changes of western European heat wave characteristics projected by the CMIP5 ensemble. Climate Dynamics, 45(5–6), 1601–1616, doi: 10.1007/s00382-014-2434-8.
Schreck, C.J., K.R. Knapp, and J.P. Kossin, 2014: The impact of best track discrepancies on global tropical cyclone climatologies using IBTrACS. Monthly Weather Review, 142(10), 3881–3899, doi: 10.1175/mwr-d-14-00021.1.
Schubert, S.D., H. Wang, R.D. Koster, M.J. Suarez, and P.Y. Groisman, 2014: Northern Eurasian heat waves and droughts. Journal of Climate, 27(9), 3169–3207, doi: 10.1175/jcli-d-13-00360.1.
Schubert, S.D. et al., 2016: Global Meteorological Drought: A Synthesis of Current Understanding with a Focus on SST Drivers of Precipitation Deficits. Journal of Climate, 29(11), 3989–4019, doi: 10.1175/jcli-d-15-0452.1.
Schumacher, D.L. et al., 2019: Amplification of mega-heatwaves through heat torrents fuelled by upwind drought. Nature Geoscience, 12(9), 712–717, doi: 10.1038/s41561-019-0431-6.
Schumacher, R.S. and R.H. Johnson, 2005: Organization and Environmental Properties of Extreme-Rain-Producing Mesoscale Convective Systems. Monthly Weather Review, 133(4), 961–976, doi: 10. 1175/mwr2899.1.
Schwanghart, W., R. Worni, C. Huggel, M. Stoffel, and O. Korup, 2016: Uncertainty in the Himalayan energy–water nexus: estimating regional exposure to glacial lake outburst floods. Environmental Research Letters, 11(7), 074005, doi: 10.1088/1748-9326/11/7/074005.
Schwingshackl, C. et al., 2019: Regional climate model projections underestimate future warming due to missing plant physiological CO2 response. Environmental Research Letters, 14(11), 114019, doi: 10.1088/1748-9326/ab4949.
Scoccimarro, E. et al., 2017: Tropical Cyclone Interaction with the Ocean: The Role of High-Frequency (Subdaily) Coupled Processes. Journal of Climate, 30(1), 145–162, doi: 10.1175/jcli-d-16-0292.1.
Seager, R. and M. Hoerling, 2014: Atmosphere and ocean origins of North American droughts. Journal of Climate, 27(12), 4581–4606, doi: 10.1175/jcli-d-13-00329.1.
Seager, R., J. Nakamura, and M. Ting, 2019: Mechanisms of seasonal soil moisture drought onset and termination in the southern Great Plains. Journal of Hydrometeorology, 20(4), 751–771, doi: 10.1175/jhm-d-18-0191.1.
Seager, R. et al., 2015a: Causes of the 2011–14 California drought. Journal of Climate, 28(18), 6997–7024, doi: 10.1175/jcli-d-14-00860.1.
Seager, R. et al., 2015b: Climatology, Variability, and Trends in the U.S. Vapor Pressure Deficit, an Important Fire-Related Meteorological Quantity. Journal of Applied Meteorology and Climatology, 54(6), 1121–1141, doi: 10.1175/jamc-d-14-0321.1.
Sedlmeier, K., H. Feldmann, and G. Schädler, 2018: Compound summer temperature and precipitation extremes over central Europe. Theoretical and Applied Climatology, 131(3), 1493–1501, doi: 10.1007/s00704-017-2061-5.
Seeley, J.T. and D.M. Romps, 2015: Why does tropical convective available potential energy (CAPE) increase with warming?Geophysical Research Letters, 42(23), 10429-10437, doi: 10.1002/2015gl066199.
Seiler, C. and F.W. Zwiers, 2016a: How well do CMIP5 climate models reproduce explosive cyclones in the extratropics of the Northern Hemisphere?Climate Dynamics, 46(3–4), 1241–1256, doi: 10.1007/s00382-015-2642-x.
Seiler, C. and F.W. Zwiers, 2016b: How will climate change affect explosive cyclones in the extratropics of the Northern Hemisphere?Climate Dynamics, 46(11–12), 3633–3644, doi: 10.1007/s00382-015-2791-y.
Seiler, C., F.W. Zwiers, K.I. Hodges, and J.F. Scinocca, 2018: How does dynamical downscaling affect model biases and future projections of explosive extratropical cyclones along North America’s Atlantic coast?Climate Dynamics, 50(1–2), 677–692, doi: 10.1007/s00382-017-3634-9.
Sekizawa, S. et al., 2019: Anomalous Moisture Transport and Oceanic Evaporation during a Torrential Rainfall Event over Western Japan in Early July 2018. SOLA, 15A, 25–30, doi: 10.2151/sola.15a-005.
Selten, F.M., R. Bintanja, R. Vautard, and B.J.J.M. van den Hurk, 2020: Future continental summer warming constrained by the present-day seasonal cycle of surface hydrology. Scientific Reports, 10(1), 4721, doi: 10.1038/s41598-020-61721-9.
Şen, Z., 2018: Flood Modeling, Prediction and Mitigation. Springer, Cham, Switzerland, 422 pp., doi: 10.1007/978-3-319-52356-9.
Sen Roy, S., 2019: Spatial patterns of trends in seasonal extreme temperatures in India during 1980–2010. Weather and Climate Extremes, 24, 100203, doi: 10.1016/j.wace.2019.100203.
Sen Roy, S. and M. Rouault, 2013: Spatial patterns of seasonal scale trends in extreme hourly precipitation in South Africa. Applied Geography, 39, 151–157, doi: 10.1016/j.apgeog.2012.11.022.
Seneviratne, S.I. and M. Hauser, 2020: Regional Climate Sensitivity of Climate Extremes in CMIP6 Versus CMIP5 Multimodel Ensembles. Earth’s Future, 8(9), e2019EF001474, doi: 10.1029/2019ef001474.
Seneviratne, S.I., M.G. Donat, B. Mueller, and L. Alexander, 2014: No pause in the increase of hot temperature extremes. Nature Climate Change, 4(3), 161–163, doi: 10.1038/nclimate2145.
Seneviratne, S.I., M.G. Donat, A.J. Pitman, R. Knutti, and R.L. Wilby, 2016: Allowable CO2 emissions based on regional and impact-related climate targets. Nature, 529(7587), 477–483, doi: 10.1038/nature16542.
Seneviratne, S.I. et al., 2010: Investigating soil moisture–climate interactions in a changing climate: A review. Earth-Science Reviews, 99(3–4), 125–161, doi: 10.1016/j.earscirev.2010.02.004.
Seneviratne, S.I. et al., 2012: Changes in Climate Extremes and their Impacts on the Natural Physical Environment. In: Managing the Risks of Extreme Events and Disasters to Advance Climate Change Adaptation[Field, C.B., V. Barros, T.F. Stocker, and Q. Dahe (eds.)]. A Special Report of Working Groups I and II of the Intergovernmental Panel on Climate Change (IPCC). Cambridge University Press, Cambridge, United Kingdom and New York, NY, USA, pp. 109–230, doi: 10.1017/cbo9781139177245.006.
Seneviratne, S.I. et al., 2013: Impact of soil moisture–climate feedbacks on CMIP5 projections: First results from the GLACE-CMIP5 experiment. Geophysical Research Letters, 40(19), 5212–5217, doi: 10. 1002/grl.50956.
Seneviratne, S.I. et al., 2018a: The many possible climates from the Paris Agreement’s aim of 1.5°C warming. Nature, 558(7708), 41–49, doi: 10.1038/s41586-018-0181-4.
Seneviratne, S.I. et al., 2018b: Climate extremes, land–climate feedbacks and land-use forcing at 1.5°C. Philosophical Transactions of the Royal Society A: Mathematical, Physical and Engineering Sciences, 376(2119), 20160450, doi: 10.1098/rsta.2016.0450.
Seo, Y.-W. et al., 2014: Future change of extreme temperature climate indices over East Asia with uncertainties estimation in the CMIP5. Asia-Pacific Journal of Atmospheric Sciences, 50(S1), 609–624, doi: 10.1007/s13143-014-0050-5.
Seong, M.-G., S.-K. Min, Y.-H. Kim, X. Zhang, and Y. Sun, 2021: Anthropogenic Greenhouse Gas and Aerosol Contributions to Extreme Temperature Changes during 1951–2015. Journal of Climate, 34(3), 857–870, doi: 10.1175/jcli-d-19-1023.1.
Serrano-Notivoli, R., S. Beguería, M. Saz, and M. de Luis, 2018: Recent trends reveal decreasing intensity of daily precipitation in Spain. International Journal of Climatology, 38(11), 4211–4224, doi: 10.1002/joc.5562.
Sevanto, S., N.G. Mcdowell, L.T. Dickman, R. Pangle, and W.T. Pockman, 2014: How do trees die? A test of the hydraulic failure and carbon starvation hypotheses. Plant, Cell and Environment, 37(1), 153–161, doi: 10. 1111/pce.12141.
Shaevitz, D.A. et al., 2014: Characteristics of tropical cyclones in high-resolution models in the present climate. Journal of Advances in Modeling Earth Systems, 6(4), 1154–1172, doi: 10.1002/2014ms000372.
Shanas, P.R. and V.S. Kumar, 2015: Trends in surface wind speed and significant wave height as revealed by ERA-Interim wind wave hindcast in the Central Bay of Bengal. International Journal of Climatology, 35(9), 2654–2663, doi: 10.1002/joc.4164.
Sharafati, A., S. Nabaei, and S. Shahid, 2020: Spatial assessment of meteorological drought features over different climate regions in Iran. International Journal of Climatology, 40(3), 1864–1884, doi: 10.1002/joc.6307.
Sharma, A., C. Wasko, and D.P. Lettenmaier, 2018: If precipitation extremes are increasing, why aren’t floods?Water Resources Research, 54(11), 8545–8551, doi: 10.1029/2018wr023749.
Sharma, S. and P. Mujumdar, 2017: Increasing frequency and spatial extent of concurrent meteorological droughts and heatwaves in India. Scientific Reports, 7(1), 15582, doi: 10.1038/s41598-017-15896-3.
Sharmila, S. and K.J.E. Walsh, 2018: Recent poleward shift of tropical cyclone formation linked to Hadley cell expansion. Nature Climate Change, 8(8), 730–736, doi: 10.1038/s41558-018-0227-5.
Shashikanth, K., S. Ghosh, V. H, and S. Karmakar, 2018: Future projections of Indian summer monsoon rainfall extremes over India with statistical downscaling and its consistency with observed characteristics. Climate Dynamics, 51(1), 1–15, doi: 10.1007/s00382-017-3604-2.
Shastri, H., S. Paul, S. Ghosh, and S. Karmakar, 2015: Impacts of urbanization on Indian summer monsoon rainfall extremes. Journal of Geophysical Research: Atmospheres, 120(2), 496–516, doi: 10.1002/2014jd022061.
Shaw, T.A. et al., 2016: Storm track processes and the opposing influences of climate change. Nature Geoscience, 9(9), 656–664, doi: 10.1038/ngeo2783.
Sheffield, J., E.F. Wood, and M.L. Roderick, 2012: Little change in global drought over the past 60 years. Nature, 491(7424), 435–438, doi: 10.1038/nature11575.
Sheikh, M.M. et al., 2015: Trends in extreme daily rainfall and temperature indices over South Asia. International Journal of Climatology, 35(7), 1625–1637, doi: 10.1002/joc.4081.
Shephard, M.W. et al., 2014: Trends in Canadian Short-Duration Extreme Rainfall: Including an Intensity–Duration–Frequency Perspective. Atmosphere-Ocean, 52(5), 398–417, doi: 10.1080/07055900.2014.96967.
Shepherd, J.M., 2013: Impacts of Urbanization on Precipitation and Storms: Physical Insights and Vulnerabilities. In: Climate Vulnerability[Pielke, R.A. (ed.)]. Academic Press, Oxford, UK, pp. 109–125, doi: 10.1016/b978-0-12-384703-4.00503-7.
Shepherd, T.G., 2014: Atmospheric circulation as a source of uncertainty in climate change projections. Nature Geoscience, 7(10), 703–708, doi: 10.1038/ngeo2253.
Shepherd, T.G., 2016: A Common Framework for Approaches to Extreme Event Attribution. Current Climate Change Reports, 2(1), 28–38, doi: 10.1007/s40641-016-0033-y.
Shepherd, T.G. et al., 2018: Storylines: an alternative approach to representing uncertainty in physical aspects of climate change. Climatic Change, 151(3–4), 555–571, doi: 10.1007/s10584-018-2317-9.
Sheridan, S.C., C.C. Lee, and E.T. Smith, 2020: A Comparison Between Station Observations and Reanalysis Data in the Identification of Extreme Temperature Events. Geophysical Research Letters, 47(15), e2020GL088120, doi: 10.1029/2020gl088120.
Sherwood, S.C. and Q. Fu, 2014: A Drier Future?Science, 343(6172), 737–739, doi: 10.1126/science.1247620.
Sherwood, S.C., S. Bony, and J.-L. Dufresne, 2014: Spread in model climate sensitivity traced to atmospheric convective mixing. Nature, 505(7481), 37–42, doi: 10.1038/nature12829.
Shevchenko, O., H. Lee, S. Snizhko, and H. Mayer, 2014: Long-term analysis of heat waves in Ukraine. International Journal of Climatology, 34(5), 1642–1650, doi: 10.1002/joc.3792.
Shi, C., Z.-H. Jiang, W.-L. Chen, and L. Li, 2018: Changes in temperature extremes over China under 1.5°C and 2°C global warming targets. Advances in Climate Change Research, 9(2), 120–129, doi: 10.1016/j.accre.2017.11.003.
Shi, L., P. Feng, B. Wang, D.L. Liu, and Q. Yu, 2020: Quantifying future drought change and associated uncertainty in southeastern Australia with multiple potential evapotranspiration models. Journal of Hydrology, 590, 125394, doi: 10.1016/j.jhydrol.2020.125394.
Shi, Y., G. Wang, and X. Gao, 2017: Role of resolution in regional climate change projections over China. Climate Dynamics, 51(5–6), 2375–2396, doi: 10.1007/s00382-017-4018-x.
Shimpo, A. et al., 2019: Primary Factors behind the Heavy Rain Event of July 2018 and the Subsequent Heat Wave in Japan. SOLA, 15A, 13–18, doi: 10.2151/sola.15a-003.
Shin, J., R. Olson, and S.-I. An, 2018: Projected Heat Wave Characteristics over the Korean Peninsula During the Twenty-First Century. Asia-Pacific Journal of Atmospheric Sciences, 54(1), 53–61, doi: 10.1007/s13143-017-0059-7.
Shiogama, H. et al., 2013: An event attribution of the 2010 drought in the South Amazon region using the MIROC5 model. Atmospheric Science Letters, 14(3), 170–175, doi: 10.1002/asl2.435.
Shiogama, H. et al., 2016: Attributing Historical Changes in Probabilities of Record-Breaking Daily Temperature and Precipitation Extreme Events. SOLA, 12, 225–231, doi: 10.2151/sola.2016-045.
Shiogama, H. et al., 2020: Historical and future anthropogenic warming effects on droughts, fires and fire emissions of CO2 and PM2.5 in equatorial Asia when 2015-like El Niño events occur. Earth System Dynamics, 11(2), 435–445, doi: 10.5194/esd-11-435-2020.
Shukla, S., M. Safeeq, A. AghaKouchak, K. Guan, and C. Funk, 2015: Temperature impacts on the water year 2014 drought in California. Geophysical Research Letters, 42(11), 4384–4393, doi: 10.1002/2015gl063666.
Sigmond, M., J.C. Fyfe, and N.C. Swart, 2018: Ice-free Arctic projections under the Paris Agreement. Nature Climate Change, 8(5), 404–408, doi: 10.1038/s41558-018-0124-y.
Sikorska, A.E., D. Viviroli, and J. Seibert, 2015: Flood-type classification in mountainous catchments using crisp and fuzzy decision trees. Water Resources Research, 51(10), 7959–7976, doi: 10.1002/2015wr017326.
Sillmann, J., M.G. Donat, J.C. Fyfe, and F.W. Zwiers, 2014: Observed and simulated temperature extremes during the recent warming hiatus. Environmental Research Letters, 9(6), 64023–64029, doi: 10.1088/1748-9326/9/6/064023.
Sillmann, J., C.W. Stjern, G. Myhre, and P.M. Forster, 2017a: Slow and fast responses of mean and extreme precipitation to different forcing in CMIP5 simulations. Geophysical Research Letters, 44(12), 6383–6390, doi: 10.1002/2017gl073229.
Sillmann, J., V. Kharin, X. Zhang, F.W. Zwiers, and D. Bronaugh, 2013a: Climate extremes indices in the CMIP5 multimodel ensemble: Part 1. Model evaluation in the present climate. Journal of Geophysical Research: Atmospheres, 118(4), 1716–1733, doi: 10.1002/jgrd.50203.
Sillmann, J., V. Kharin, F.W. Zwiers, X. Zhang, and D. Bronaugh, 2013b: Climate extremes indices in the CMIP5 multimodel ensemble: Part 2. Future climate projections. Journal of Geophysical Research: Atmospheres, 118(6), 2473–2493, doi: 10.1002/jgrd.50188.
Sillmann, J. et al., 2017b: Understanding, modeling and predicting weather and climate extremes: Challenges and opportunities. Weather and Climate Extremes, 18, 65–74, doi: 10.1016/j.wace.2017.10.003.
Sillmann, J. et al., 2019: Extreme wet and dry conditions affected differently by greenhouse gases and aerosols. npj Climate and Atmospheric Science, 2(1), 24, doi: 10.1038/s41612-019-0079-3.
Simmons, A.J., K.M. Willett, P.D. Jones, P.W. Thorne, and D.P. Dee, 2010: Low-frequency variations in surface atmospheric humidity, temperature, and precipitation: Inferences from reanalyses and monthly gridded observational data sets. Journal of Geophysical Research: Atmospheres, 115(D1), D01110, doi: 10.1029/2009jd012442.
Singh, D., M. Tsiang, B. Rajaratnam, and N.S. Diffenbaugh, 2014a: Observed changes in extreme wet and dry spells during the South Asian summer monsoon season. Nature Climate Change, 4(6), 456–461, doi: 10.1038/nclimate2208.
Singh, D. et al., 2014b: Severe precipitation in northern India in June 2013: Causes, historical context, and changes in probability [in “Explaining Extreme Events of 2013 from a Climate Perspective”]. Bulletin of the American Meteorological Society, 95(9), S58–S61, doi: 10.1175/1520-0477-95.9.s1.1.
Singh, D. et al., 2018: Climate and the Global Famine of 1876–78. Journal of Climate, 31(23), 9445–9467, doi: 10.1175/jcli-d-18-0159.1.
Singh, K., J. Panda, M. Sahoo, and M. Mohapatra, 2019: Variability in Tropical Cyclone Climatology over North Indian Ocean during the Period 1891 to 2015. Asia-Pacific Journal of Atmospheric Sciences, 55(2), 269–287, doi: 10.1007/s13143-018-0069-0.
Singh, M.S. and P.A. O’Gorman, 2013: Influence of entrainment on the thermal stratification in simulations of radiative–convective equilibrium. Geophysical Research Letters, 40(16), 4398–4403, doi: 10. 1002/grl.50796.
Singh, M.S., Z. Kuang, E.D. Maloney, W.M. Hannah, and B.O. Wolding, 2017: Increasing potential for intense tropical and subtropical thunderstorms under global warming. Proceedings of the National Academy of Sciences, 114(44), 1657–11662, doi: 10.1073/pnas.1707603114.
Singh, S., S. Ghosh, A.S. Sahana, H. Vittal, and S. Karmakar, 2017: Do dynamic regional models add value to the global model projections of Indian monsoon?Climate Dynamics, 48(3), 1375–1397, doi: 10.1007/s00382-016-3147-y.
Singh, V. and M.K. Goyal, 2016: Changes in climate extremes by the use of CMIP5 coupled climate models over eastern Himalayas. Environmental Earth Sciences, 75(9), 839, doi: 10.1007/s12665-016-5651-0.
Sippel, S. and F.E.L. Otto, 2014: Beyond climatological extremes – assessing how the odds of hydrometeorological extreme events in South-East Europe change in a warming climate. Climatic Change, 125(3–4), 381–398, doi: 10.1007/s10584-014-1153-9.
Sippel, S., F.E.L. Otto, M. Flach, and G.J. van Oldenborgh, 2016: The Role of Anthropogenic Warming in 2015 Central European Heat Waves. Bulletin of the American Meteorological Society, 97(12), S51–S56, doi: 10.1175/bams-d-16-0150.1.
Sippel, S. et al., 2015: Quantifying changes in climate variability and extremes: Pitfalls and their overcoming. Geophysical Research Letters, 42(22), 9990–9998, doi: 10.1002/2015gl066307.
Sippel, S. et al., 2017a: Have precipitation extremes and annual totals been increasing in the world’s dry regions over the last 60 years?Hydrology and Earth System Sciences, 21(1), 441–458, doi: 10.5194/hess-21-441-2017.
Sippel, S. et al., 2017b: Refining multi-model projections of temperature extremes by evaluation against land–atmosphere coupling diagnostics. Earth System Dynamics, 8(2), 387–403, doi: 10.5194/esd-8-387-2017.
Sippel, S. et al., 2018: Warm Winter, Wet Spring, and an Extreme Response in Ecosystem Functioning on the Iberian Peninsula. Bulletin of the American Meteorological Society, 99(1), S80–S85, doi: 10.1175/bams-d-17-0135.1.
Siswanto, G.J. van Oldenborgh, G. van der Schrier, G. Lenderink, and B. van den Hurk, 2015: Trends in High-Daily Precipitation Events in Jakarta and the Flooding of January 2014. Bulletin of the American Meteorological Society, 96(12), S131–S135, doi: 10.1175/bams-d-15-00128.1.
Skansi, M.M. et al., 2013: Warming and wetting signals emerging from analysis of changes in climate extreme indices over South America. Global and Planetary Change, 100, 295–307, doi: 10.1016/j.gloplacha.2012.11.004.
Skougaard Kaspersen, P., N. Høegh Ravn, K. Arnbjerg-Nielsen, H. Madsen, and M. Drews, 2017: Comparison of the impacts of urban development and climate change on exposing European cities to pluvial flooding. Hydrology and Earth System Sciences, 21(8), 4131–4147, doi: 10.5194/hess-21-4131-2017.
Slater, L.J. and G. Villarini, 2016: Recent trends in U.S. flood risk. Geophysical Research Letters, 43(24), 12428–12436, doi: 10.1002/2016gl071199.
Slater, L.J. and G. Villarini, 2017: On the impact of gaps on trend detection in extreme streamflow time series. International Journal of Climatology, 37(10), 3976–3983, doi: 10.1002/joc.4954.
Slater, L.J., M.B. Singer, and J.W. Kirchner, 2015: Hydrologic versus geomorphic drivers of trends in flood hazard. Geophysical Research Letters, 42(2), 370–376, doi: 10.1002/2014gl062482.
Smerdon, J.E. and H.N. Pollack, 2016: Reconstructing Earth’s surface temperature over the past 2000 years: the science behind the headlines. WIREs Climate Change, 7(5), 746–771, doi: 10.1002/wcc.418.
Smiatek, G., H. Kunstmann, and A. Senatore, 2016: EURO-CORDEX regional climate model analysis for the Greater Alpine Region: Performance and expected future change. Journal of Geophysical Research: Atmospheres, 121(13), 7710–7728, doi: 10.1002/2015jd024727.
Smith, B.K., J.A. Smith, M.L. Baeck, G. Villarini, and D.B. Wright, 2013: Spectrum of storm event hydrologic response in urban watersheds. Water Resources Research, 49(5), 2649–2663, doi: 10.1002/wrcr.20223.
Sobel, A.H. and S.J. Camargo, 2011: Projected Future Seasonal Changes in Tropical Summer Climate. Journal of Climate, 24(2), 473–487, doi: 10.1175/2010jcli3748.1.
Sobel, A.H., S.J. Camargo, and M. Previdi, 2019: Aerosol versus greenhouse gas effects on tropical cyclone potential intensity and the hydrologic cycle. Journal of Climate, 32(17), 5511–5527, doi: 10.1175/jcli-d-18-0357.1.
Sobel, A.H. et al., 2016: Human influence on tropical cyclone intensity. Science, 353(6296), 242–246, doi: 10.1126/science.aaf6574.
Sohn, B.J., G.-H. Ryu, H.-J. Song, and M.-L. Ou, 2013: Characteristic Features of Warm-Type Rain Producing Heavy Rainfall over the Korean Peninsula Inferred from TRMM Measurements. Monthly Weather Review, 141(11), 3873–3888, doi: 10.1175/mwr-d-13-00075.1.
Sohrabi, M.M., J.H. Ryu, J. Abatzoglou, and J. Tracy, 2015: Development of Soil Moisture Drought Index to Characterize Droughts. Journal of Hydrologic Engineering, 20(11), 04015025, doi: 10.1061/(asce)he.1943-5584.0001213.
Solander, K.C. et al., 2020: The pantropical response of soil moisture to El Niño. Hydrology and Earth System Sciences, 24(5), 2303–2322, doi: 10.5194/hess-24-2303-2020.
Song, J. and P.J. Klotzbach, 2018: What Has Controlled the Poleward Migration of Annual Averaged Location of Tropical Cyclone Lifetime Maximum Intensity Over the Western North Pacific Since 1961?Geophysical Research Letters, 45(2), 1148–1156, doi: 10.1002/2017gl076883.
Song, X., Y. Song, and Y. Chen, 2020: Secular trend of global drought since 1950. Environmental Research Letters, 15(9), 094073, doi: 10.1088/1748-9326/aba20d.
Song, X. et al., 2014: Spatiotemporal changes of global extreme temperature events (ETEs) since 1981 and the meteorological causes. Natural Hazards, 70(2), 975–994, doi: 10.1007/s11069-013-0856-y.
Sonkoué, D., D. Monkam, T.C. Fotso-Nguemo, Z.D. Yepdo, and D.A. Vondou, 2019: Evaluation and projected changes in daily rainfall characteristics over Central Africa based on a multi-model ensemble mean of CMIP5 simulations. Theoretical and Applied Climatology, 137(3–4), 2167–2186, doi: 10.1007/s00704-018-2729-5.
Sorribas, M.V. et al., 2016: Projections of climate change effects on discharge and inundation in the Amazon basin. Climatic Change, 136(3–4), 555–570, doi: 10.1007/s10584-016-1640-2.
Sousa, P.M. et al., 2017: Responses of European precipitation distributions and regimes to different blocking locations. Climate Dynamics, 48(3–4), 1141–1160, doi: 10.1007/s00382-016-3132-5.
Sparrow, S. et al., 2018: Attributing human influence on the July 2017 Chinese heatwave: the influence of sea-surface temperatures. Environmental Research Letters, 13(11), 114004, doi: 10.1088/1748-9326/aae356.
Spennemann, P.C., M.E. Fernández-Long, N.N. Gattinoni, C. Cammalleri, and G. Naumann, 2020: Soil moisture evaluation over the Argentine Pampas using models, satellite estimations and in-situ measurements. Journal of Hydrology: Regional Studies, 31, 100723, doi: 10.1016/j.ejrh.2020.100723.
Sperry, J.S. et al., 2016: Pragmatic hydraulic theory predicts stomatal responses to climatic water deficits. The New phytologist, 212(3), 577–589, doi: 10. 1111/nph.14059.
Spinoni, J., G. Naumann, and J.V. Vogt, 2017: Pan-European seasonal trends and recent changes of drought frequency and severity. Global and Planetary Change, 148, 113–130, doi: 10.1016/j.gloplacha.2016.11.013.
Spinoni, J., G. Naumann, J. Vogt, and P. Barbosa, 2015: The biggest drought events in Europe from 1950 to 2012. Journal of Hydrology: Regional Studies, 3, 509–524, doi: 10.1016/j.ejrh.2015.01.001.
Spinoni, J., G. Naumann, H. Carrao, P. Barbosa, and J. Vogt, 2014: World drought frequency, duration, and severity for 1951–2010. International Journal of Climatology, 34(8), 2792–2804, doi: 10.1002/joc.3875.
Spinoni, J., J. Vogt, G. Naumann, P. Barbosa, and A. Dosio, 2018a: Will drought events become more frequent and severe in Europe?International Journal of Climatology, 38(4), 1718–1736, doi: 10.1002/joc.5291.
Spinoni, J. et al., 2018b: Changes of heating and cooling degree-days in Europe from 1981 to 2100. International Journal of Climatology, 38(S1), e191–e208, doi: 10.1002/joc.5362.
Spinoni, J. et al., 2019: A new global database of meteorological drought events from 1951 to 2016. Journal of Hydrology: Regional Studies, 22, 100593, doi: 10.1016/j.ejrh.2019.100593.
Spinoni, J. et al., 2020: Future Global Meteorological Drought Hot Spots: A Study Based on CORDEX Data. Journal of Climate, 33(9), 3635–3661, doi: 10.1175/jcli-d-19-0084.1.
Srivastava, A., R. Grotjahn, and P.A. Ullrich, 2020: Evaluation of historical CMIP6 model simulations of extreme precipitation over contiguous US regions. Weather and Climate Extremes, 29, 100268, doi: 10.1016/j.wace.2020.100268.
Stagge, J.H., D.G. Kingston, L.M. Tallaksen, and D.M. Hannah, 2017: Observed drought indices show increasing divergence across Europe. Scientific Reports, 7(1), 14045, doi: 10.1038/s41598-017-14283-2.
Stagge, J.H., L.M. Tallaksen, L. Gudmundsson, A.F. Van Loon, and K. Stahl, 2015: Candidate Distributions for Climatological Drought Indices (SPI and SPEI). International Journal of Climatology, 35(13), 4027–4040, doi: 10.1002/joc.4267.
Stahl, K. et al., 2010: Streamflow trends in Europe: Evidence from a dataset of near-natural catchments. Hydrology and Earth System Sciences, 14(12), 2367–2382, doi: 10.5194/hess-14-2367-2010.
Stansfield, A.M., K.A. Reed, and C.M. Zarzycki, 2020: Changes in Precipitation From North Atlantic Tropical Cyclones Under RCP Scenarios in the Variable-Resolution Community Atmosphere Model. Geophysical Research Letters, 47(12), e2019GL086930, doi: 10.1029/2019gl086930.
Staudinger, M., M. Weiler, and J. Seibert, 2015: Quantifying sensitivity to droughts – an experimental modeling approach. Hydrology and Earth System Sciences, 19(3), 1371–1384, doi: 10.5194/hess-19-1371-2015.
Stéfanon, M., P. Drobinski, F. D’Andrea, C. Lebeaupin-Brossier, and S. Bastin, 2014: Soil moisture–temperature feedbacks at meso-scale during summer heat waves over Western Europe. Climate Dynamics, 42(5), 1309–1324, doi: 10.1007/s00382-013-1794-9.
Stegehuis, A.I. et al., 2013: Summer temperatures in Europe and land heat fluxes in observation-based data and regional climate model simulations. Climate Dynamics, 41(2), 455–477, doi: 10.1007/s00382-012-1559-x.
Stennett-Brown, R.K., J.J.P. Jones, T.S. Stephenson, and M.A. Taylor, 2017: Future Caribbean temperature and rainfall extremes from statistical downscaling. International Journal of Climatology, 37(14), 4828–4845, doi: 10.1002/joc.5126.
Stephens, C.M., T.R. McVicar, F.M. Johnson, and L.A. Marshall, 2018: Revisiting Pan Evaporation Trends in Australia a Decade on. Geophysical Research Letters, 45(20), 11164–11172, doi: 10.1029/2018gl079332.
Stephenson, T.S. et al., 2014: Changes in extreme temperature and precipitation in the Caribbean region, 1961–2010. International Journal of Climatology, 34(9), 2957–2971, doi: 10.1002/joc.3889.
Sterling, S.M., A. Ducharne, and J. Polcher, 2013: The impact of global land-cover change on the terrestrial water cycle. Nature Climate Change, 3(4), 385–390, doi: 10.1038/nclimate1690.
Stillman, S., X. Zeng, and M.G. Bosilovich, 2016: Evaluation of 22 Precipitation and 23 Soil Moisture Products over a Semiarid Area in Southeastern Arizona. Journal of Hydrometeorology, 17(1), 211–230, doi: 10.1175/jhm-d-15-0007.1.
Stocker, B.D. et al., 2018: Quantifying soil moisture impacts on light use efficiency across biomes. New Phytologist, 218(4), 1430–1449, doi: 10. 1111/nph.15123.
Stoelzle, M., K. Stahl, and M. Weiler, 2013: Are streamflow recession characteristics really characteristic?Hydrology and Earth System Sciences, 17(2), 817–828, doi: 10.5194/hess-17-817-2013.
Stott, P.A. et al., 2016: Attribution of extreme weather and climate-related events. WIREs Climate Change, 7(1), 23–41, doi: 10.1002/wcc.380.
Strandberg, G. and E. Kjellström, 2019: Climate Impacts from Afforestation and Deforestation in Europe. Earth Interactions, 23(1), 1–27, doi: 10.1175/ei-d-17-0033.1.
Stratton, R.A. et al., 2018: A Pan-African Convection-Permitting Regional Climate Simulation with the Met Office Unified Model: CP4-Africa. Journal of Climate, 31(9), 3485–3508, doi: 10.1175/jcli-d-17-0503.1.
Strong, J.D.O., G.A. Vecchi, and P. Ginoux, 2018: The Climatological Effect of Saharan Dust on Global Tropical Cyclones in a Fully Coupled GCM. Journal of Geophysical Research: Atmospheres, 123(10), 5538–5559, doi: 10.1029/2017jd027808.
Studholme, J. and S. Gulev, 2018: Concurrent Changes to Hadley Circulation and the Meridional Distribution of Tropical Cyclones. Journal of Climate, 31(11), 4367–4389, doi: 10.1175/jcli-d-17-0852.1.
Suarez-Gutierrez, L., C. Li, W.A. Müller, and J. Marotzke, 2018: Internal variability in European summer temperatures at 1.5°C and 2°C of global warming. Environmental Research Letters, 13(6), 064026, doi: 10.1088/1748-9326/aaba58.
Suarez-Gutierrez, L., W.A. Müller, C. Li, and J. Marotzke, 2020a: Dynamical and thermodynamical drivers of variability in European summer heat extremes. Climate Dynamics, 54(9), 4351–4366, doi: 10.1007/s00382-020-05233-2.
Suarez-Gutierrez, L., W.A. Müller, C. Li, and J. Marotzke, 2020b: Hotspots of extreme heat under global warming. Climate Dynamics, 55(3–4), 429–447, doi: 10.1007/s00382-020-05263-w.
Sugi, M., H. Murakami, and J. Yoshimura, 2012: On the Mechanism of Tropical Cyclone Frequency Changes Due to Global Warming. Journal of the Meteorological Society of Japan. Series II, 90A, 397–408, doi: 10.2151/jmsj.2012-a24.
Sugi, M., H. Murakami, and K. Yoshida, 2017: Projection of future changes in the frequency of intense tropical cyclones. Climate Dynamics, 49(1), 619–632, doi: 10.1007/s00382-016-3361-7.
Sugi, M. et al., 2020: Future changes in frequency of tropical cyclone seeds. SOLA, 16, 70–74, doi: 10.2151/sola.2020-012.
Sui, C., Z. Zhang, L. Yu, Y. Li, and M. Song, 2017: Investigation of Arctic air temperature extremes at north of 60°N in winter. Acta Oceanologica Sinica, 36(11), 51–60, doi: 10.1007/s13131-017-1137-5.
Sui, C.H., M. Satoh, and K. Suzuki, 2020: Precipitation Efficiency and its Role in Cloud-Radiative Feedbacks to Climate Variability. Journal of the Meteorological Society of Japan. Series II, 98(2), 261–282, doi: 10.2151/jmsj.2020-024.
Sui, Y., X. Lang, and D. Jiang, 2018: Projected signals in climate extremes over China associated with a 2°C global warming under two RCP scenarios. International Journal of Climatology, 38, e678–e697, doi: 10.1002/joc.5399.
Sun, C., Z. Jiang, W. Li, Q. Hou, and L. Li, 2019: Changes in extreme temperature over China when global warming stabilized at 1.5°C and 2.0°C. Scientific Reports, 9(1), 14982, doi: 10.1038/s41598-019-50036-z.
Sun, J., D. Wang, X. Hu, Z. Ling, and L. Wang, 2019: Ongoing Poleward Migration of Tropical Cyclone Occurrence Over the Western North Pacific Ocean. Geophysical Research Letters, 46(15), 9110–9117, doi: 10.1029/2019gl084260.
Sun, Q. and C. Miao, 2018: Extreme Rainfall (R20mm, RX5day) in Yangtze–Huai, China, in June–July 2016: The Role of ENSO and Anthropogenic Climate Change. Bulletin of the American Meteorological Society, 99(1), S102–S106, doi: 10.1175/bams-d-17-0091.1.
Sun, Q., F. Zwiers, X. Zhang, and G. Li, 2020: A Comparison of Intra-Annual and Long-Term Trend Scaling of Extreme Precipitation with Temperature in a Large-Ensemble Regional Climate Simulation. Journal of Climate, 33(21), 9233–9245, doi: 10.1175/jcli-d-19-0920.1.
Sun, Q., X. Zhang, F. Zwiers, S. Westra, and L. Alexander, 2021: A Global, Continental, and Regional Analysis of Changes in Extreme Precipitation. Journal of Climate, 34(1), 243–258, doi: 10.1175/jcli-d-19-0892.1.
Sun, Q. et al., 2019: Global heat stress on health, wildfires, and agricultural crops under different levels of climate warming. Environment International, 128, 125–136, doi: 10.1016/j.envint.2019.04.025.
Sun, X.B. et al., 2017: Changes in extreme temperature events over the Hindu Kush Himalaya during 1961–2015. Advances in Climate Change Research, 8(3), 157–165, doi: 10.1016/j.accre.2017.07.001.
Sun, Y., T. Hu, and X. Zhang, 2018a: Substantial Increase in Heat Wave Risks in China in a Future Warmer World. Earth’s Future, 6(11), 1528–1538, doi: 10.1029/2018ef000963.
Sun, Y. et al., 2014: Rapid increase in the risk of extreme summer heat in Eastern China. Nature Climate Change, 4(12), 1082–1085, doi: 10.1038/nclimate2410.
Sun, Y. et al., 2018b: Anthropogenic Influence on the Eastern China 2016 Super Cold Surge. Bulletin of the American Meteorological Society, 99(1), S123–S127, doi: 10.1175/bams-d-17-0092.1.
Sun, Y. et al., 2019: Contribution of Global warming and Urbanization to Changes in Temperature Extremes in Eastern China. Geophysical Research Letters, 46(20), 11426–11434, doi: 10.1029/2019gl084281.
Sun, Z. et al., 2018: Recent rebound in observational large-pan evaporation driven by heat wave and droughts by the Lower Yellow River. Journal of Hydrology, 565, 237–247, doi: 10.1016/j.jhydrol.2018.08.014.
Sunyer, M.A. et al., 2015: Inter-comparison of statistical downscaling methods for projection of extreme precipitation in Europe. Hydrology and Earth System Sciences, 19(4), 1827–1847, doi: 10.5194/hess-19-1827-2015.
Supari, F. Tangang, L. Juneng, and E. Aldrian, 2017: Observed changes in extreme temperature and precipitation over Indonesia. International Journal of Climatology, 37(4), 1979–1997, doi: 10.1002/joc.4829.
Supari et al., 2020: Multi-model projections of precipitation extremes in Southeast Asia based on CORDEX-Southeast Asia simulations. Environmental Research, 184, 109350, doi: 10.1016/j.envres.2020.109350.
Sutton, R.T., 2018: ESD Ideas: a simple proposal to improve the contribution of IPCC WGI to the assessment and communication of climate change risks. Earth System Dynamics, 9(4), 1155–1158, doi: 10.5194/esd-9-1155-2018.
Sutton, R.T., 2019: Climate Science Needs to Take Risk Assessment Much More Seriously. Bulletin of the American Meteorological Society, 100(9), 1637–1642, doi: 10.1175/bams-d-18-0280.1.
Swain, D.L., B. Langenbrunner, J.D. Neelin, and A. Hall, 2018: Increasing precipitation volatility in twenty-first-century California. Nature Climate Change, 8(5), 427–433, doi: 10.1038/s41558-018-0140-y.
Swain, D.L. et al., 2014: The Extraordinary California Drought of 2013/2014: Character, Context, and the Role of Climate Change [in “Explaining Extreme Events of 2013 from a Climate Perspective”]. Bulletin of the American Meteorological Society, 95(9), S3–S7, doi: 10.1175/1520-0477-95.9.s1.1.
Swain, S. and K. Hayhoe, 2015: CMIP5 projected changes in spring and summer drought and wet conditions over North America. Climate Dynamics, 44(9–10), 2737–2750, doi: 10.1007/s00382-014-2255-9.
Swann, A.L.S., 2018: Plants and Drought in a Changing Climate. Current Climate Change Reports, 4(2), 192–201, doi: 10.1007/s40641-018-0097-y.
Swann, A.L.S., F.M. Hoffman, C.D. Koven, and J.T. Randerson, 2016: Plant responses to increasing CO2 reduce estimates of climate impacts on drought severity. Proceedings of the National Academy of Sciences, 113(36), 10019–10024, doi: 10.1073/pnas.1604581113.
Swierczynski, T. et al., 2013: Mid- to late Holocene flood frequency changes in the northeastern Alps as recorded in varved sediments of Lake Mondsee (Upper Austria). Quaternary Science Reviews, 80, 78–90, doi: 10.1016/j.quascirev.2013.08.018.
Syafrina, A.H., M.D. Zalina, and L. Juneng, 2015: Historical trend of hourly extreme rainfall in Peninsular Malaysia. Theoretical and Applied Climatology, 120(1), 259–285, doi: 10.1007/s00704-014-1145-8.
Sylla, M.B., N. Elguindi, F. Giorgi, and D. Wisser, 2016: Projected robust shift of climate zones over West Africa in response to anthropogenic climate change for the late 21st century. Climatic Change, 134(1–2), 241–253, doi: 10.1007/s10584-015-1522-z.
Szeto, K., P. Gysbers, J. Brimelow, and R. Stewart, 2015: The 2014 Extreme Flood on the Southeastern Canadian Prairies. Bulletin of the American Meteorological Society, 96(12), S20–S24, doi: 10.1175/bams-d-15-00110.1.
Tabari, H. and M.-B. Aghajanloo, 2013: Temporal pattern of aridity index in Iran with considering precipitation and evapotranspiration trends. International Journal of Climatology, 33(2), 396–409, doi: 10.1002/joc.3432.
Tabari, H. and P. Willems, 2018: More prolonged droughts by the end of the century in the Middle East. Environmental Research Letters, 13(10), 104005, doi: 10.1088/1748-9326/aae09c.
Tabari, H., K. Madani, and P. Willems, 2020: The contribution of anthropogenic influence to more anomalous extreme precipitation in Europe. Environmental Research Letters, 15(10), 104077, doi: 10.1088/1748-9326/abb268.
Takahashi, C., M. Watanabe, and M. Mori, 2017: Significant Aerosol Influence on the Recent Decadal Decrease in Tropical Cyclone Activity Over the Western North Pacific. Geophysical Research Letters, 44(18), 9496–9504, doi: 10.1002/2017gl075369.
Takahashi, C., M. Watanabe, H. Shiogama, Y. Imada, and M. Mori, 2016: A Persistent Japanese Heat Wave in Early August 2015: Roles of Natural Variability and Human-Induced Warming. Bulletin of the American Meteorological Society, 97(12), S107–S112, doi: 10.1175/bams-d-16-0157.1.
Takayabu, I. et al., 2015: Climate change effects on the worst-case storm surge: a case study of Typhoon Haiyan. Environmental Research Letters, 10(6), 064011, doi: 10.1088/1748-9326/10/6/064011.
Takemi, T. and T. Unuma, 2019: Diagnosing Environmental Properties of the July 2018 Heavy Rainfall Event in Japan. SOLA, 15A, 60–65, doi: 10.2151/sola.15a-011.
Takemura, K. et al., 2019: Extreme Moisture Flux Convergence over Western Japan during the Heavy Rain Event of July 2018. SOLA, 15A, 49–54, doi: 10.2151/sola.15a-009.
Talchabhadel, R., R. Karki, B.R. Thapa, M. Maharjan, and B. Parajuli, 2018: Spatio-temporal variability of extreme precipitation in Nepal. International Journal of Climatology, 38(11), 4296–4313, doi: 10.1002/joc.5669.
Tallaksen, L.M. and K. Stahl, 2014: Spatial and temporal patterns of large-scale droughts in Europe: Model dispersion and performance. Geophysical Research Letters, 41(2), 429–434, doi: 10.1002/2013gl058573.
Tamura, T., W.A. Nicholas, T.S.N. Oliver, and B.P. Brooke, 2018: Coarse-sand beach ridges at Cowley Beach, north-eastern Australia: Their formative processes and potential as records of tropical cyclone history. Sedimentology, 65(3), 721–744, doi: 10. 1111/sed.12402.
Tandon, N.F., X. Zhang, and A.H. Sobel, 2018: Understanding the Dynamics of Future Changes in Extreme Precipitation Intensity. Geophysical Research Letters, 45(6), 2870–2878, doi: 10.1002/2017gl076361.
Tangang, F. et al., 2018: Future changes in annual precipitation extremes over Southeast Asia under global warming of 2°C. APN Science Bulletin, 8(1), 6–11, doi: 10.30852/sb.2018.436.
Tao, Y., W. Wang, S. Song, and J. Ma, 2018: Spatial and Temporal Variations of Precipitation Extremes and Seasonality over China from 1961–2013. Water, 10(6), 719, doi: 10. 3390/w10060719.
Taszarek, M., H.E. Brooks, B. Czernecki, P. Szuster, and K. Fortuniak, 2018: Climatological Aspects of Convective Parameters over Europe: A Comparison of ERA-Interim and Sounding Data. Journal of Climate, 31(11), 4281–4308, doi: 10.1175/jcli-d-17-0596.1.
Taszarek, M. et al., 2019: A Climatology of Thunderstorms across Europe from a Synthesis of Multiple Data Sources. Journal of Climate, 32(6), 1813–1837, doi: 10.1175/jcli-d-18-0372.1.
Tauvale, L. and K. Tsuboki, 2019: Characteristics of Tropical Cyclones in the Southwest Pacific. Journal of the Meteorological Society of Japan. Series II, 97(3), 711–731, doi: 10.2151/jmsj.2019-042.
Taylor, C.M., R.A.M. de Jeu, F. Guichard, P.P. Harris, and W.A. Dorigo, 2012: Afternoon rain more likely over drier soils. Nature, 489(7416), 423–426, doi: 10.1038/nature11377.
Taylor, C.M. et al., 2017: Frequency of extreme Sahelian storms tripled since 1982 in satellite observations. Nature, 544(7651), 475–478, doi: 10.1038/nature22069.
Taylor, M.A. et al., 2018: Future Caribbean Climates in a World of Rising Temperatures: The 1.5 vs 2.0 Dilemma. Journal of Climate, 31(7), 2907–2926, doi: 10.1175/jcli-d-17-0074.1.
Taylor, R.G. et al., 2013: Ground water and climate change. Nature Climate Change, 3(4), 322–329, doi: 10.1038/nclimate1744.
Tebaldi, C. and R. Knutti, 2018: Evaluating the accuracy of climate change pattern emulation for low warming targets. Environmental Research Letters, 13(5), 055006, doi: 10.1088/1748-9326/aabef2.
Tebaldi, C. and M.F. Wehner, 2018: Benefits of mitigation for future heat extremes under RCP4.5 compared to RCP8.5. Climatic Change, 146(3), 349–361, doi: 10.1007/s10584-016-1605-5.
Tebaldi, C., A. Armbruster, H.P. Engler, and R. Link, 2020: Emulating climate extreme indices. Environmental Research Letters, 15(7), 074006, doi: 10.1088/1748-9326/ab8332.
Tencer, B. and M. Rusticucci, 2012: Analysis of interdecadal variability of temperature extreme events in Argentina applying EVT. Atmósfera, 25(4), 327–337, www2.revistascca.unam.mx/atm/index.php/atm/article/ view/33693.
Tencer, B., M.L. Bettolli, and M. Rusticucci, 2016: Compound temperature and precipitation extreme events in southern South America: associated atmospheric circulation, and simulations by a multi-RCM ensemble. Climate Research, 68(2–3), 183–199, doi: 10.3354/cr01396.
Tennille, S.A. and K.N. Ellis, 2017: Spatial and temporal trends in the location of the lifetime maximum intensity of tropical cyclones. Atmosphere, 8(10), 1–9, doi: 10.3390/atmos8100198.
Teufel, B. et al., 2017: Investigation of the 2013 Alberta flood from weather and climate perspectives. Climate Dynamics, 48(9–10), 2881–2899, doi: 10.1007/s00382-016-3239-8.
Teufel, B. et al., 2019: Investigation of the mechanisms leading to the 2017 Montreal flood. Climate Dynamics, 52(7–8), 4193–4206, doi: 10.1007/s00382-018-4375-0.
Teuling, A.J., 2018: A hot future for European droughts. Nature Climate Change, 8(5), 364–365, doi: 10.1038/s41558-018-0154-5.
Teuling, A.J. et al., 2013: Evapotranspiration amplifies European summer drought. Geophysical Research Letters, 40(10), 2071–2075, doi: 10. 1002/grl.50495.
Teuling, A.J. et al., 2019: Climate change, reforestation/afforestation, and urbanisation impacts on evapotranspiration and streamflow in Europe. Hydrology and Earth System Sciences, 23, 3631–3652, doi: 10.5194/hess-2018-634.
Thackeray, C.W., A.M. DeAngelis, A. Hall, D.L. Swain, and X. Qu, 2018: On the Connection Between Global Hydrologic Sensitivity and Regional Wet Extremes. Geophysical Research Letters, 45(20), 11343–11351, doi: 10.1029/2018gl079698.
Thiery, W. et al., 2016: Hazardous thunderstorm intensification over Lake Victoria. Nature Communications, 7(1), 12786, doi: 10.1038/ncomms12786.
Thiery, W. et al., 2017: Present-day irrigation mitigates heat extremes. Journal of Geophysical Research: Atmospheres, 122(3), 1403–1422, doi: 10.1002/2016jd025740.
Thiery, W. et al., 2020: Warming of hot extremes alleviated by expanding irrigation. Nature Communications, 11(1), 290, doi: 10.1038/s41467-019-14075-4.
Thober, S. et al., 2018: Multi-model ensemble projections of European river floods and high flows at 1.5, 2, and 3 degrees global warming. Environmental Research Letters, 13(1), 014003, doi: 10.1088/1748-9326/aa9e35.
Thorarinsdottir, T.L., J. Sillmann, M. Haugen, N. Gissibl, and M. Sandstad, 2020: Evaluation of CMIP5 and CMIP6 simulations of historical surface air temperature extremes using proper evaluation methods. Environmental Research Letters, 15(12), 124041, doi: 10.1088/1748-9326/abc778.
Tian, X., L. Shu, M. Wang, and F. Zhao, 2017: The impact of climate change on fire risk in Daxing’anling, China. Journal of Forestry Research, 28(5), 997–1006, doi: 10.1007/s11676-017-0383-x.
Tijdeman, E., J. Hannaford, and K. Stahl, 2018: Human influences on streamflow drought characteristics in England and Wales. Hydrology and Earth System Sciences, 22(2), 1051–1064, doi: 10.5194/hess-22-1051-2018.
Tilinina, N., S.K. Gulev, I. Rudeva, and P. Koltermann, 2013: Comparing Cyclone Life Cycle Characteristics and Their Interannual Variability in Different Reanalyses. Journal of Climate, 26(17), 6419–6438, doi: 10.1175/jcli-d-12-00777.1.
Timmermans, B., C. Patricola, and M. Wehner, 2018: Simulation and Analysis of Hurricane-Driven Extreme Wave Climate Under Two Ocean Warming Scenarios. Oceanography, 31(2), 88–99, doi: 10.5670/oceanog.2018.218.
Timmermans, B., D. Stone, M. Wehner, and H. Krishnan, 2017: Impact of tropical cyclones on modeled extreme wind-wave climate. Geophysical Research Letters, 44(3), 1393–1401, doi: 10.1002/2016gl071681.
Timmermans, B., M. Wehner, D. Cooley, T. O’Brien, and H. Krishnan, 2019: An evaluation of the consistency of extremes in gridded precipitation data sets. Climate Dynamics, 52(11), 6651–6670, doi: 10.1007/s00382-018-4537-0.
Ting, M., S.J. Camargo, C. Li, and Y. Kushnir, 2015: Natural and Forced North Atlantic Hurricane Potential Intensity Change in CMIP5 Models. Journal of Climate, 28(10), 3926–3942, doi: 10.1175/jcli-d-14-00520.1.
Ting, M., J.P. Kossin, S.J. Camargo, and C. Li, 2019: Past and Future Hurricane Intensity Change along the U.S. East Coast. Scientific Reports, 9(1), 7795, doi: 10.1038/s41598-019-44252-w.
Tippett, M.K., S.J. Camargo, and A.H. Sobel, 2011: A Poisson Regression Index for Tropical Cyclone Genesis and the Role of Large-Scale Vorticity in Genesis. Journal of Climate, 24(9), 2335–2357, doi: 10.1175/2010jcli3811.1.
Tochimoto, E. and H. Niino, 2016: Structural and Environmental Characteristics of Extratropical Cyclones that Cause Tornado Outbreaks in the Warm Sector: A Composite Study. Monthly Weather Review, 144(3), 945–969, doi: 10.1175/m wr-d-15-0015.1.
Tochimoto, E. and H. Niino, 2018: Structure and Environment of Tornado-Spawning Extratropical Cyclones around Japan. Journal of the Meteorological Society of Japan. Series II, 96(4), 355–380, doi: 10.2151/jmsj.2018-043.
Todzo, S., A. Bichet, and A. Diedhiou, 2020: Intensification of the hydrological cycle expected in West Africa over the 21st century. Earth System Dynamics, 11(1), 319–328, doi: 10.5194/esd-11-319-2020.
Tokinaga, H. and S.-P. Xie, 2011: Wave- and Anemometer-Based Sea Surface Wind (WASWind) for Climate Change Analysis. Journal of Climate, 24(1), 267–285, doi: 10.1175/2010jcli3789.1.
Tomas-Burguera, M. et al., 2020: Global characterization of the varying responses of the Standardized Evapotranspiration Index (SPEI) to atmospheric evaporative demand (AED). Journal of Geophysical Research: Atmospheres, 125, e2020JD0330178, doi: 10.1029/2020jd033017.
Tomozeiu, R., G. Agrillo, C. Cacciamani, and V. Pavan, 2014: Statistically downscaled climate change projections of surface temperature over Northern Italy for the periods 2021–2050 and 2070–2099. Natural Hazards, 72(1), 143–168, doi: 10.1007/s11069-013-0552-y.
Toreti, A. et al., 2019: The Exceptional 2018 European Water Seesaw Calls for Action on Adaptation. Earth’s Future, 7(6), 652–663, doi: 10.1029/2019ef001170.
Touma, D., M. Ashfaq, M.A. Nayak, S.-C. Kao, and N.S. Diffenbaugh, 2015: A multi-model and multi-index evaluation of drought characteristics in the 21st century. Journal of Hydrology, 526, 196–207, doi: 10.1016/j.jhydrol.2014.12.011.
Tous, M., G. Zappa, R. Romero, L. Shaffrey, and P.L. Vidale, 2016: Projected changes in medicanes in the HadGEM3 N512 high-resolution global climate model. Climate Dynamics, 47(5–6), 1913–1924, doi: 10.1007/s00382-015-2941-2.
Tozer, C.R. et al., 2020: A 1-Day Extreme Rainfall Event in Tasmania: Process Evaluation and Long Tail Attribution [in “Explaining Extreme Events of 2018 from a Climate Perspective”]. Bulletin of the American Meteorological Society, 101(1), S123–S128, doi: 10.1175/bams-d-19-0219.1.
Tramblay, Y. and S. Somot, 2018: Future evolution of extreme precipitation in the Mediterranean. Climatic Change, 151(2), 289–302, doi: 10.1007/s10584-018-2300-5.
Tramblay, Y., G. Villarini, and W. Zhang, 2020: Observed changes in flood hazard in Africa. Environmental Research Letters, 15(10), 1040b5, doi: 10.1088/1748-9326/abb90b.
Trancoso, R., J.R. Larsen, T.R. McVicar, S.R. Phinn, and C.A. McAlpine, 2017: CO2 -vegetation feedbacks and other climate changes implicated in reducing base flow. Geophysical Research Letters, 44(5), 2310–2318, doi: 10.1002/2017gl072759.
Trapp, R.J., K.A. Hoogewind, and S. Lasher-Trapp, 2019: Future Changes in Hail Occurrence in the United States Determined through Convection-Permitting Dynamical Downscaling. Journal of Climate, 32(17), 5493–5509, doi: 10.1175/jcli-d-18-0740.1.
Trapp, R.J., S.A. Tessendorf, E.S. Godfrey, and H.E. Brooks, 2005: Tornadoes from Squall Lines and Bow Echoes. Part I: Climatological Distribution. Weather and Forecasting, 20(1), 23–34, doi: 10. 1175/waf-835.1.
Trenary, L., T. DelSole, B. Doty, and M.K. Tippett, 2015: Was the Cold Eastern US Winter of 2014 Due to Increased Variability?Bulletin of the American Meteorological Society, 96(12), S15–S19, doi: 10.1175/bams-d-15-00138.1.
Trenary, L., T. DelSole, M.K. Tippett, and B. Doty, 2016: Extreme Eastern U.S. Winter of 2015 Not Symptomatic of Climate Change. Bulletin of the American Meteorological Society, 97(12), S31–S35, doi: 10.1175/bams-d-16-0156.1.
Trenberth, K., C. Lijing, J. Peter, Z. Yongxin, and F. John, 2018: Hurricane Harvey Links to Ocean Heat Content and Climate Change Adaptation. Earth’s Future, 6(5), 730–744, doi: 10.1029/2018ef000825.
Trenberth, K.E., J.T. Fasullo, and T.G. Shepherd, 2015: Attribution of climate extreme events. Nature Climate Change, 5(8), 725–730, doi: 10.1038/nclimate2657.
Trigg, M.A. et al., 2016: The credibility challenge for global fluvial flood risk analysis. Environmental Research Letters, 11(9), 094014, doi: 10.1088/1748-9326/11/9/094014.
Trinh-Tuan, L. et al., 2019: Application of Quantile Mapping bias correction for mid-future precipitation projections over Vietnam. SOLA, 15, 1–6, doi: 10.2151/sola.2019-001.
Trismidianto and H. Satyawardhana, 2018: Mesoscale Convective Complexes (MCCs) over the Indonesian Maritime Continent during the ENSO events. IOP Conference Series: Earth and Environmental Science, 149(1), 012025, doi: 10.1088/1755-1315/149/1/012025.
Trnka, M. et al., 2015a: Drivers of soil drying in the Czech Republic between 1961 and 2012. International Journal of Climatology, 35(9), 2664–2675, doi: 10.1002/joc.4167.
Trnka, M. et al., 2015b: Soil moisture trends in the Czech Republic between 1961 and 2012. International Journal of Climatology, 35(13), 3733–3747, doi: 10.1002/joc.4242.
Trzeciak, T.M., P. Knippertz, J.S.R. Pirret, and K.D. Williams, 2016: Can we trust climate models to realistically represent severe European windstorms?Climate Dynamics, 46(11–12), 3431–3451, doi: 10.1007/s00382-015-2777-9.
Tsuboki, K. et al., 2015: Future increase of supertyphoon intensity associated with climate change. Geophysical Research Letters, 42(2), 646–652, doi: 10.1002/2014gl061793.
Tsuguti, H. et al., 2018: Meteorological overview and mesoscale characteristics of the Heavy Rain Event of July 2018 in Japan. Landslides, 16(2), 363–371, doi: 10.1007/s10346-018-1098-6.
Tsuji, H., C. Yokoyama, and Y.N. Takayabu, 2020: Contrasting Features of the July 2018 Heavy Rainfall Event and the 2017 Northern Kyushu Rainfall Event in Japan. Journal of the Meteorological Society of Japan. Series II, 98(4), 859–876, doi: 10.2151/jmsj.2020-045.
Turco, M. et al., 2019: Climate drivers of the 2017 devastating fires in Portugal. Scientific Reports, 9(1), 13886, doi: 10.1038/s41598-019-50281-2.
Türkeş, M. and E. Erlat, 2018: Variability and trends in record air temperature events of Turkey and their associations with atmospheric oscillations and anomalous circulation patterns. International Journal of Climatology, 38(14), 5182–5204, doi: 10.1002/joc.5720.
Tuttle, S. and G. Salvucci, 2016: Atmospheric science: Empirical evidence of contrasting soil moisture–precipitation feedbacks across the United States. Science, 352(6287), 825–828, doi: 10.1126/science.aaa7185.
Twardosz, R. and U. Kossowska-Cezak, 2013: Exceptionally hot summers in Central and Eastern Europe (1951–2010). Theoretical and Applied Climatology, 112(3–4), 617–628, doi: 10.1007/s00704-012-0757-0.
Udall, B. and J. Overpeck, 2017: The twenty-first century Colorado River hot drought and implications for the future. Water Resources Research, 53(3), 2404–2418, doi: 10.1002/2016wr019638.
Uhe, P. et al., 2016: Comparison of methods: Attributing the 2014 record European temperatures to human influences. Geophysical Research Letters, 43(16), 8685–8693, doi: 10.1002/2016gl069568.
Uhe, P. et al., 2017: Attributing drivers of the 2016 Kenyan drought. International Journal of Climatology, 38(S1), e554–e568, doi: 10.1002/joc.5389.
Ukkola, A.M., M.G. De Kauwe, M.L. Roderick, G. Abramowitz, and A.J. Pitman, 2020: Robust Future Changes in Meteorological Drought in CMIP6 Projections Despite Uncertainty in Precipitation. Geophysical Research Letters, 47(11), e2020GL087820, doi: 10.1029/2020gl087820.
Ukkola, A.M. et al., 2016: Reduced streamflow in water-stressed climates consistent with CO2 effects on vegetation. Nature Climate Change, 6(1), 75–78, doi: 10.1038/nclimate2831.
Ukkola, A.M. et al., 2018: Evaluating CMIP5 model agreement for multiple drought metrics. Journal of Hydrometeorology, 19(6), 969–988, doi: 10.1175/jhm-d-17-0099.1.
Underwood, B.S., Z. Guido, P. Gudipudi, and Y. Feinberg, 2017: Increased costs to US pavement infrastructure from future temperature rise. Nature Climate Change, 7(10), 704–707, doi: 10.1038/nclimate3390.
UNFCCC, 2016: Decision 1/CP.21: Adoption of the Paris Agreement. In: Report of the Conference of the Parties on its twenty-first session, held in Paris from 30 November to 13 December 2015. Addendum: Part two: Action taken by the Conference of the Parties at its twenty-first session. FCCC/CP/2015/10/Add.1, United Nations Framework Convention on Climate Change (UNFCCC), pp. 1–36, https://unfccc.int/documents/9097.
Utsumi, N., H. Kim, S. Kanae, and T. Oki, 2017: Relative contributions of weather systems to mean and extreme global precipitation. Journal of Geophysical Research: Atmospheres, 122(1), 152–167, doi: 10.1002/2016jd025222.
Valverde, M.C. and J.A. Marengo, 2014: Extreme Rainfall Indices in the Hydrographic Basins of Brazil. Open Journal of Modern Hydrology, 4(1), 10–26, doi: 10.4236/ojmh.2014.41002.
van den Besselaar, E.J.M., A.M.G. Klein Tank, and T.A. Buishand, 2013: Trends in European precipitation extremes over 1951–2010. International Journal of Climatology, 33(12), 2682–2689, doi: 10.1002/joc.3619.
van den Hurk, B., E. van Meijgaard, P. de Valk, K.-J. van Heeringen, and J. Gooijer, 2015: Analysis of a compounding surge and precipitation event in the Netherlands. Environmental Research Letters, 10(3), 035001, doi: 10.1088/1748-9326/10/3/035001.
van den Hurk, B. et al., 2011: Acceleration of land surface model development over a decade of glass. Bulletin of the American Meteorological Society, 92(12), 1593–1600, doi: 10.1175/bams-d-11-00007.1.
van Den Hurk, B. et al., 2016: LS3MIP (v1.0) contribution to CMIP6: The Land Surface, Snow and Soil moisture Model Intercomparison Project – Aims, setup and expected outcome. Geoscientific Model Development, 9(8), 2809–2832, doi: 10.5194/gmd-9-2809-2016.
van Der Linden, E.C., R.J. Haarsma, and G. van Der Schrier, 2019: Impact of climate model resolution on soil moisture projections in central-western Europe. Hydrology and Earth System Sciences, 23(1), 191–206, doi: 10.5194/hess-23-191-2019.
van der Schrier, G., J. Barichivich, K.R. Briffa, and P.D. Jones, 2013: A scPDSI-based global data set of dry and wet spells for 1901–2009. Journal of Geophysical Research: Atmospheres, 118(10), 4025–4048, doi: 10.1002/jgrd.50355.
van der Schrier, G., L.M. Rasmijn, J. Barkmeijer, A. Sterl, and W. Hazeleger, 2018: The 2010 Pakistan floods in a future climate. Climatic Change, 148(1–2), 205–218, doi: 10.1007/s10584-018-2173-7.
van der Wiel, K. et al., 2017: Rapid attribution of the August 2016 flood-inducing extreme precipitation in south Louisiana to climate change. Hydrology and Earth System Sciences, 21(2), 897–921, doi: 10.5194/hess-21-897-2017.
van Dijk, A.I.J.M. et al., 2013: The Millennium Drought in southeast Australia (2001–2009): Natural and human causes and implications for water resources, ecosystems, economy, and society. Water Resources Research, 49(2), 1040–1057, doi: 10.1002/wrcr.20123.
van Huijgevoort, M.H.J. et al., 2013: Global Multimodel Analysis of Drought in Runoff for the Second Half of the Twentieth Century. Journal of Hydrometeorology, 14(5), 1535–1552, doi: 10.1175/jhm-d-12-0186.1.
Van Lanen, H.A.J., N. Wanders, L.M. Tallaksen, and A.F. Van Loon, 2013: Hydrological drought across the world: Impact of climate and physical catchment structure. Hydrology and Earth System Sciences, 17(5), 1715–1732, doi: 10.5194/hess-17-1715-2013.
Van Lanen, H.A.J. et al., 2016: Hydrology needed to manage droughts: the 2015 European case. Hydrological Processes, 30(17), 3097–3104, doi: 10. 1002/hyp.10838.
Van Loon, A.F., 2015: Hydrological drought explained. WIREs Water, 2(4), 359–392, doi: 10. 1002/wat2.1085.
Van Loon, A.F. and H.A.J. Van Lanen, 2012: A process-based typology of hydrological drought. Hydrology and Earth System Sciences, 16(7), 1915–1946, doi: 10.5194/hess-16-1915-2012.
Van Loon, A.F. and G. Laaha, 2015: Hydrological drought severity explained by climate and catchment characteristics. Journal of Hydrology, 526, 3–14, doi: 10.1016/j.jhydrol.2014.10.059.
Van Loon, A.F. et al., 2016: Drought in a human-modified world: Reframing drought definitions, understanding, and analysis approaches. Hydrology and Earth System Sciences, 20(9), 3631–3650, doi: 10.5194/hess-20-3631-2016.
van Oldenborgh, G.J., A. van Urk, and M. Allen, 2012: The Absence of a Role of Climate Change in the 2011 Thailand Floods [in “Explaining Extreme Events of 2011 from a Climate Perspective”]. Bulletin of the American Meteorological Society, 93(7), 1047–1049, doi: 10.1175/bams-d-12-00021.1.
van Oldenborgh, G.J., F.E.L. Otto, K. Haustein, and K. AchutaRao, 2016: The Heavy Precipitation Event of December 2015 in Chennai, India. Bulletin of the American Meteorological Society, 97(12), S87–S91, doi: 10.1175/bams-d-16-0129.1.
van Oldenborgh, G.J. et al., 2017: Attribution of extreme rainfall from Hurricane Harvey, August 2017. Environmental Research Letters, 12(12), 124009, doi: 10.1088/1748-9326/aa9ef2.
van Oldenborgh, G.J. et al., 2018: Extreme heat in India and anthropogenic climate change. Natural Hazards and Earth System Sciences, 18(1), 365–381, doi: 10.5194/nhess-18-365-2018.
van Oldenborgh, G.J. et al., 2019: Cold waves are getting milder in the northern midlatitudes. Environmental Research Letters, 14(11), 114004, doi: 10.1088/1748-9326/ab4867.
van Oldenborgh, G.J. et al., 2021: Attribution of the Australian bushfire risk to anthropogenic climate change. Natural Hazards and Earth System Sciences, 21(3), 941–960, doi: 10.5194/nhess-21-941-2021.
van Vuuren, D.P. et al., 2011: RCP2.6: Exploring the possibility to keep global mean temperature increase below 2°C. Climatic Change, 109(1), 95–116, doi: 10.1007/s10584-011-0152-3.
Vanden Broucke, S., H. Wouters, M. Demuzere, and N.P.M. van Lipzig, 2019: The influence of convection-permitting regional climate modeling on future projections of extreme precipitation: dependency on topography and timescale. Climate Dynamics, 52(9), 5303–5324, doi: 10.1007/s00382-018-4454-2.
Varela, V. et al., 2019: Projection of Forest Fire Danger due to Climate Change in the French Mediterranean Region. Sustainability, 11(16), 4284, doi: 10.3390/su11164284.
Varino, F. et al., 2019: Northern Hemisphere extratropical winter cyclones variability over the 20th century derived from ERA-20C reanalysis. Climate Dynamics, 52(1–2), 1027–1048, doi: 10.1007/s00382-018-4176-5.
Vautard, R., J. Cattiaux, P. Yiou, J.-N. Thépaut, and P. Ciais, 2010: Northern Hemisphere atmospheric stilling partly attributed to an increase in surface roughness. Nature Geoscience, 3(11), 756–761, doi: 10.1038/ngeo979.
Vautard, R. et al., 2013: The simulation of European heat waves from an ensemble of regional climate models within the EURO-CORDEX project. Climate Dynamics, 41(9–10), 2555–2575, doi: 10.1007/s00382-013-1714-z.
Vautard, R. et al., 2015: Extreme Fall 2014 Precipitation in the Cévennes Mountains. Bulletin of the American Meteorological Society, 96(12), S56–S60, doi: 10.1175/bams-d-15-00088.1.
Vautard, R. et al., 2016: Attribution of human-induced dynamical and thermodynamical contributions in extreme weather events. Environmental Research Letters, 11(11), 114009, doi: 10.1088/1748-9326/11/11/114009.
Vautard, R. et al., 2019: Human influence on European winter wind storms such as those of January 2018. Earth System Dynamics, 10(2), 271–286, doi: 10.5194/esd-10-271-2019.
Vautard, R. et al., 2020: Human contribution to the record-breaking June and July 2019 heatwaves in Western Europe. Environmental Research Letters, 15(9), 094077, doi: 10.1088/1748-9326/aba3d4.
Vautard, R. et al., 2021: Evaluation of the Large EURO-CORDEX Regional Climate Model Ensemble. Journal of Geophysical Research: Atmospheres, 126(17), e2019JD032344, doi: 10.1029/2019jd032344.
Veale, L. and G.H. Endfield, 2016: Situating 1816, the ‘year without summer’, in the UK. Geographical Journal, 182(4), 318–330, doi: 10.1111/geoj.12191.
Vecchi, G.A. and B.J. Soden, 2007: Increased tropical Atlantic wind shear in model projections of global warming. Geophysical Research Letters, 34(8), L08702, doi: 10.1029/2006gl028905.
Vecchi, G.A. et al., 2019: Tropical cyclone sensitivities to CO2 doubling: roles of atmospheric resolution, synoptic variability and background climate changes. Climate Dynamics, 53(9–10), 5999–6033, doi: 10.1007/s00382-019-04913-y.
Veettil, A.V. and A.K. Mishra, 2020: Multiscale hydrological drought analysis: Role of climate, catchment and morphological variables and associated thresholds. Journal of Hydrology, 582, 124533, doi: 10.1016/j.jhydrol.2019.124533.
Velázquez, J.A. et al., 2013: An ensemble approach to assess hydrological models’ contribution to uncertainties in the analysis of climate change impact on water resources. Hydrology and Earth System Sciences, 17(2), 565–578, doi: 10.5194/hess-17-565-2013.
Veldkamp, T.I.E. et al., 2017: Water scarcity hotspots travel downstream due to human interventions in the 20th and 21st century. Nature Communications, 8, 15697, doi: 10.1038/ncomms15697.
Vetter, T. et al., 2017: Evaluation of sources of uncertainty in projected hydrological changes under climate change in 12 large-scale river basins. Climatic Change, 141(3), 419–433, doi: 10.1007/s10584-016-1794-y.
Vicente-Serrano, S.M., T.R. McVicar, D.G. Miralles, Y. Yang, and M. Tomas-Burguera, 2020a: Unraveling the influence of atmospheric evaporative demand on drought and its response to climate change. WIREs Climate Change, 11(2), e632, doi: 10.1002/wcc.632.
Vicente-Serrano, S.M., S.M. Quiring, M. Peña-Gallardo, S. Yuan, and F. Domínguez-Castro, 2020b: A review of environmental droughts: Increased risk under global warming?Earth-Science Reviews, 201, 102953, doi: 10.1016/j.earscirev.2019.102953.
Vicente-Serrano, S.M. et al., 2014: Evidence of increasing drought severity caused by temperature rise in southern Europe. Environmental Research Letters, 9(4), 044001, doi: 10.1088/1748-9326/9/4/044001.
Vicente-Serrano, S.M. et al., 2015: Contribution of precipitation and reference evapotranspiration to drought indices under different climates. Journal of Hydrology, 526, 42–54, doi: 10.1016/j.jhydrol.2014.11.025.
Vicente-Serrano, S.M. et al., 2017: Effect of reservoirs on streamflow and river regimes in a heavily regulated river basin of Northeast Spain. CATENA, 149, 727–741, doi: 10.1016/j.catena.2016.03.042.
Vicente-Serrano, S.M. et al., 2019: Climate, Irrigation, and Land Cover Change Explain Streamflow Trends in Countries Bordering the Northeast Atlantic. Geophysical Research Letters, 46(19), 10821–10833, doi: 10.1029/2019gl084084.
Vicente-Serrano, S.M. et al., 2020c: Global characterization of hydrological and meteorological droughts under future climate change: The importance of timescales, vegetation-CO2 feedbacks and changes to distribution functions. International Journal of Climatology, 40(5), 2557–2567, doi: 10.1002/joc.6350.
Vicente-Serrano, S.M. et al., 2021: Long-term variability and trends in meteorological droughts in Western Europe (1851–2018). International Journal of Climatology, 41(S1), E690–E717, doi: 10.1002/joc.6719.
Vichot-Llano, A., D. Martinez-Castro, A. Bezanilla-Morlot, A. Centella-Artola, and F. Giorgi, 2021: Projected changes in precipitation and temperature regimes and extremes over the Caribbean and Central America using a multiparameter ensemble of RegCM4. International Journal of Climatology, 41(2), 1328–1350, doi: 10.1002/joc.6811.
Vidal, J.-P., B. Hingray, C. Magand, E. Sauquet, and A. Ducharne, 2016: Hierarchy of climate and hydrological uncertainties in transient low-flow projections. Hydrology and Earth System Sciences, 20(9), 3651–3672, doi: 10.5194/hess-20-3651-2016.
Vidale, P.L. et al., 2021: Impact of Stochastic Physics and Model Resolution on the Simulation of Tropical Cyclones in Climate GCMs. Journal of Climate, 34(11), 4315–4341, doi: 10.1175/jcli-d-20-0507.1.
Vikhamar-Schuler, D. et al., 2016: Changes in Winter Warming Events in the Nordic Arctic Region. Journal of Climate, 29(17), 6223–6244, doi: 10.1175/jcli-d-15-0763.1.
Villafuerte, M.Q. and J. Matsumoto, 2015: Significant Influences of Global Mean Temperature and ENSO on Extreme Rainfall in Southeast Asia. Journal of Climate, 28(5), 1905–1919, doi: 10.1175/jcli-d-14-00531.1.
Villarini, G., J.A. Smith, and G.A. Vecchi, 2012: Changing Frequency of Heavy Rainfall over the Central United States. Journal of Climate, 26(1), 351–357, doi: 10.1175/jcli-d-12-00043.1.
Vimont, D.J. and J.P. Kossin, 2007: The Atlantic Meridional Mode and hurricane activity. Geophysical Research Letters, 34(7), L07709, doi: 10.1029/2007gl029683.
Vincent, L.A., X. Zhang, Mekis, H. Wan, and E.J. Bush, 2018: Changes in Canada’s Climate: Trends in Indices Based on Daily Temperature and Precipitation Data. Atmosphere-Ocean, 56(5), 332–349, doi: 10.1080/07055900.2018.1514579.
Vincent, L.A. et al., 2011: Observed trends in indices of daily and extreme temperature and precipitation for the countries of the western Indian Ocean, 1961–2008. Journal of Geophysical Research: Atmospheres, 116(D10), D10108, doi: 10.1029/2010jd015303.
Vogel, M.M., J. Zscheischler, and S.I. Seneviratne, 2018: Varying soil moisture–atmosphere feedbacks explain divergent temperature extremes and precipitation projections in central Europe. Earth System Dynamics, 9(3), 1107–1125, doi: 10.5194/esd-9-1107-2018.
Vogel, M.M., M. Hauser, and S.I. Seneviratne, 2020a: Projected changes in hot, dry and wet extreme events’ clusters in CMIP6 multi-model ensemble. Environmental Research Letters, 15(9), 094021, doi: 10.1088/1748-9326/ab90a7.
Vogel, M.M., J. Zscheischler, E.M. Fischer, and S.I. Seneviratne, 2020b: Development of Future Heatwaves for Different Hazard Thresholds. Journal of Geophysical Research: Atmospheres, 125(9), e2019JD032070, doi: 10.1029/2019jd032070.
Vogel, M.M., J. Zscheischler, R. Wartenburger, D. Dee, and S.I. Seneviratne, 2019: Concurrent 2018 Hot Extremes Across Northern Hemisphere Due to Human-Induced Climate Change. Earth’s Future, 7, 2019EF001189, doi: 10.1029/2019ef001189.
Vogel, M.M. et al., 2017: Regional amplification of projected changes in extreme temperatures strongly controlled by soil moisture–temperature feedbacks. Geophysical Research Letters, 44(3), 1511–1519, doi: 10.1002/2016gl071235.
Volosciuk, C. et al., 2016: Rising Mediterranean Sea Surface Temperatures Amplify Extreme Summer Precipitation in Central Europe. Scientific Reports, 6, 32450, doi: 10. 1038/srep32450.
Vose, R.S., D.R. Easterling, K.E. Kunkel, A.N. LeGrande, and M.F. Wehner, 2017: Temperature Changes in the United States. In: Climate Science Special Report: Fourth National Climate Assessment, Volume I[Wuebbles, D.J., D.W. Fahey, K.A. Hibbard, D.J. Dokken, B.C. Stewart, and T.K. Maycock (eds.)]. U.S. Global Change Research Program, Washington, DC, USA, pp. 185–206, doi: 10.7930/j0n29v45.
Wada, Y., L.P.H. van Beek, N. Wanders, and M.F.P. Bierkens, 2013: Human water consumption intensifies hydrological drought worldwide. Environmental Research Letters, 8(3), 034036, doi: 10.1088/1748-9326/8/3/034036.
Wahl, T., S. Jain, J. Bender, S.D. Meyers, and M.E. Luther, 2015: Increasing risk of compound flooding from storm surge and rainfall for major US cities. Nature Climate Change, 5, 1093, doi: 10.1038/nclimate2736.
Waliser, D. and B. Guan, 2017: Extreme winds and precipitation during landfall of atmospheric rivers. Nature Geoscience, 10, 179, doi: 10.1038/ngeo2894.
Walsh, J.E. et al., 2020: Extreme weather and climate events in northern areas: A review. Earth-Science Reviews, 209, 103324, doi: 10.1016/j.earscirev.2020.103324.
Walsh, K.J.E. et al., 2015: Hurricanes and Climate: The U.S. CLIVAR Working Group on Hurricanes. Bulletin of the American Meteorological Society, 96(6), 997–1017, doi: 10.1175/bams-d-13-00242.1.
Walsh, K.J.E. et al., 2016: Tropical cyclones and climate change. WIREs Climate Change, 7(1), 65–89, doi: 10.1002/wcc.371.
Wan, H., X. Zhang, and F. Zwiers, 2019: Human influence on Canadian temperatures. Climate Dynamics, 52(1–2), 479–494, doi: 10.1007/s00382-018-4145-z.
Wanders, N. and H.A.J. Van Lanen, 2015: Future discharge drought across climate regions around the world modelled with a synthetic hydrological modelling approach forced by three general circulation models. Natural Hazards and Earth System Sciences, 15(3), 487–504, doi: 10.5194/nhess-15-487-2015.
Wanders, N. and Y. Wada, 2015: Human and climate impacts on the 21st century hydrological drought. Journal of Hydrology, 526, 208–220, doi: 10.1016/j.jhydrol.2014.10.047.
Wang, H. and S. Schubert, 2014: Causes of the extreme dry conditions over California during early 2013 [in “Explaining Extreme Events of 2013 from a Climate Perspective”]. Bulletin of the American Meteorological Society, 95(9), S7–S11, doi: 10.1175/1520-0477-95.9.s1.1.
Wang, H. et al., 2013: Changes in daily climate extremes in the arid area of northwestern China. Theoretical and Applied Climatology, 112(1–2), 15–28, doi: 10.1007/s00704-012-0698-7.
Wang, K., R.E. Dickinson, and S. Liang, 2012: Global atmospheric evaporative demand over land from 1973 to 2008. Journal of Climate, 25(23), 8353–8361, doi: 10.1175/jcli-d-11-00492.1.
Wang, P., J. Tang, X. Sun, J. Liu, and F. Juan, 2019: Spatiotemporal characteristics of heat waves over China in regional climate simulations within the CORDEX-EA project. Climate Dynamics, 52(1–2), 799–818, doi: 10.1007/s00382-018-4167-6.
Wang, P., X. Wu, Y. Hao, C. Wu, and J. Zhang, 2020: Is Southwest China drying or wetting? Spatiotemporal patterns and potential causes. Theoretical and Applied Climatology, 139(1–2), 1–15, doi: 10.1007/s00704-019-02935-4.
Wang, S.-Y.S., L. Zhao, J.-H. Yoon, P. Klotzbach, and R.R. Gillies, 2018: Quantitative attribution of climate effects on Hurricane Harvey’s extreme rainfall in Texas. Environmental Research Letters, 13(5), 54014, doi: 10.1088/1748-9326/aabb85.
Wang, W., W. Zhou, Y. Li, X. Wang, and D. Wang, 2015: Statistical modeling and CMIP5 simulations of hot spell changes in China. Climate Dynamics, 44(9–10), 2859–2872, doi: 10.1007/s00382-014-2287-1.
Wang, W. et al., 2018: Global lake evaporation accelerated by changes in surface energy allocation in a warmer climate. Nature Geoscience, 11(6), 410–414, doi: 10.1038/s41561-018-0114-8.
Wang, X., D. Jiang, and X. Lang, 2017: Future extreme climate changes linked to global warming intensity. Science Bulletin, 62(24), 1673–1680, doi: 10.1016/j.scib.2017.11.004.
Wang, X.L., B. Trewin, Y. Feng, and D. Jones, 2013a: Historical changes in Australian temperature extremes as inferred from extreme value distribution analysis. Geophysical Research Letters, 40(3), 573–578, doi: 10. 1002/grl.50132.
Wang, X.L., Y. Feng, R. Chan, and V. Isaac, 2016: Inter-comparison of extra-tropical cyclone activity in nine reanalysis datasets. Atmospheric Research, 181, 133–153, doi: 10.1016/j.atmosres.2016.06.010.
Wang, X.L. et al., 2013b: Trends and low frequency variability of extra-tropical cyclone activity in the ensemble of twentieth century reanalysis. Climate Dynamics, 40(11–12), 2775–2800, doi: 10.1007/s00382-012-1450-9.
Wang, Y., K.-H. Lee, Y. Lin, M. Levy, and R. Zhang, 2014: Distinct effects of anthropogenic aerosols on tropical cyclones. Nature Climate Change, 4, 368, doi: 10.1038/nclimate2144.
Wang, Y. et al., 2017: Changes in mean and extreme temperature and precipitation over the arid region of northwestern China: Observation and projection. Advances in Atmospheric Sciences, 34(3), 289–305, doi: 10.1007/s00376-016-6160-5.
Wang, Y.W. and Y.H. Yang, 2014: China’s dimming and brightening: Evidence, causes and hydrological implications. Annales Geophysicae, 32(1), 41–55, doi: 10.5194/angeo-32-41-2014.
Wang, Z., Y. Jiang, H. Wan, J. Yan, and X. Zhang, 2017a: Detection and Attribution of Changes in Extreme Temperatures at Regional Scale. Journal of Climate, 30(17), 7035–7047, doi: 10.1175/jcli-d-15-0835.1.
Wang, Z. et al., 2017b: Scenario dependence of future changes in climate extremes under 1.5°C and 2°C global warming. Scientific Reports, 7(1), 46432, doi: 10. 1038/srep46432.
Ward, P.J. et al., 2018: Dependence between high sea-level and high river discharge increases flood hazard in global deltas and estuaries. Environmental Research Letters, 13(8), 084012, doi: 10.1088/1748-9326/aad400.
Wartenburger, R. et al., 2017: Changes in regional climate extremes as a function of global mean temperature: an interactive plotting framework. Geoscientific Model Development, 10(9), 3609–3634, doi: 10.5194/gmd-10-3609-2017.
Wasko, C. and A. Sharma, 2017: Global assessment of flood and storm extremes with increased temperatures. Scientific Reports, 7(1), 7945, doi: 10.1038/s41598-017-08481-1.
Wasko, C. and R. Nathan, 2019: Influence of changes in rainfall and soil moisture on trends in flooding. Journal of Hydrology, 575, 432–441, doi: 10.1016/j.jhydrol.2019.05.054.
Watterson, I.G., J. Bathols, and C. Heady, 2014: What influences the skill of climate models over the continents?Bulletin of the American Meteorological Society, 95(5), 689–700, doi: 10.1175/bams-d-12-00136.1.
Weber, T. et al., 2018: Analyzing Regional Climate Change in Africa in a 1.5, 2, and 3°C Global Warming World. Earth’s Future, 6(4), 643–655, doi: 10.1002/2017ef000714.
Wehner, M.F., 2020: Characterization of long period return values of extreme daily temperature and precipitation in the CMIP6 models: Part 2, projections of future change. Weather and Climate Extremes, 30, 100284, doi: 10.1016/j.wace.2020.100284.
Wehner, M.F., C. Zarzycki, and C. Patricola, 2019: Estimating the Human Influence on Tropical Cyclone Intensity as the Climate Changes. In: Hurricane Risk[Collins, J. and K. Walsh (eds.)]. Springer, Cham, Switzerland, pp. 235–260, doi: 10.1007/978-3-030-02402-4_12.
Wehner, M.F., P. Gleckler, and J. Lee, 2020: Characterization of long period return values of extreme daily temperature and precipitation in the CMIP6 models: Part 1, model evaluation. Weather and Climate Extremes, 30, 100283, doi: 10.1016/j.wace.2020.100283.
Wehner, M.F., D. Stone, H. Krishnan, K. AchutaRao, and F. Castillo, 2016: The Deadly Combination of Heat and Humidity in India and Pakistan in Summer 2015. Bulletin of the American Meteorological Society, 97(12), S81–S86, doi: 10.1175/bams-d-16-0145.1.
Wehner, M.F., J.R. Arnold, T. Knutson, K.E. Kunkel, and A.N. LeGrande, 2017: Droughts, Floods, and Wildfires. In: Climate Science Special Report: Fourth National Climate Assessment, Volume I[Wuebbles, D.J., D.W. Fahey, K.A. Hibbard, D.J. Dokken, B.C. Stewart, and T.K. Maycock (eds.)]. U.S. Global Change Research Program, Washington, DC, USA, pp. 231–256, doi: 10.7930/j0cj8bnn.
Wehner, M.F., K.A. Reed, B. Loring, D. Stone, and H. Krishnan, 2018a: Changes in tropical cyclones under stabilized 1.5 and 2.0°C global warming scenarios as simulated by the Community Atmospheric Model under the HAPPI protocols. Earth System Dynamics, 9(1), 187–195, doi: 10.5194/esd-9-187-2018.
Wehner, M.F. et al., 2014: The effect of horizontal resolution on simulation quality in the Community Atmospheric Model, CAM5.1. Journal of Advances in Modeling Earth Systems, 6(4), 980–997, doi: 10.1002/2013ms000276.
Wehner, M.F. et al., 2015: Resolution Dependence of Future Tropical Cyclone Projections of CAM5.1 in the U.S. CLIVAR Hurricane Working Group Idealized Configurations. Journal of Climate, 28(10), 3905–3925, doi: 10.1175/jcli-d-14-00311.1.
Wehner, M.F. et al., 2018b: Changes in extremely hot days under stabilized 1.5 and 2.0°C global warming scenarios as simulated by the HAPPI multi-model ensemble. Earth System Dynamics, 9(1), 299–311, doi: 10.5194/esd-9-299-2018.
Wehner, M.F. et al., 2018c: Early 21st century anthropogenic changes in extremely hot days as simulated by the C20C+ detection and attribution multi-model ensemble. Weather and Climate Extremes, 20, 1–8, doi: 10.1016/j.wace.2018.03.001.
Wehrli, K., M. Hauser, and S.I. Seneviratne, 2020: Storylines of the 2018 Northern Hemisphere heatwave at pre-industrial and higher global warming levels. Earth System Dynamics, 11(4), 855–873, doi: 10.5194/esd-11-855-2020.
Wehrli, K., B.P. Guillod, M. Hauser, M. Leclair, and S.I. Seneviratne, 2019: Identifying Key Driving Processes of Major Recent Heat Waves. Journal of Geophysical Research: Atmospheres, 124(22), 11746–11765, doi: 10.1029/2019jd030635.
Weldon, D. and C.J.C. Reason, 2014: Variability of rainfall characteristics over the South Coast region of South Africa. Theoretical and applied climatology, 115(1–2), 177–185, doi: 10.1007/s00704-013-0882-4.
Wen, Q.H., X. Zhang, Y. Xu, and B. Wang, 2013: Detecting human influence on extreme temperatures in China. Geophysical Research Letters, 40(6), 1171–1176, doi: 10. 1002/grl.50285.
Wester, P., A. Mishra, A. Mukherji, and A.B. Shrestha (eds.), 2019: The Hindu Kush Himalaya Assessment: Mountains, Climate Change, Sustainability and People. Springer, Cham, Switzerland, 627 pp., doi: 10.1007/978-3-319-92288-1.
Westra, S., L. Alexander, and F.W. Zwiers, 2013: Global Increasing Trends in Annual Maximum Daily Precipitation. Journal of Climate, 26(11), 3904–3918, doi: 10.1175/jcli-d-12-00502.1.
Westra, S., C.J. White, and A.S. Kiem, 2016: Introduction to the special issue: historical and projected climatic changes to Australian natural hazards. Climatic Change, 139(1), 1–19, doi: 10.1007/s10584-016-1826-7.
Westra, S. et al., 2014: Future changes to the intensity and frequency of short-duration extreme rainfall. Reviews of Geophysics, 52(3), 522–555, doi: 10.1002/2014rg000464.
Wetter, O. and C. Pfister, 2013: An underestimated record breaking event – why summer 1540 was likely warmer than 2003, 41–56, doi: 10.5194/cp-9-41-2013.
Wetter, O. et al., 2014: The year-long unprecedented European heat and drought of 1540 – a worst case. Climatic Change, 125(3–4), 349–363, doi: 10.1007/s10584-014-1184-2.
Wever, N., 2012: Quantifying trends in surface roughness and the effect on surface wind speed observations. Journal of Geophysical Research: Atmospheres, 117(D11), D11104, doi: 10.1029/2011jd017118.
Whan, K. and F. Zwiers, 2016: Evaluation of extreme rainfall and temperature over North America in CanRCM4 and CRCM5. Climate Dynamics, 46(11–12), 3821–3843, doi: 10.1007/s00382-015-2807-7.
Whan, K. et al., 2014: Trends and variability of temperature extremes in the tropical Western Pacific. International Journal of Climatology, 34(8), 2585–2603, doi: 10.1002/joc.3861.
Whan, K. et al., 2015: Impact of soil moisture on extreme maximum temperatures in Europe. Weather and Climate Extremes, 9, 57–67, doi: 10.1016/j.wace.2015.05.001.
Wickham, J.D., T.G. Wade, and K.H. Riitters, 2013: Empirical analysis of the influence of forest extent on annual and seasonal surface temperatures for the continental United States. Global Ecology and Biogeography, 22(5), 620–629, doi: 10. 1111/geb.12013.
Wilcox, L.J., B. Dong, R.T. Sutton, and E.J. Highwood, 2015: The 2014 Hot, Dry Summer in Northeast Asia [in “Explaining Extreme Events of 2014 from a Climate Perspective”]. Bulletin of the American Meteorological Society, 96(12), S105–S110, doi: 10.1175/bams-d-15-00123.1.
Wilcox, L.J. et al., 2018: Multiple perspectives on the attribution of the extreme European summer of 2012 to climate change. Climate Dynamics, 50(9–10), 3537–3555, doi: 10.1007/s00382-017-3822-7.
Wild, M. et al., 2005: From Dimming to Brightening: Decadal Changes in Solar Radiation at Earth’s Surface. Science, 308(5723), 847–850, doi: 10.1126/science.1103215.
Wilhelm, B. et al., 2019: Interpreting historical, botanical, and geological evidence to aid preparations for future floods. WIREs Water, 6(1), e1318, doi: 10. 1002/wat2.1318.
Wilhite, D.A. and R.S. Pulwarty, 2017: Drought as Hazard: Understanding the Natural and Social Context. In: Drought and Water Crises: Integrating Science, Management, and Policy (2nd Edition)[Wilhite, D.A. and R.S. Pulwarty (eds.)]. CRC Press, Boca Raton, FL, USA, pp. 3–22, doi: 10.1201/b22009.
Willems, P., 2013: Multidecadal oscillatory behaviour of rainfall extremes in Europe. Climatic Change, 120(4), 931–944, doi: 10.1007/s10584-013-0837-x.
Willett, K.M. et al., 2014: HadISDH land surface multi-variable humidity and temperature record for climate monitoring. Climate of the Past, 10(6), 1983–2006, doi: 10.5194/cp-10-1983-2014.
Williams, A.P. et al., 2013: Temperature as a potent driver of regional forest drought stress and tree mortality. Nature Climate Change, 3(3), 292–297, doi: 10.1038/nclimate1693.
Williams, A.P. et al., 2014: Causes and Implications of Extreme Atmospheric Moisture Demand during the Record-Breaking 2011 Wildfire Season in the Southwestern United States. Journal of Applied Meteorology and Climatology, 53(12), 2671–2684, doi: 10.1175/jamc-d-14-0053.1.
Williams, A.P. et al., 2015: Contribution of anthropogenic warming to California drought during 2012–2014. Geophysical Research Letters, 42(16), 6819–6828, doi: 10.1002/2015gl064924.
Williams, A.P. et al., 2019: Observed Impacts of Anthropogenic Climate Change on Wildfire in California. Earth’s Future, 7(8), 892–910, doi: 10.1029/2019ef001210.
Williams, A.P. et al., 2020: Large contribution from anthropogenic warming to an emerging North American megadrought. Science, 368(6488), 314–318, doi: 10.1126/science.aaz9600.
Willison, J., W.A. Robinson, and G.M. Lackmann, 2013: The Importance of Resolving Mesoscale Latent Heating in the North Atlantic Storm Track. Journal of the Atmospheric Sciences, 70(7), 2234–2250, doi: 10.1175/jas-d-12-0226.1.
Wing, A.A. et al., 2019: Moist Static Energy Budget Analysis of Tropical Cyclone Intensification in High-Resolution Climate Models. Journal of Climate, 32(18), 6071–6095, doi: 10.1175/jcli-d-18-0599.1.
Winter, H.C., S.J. Brown, and J.A. Tawn, 2017: Characterising the changing behaviour of heatwaves with climate change. Dynamics and Statistics of the Climate System, 1(1), dzw006, doi: 10.1093/climsys/dzw006.
Woldemeskel, F. and A. Sharma, 2016: Should flood regimes change in a warming climate? The role of antecedent moisture conditions. Geophysical Research Letters, 43(14), 7556–7563, doi: 10.1002/2016gl069448.
Woldemichael, A.T., F. Hossain, R. Pielke, and A. Beltrán-Przekurat, 2012: Understanding the impact of dam-triggered land use/land cover change on the modification of extreme precipitation. Water Resources Research, 48(9), 2011WR011684, doi: 10.1029/2011wr011684.
Wolski, P., D. Stone, M. Tadross, M. Wehner, and B. Hewitson, 2014: Attribution of floods in the Okavango basin, Southern Africa. Journal of Hydrology, 511, 350–358, doi: 10.1016/j.jhydrol.2014.01.055.
Wolter, K. et al., 2015: How Unusual was the Cold Winter of 2013/14 in the Upper Midwest?Bulletin of the American Meteorological Society, 96(12), S10–S14, doi: 10.1175/bams-d-15-00126.1.
Wood, R.R. and R. Ludwig, 2020: Analyzing Internal Variability and Forced Response of Subdaily and Daily Extreme Precipitation Over Europe. Geophysical Research Letters, 47(17), e2020GL089300, doi: 10.1029/2020gl089300.
Woodhouse, C.A. and E.K. Wise, 2020: The changing relationship between the upper and lower Missouri River basins during drought. International Journal of Climatology, 40(11), 5011–5028, doi: 10.1002/joc.6502.
Woodward, C., J. Shulmeister, J. Larsen, G.E. Jacobsen, and A. Zawadzki, 2014: The hydrological legacy of deforestation on global wetlands. Science, 346(6211), 844–847, doi: 10.1126/science.1260510.
Woollings, T. et al., 2018: Blocking and its Response to Climate Change. Current Climate Change Reports, 4(3), 287–300, doi: 10.1007/s40641-018-0108-z.
Wu, J., Y. Xu, and X.-J. Gao, 2017: Projected changes in mean and extreme climates over Hindu Kush Himalayan region by 21 CMIP5 models. Advances in Climate Change Research, 8(3), 176–184, doi: 10.1016/j.accre.2017.03.001.
Wu, J. et al., 2018: Impacts of reservoir operations on multi-scale correlations between hydrological drought and meteorological drought. Journal of Hydrology, 563, 726–736, doi: 10.1016/j.jhydrol.2018.06.053.
Wu, M. et al., 2020: The impact of regional climate model formulation and resolution on simulated precipitation in Africa. Earth System Dynamics, 11(2), 377–394, doi: 10.5194/esd-11-377-2020.
Wu, S.-Y., 2015: Changing characteristics of precipitation for the contiguous United States. Climatic Change, 132(4), 677–692, doi: 10.1007/s10584-015-1453-8.
Wu, W. et al., 2018: Mapping Dependence Between Extreme Rainfall and Storm Surge. Journal of Geophysical Research: Oceans, 123(4), 2461–2474, doi: 10.1002/2017jc013472.
Wu, X. et al., 2021: Projected increase in compound dry and hot events over global land areas. International Journal of Climatology, 41(1), 393–403, doi: 10.1002/joc.6626.
Wu, Y. and L.M. Polvani, 2017: Recent Trends in Extreme Precipitation and Temperature over Southeastern South America: The Dominant Role of Stratospheric Ozone Depletion in the CESM Large Ensemble. Journal of Climate, 30(16), 6433–6441, doi: 10.1175/jcli-d-17-0124.1.
Wu, Z. et al., 2020: Recent changes in the drought of China from 1960 to 2014. International Journal of Climatology, 40(7), 3281–3296, doi: 10.1002/joc.6397.
Wuebbles, D. et al., 2014: CMIP5 Climate Model Analyses: Climate Extremes in the United States. Bulletin of the American Meteorological Society, 95(4), 571–583, doi: 10.1175/bams-d-12-00172.1.
Wurbs, R.A. and R.A. Ayala, 2014: Reservoir evaporation in Texas, USA. Journal of Hydrology, 510, 1–9, doi: 10.1016/j.jhydrol.2013.12.011.
Xia, Y., M.B. Ek, Y. Wu, T. Ford, and S.M. Quiring, 2015: Comparison of NLDAS-2 Simulated and NASMD Observed Daily Soil Moisture. Part I: Comparison and Analysis. Journal of Hydrometeorology, 16(5), 1962–1980, doi: 10.1175/jhm-d-14-0096.1.
Xia, Y. et al., 2014: Evaluation of multi-model simulated soil moisture in NLDAS-2. Journal of Hydrology, 512, 107–125, doi: 10.1016/j.jhydrol.2014.02.027.
Xiao, C., P. Wu, L. Zhang, and L. Song, 2016: Robust increase in extreme summer rainfall intensity during the past four decades observed in China. Scientific Reports, 6(1), 38506, doi: 10. 1038/srep38506.
Xiao, K. et al., 2018: Evaporation from a temperate closed-basin lake and its impact on present, past, and future water level. Journal of Hydrology, 561, 59–75, doi: 10.1016/j.jhydrol.2018.03.059.
Xiao, M., B. Udall, and D.P. Lettenmaier, 2018: On the Causes of Declining Colorado River Streamflows. Water Resources Research, 54(9), 6739–6756, doi: 10.1029/2018wr023153.
Xie, W., B. Zhou, Q. You, Y. Zhang, and S. Ullah, 2020: Observed changes in heat waves with different severities in China during 1961–2015. Theoretical and Applied Climatology, 141(3–4), 1529–1540, doi: 10.1007/s00704-020-03285-2.
Xie, X. et al., 2015: Detection and attribution of changes in hydrological cycle over the Three-North region of China: Climate change versus afforestation effect. Agricultural and Forest Meteorology, 203, 74–87, doi: 10.1016/j.agrformet.2015.01.003.
Xin, X., T. Wu, J. Zhang, J. Yao, and Y. Fang, 2020: Comparison of CMIP6 and CMIP5 simulations of precipitation in China and the East Asian summer monsoon. International Journal of Climatology, 40(15), 6423–6440, doi: 10.1002/joc.6590.
Xu, L., N. Chen, and X. Zhang, 2019: Global drought trends under 1.5 and 2°C warming. International Journal of Climatology, 39(4), 2375–2385, doi: 10.1002/joc.5958.
Xu, R. et al., 2020: Wildfires, Global Climate Change, and Human Health. New England Journal of Medicine, 383(22), 2173–2181, doi: 10.1056/nejmsr2028985.
Xu, W. et al., 2013: A meta-analysis of the response of soil moisture to experimental warming. Environmental Research Letters, 8(4), 044027, doi: 10.1088/1748-9326/8/4/044027.
Xu, Y. et al., 2016: Change in Extreme Climate Events over China Based on CMIP5 Change in Extreme Climate Events over China Based on CMIP5. Atmospheric and Oceanic Science Letters, 8, 185–192, doi: 10.3878/aosl20150006.
Xu, Y. et al., 2017: Asian climate change under 1.5–4°C warming targets. Advances in Climate Change Research, 8(2), 99–107, doi: 10.1016/j.accre.2017.05.004.
Xu, Y. et al., 2019: Propagation from meteorological drought to hydrological drought under the impact of human activities: A case study in northern China. Journal of Hydrology, 579, 124147, doi: 10.1016/j.jhydrol.2019.124147.
Xu, Z., Y. Jiang, B. Jia, and G. Zhou, 2016: Elevated-CO2 Response of Stomata and Its Dependence on Environmental Factors. Frontiers in Plant Science, 7, 657, doi: 10.3389/f pls.2016.00657.
Yamada, Y., K. Oouchi, M. Satoh, H. Tomita, and W. Yanase, 2010: Projection of changes in tropical cyclone activity and cloud height due to greenhouse warming: Global cloud-system-resolving approach. Geophysical Research Letters, 37(7), L07709, doi: 10.1029/2010gl042518.
Yamada, Y. et al., 2017: Response of Tropical Cyclone Activity and Structure to Global Warming in a High-Resolution Global Nonhydrostatic Model. Journal of Climate, 30(23), 9703–9724, doi: 10.1175/jcli-d-17-0068.1.
Yamada, Y. et al., 2019: High-Resolution Ensemble Simulations of Intense Tropical Cyclones and Their Internal Variability During the El Niños of 1997 and 2015. Geophysical Research Letters, 46(13), 7592–7601, doi: 10.1029/2019gl082086.
Yamada, Y. et al., 2021: Evaluation of the contribution of tropical cyclone seeds to changes in tropical cyclone frequency due to global warming in high-resolution multi-model ensemble simulations. Progress in Earth and Planetary Science, 8(1), 11, doi: 10.1186/s40645-020-00397-1.
Yamaguchi, M. and S. Maeda, 2020a: Increase in the Number of Tropical Cyclones Approaching Tokyo since 1980. Journal of the Meteorological Society of Japan. Series II, 98(4), 775–786, doi: 10.2151/jmsj.2020-039.
Yamaguchi, M. and S. Maeda, 2020b: Slowdown of Typhoon Translation Speeds in Mid-latitudes in September Influenced by the Pacific Decadal Oscillation and Global Warming. Journal of the Meteorological Society of Japan. Series II, 98(6), 1321–1334, doi: 10.2151/jmsj.2020-068.
Yamaguchi, M., J.C.L. Chan, I.-J. Moon, K. Yoshida, and R. Mizuta, 2020: Global warming changes tropical cyclone translation speed. Nature Communications, 11(1), 47, doi: 10.1038/s41467-019-13902-y.
Yanase, W., M. Satoh, H. Taniguchi, and H. Fujinami, 2012: Seasonal and Intraseasonal Modulation of Tropical Cyclogenesis Environment over the Bay of Bengal during the Extended Summer Monsoon. Journal of Climate, 25(8), 2914–2930, doi: 10.1175/jcli-d-11-00208.1.
Yang, C., L. Li, and J. Xu, 2018: Changing temperature extremes based on CMIP5 output via semi-parametric quantile regression approach. International Journal of Climatology, 38(9), 3736–3748, doi: 10.1002/joc.5524.
Yang, J.A., S. Kim, N. Mori, and H. Mase, 2018: Assessment of long-term impact of storm surges around the Korean Peninsula based on a large ensemble of climate projections. Coastal Engineering, 142, 1–8, doi: 10.1016/j.coastaleng.2018.09.008.
Yang, M.-Z. et al., 2018: Spatial and temporal characteristics of pan evaporation in the Huaihe river basin during 1951–2015. Applied Ecology and Environmental Research, 16, 7635–7655, doi: 10.15666/aeer/1606_76357655.
Yang, S.-H., N.-Y. Kang, J.B. Elsner, and Y. Chun, 2018: Influence of Global Warming on Western North Pacific Tropical Cyclone Intensities during 2015. Journal of Climate, 31(2), 919–925, doi: 10.1175/jcli-d-17-0143.1.
Yang, Y., M.L. Roderick, S. Zhang, T.R. McVicar, and R.J. Donohue, 2019: Hydrologic implications of vegetation response to elevated CO2 in climate projections. Nature Climate Change, 9(1), 44–48, doi: 10.1038/s41558-018-0361-0.
Yang, Y. et al., 2018: Disconnection Between Trends of Atmospheric Drying and Continental Runoff. Water Resources Research, 54(7), 4700–4713, doi: 10.1029/2018wr022593.
Yang, Y. et al., 2020: Comparing Palmer Drought Severity Index drought assessments using the traditional offline approach with direct climate model outputs. Hydrology and Earth System Sciences, 24(6), 2921–2930, doi: 10.5194/hess-24-2921-2020.
Yao, J. et al., 2021: Intensification of extreme precipitation in arid Central Asia. Journal of Hydrology, 598, 125760, doi: 10.1016/j.jhydrol.2020.125760.
Yao, Y., D. Luo, A. Dai, and I. Simmonds, 2017: Increased Quasi Stationarity and Persistence of Winter Ural Blocking and Eurasian Extreme Cold Events in Response to Arctic Warming. Part I: Insights from Observational Analyses. Journal of Climate, 30(10), 3549–3568, doi: 10.1175/jcli-d-16-0261.1.
Yatagai, A., K. Minami, M. Masuda, and N. Sueto, 2019: Development of Intensive APHRODITE Hourly Precipitation Data for Assessment of the Moisture Transport That Caused Heavy Precipitation Events. SOLA, 15A, 43–48, doi: 10.2151/sola.15a-008.
Ye, Z. and Z. Li, 2017: Spatiotemporal Variability and Trends of Extreme Precipitation in the Huaihe River Basin, a Climatic Transitional Zone in East China. Advances in Meteorology, 2017, 3197435, doi: 10.1155/2017/3197435.
Yettella, V. and J.E. Kay, 2017: How will precipitation change in extratropical cyclones as the planet warms? Insights from a large initial condition climate model ensemble. Climate Dynamics, 49(5), 1765–1781, doi: 10.1007/s00382-016-3410-2.
Yin, H. and Y. Sun, 2018: Detection of Anthropogenic Influence on Fixed Threshold Indices of Extreme Temperature. Journal of Climate, 31(16), 6341–6352, doi: 10.1175/jcli-d-17-0853.1.
Yin, H., Y. Sun, and M.G. Donat, 2019: Changes in temperature extremes on the Tibetan Plateau and their attribution. Environmental Research Letters, 14, 124015, doi: 10.1088/1748-9326/ab503c.
Yin, H., M.G. Donat, L. Alexander, and Y. Sun, 2015: Multi-dataset comparison of gridded observed temperature and precipitation extremes over China. International Journal of Climatology, 35(10), 2809–2827, doi: 10.1002/joc.4174.
Yin, H., Y. Sun, H. Wan, X. Zhang, and C. Lu, 2017: Detection of anthropogenic influence on the intensity of extreme temperatures in China. International Journal of Climatology, 37(3), 1229–1237, doi: 10.1002/joc.4771.
Yiou, P. et al., 2017: A statistical framework for conditional extreme event attribution. Advances in Statistical Climatology, Meteorology and Oceanography, 3(1), 17–31, doi: 10.5194/ascmo-3-17-2017.
Yokoyama, C., H. Tsuji, and Y.N. Takayabu, 2020: The Effects of an Upper-Tropospheric Trough on the Heavy Rainfall Event in July 2018 over Japan. Journal of the Meteorological Society of Japan. Series II, 98(1), 235–255, doi: 10.2151/jmsj.2020-013.
Yoshida, K., M. Sugi, R. Mizuta, H. Murakami, and M. Ishii, 2017: Future Changes in Tropical Cyclone Activity in High-Resolution Large-Ensemble Simulations. Geophysical Research Letters, 44(19), 9910–9917, doi: 10.1002/2017gl075058.
You, Q. et al., 2017: A comparison of heat wave climatologies and trends in China based on multiple definitions. Climate Dynamics, 48, 3975–3989, doi: 10.1007/s00382-016-3315-0.
Young, I.R., J. Vinoth, S. Zieger, and A. Babanin, 2012: Investigation of trends in extreme value wave height and wind speed. Journal of Geophysical Research: Oceans, 117(3), 1–13, doi: 10.1029/2011jc007753.
Yu, B., H. Lin, and N. Soulard, 2019: A Comparison of North American Surface Temperature and Temperature Extreme Anomalies in Association with Various Atmospheric Teleconnection Patterns. Atmosphere, 10(4), 172, doi: 10.3390/atmos10040172.
Yu, B., H. Lin, Z.W. Wu, and W.J. Merryfield, 2018: The Asian–Bering–North American teleconnection: seasonality, maintenance, and climate impact on North America. Climate Dynamics, 50(5), 2023–2038, doi: 10.1007/s00382-017-3734-6.
Yu, B., H. Lin, V. Kharin, and X.L. Wang, 2020: Interannual Variability of North American Winter Temperature Extremes and Its Associated Circulation Anomalies in Observations and CMIP5 Simulations. Journal of Climate, 33(3), 847–865, doi: 10.1175/jcli-d-19-0404.1.
Yu, E., J. Sun, H. Chen, and W. Xiang, 2015: Evaluation of a high-resolution historical simulation over China: climatology and extremes. Climate Dynamics, 45(7–8), 2013–2031, doi: 10.1007/s00382-014-2452-6.
Yu, M., Q. Li, M.J. Hayes, M.D. Svoboda, and R.R. Heim, 2014: Are droughts becoming more frequent or severe in China based on the Standardized Precipitation Evapotranspiration Index: 1951–2010?International Journal of Climatology, 34(3), 545–558, doi: 10.1002/joc.3701.
Yu, R. and P. Zhai, 2020: Changes in compound drought and hot extreme events in summer over populated eastern China. Weather and Climate Extremes, 30, 100295, doi: 10.1016/j.wace.2020.100295.
Yuan, S. and S.M. Quiring, 2017: Evaluation of soil moisture in CMIP5 simulations over the contiguous United States using in situ and satellite observations. Hydrology and Earth System Sciences, 21(4), 2203–2218, doi: 10.5194/hess-21-2203-2017.
Yuan, S., S.M. Quiring, and Z.T. Leasor, 2021: Historical Changes in Surface Soil Moisture Over the Contiguous United States: An Assessment of CMIP6. Geophysical Research Letters, 48(1), 1–9, doi: 10.1029/2020gl089991.
Yuan, W. et al., 2019: Increased atmospheric vapor pressure deficit reduces global vegetation growth. Science Advances, 5(8), eaax1396, doi: 10.1126/sciadv.aax1396.
Yuan, X., L. Wang, and E.F. Wood, 2018a: Anthropogenic Intensification of Southern African Flash Droughts as Exemplified by the 2015/16 Season [in “Explaining Extreme Events of 2016 from a Climate Perspective”]. Bulletin of the American Meteorological Society, 99(1), S86–S90, doi: 10.1175/bams-d-17-0077.1.
Yuan, X., S. Wang, and Z.-Z. Hu, 2018b: Do Climate Change and El Niño Increase Likelihood of Yangtze River Extreme Rainfall? [in “Explaining Extreme Events of 2016 from a Climate Perspective”]. Bulletin of the American Meteorological Society, 99(1), S113–S117, doi: 10.1175/bams-d-17-0089.1.
Zaherpour, J. et al., 2018: Worldwide evaluation of mean and extreme runoff from six global-scale hydrological models that account for human impacts. Environmental Research Letters, 13(6), 065015, doi: 10.1088/1748-9326/aac547.
Zahid, M. and G. Rasul, 2012: Changing trends of thermal extremes in Pakistan. Climatic Change, 113(3–4), 883–896, doi: 10.1007/s10584-011-0390-4.
Zahid, M., R. Blender, V. Lucarini, and M.C. Bramati, 2017: Return levels of temperature extremes in southern Pakistan. Earth System Dynamics, 8(4), 1263–1278, doi: 10.5194/esd-8-1263-2017.
Zampieri, M., A. Ceglar, F. Dentener, and A. Toreti, 2017: Wheat yield loss attributable to heat waves, drought and water excess at the global, national and subnational scales. Environmental Research Letters, 12(6), 064008, doi: 10.1088/1748-9326/aa723b.
Zappa, G. and T.G. Shepherd, 2017: Storylines of Atmospheric Circulation Change for European Regional Climate Impact Assessment. Journal of Climate, 30(16), 6561–6577, doi: 10.1175/jcli-d-16-0807.1.
Zappa, G., L.C. Shaffrey, and K.I. Hodges, 2013a: The Ability of CMIP5 Models to Simulate North Atlantic Extratropical Cyclones. Journal of Climate, 26(15), 5379–5396, doi: 10.1175/jcli-d-12-00501.1.
Zappa, G., L.C. Shaffrey, K.I. Hodges, P.G. Sansom, and D.B. Stephenson, 2013b: A Multimodel Assessment of Future Projections of North Atlantic and European Extratropical Cyclones in the CMIP5 Climate Models. Journal of Climate, 26(16), 5846–5862, doi: 10.1175/jcli-d-12-00573.1.
Zappa, G., M.K. Hawcroft, L. Shaffrey, E. Black, and D.J. Brayshaw, 2015: Extratropical cyclones and the projected decline of winter Mediterranean precipitation in the CMIP5 models. Climate Dynamics, 45(7–8), 1727–1738, doi: 10.1007/s00382-014-2426-8.
Zarzycki, C.M., 2016: Tropical Cyclone Intensity Errors Associated with Lack of Two-Way Ocean Coupling in High-Resolution Global Simulations. Journal of Climate, 29(23), 8589–8610, doi: 10.1175/jcli-d-16-0273.1.
Zarzycki, C.M., 2018: Projecting Changes in Societally Impactful Northeastern U.S. Snowstorms. Geophysical Research Letters, 45(21), 12067–12075, doi: 10.1029/2018gl079820.
Zarzycki, C.M. and C. Jablonowski, 2015: Experimental Tropical Cyclone Forecasts Using a Variable-Resolution Global Model. Monthly Weather Review, 143(10), 4012–4037, doi: 10.1175/m wr-d-15-0159.1.
Zarzycki, C.M. and P.A. Ullrich, 2017: Assessing sensitivities in algorithmic detection of tropical cyclones in climate data. Geophysical Research Letters, 44(2), 1141–1149, doi: 10.1002/2016gl071606.
Zarzycki, C.M., C. Jablonowski, and M.A. Taylor, 2014: Using Variable-Resolution Meshes to Model Tropical Cyclones in the Community Atmosphere Model. Monthly Weather Review, 142(3), 1221–1239, doi: 10.1175/mwr-d-13-00179.1.
Zeder, J. and E.M. Fischer, 2020: Observed extreme precipitation trends and scaling in Central Europe. Weather and Climate Extremes, 29, 100266, doi: 10.1016/j.wace.2020.100266.
Zeleke, T.T., F. Giorgi, G.T. Diro, and B.F. Zaitchik, 2017: Trend and periodicity of drought over Ethiopia. International Journal of Climatology, 37(13), 4733–4748, doi: 10.1002/joc.5122.
Zhai, J. et al., 2020: Future drought characteristics through a multi-model ensemble from CMIP6 over South Asia. Atmospheric Research, 246, 105111, doi: 10.1016/j.atmosres.2020.105111.
Zhai, R. et al., 2020: Larger Drought and Flood Hazards and Adverse Impacts on Population and Economic Productivity Under 2.0 than 1.5°C Warming. Earth’s Future, 8(7), e2019EF001398, doi: 10.1029/2019ef001398.
Zhan, R. and Y. Wang, 2017: Weak Tropical Cyclones Dominate the Poleward Migration of the Annual Mean Location of Lifetime Maximum Intensity of Northwest Pacific Tropical Cyclones since 1980. Journal of Climate, 30(17), 6873–6882, doi: 10.1175/jcli-d-17-0019.1.
Zhan, R., B. Chen, and Y. Ding, 2018: Impacts of SST anomalies in the Indian-Pacific basin on Northwest Pacific tropical cyclone activities during three super El Niño years. Journal of Oceanology and Limnology, 36(1), 20–32, doi: 10.1007/s00343-018-6321-8.
Zhan, Y.J. et al., 2017: Changes in extreme precipitation events over the Hindu Kush Himalayan region during 1961–2012. Advances in Climate Change Research, 8(3), 166–175, doi: 10.1016/j.accre.2017.08.002.
Zhang, C. and Y. Wang, 2018: Why is the simulated climatology of tropical cyclones so sensitive to the choice of cumulus parameterization scheme in the WRF model?Climate Dynamics, 51(9), 3613–3633, doi: 10.1007/s00382-018-4099-1.
Zhang, C., F. Liu, and Y. Shen, 2018: Attribution analysis of changing pan evaporation in the Qinghai–Tibetan Plateau, China. International Journal of Climatology, 38, e1032–e1043, doi: 10.1002/joc.5431.
Zhang, D. et al., 2018: Intensification of hydrological drought due to human activity in the middle reaches of the Yangtze River, China. Science of the Total Environment, 637–638, 1432–1442, doi: 10.1016/j.scitotenv.2018.05.121.
Zhang, G., H. Murakami, T.R. Knutson, R. Mizuta, and K. Yoshida, 2020: Tropical cyclone motion in a changing climate. Science Advances, 6(17), eaaz7610, doi: 10.1126/sciadv.aaz7610.
Zhang, J., H. Chen, and Q. Zhang, 2019: Extreme drought in the recent two decades in northern China resulting from Eurasian warming. Climate Dynamics, 52(5–6), 2885–2902, doi: 10.1007/s00382-018-4312-2.
Zhang, L. et al., 2020: The late spring drought of 2018 in South China. Bulletin of the American Meteorological Society, 101(1), S59–S64, doi: 10.1175/bams-d-19-0202.1.
Zhang, M., Y. Chen, Y. Shen, and Y. Li, 2017: Changes of precipitation extremes in arid Central Asia. Quaternary International, 436, 16–27, doi: 10.1016/j.quaint.2016.12.024.
Zhang, M., Y. Chen, Y. Shen, and B. Li, 2019: Tracking climate change in Central Asia through temperature and precipitation extremes. Journal of Geographical Sciences, 29(1), 3–28, doi: 10.1007/s11442-019-1581-6.
Zhang, P. et al., 2019: Observed Changes in Extreme Temperature over the Global Land Based on a Newly Developed Station Daily Dataset. Journal of Climate, 32(24), 8489–8509, doi: 10.1175/jcli-d-18-0733.1.
Zhang, P. et al., 2020: Abrupt shift to hotter and drier climate over inner East Asia beyond the tipping point. Science, 370(6520), 1095–1099, doi: 10.1126/science.abb3368.
Zhang, Q., X. Ni, and F. Zhang, 2017: Decreasing trend in severe weather occurrence over China during the past 50 years. Scientific Reports, 7(1), 42310, doi: 10. 1038/srep42310.
Zhang, Q., X. Gu, V.P. Singh, D. Kong, and X. Chen, 2015a: Spatiotemporal behavior of floods and droughts and their impacts on agriculture in China. Global and Planetary Change, 131, 63–72, doi: 10.1016/j.gloplacha.2015.05.007.
Zhang, Q., X. Gu, V.P. Singh, M. Xiao, and C.-Y. Xu, 2015b: Flood frequency under the influence of trends in the Pearl River basin, China: Changing patterns, causes and implications. Hydrological Processes, 29(6), 1406–1417, doi: 10. 1002/hyp.10278.
Zhang, R. et al., 2015: An overview of projected climate and environmental changes across the Tibetan Plateau in the 21st century. Chinese Science Bulletin, 60(32), 3036–3047, doi: 10.1360/n972014-01296.
Zhang, W. and D. Luo, 2019: A Nonlinear Theory of Atmospheric Blocking: An Application to Greenland Blocking Changes Linked to Winter Arctic Sea Ice Loss. Journal of the Atmospheric Sciences, 77(2), 723–751, doi: 10.1175/jas-d-19-0198.1.
Zhang, W. and T. Zhou, 2019: Significant Increases in Extreme Precipitation and the Associations with Global Warming over the Global Land Monsoon Regions. Journal of Climate, 32(24), 8465–8488, doi: 10.1175/jcli-d-18-0662.1.
Zhang, W., G. Villarini, G.A. Vecchi, and J.A. Smith, 2018: Urbanization exacerbated the rainfall and flooding caused by hurricane Harvey in Houston. Nature, 563(7731), 384–388, doi: 10.1038/s41586-018-0676-z.
Zhang, W., G. Villarini, E. Scoccimarro, and F. Napolitano, 2021: Examining the precipitation associated with medicanes in the high-resolution ERA-5 reanalysis data. International Journal of Climatology, 41(S1), E126–E132, doi: 10.1002/joc.6669.
Zhang, W., G.A. Vecchi, H. Murakami, G. Villarini, and L. Jia, 2016a: The Pacific meridional mode and the occurrence of tropical Cyclones in the western North Pacific. Journal of Climate, 29(1), 381–398, doi: 10.1175/jcli-d-15-0282.1.
Zhang, W. et al., 2016b: Influences of Natural Variability and Anthropogenic Forcing on the Extreme 2015 Accumulated Cyclone Energy in the Western North Pacific. Bulletin of the American Meteorological Society, 97(12), S131–S135, doi: 10.1175/bams-d-16-0146.1.
Zhang, W. et al., 2020: Anthropogenic Influence on 2018 Summer Persistent Heavy Rainfall in Central Western China. Bulletin of the American Meteorological Society, 101(1), S65–S70, doi: 10.1175/bams-d-19-0147.1.
Zhang, X., H. Wan, F.W. Zwiers, G.C. Hegerl, and S.-K. Min, 2013: Attributing intensification of precipitation extremes to human influence. Geophysical Research Letters, 40(19), 5252–5257, doi: 10. 1002/grl.51010.
Zhang, X., F.W. Zwiers, G. Li, H. Wan, and A.J. Cannon, 2017: Complexity in estimating past and future extreme short-duration rainfall. Nature Geoscience, 10, 255, doi: 10.1038/ngeo2911.
Zhang, X. et al., 2019: Changes in Temperature and Precipitation Across Canada. In: Canada’s Changing Climate Report[Bush, E. and D.S. Lemmen (eds.)]. Government of Canada, Ottawa, ON, Canada, pp. 112–193, https://changingclimat e.ca/CCCR2019/.
Zhang, X.S. et al., 2016: How streamflow has changed across Australia since the 1950s: evidence from the network of hydrologic reference stations. Hydrology and Earth System Sciences, 20(9), 3947–3965, doi: 10.5194/hess-20-3947-2016.
Zhang, Y., H. Wang, J. Sun, and H. Drange, 2010: Changes in the tropical cyclone genesis potential index over the western north pacific in the SRES A2 scenario. Advances in Atmospheric Sciences, 27(6), 1246–1258, doi: 10.1007/s00376-010-9096-1.
Zhang, Y., J. Fan, T. Logan, Z. Li, and C.R. Homeyer, 2019a: Wildfire Impact on Environmental Thermodynamics and Severe Convective Storms. Geophysical Research Letters, 46(16), 10082–10093, doi: 10.1029/2019gl084534.
Zhang, Y. et al., 2019b: Regional Patterns of Extreme Precipitation and Urban Signatures in Metropolitan Areas. Journal of Geophysical Research: Atmospheres, 124(2), 641–663, doi: 10.1029/2018jd029718.
Zhang, Z. and B.A. Colle, 2017: Changes in Extratropical Cyclone Precipitation and Associated Processes during the Twenty-First Century over Eastern North America and the Western Atlantic Using a Cyclone-Relative Approach. Journal of Climate, 30(21), 8633–8656, doi: 10.1175/jcli-d-16-0906.1.
Zhang, Z., F.M. Ralph, and M. Zheng, 2019a: The Relationship Between Extratropical Cyclone Strength and Atmospheric River Intensity and Position. Geophysical Research Letters, 46(3), 1814–1823, doi: 10.1029/2018gl079071.
Zhang, Z., K. Wang, D. Chen, J. Li, and R. Dickinson, 2019b: Increase in Surface Friction Dominates the Observed Surface Wind Speed Decline during 1973–2014 in the Northern Hemisphere Lands. Journal of Climate, 32(21), 7421–7435, doi: 10.1175/jcli-d-18-0691.1.
Zhao, C., F. Brissette, J. Chen, and J.-L. Martel, 2020: Frequency change of future extreme summer meteorological and hydrological droughts over North America. Journal of Hydrology, 584, 124316, doi: 10.1016/j.jhydrol.2019.124316.
Zhao, C. et al., 2018: Enlarging Rainfall Area of Tropical Cyclones by Atmospheric Aerosols. Geophysical Research Letters, 45(16), 8604–8611, doi: 10.1029/2018gl079427.
Zhao, K. and R.B. Jackson, 2014: Biophysical forcings of land-use changes from potential forestry activities in North America. Ecological Monographs, 84(2), 329–353, doi: 10. 1890/12-1705.1.
Zhao, M. and I.M. Held, 2011: TC-Permitting GCM Simulations of Hurricane Frequency Response to Sea Surface Temperature Anomalies Projected for the Late-Twenty-First Century. Journal of Climate, 25(8), 2995–3009, doi: 10.1175/jcli-d-11-00313.1.
Zhao, M., I.M. Held, and S.-J. Lin, 2012: Some Counterintuitive Dependencies of Tropical Cyclone Frequency on Parameters in a GCM. Journal of the Atmospheric Sciences, 69(7), 2272–2283, doi: 10.1175/jas-d-11-0238.1.
Zhao, M., I.M. Held, S.J. Lin, and G.A. Vecchi, 2009: Simulations of global hurricane climatology, interannual variability, and response to global warming using a 50-km resolution GCM. Journal of Climate, 22(24), 6653–6678, doi: 10.1175/2009jcli3049.1.
Zhao, S., Y. Deng, and R.X. Black, 2016: Warm Season Dry Spells in the Central and Eastern United States: Diverging Skill in Climate Model Representation. Journal of Climate, 29(15), 5617–5624, doi: 10.1175/jcli-d-16-0321.1.
Zhao, T. and A. Dai, 2015: The magnitude and causes of global drought changes in the twenty-first century under a low-moderate emissions scenario. Journal of Climate, 28(11), 4490–4512, doi: 10.1175/jcli-d-14-00363.1.
Zhao, T. and A. Dai, 2017: Uncertainties in historical changes and future projections of drought. Part II: model-simulated historical and future drought changes. Climatic Change, 144(3), 535–548, doi: 10.1007/s10584-016-1742-x.
Zhao, Y., A. Ducharne, B. Sultan, P. Braconnot, and R. Vautard, 2015: Estimating heat stress from climate-based indicators: present-day biases and future spreads in the CMIP5 global climate model ensemble. Environmental Research Letters, 10(8), 084013, doi: 10.1088/1748-9326/10/8/084013.
Zheng, C., R. Zhang, W. Shi, X. Li, and X. Chen, 2017: Trends in significant wave height and surface wind speed in the China Seas between 1988 and 2011. Journal of Ocean University of China, 16(5), 717–726, doi: 10.1007/s11802-017-3213-z.
Zheng, F., S. Westra, and S.A. Sisson, 2013: Quantifying the dependence between extreme rainfall and storm surge in the coastal zone. Journal of Hydrology, 505, 172–187, doi: 10.1016/j.jhydrol.2013.09.054.
Zheng, H., F.H.S. Chiew, N.J. Potter, and D.G.C. Kirono, 2019: Projections of water futures for Australia: An update. In: 23rd International Congress on Modelling and Simulation – Supporting Evidence-Based Decision Making: The Role of Modelling and Simulation, MODSIM 2019. pp. 1000–1006, doi: 10.36334/modsim. 2019.k7.zhengh.
Zhou, B., Q.H. Wen, Y. Xu, L. Song, and X. Zhang, 2014: Projected changes in temperature and precipitation extremes in China by the CMIP5 multimodel ensembles. Journal of Climate, 27(17), 6591–6611, doi: 10.1175/jcli-d-13-00761.1.
Zhou, B., Y. Xu, J. Wu, S. Dong, and Y. Shi, 2016: Changes in temperature and precipitation extreme indices over China: Analysis of a high-resolution grid dataset. International Journal of Climatology, 36(3), 1051–1066, doi: 10.1002/joc.4400.
Zhou, C., K. Wang, and D. Qi, 2018: Attribution of the July 2016 Extreme Precipitation Event Over China’s Wuhang [in “Explaining Extreme Events of 2016 from a Climate Perspective”]. Bulletin of the American Meteorological Society, 99(1), S107–S111, doi: 10.1175/bams-d-17-0090.1.
Zhou, C., K. Wang, D. Qi, and J. Tan, 2019: Attribution of a Record-Breaking Heatwave Event in Summer 2017 over the Yangtze River Delta [in “Explaining Extreme Events of 2017 from a Climate Perspective”]. Bulletin of the American Meteorological Society, 100(1), S97–S103, doi: 10.1175/bams-d-18-0134.1.
Zhou, C., D. Chen, K. Wang, A. Dai, and D. Qi, 2020: Conditional Attribution of the 2018 Summer Extreme Heat over Northeast China: Roles of Urbanization, Global Warming, and Warming-Induced Circulation Changes. Bulletin of the American Meteorological Society, 101(1), S71–S76, doi: 10.1175/bams-d-19-0197.1.
Zhou, S. et al., 2019: Land–atmosphere feedbacks exacerbate concurrent soil drought and atmospheric aridity. Proceedings of the National Academy of Sciences, 116(38), 18848–18853, doi: 10.1073/pnas.1904955116.
Zhou, S. et al., 2021: Soil moisture–atmosphere feedbacks mitigate declining water availability in drylands. Nature Climate Change, 11(1), 38–44, doi: 10.1038/s41558-020-00945-z.
Zhou, T., F. Song, R. Lin, X. Chen, and X. Chen, 2013: The 2012 north China floods: explaining an extreme rainfall event in the context of a longer-term drying tendency [in “Explaining Extreme Events of 2012 from a Climate Perspective”]. Bulletin of the American Meteorological Society, 94(9), S49–S52, doi: 10.1175/bams-d-13-00085.1.
Zhou, W. et al., 2016: Evaluation of regional climate simulations over the CORDEX-EA-II domain using the COSMO-CLM model. Asia-Pacific Journal of Atmospheric Sciences, 52(2), 107–127, doi: 10.1007/s13143-016-0013-0.
Zhu, S. et al., 2020: Conspicuous temperature extremes over Southeast Asia: seasonal variations under 1.5°C and 2°C global warming. Climatic Change, 160(3), 343–360, doi: 10.1007/s10584-019-02640-1.
Zieger, S., A. Babanin, and I.R. Young, 2014: Changes in ocean surface wind with a focus on trends in regional and monthly mean values. Deep-Sea Research Part I: Oceanographic Research Papers, 86, 56–67, doi: 10.1016/j.dsr.2014.01.004.
Zipser, E.J., D.J. Cecil, C. Liu, S.W. Nesbitt, and D.P. Yorty, 2006: Where are the most: Intense thunderstorms on Earth?Bulletin of the American Meteorological Society, 87(8), 1057–1071, doi: 10.1175/bams-87-8-1057.
Zittis, G., 2018: Observed rainfall trends and precipitation uncertainty in the vicinity of the Mediterranean, Middle East and North Africa. Theoretical and Applied Climatology, 134(3–4), 1207–1230, doi: 10.1007/s00704-017-2333-0.
Zolina, O., C. Simmer, K. Belyaev, S.K. Gulev, and P. Koltermann, 2013: Changes in the duration of European wet and dry spells during the last 60 years. Journal of Climate, 26(6), 2022–2047, doi: 10.1175/jcli-d-11-00498.1.
Zollo, A.L., V. Rillo, E. Bucchignani, M. Montesarchio, and P. Mercogliano, 2016: Extreme temperature and precipitation events over Italy: assessment of high-resolution simulations with COSMO-CLM and future scenarios. International Journal of Climatology, 36(2), 987–1004, doi: 10.1002/joc.4401.
Zscheischler, J. and S.I. Seneviratne, 2017: Dependence of drivers affects risks associated with compound events. Science Advances, 3(6), e1700263, doi: 10.1126/sciadv.1700263.
Zscheischler, J. and E.M. Fischer, 2020: The record-breaking compound hot and dry 2018 growing season in Germany. Weather and Climate Extremes, 29, 100270, doi: 10.1016/j.wace.2020.100270.
Zscheischler, J., E.M. Fischer, and S. Lange, 2019: The effect of univariate bias adjustment on multivariate hazard estimates. Earth System Dynamics, 10(1), 31–43, doi: 10.5194/esd-10-31-2019.
Zscheischler, J. et al., 2018: Future climate risk from compound events. Nature Climate Change, 8(6), 469–477, doi: 10.1038/s41558-018-0156-3.
Zscheischler, J. et al., 2020: A typology of compound weather and climate events. Nature Reviews Earth & Environment, 1(7), 333–347, doi: 10.1038/s43017-020-0060-z.
Zulkafli, Z. et al., 2016: Projected increases in the annual flood pulse of the Western Amazon. Environmental Research Letters, 11(1), 014013, doi: 10.1088/1748-9326/11/1/014013.
Appendix 11.A
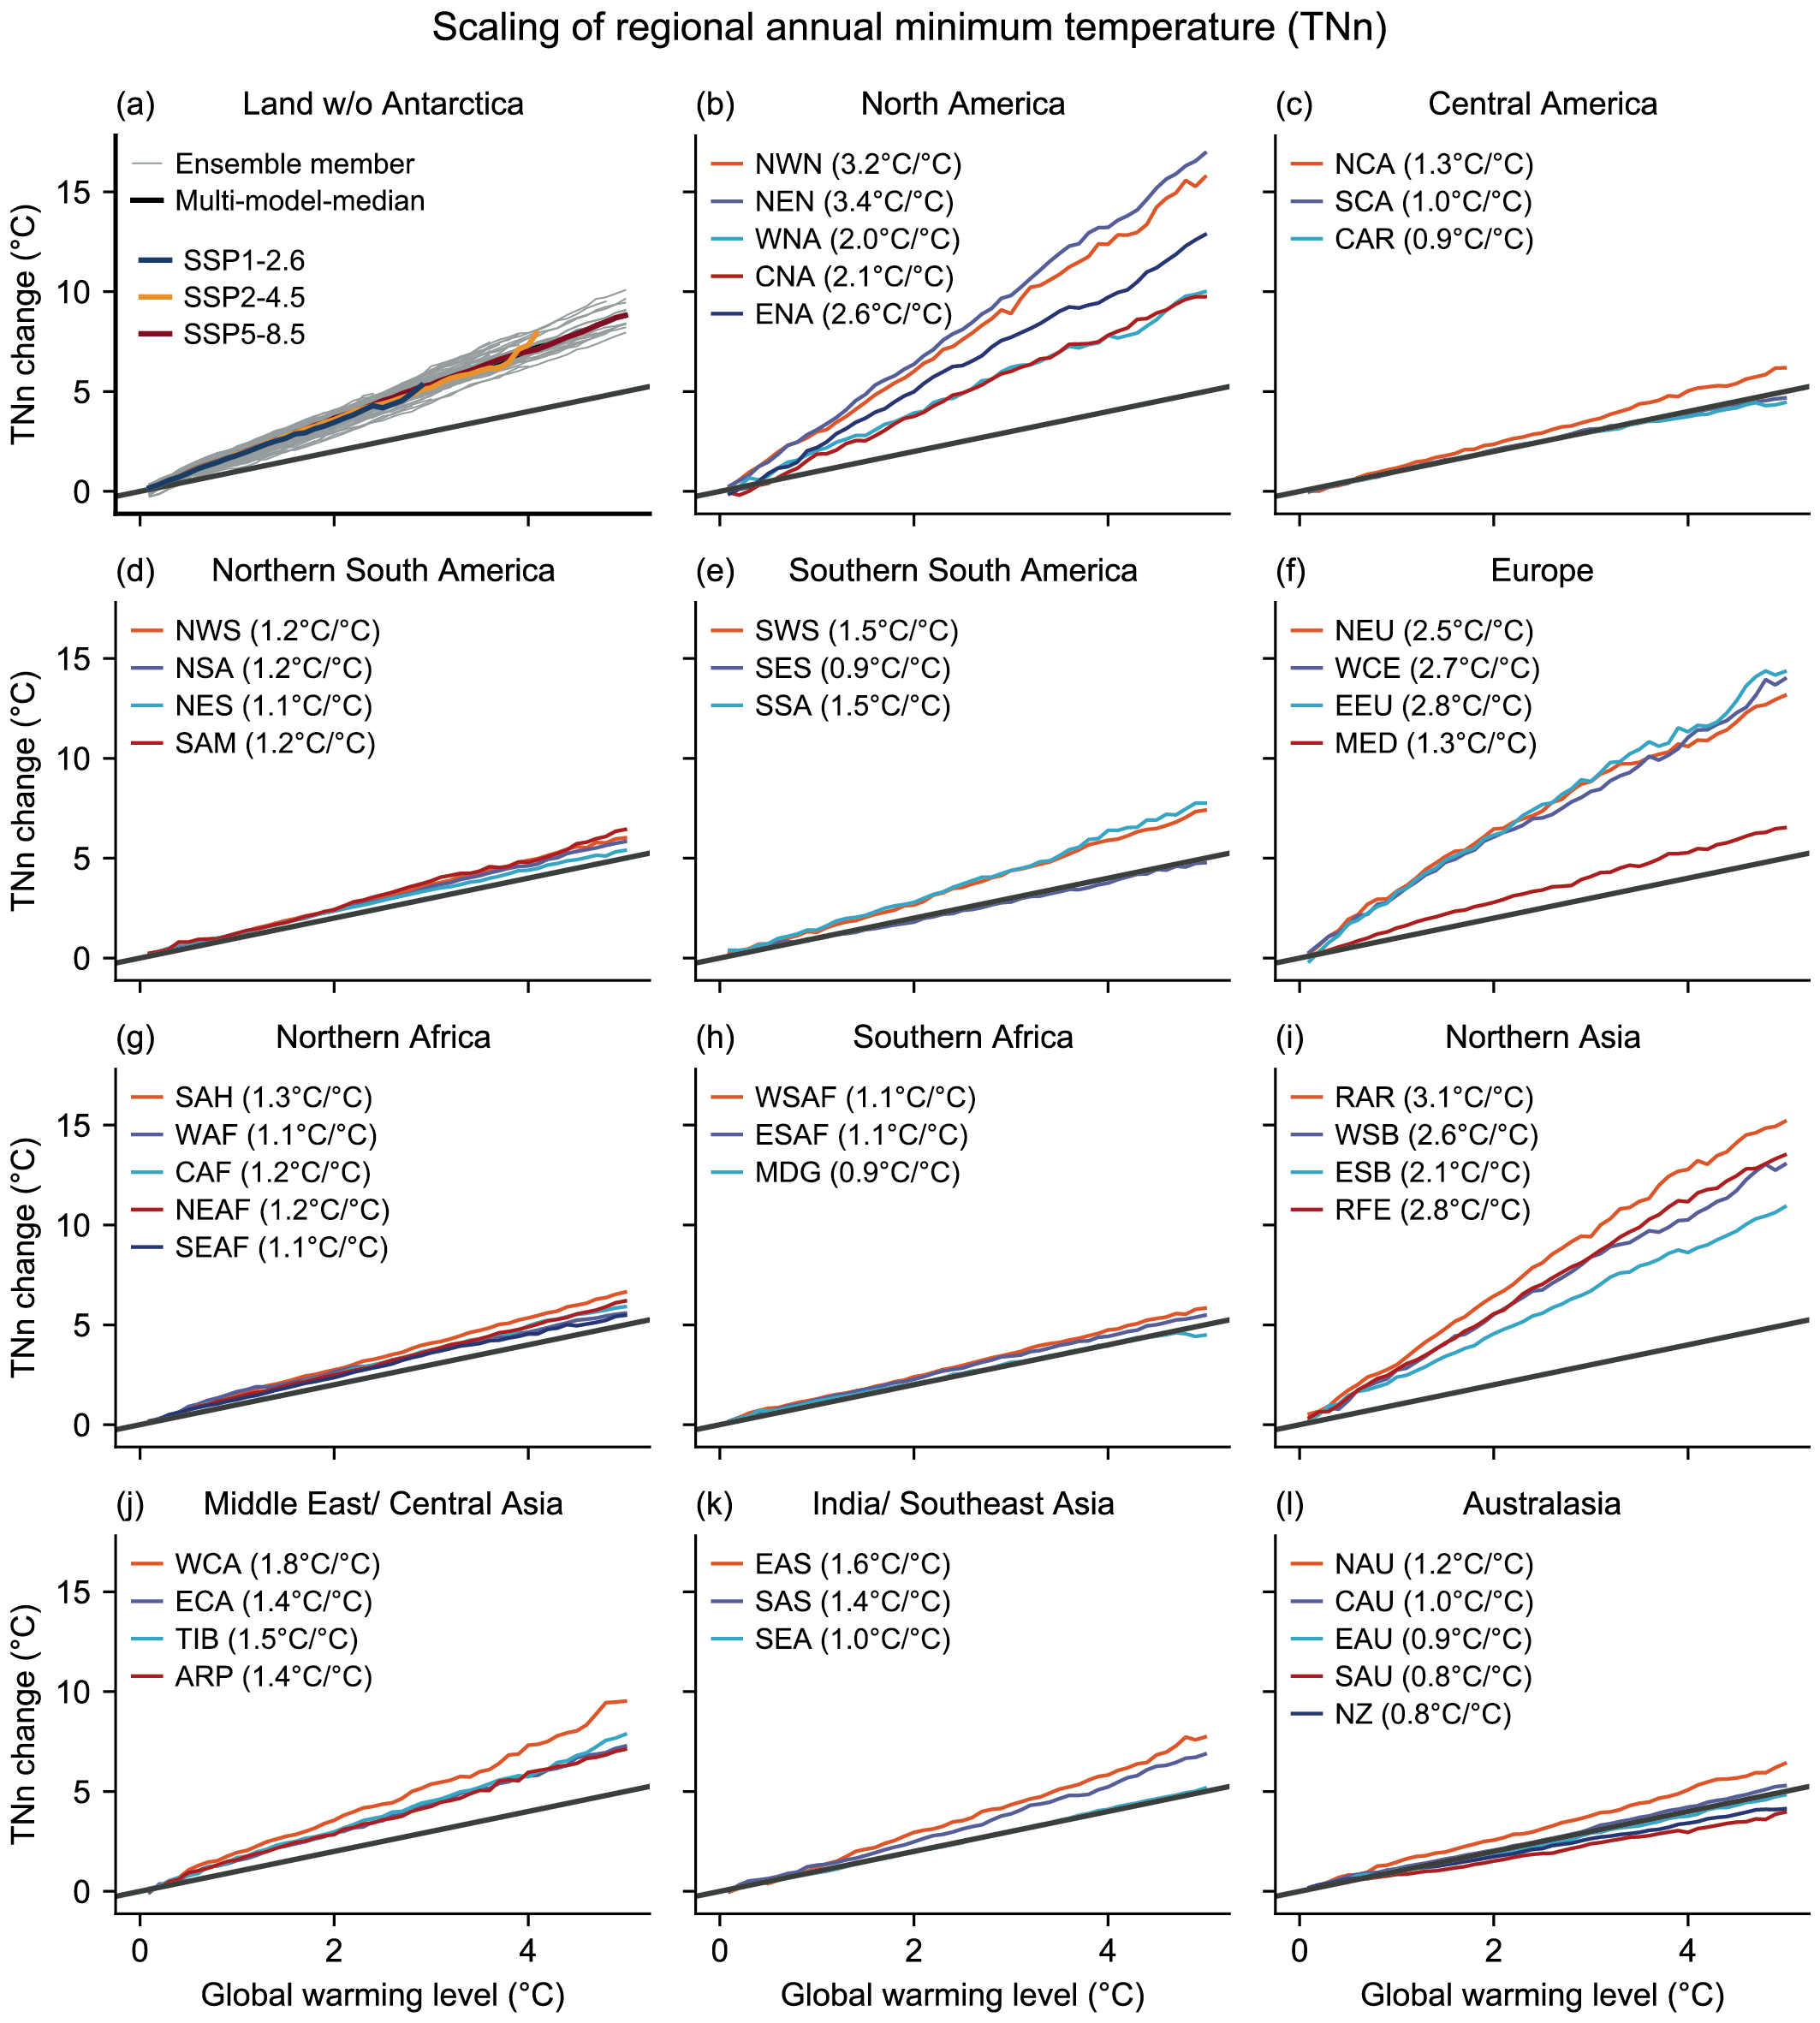 Figure 11. A.1 | As Figure 11.3 but for the annual minimum temperature (TNn).
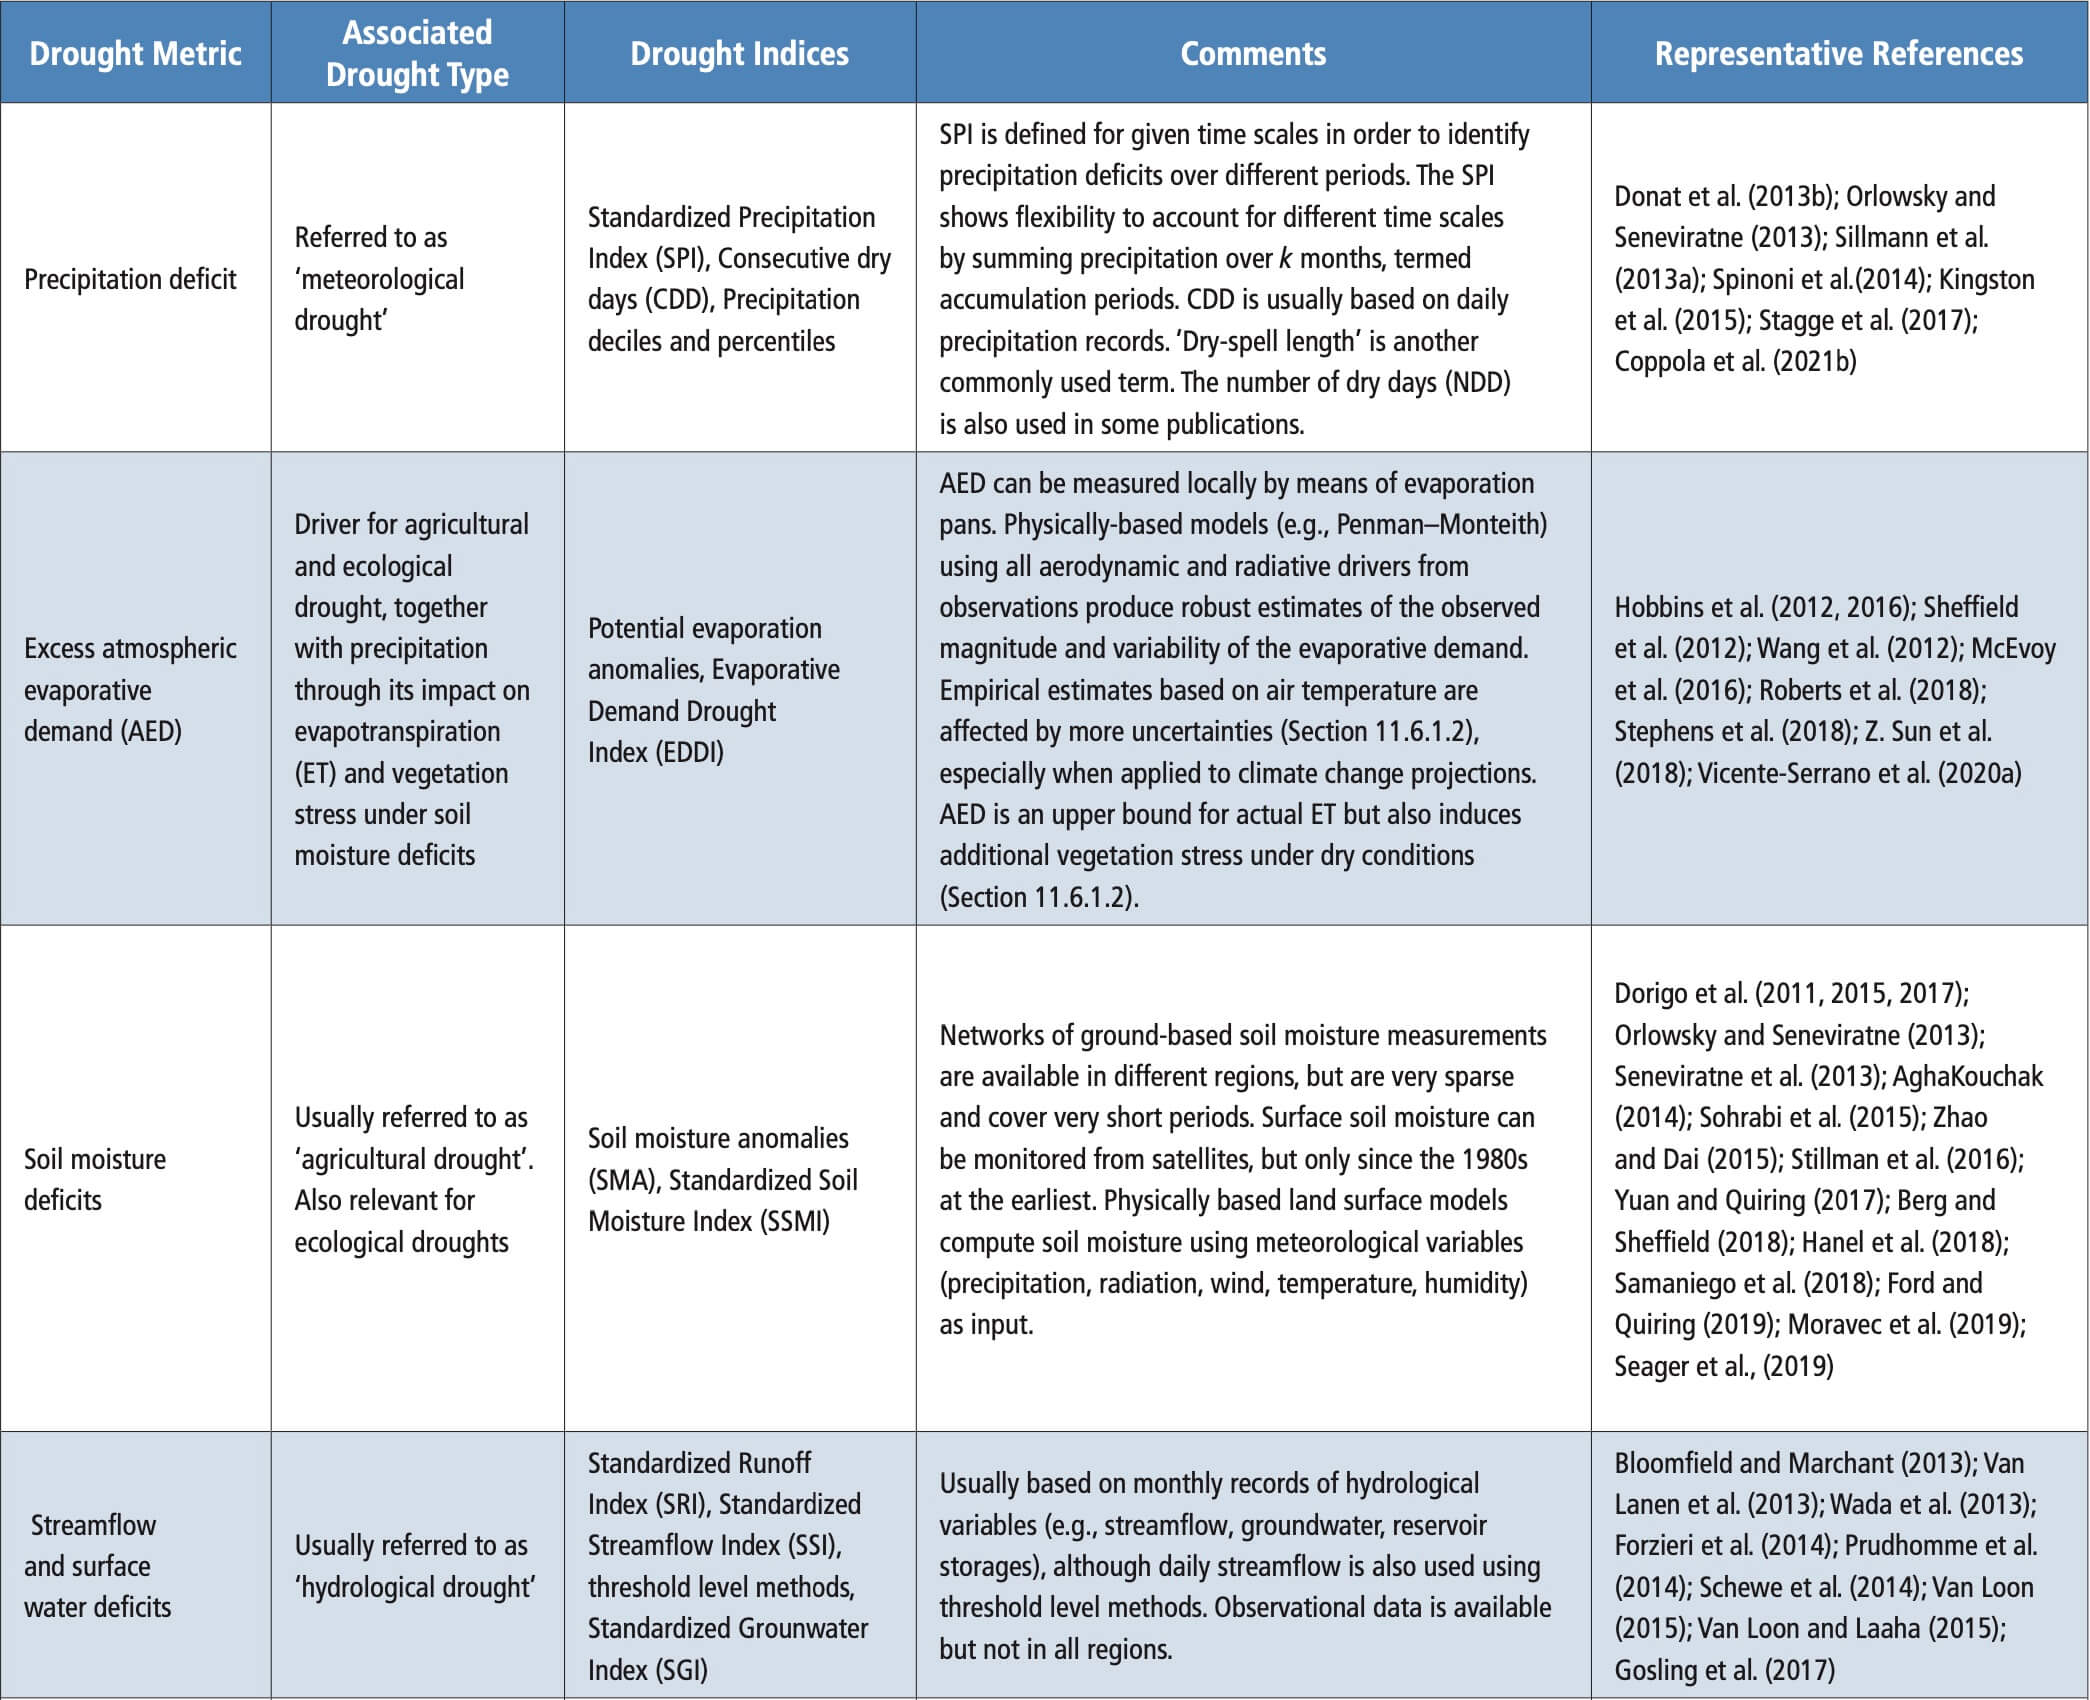
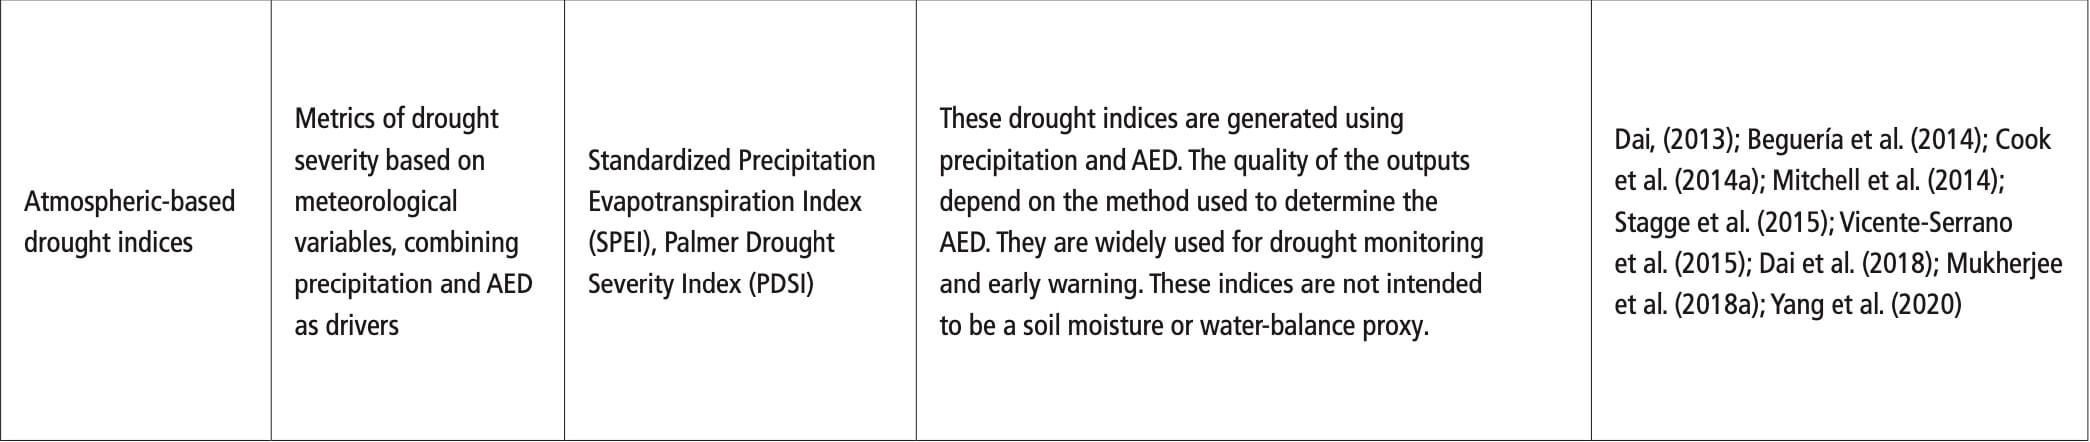 Table 11.A.2 | Synthesis table summarising assessments presented in Tables 11.4-11.21 for hot extremes (HOT EXT.), heavy precipitation (HEAVY PRECIP.), agriculture and ecological droughts (AGR./ECOL. DROUGHT), and hydrological droughts (HYDR. DROUGHT). It shows the direction of change and level of confidence in the observed trends (column OBS.), human contribution to observed trends (ATTR.), and projected changes at 1.5°C, 2°C and 4°C of global warming for each AR6 region. Projections are shown for two different baseline periods: 1850–1900 (pre-industrial) and 1995–2014 (modern or recent past) – see Section 1.4.1 for more details. Direction of change is represented by an upward arrow (increase) and a downward arrow (decrease). Level of confidence is reported for LOW: low, MED.: medium, HIGH: high; levels of likelihood (only in cases of high confidence) include: L: likely , VL: very likely , EL: extremely likely , VC: virtual certain. See (Section 11.9, Tables 11.4–11.21 for details. Dark orange shading highlights high confidence (also including likely , very likely , extremely likely and virtually certainchanges) increases in hot temperature extremes, agricultural and ecological drought, or hydrological droughts. Yellow indicates medium confidence increases in these extremes, and blue shadings indicate decreases in these extremes. High confidence increases in heavy precipitation are highlighted in dark blue, while medium confidence increases are highlighted in light blue. No assessment for changes in drought with respect to the 1995–2014 baseline is provided, which is why the respective cells are empty.
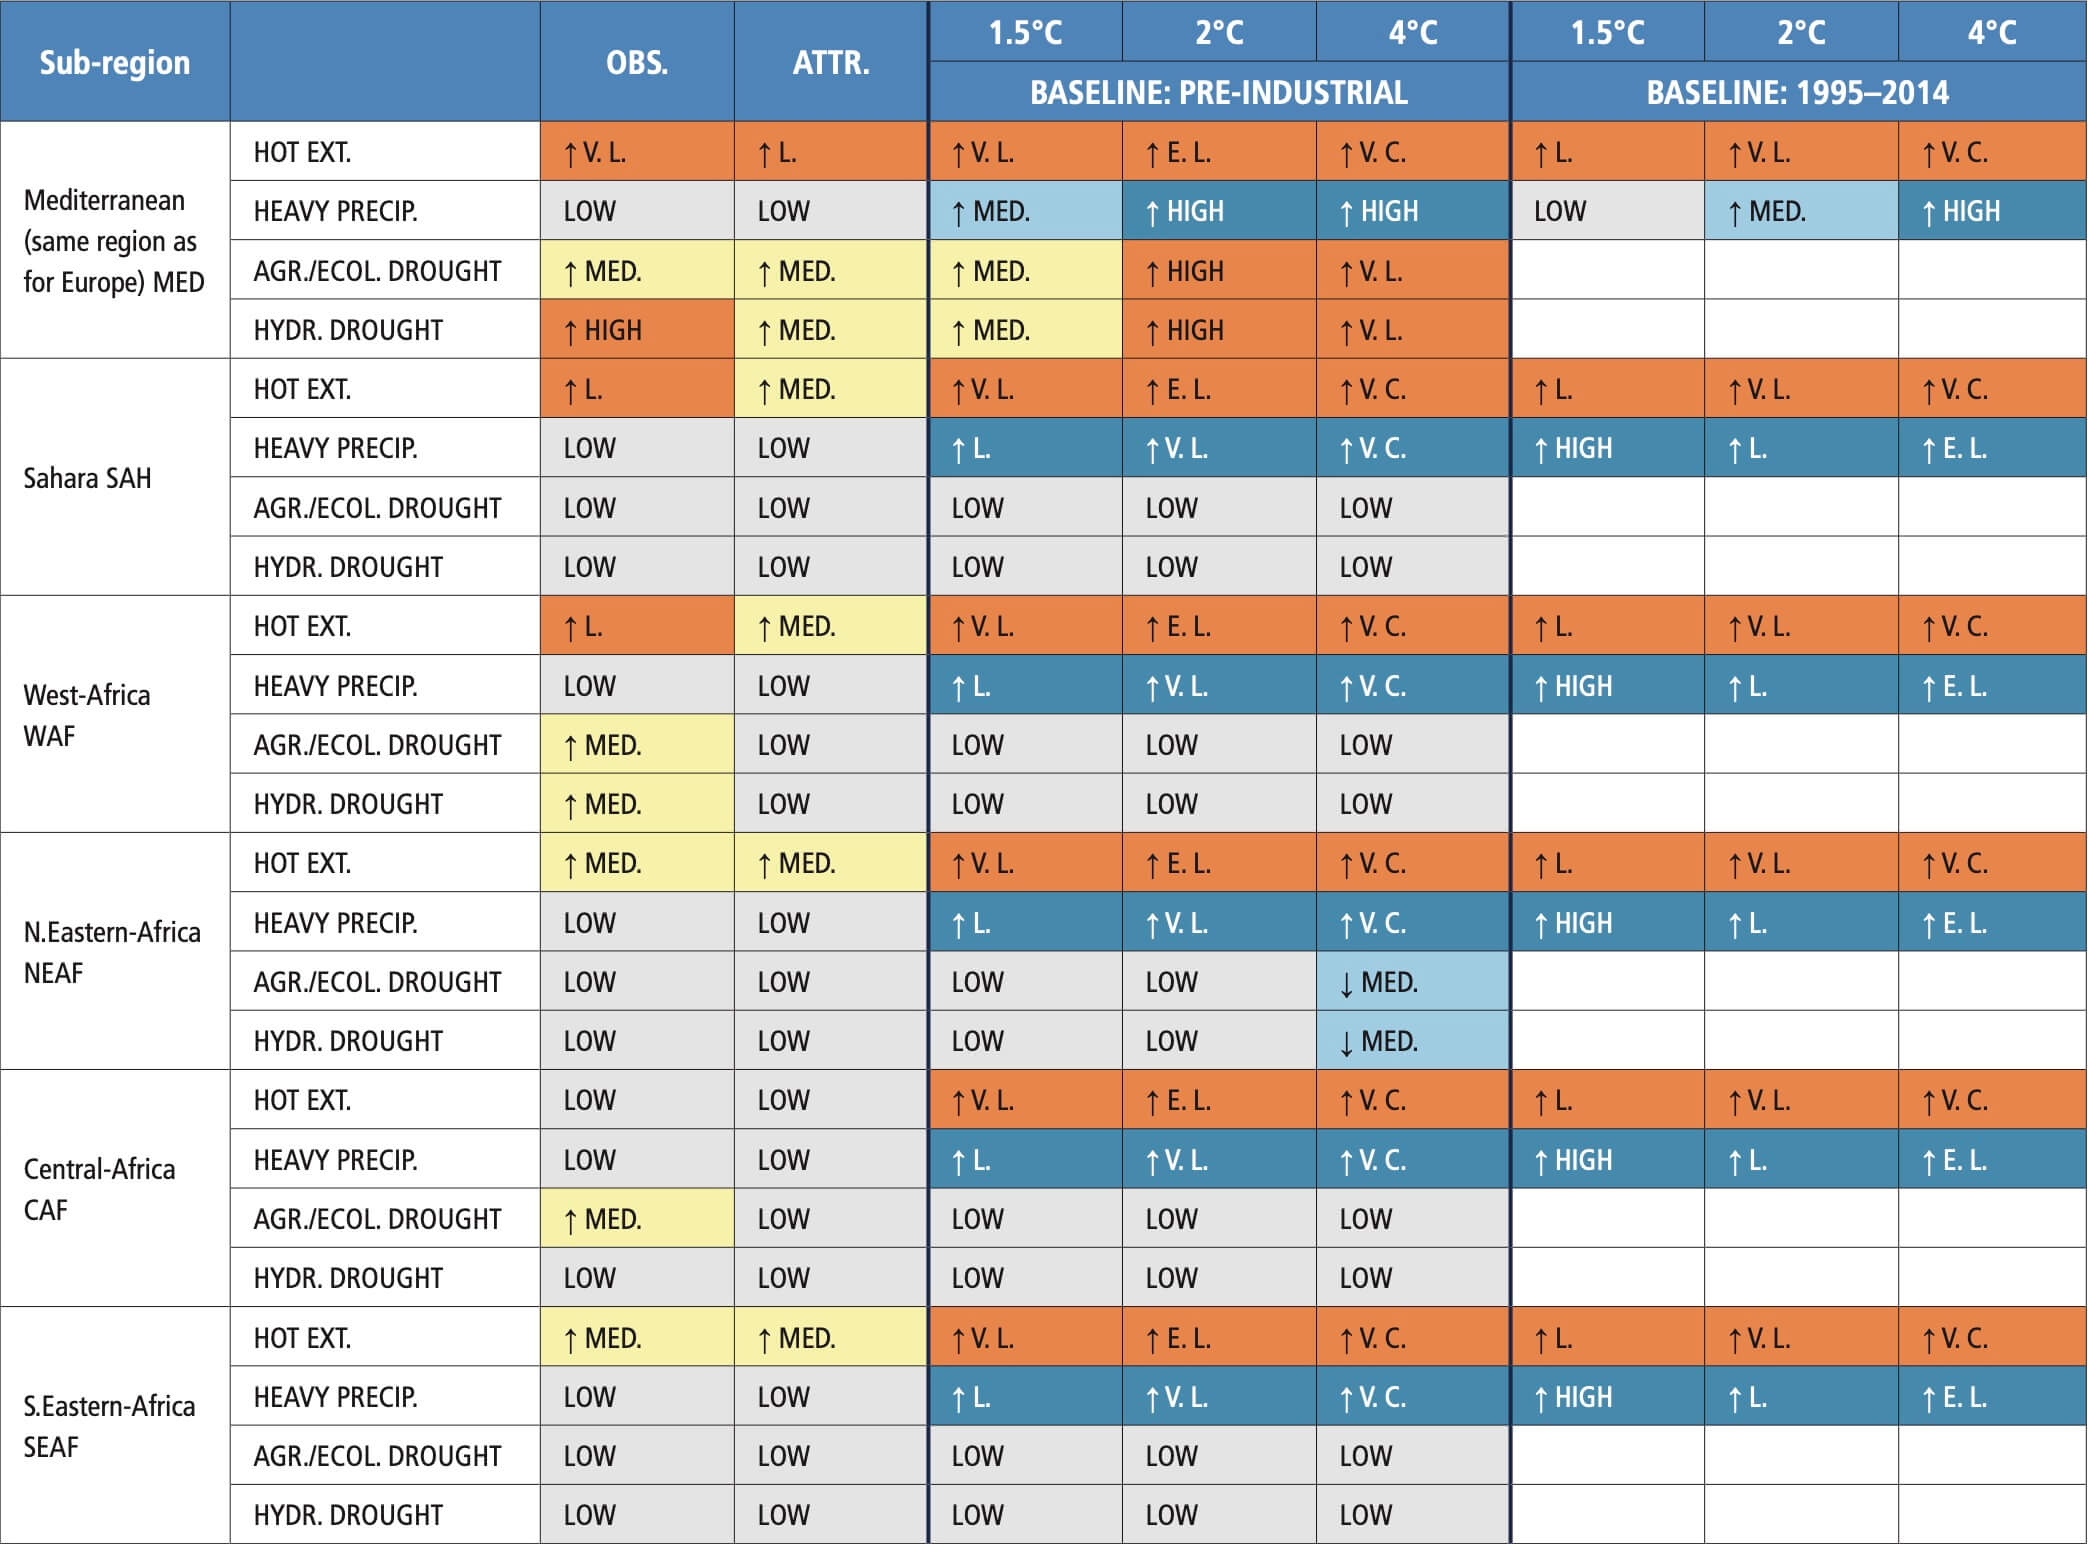
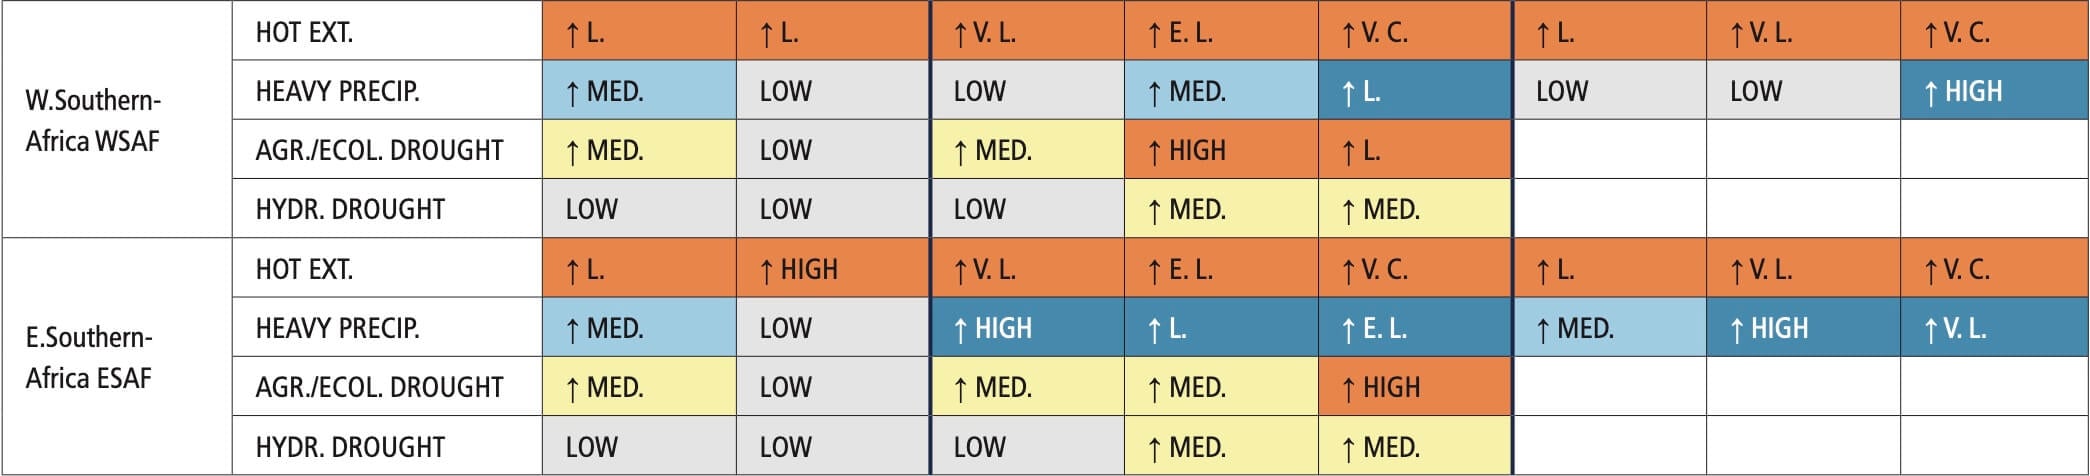
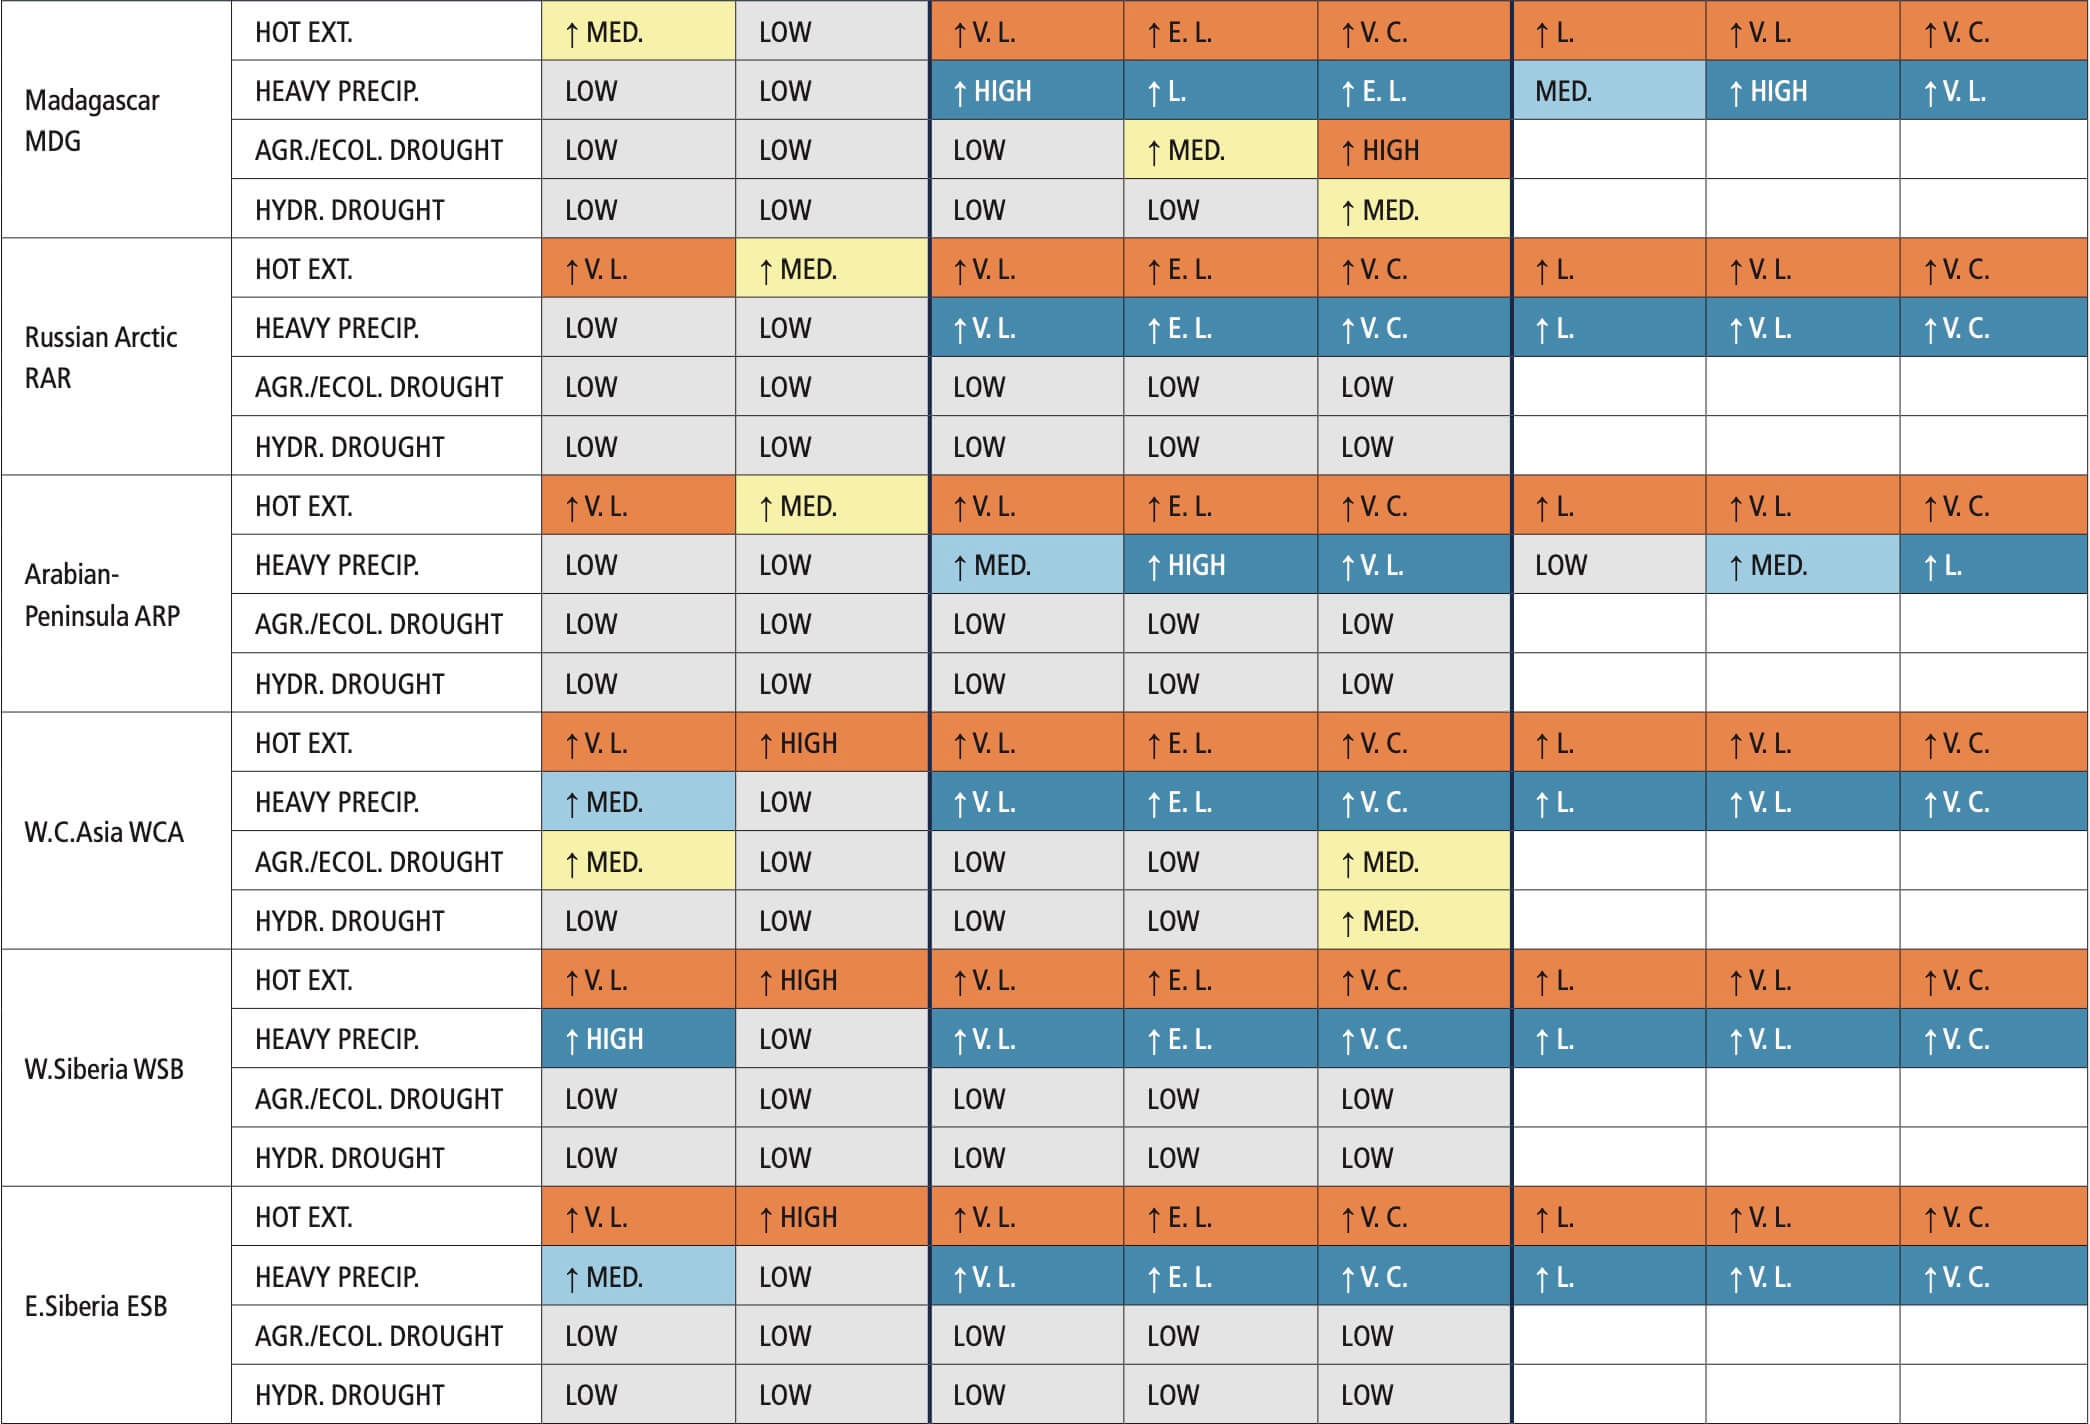
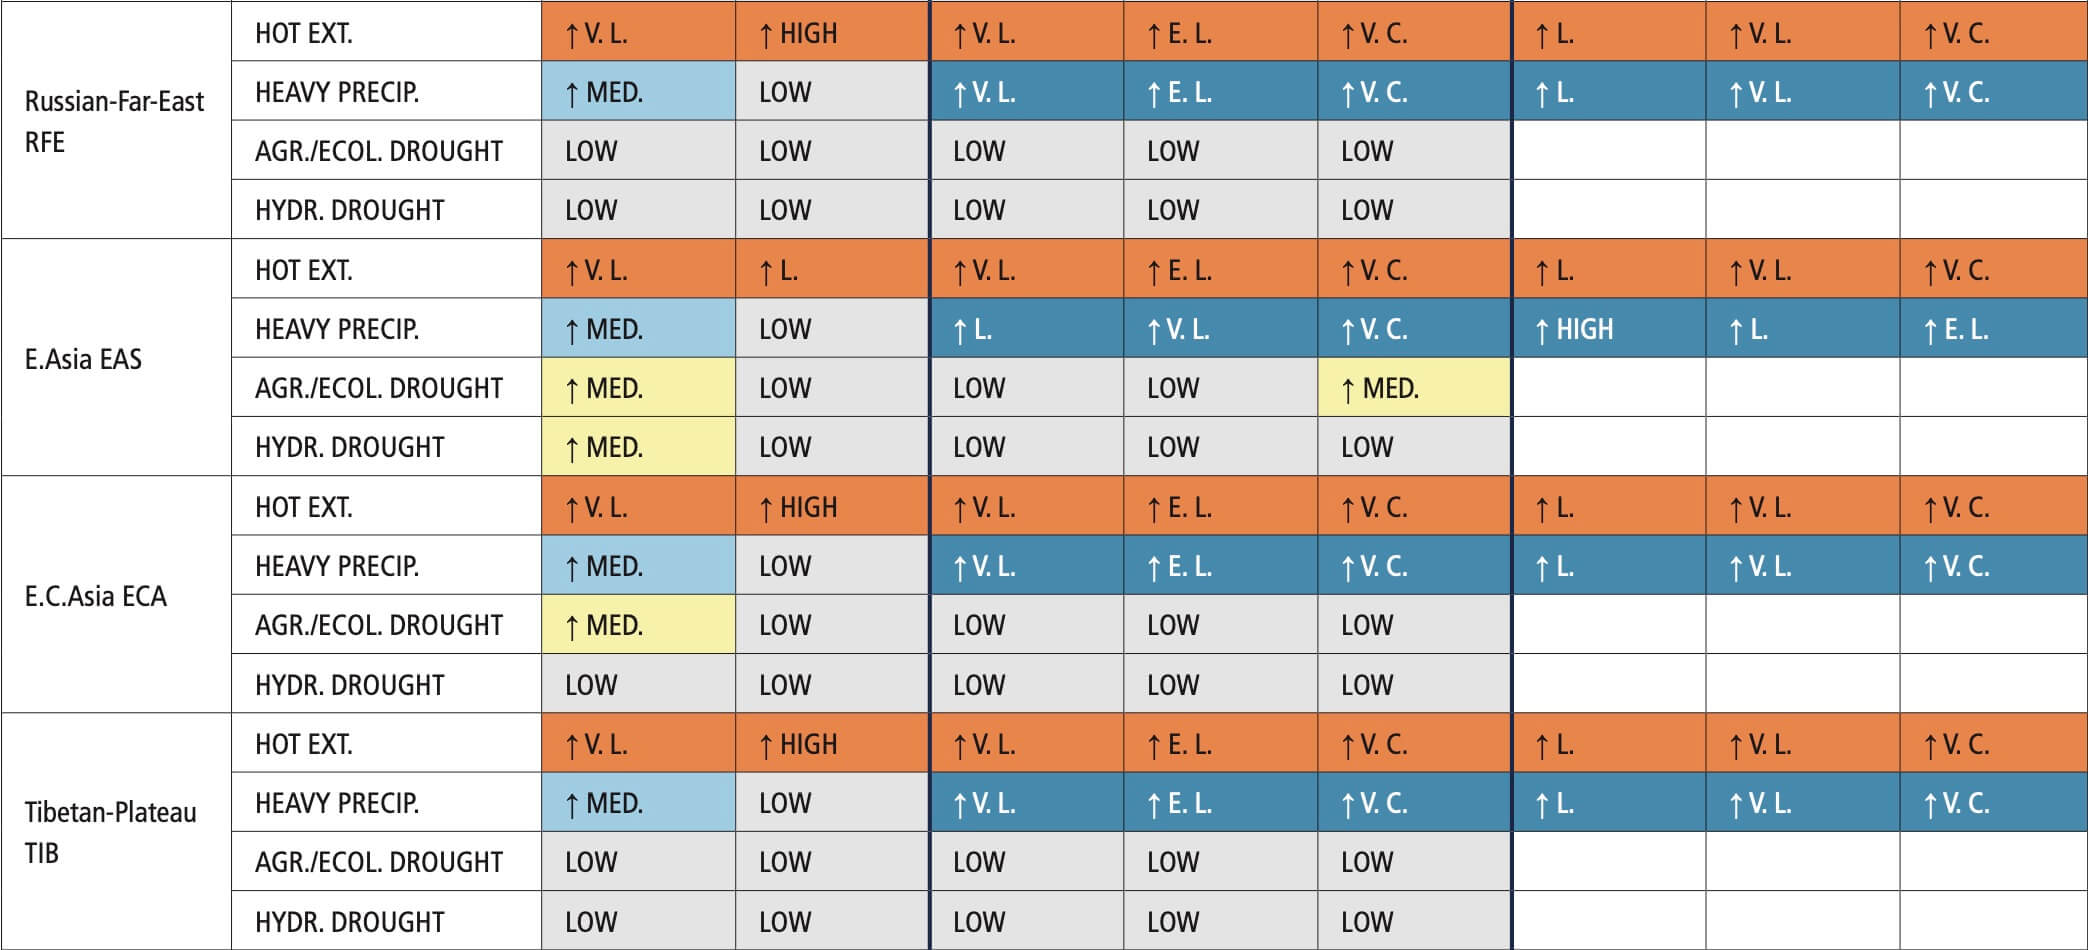
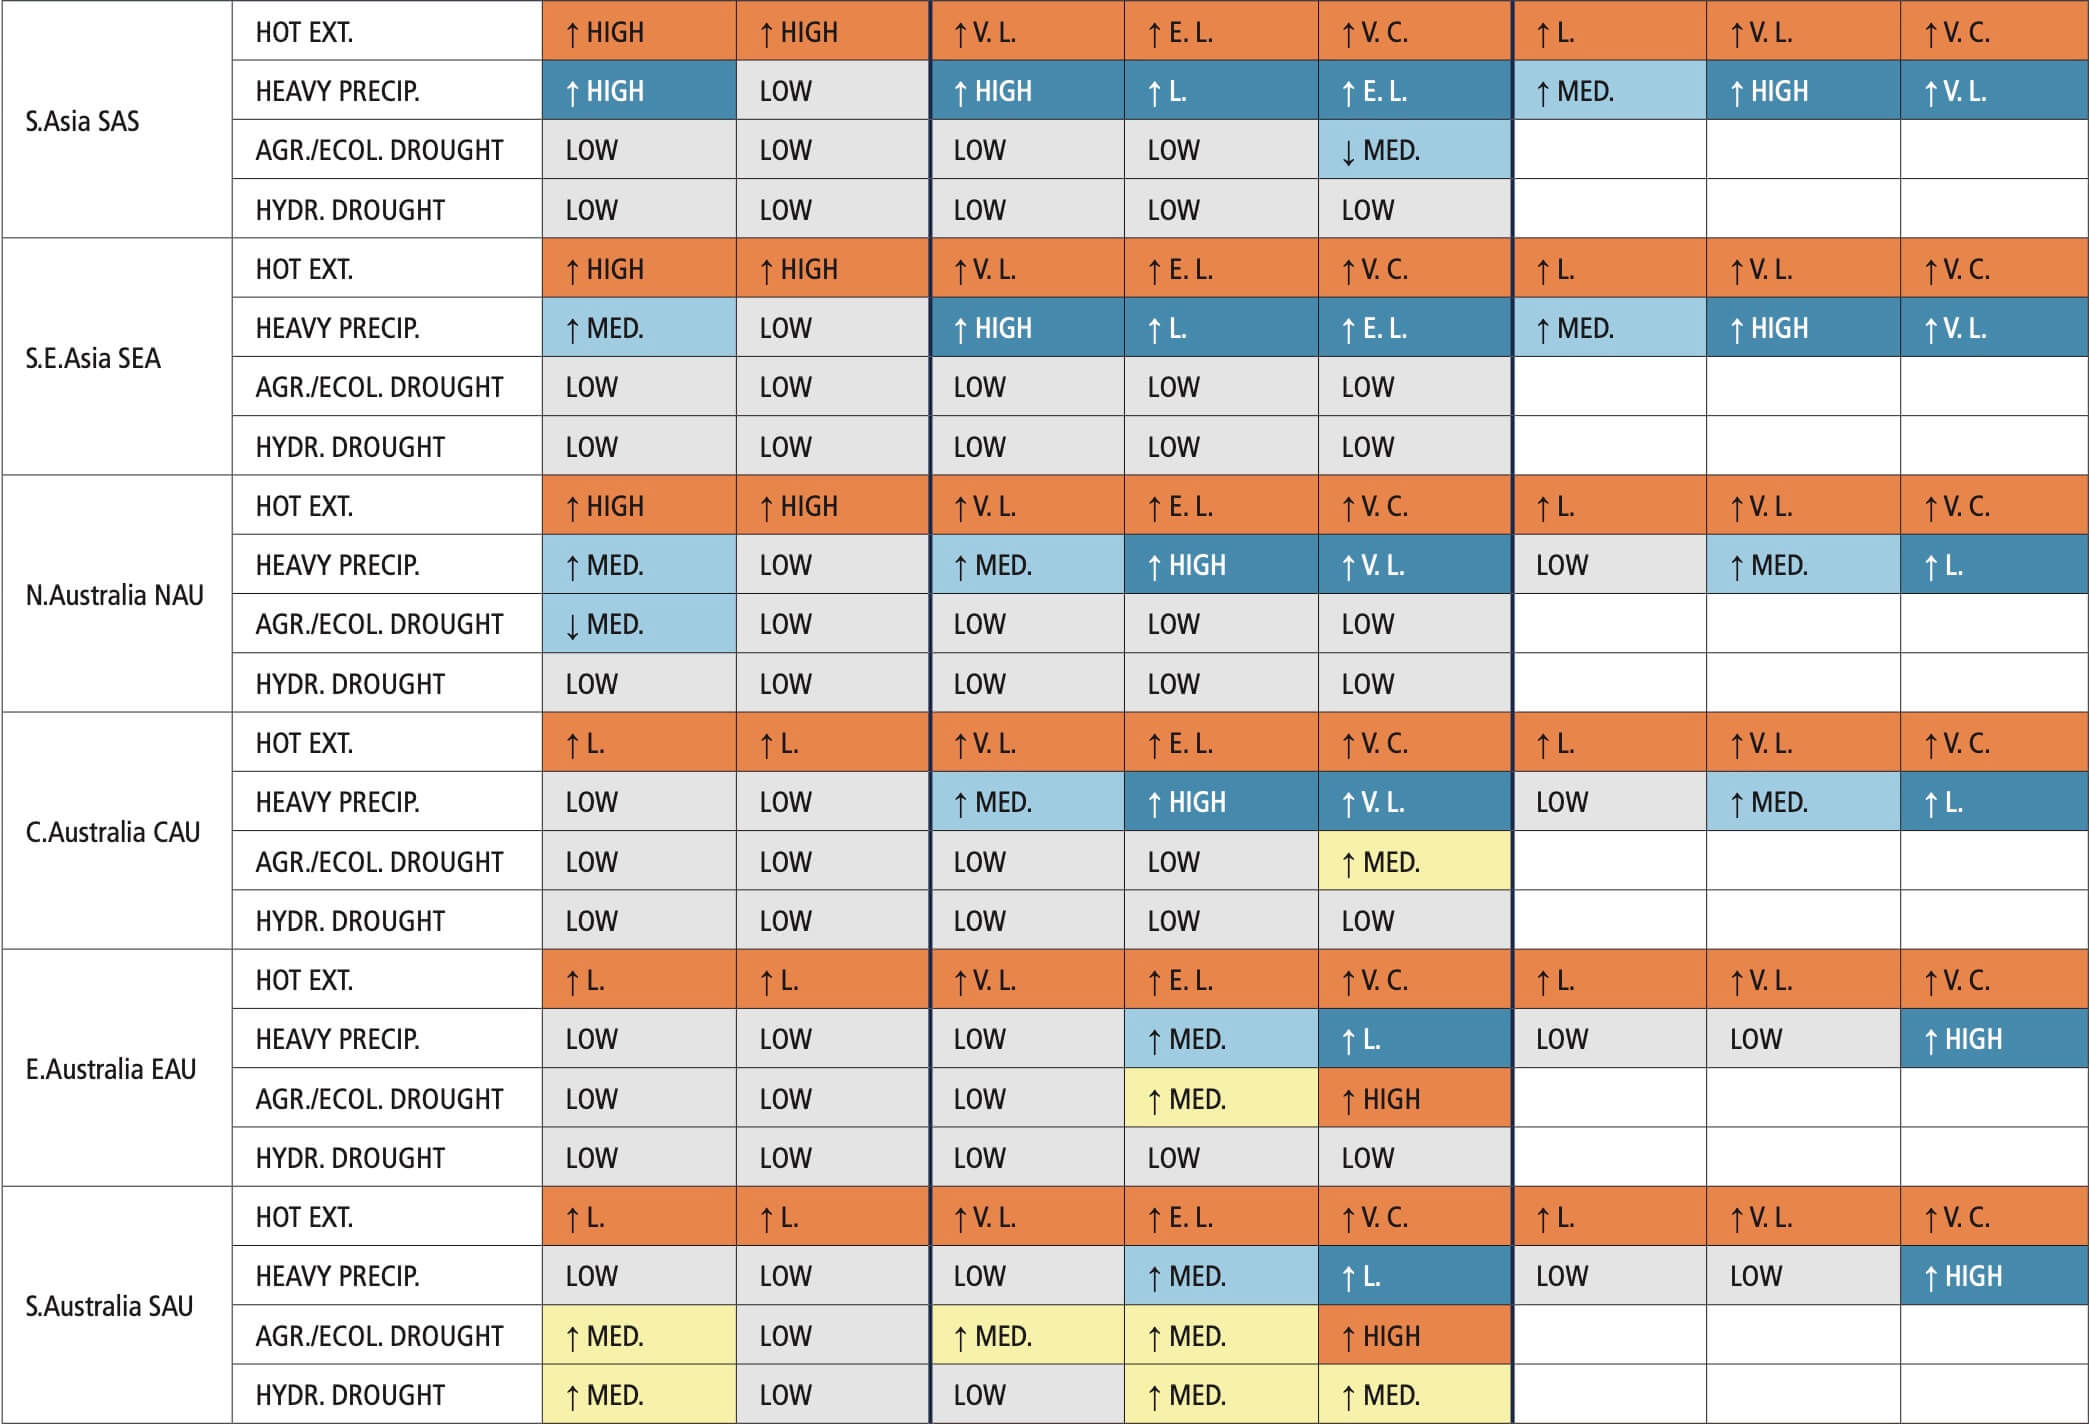
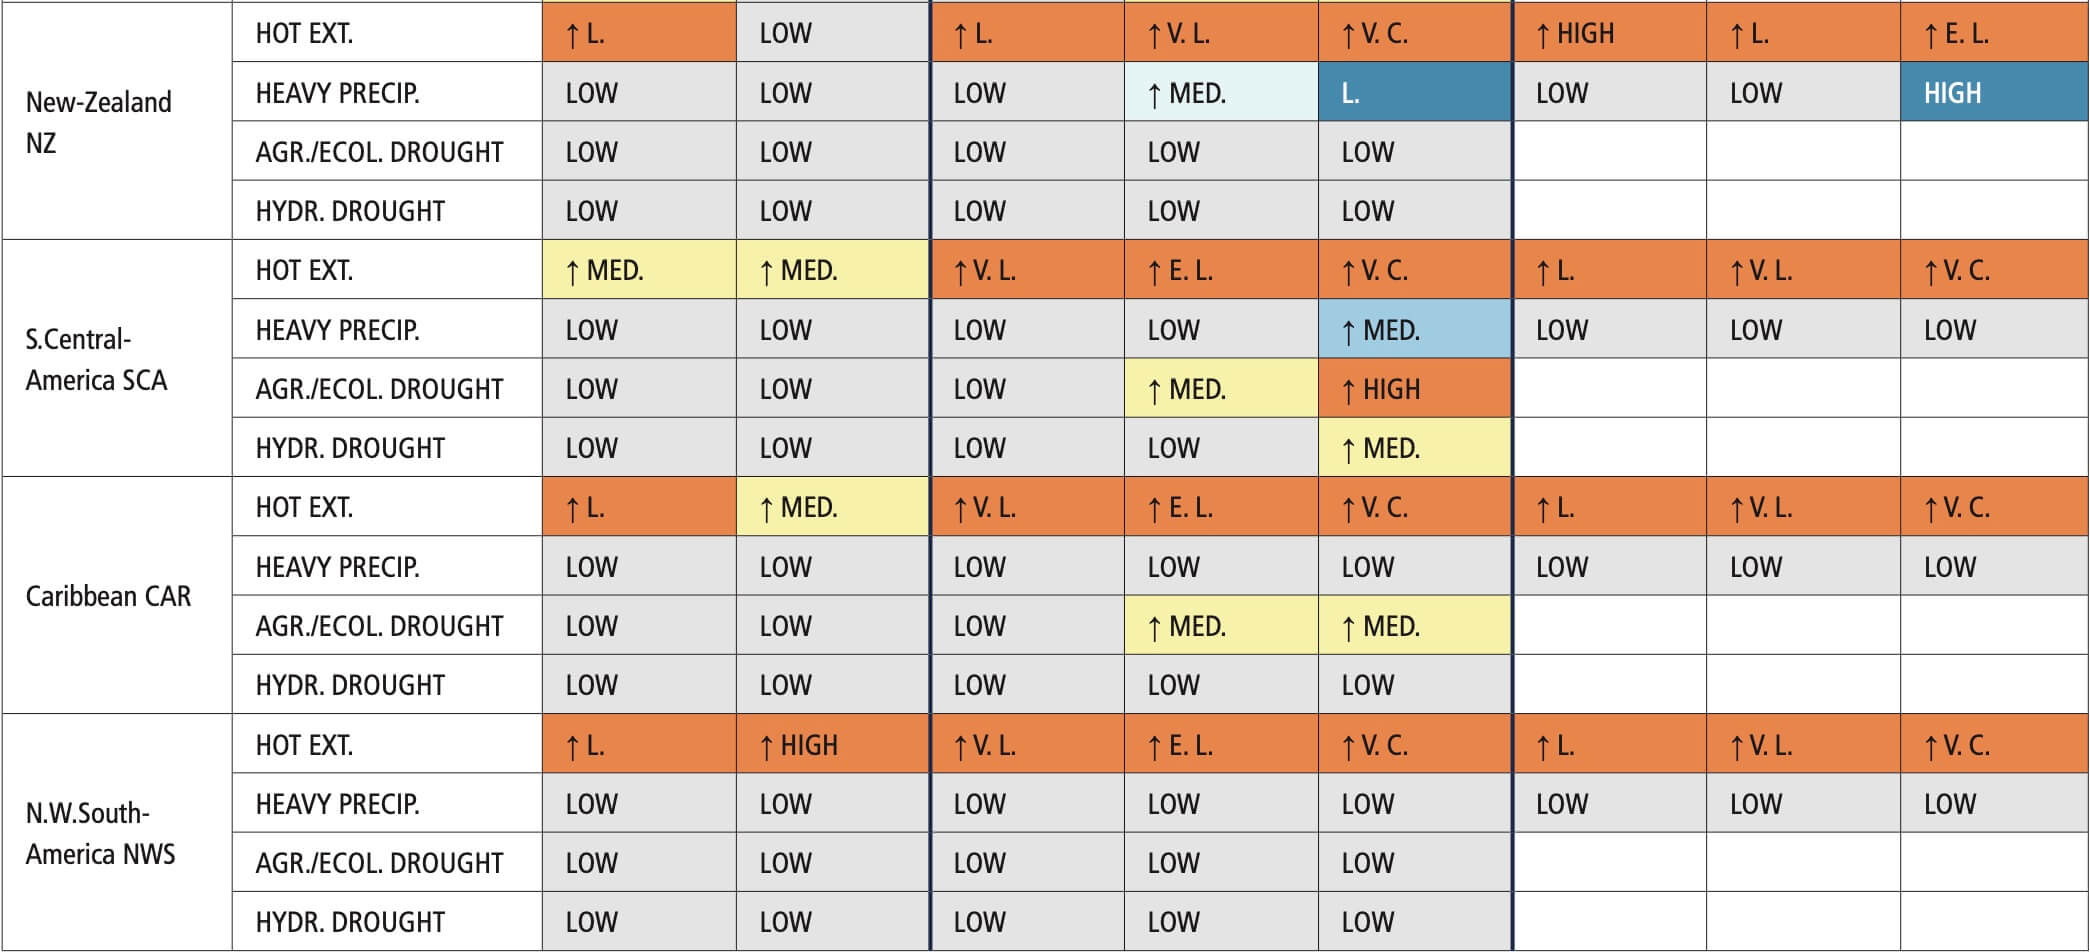
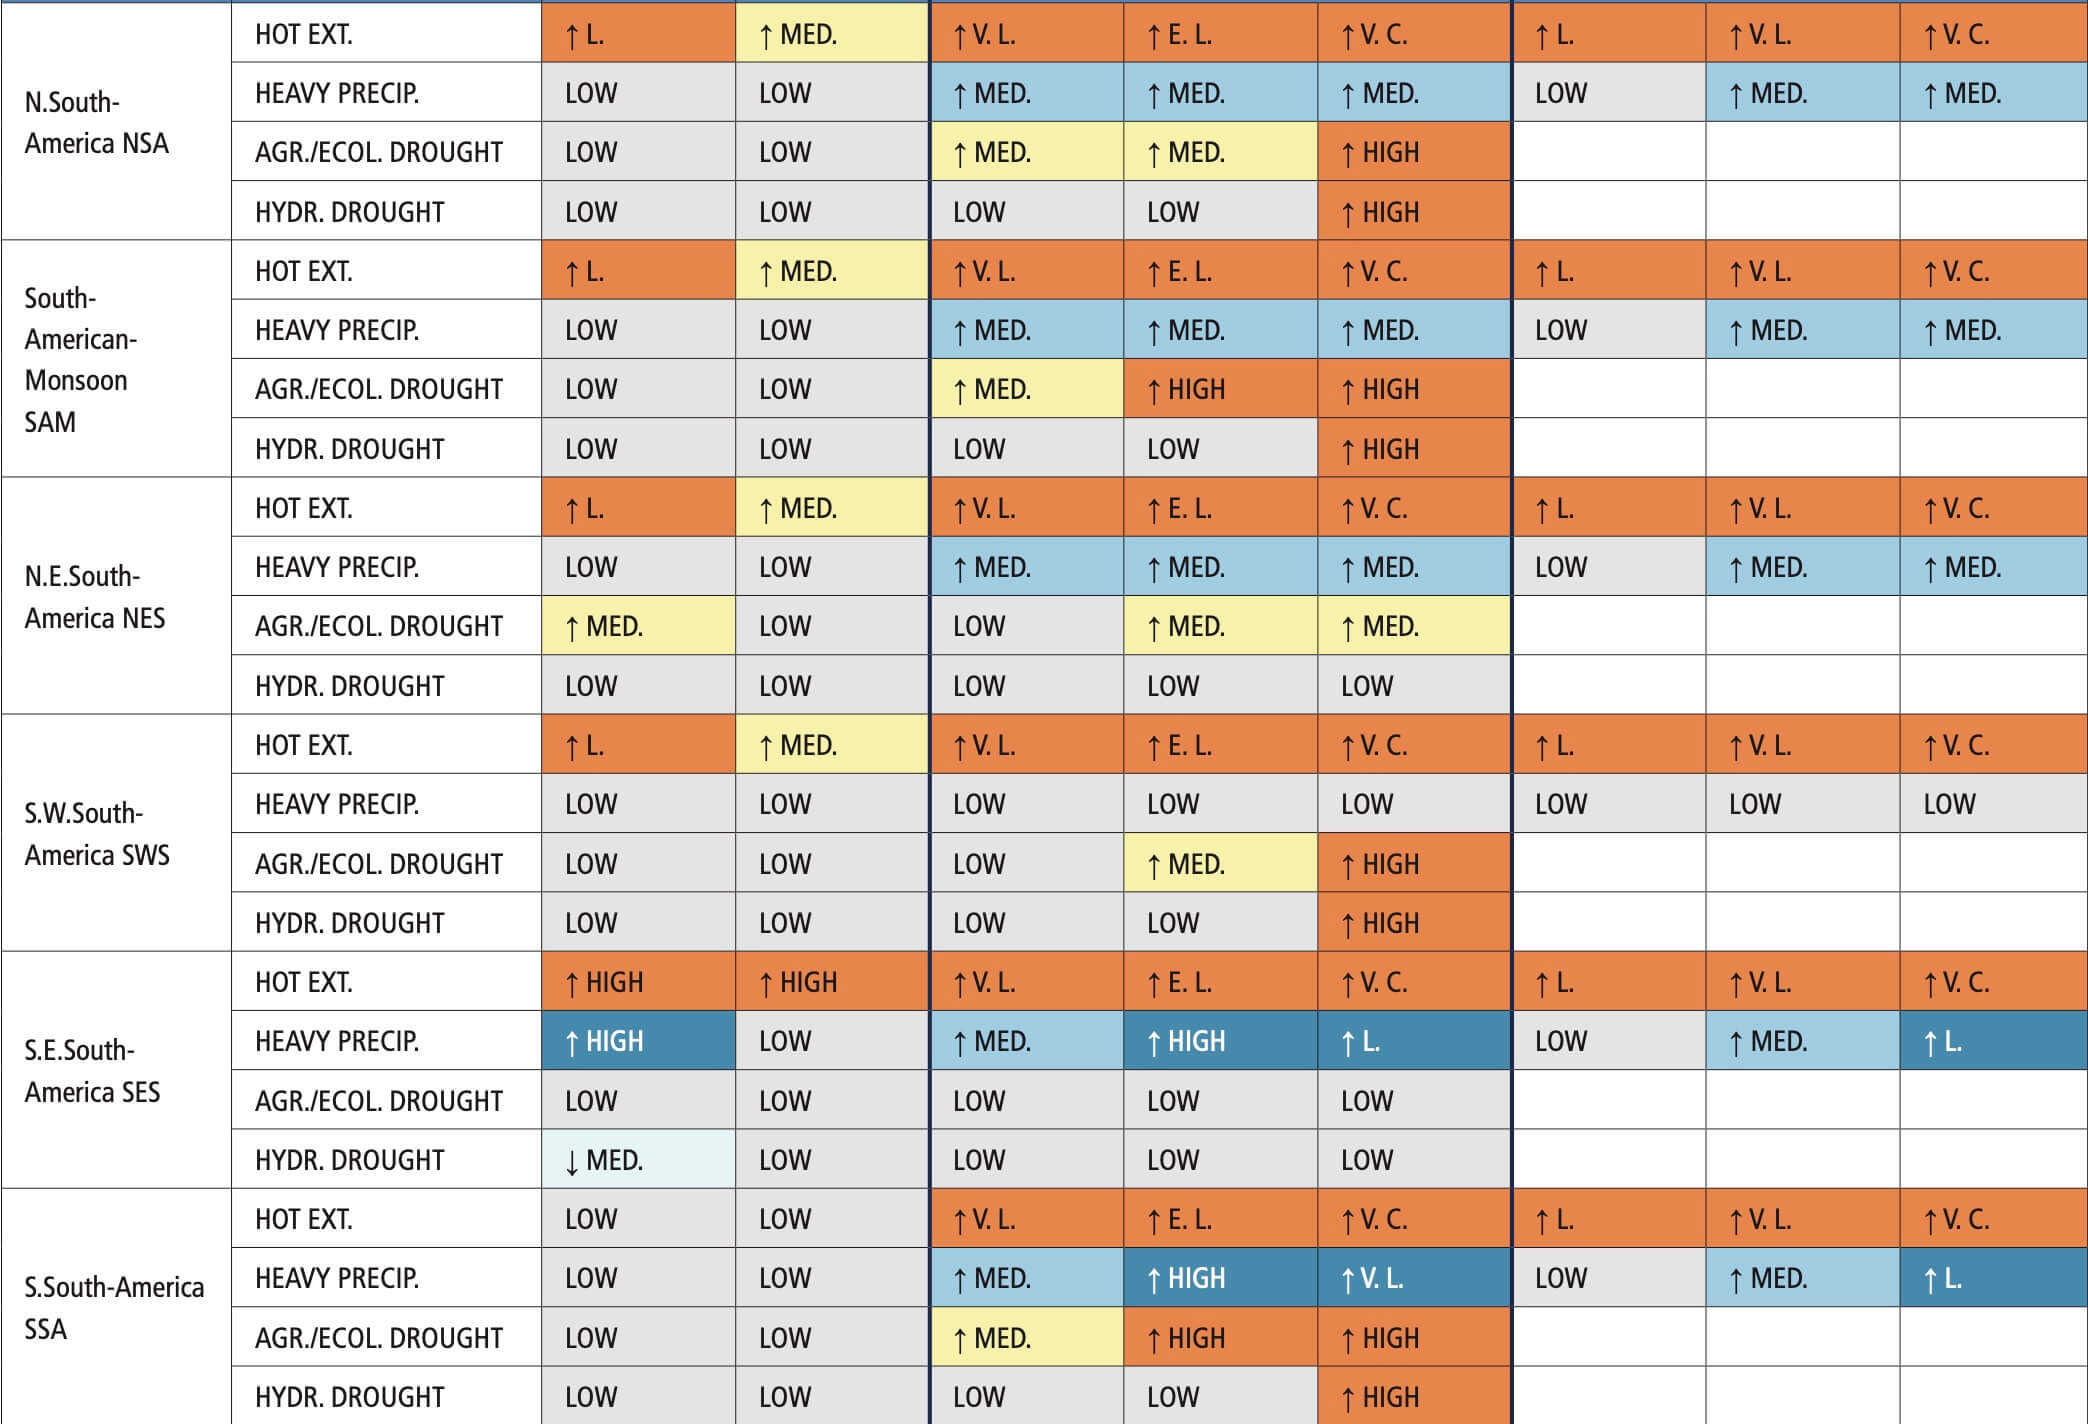
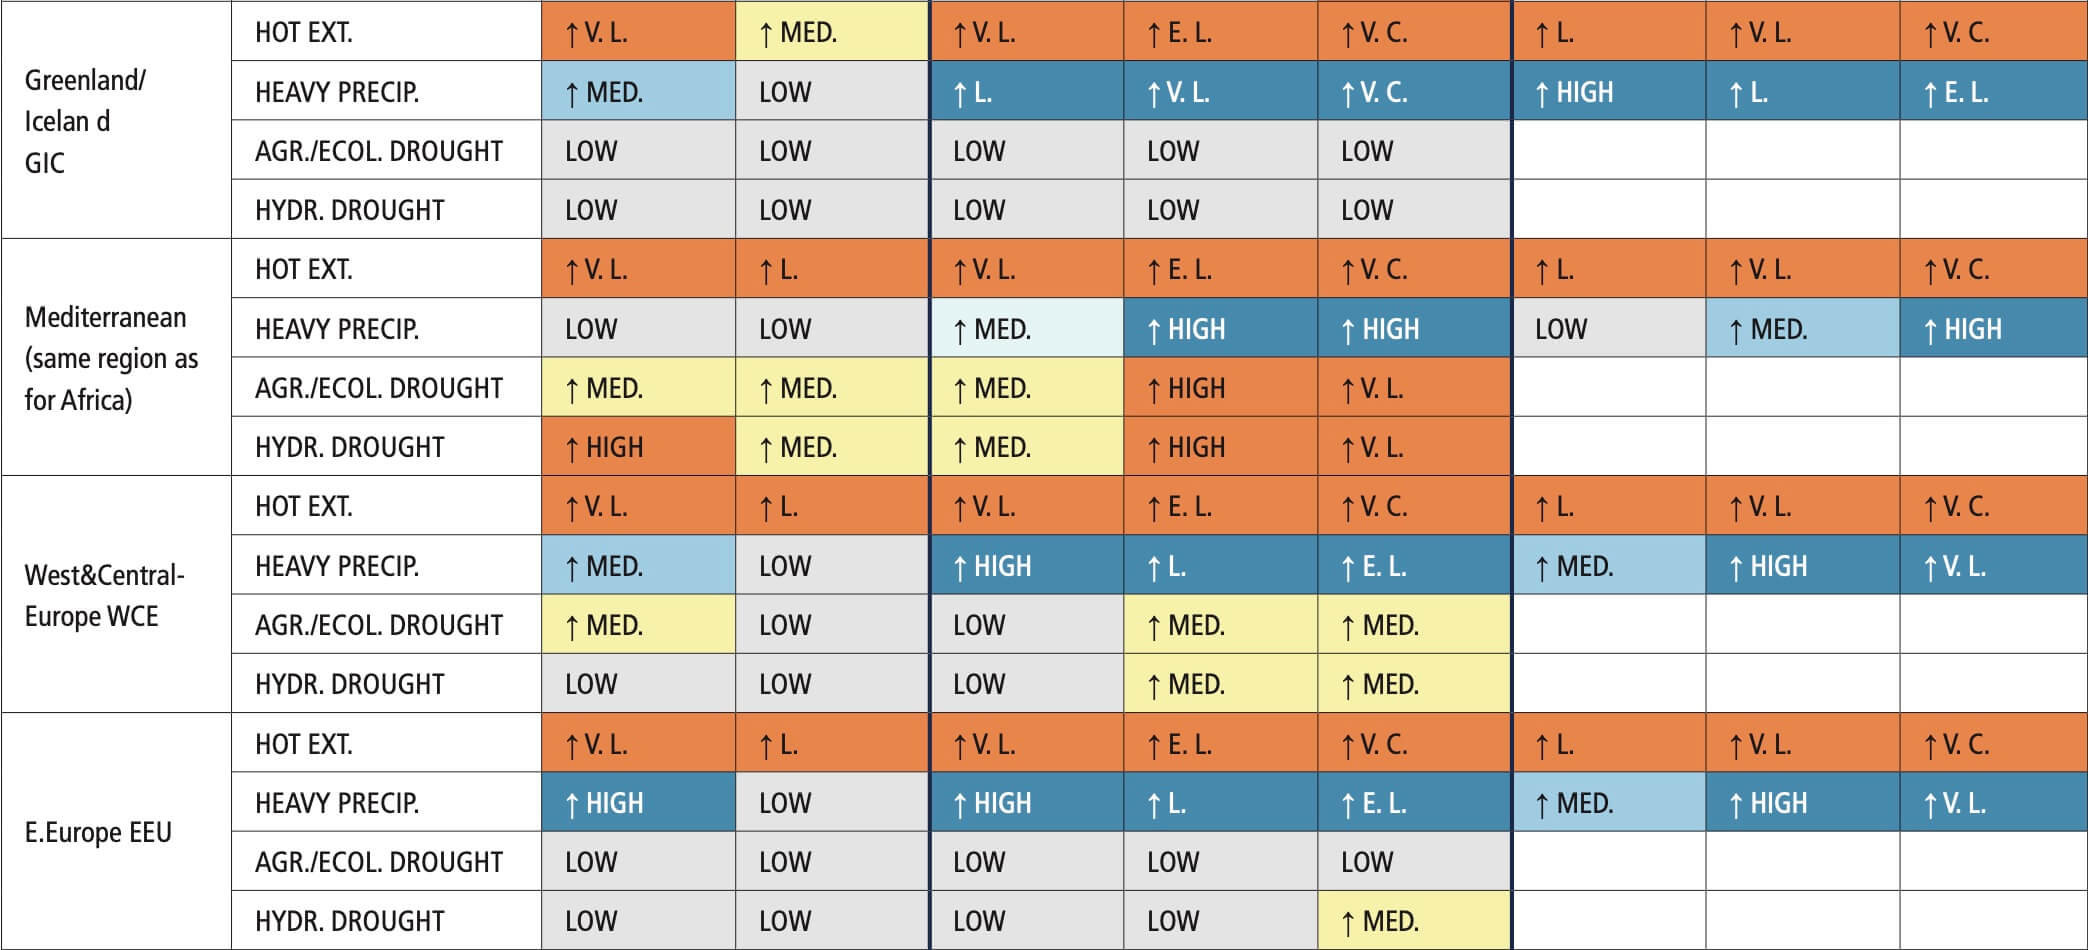
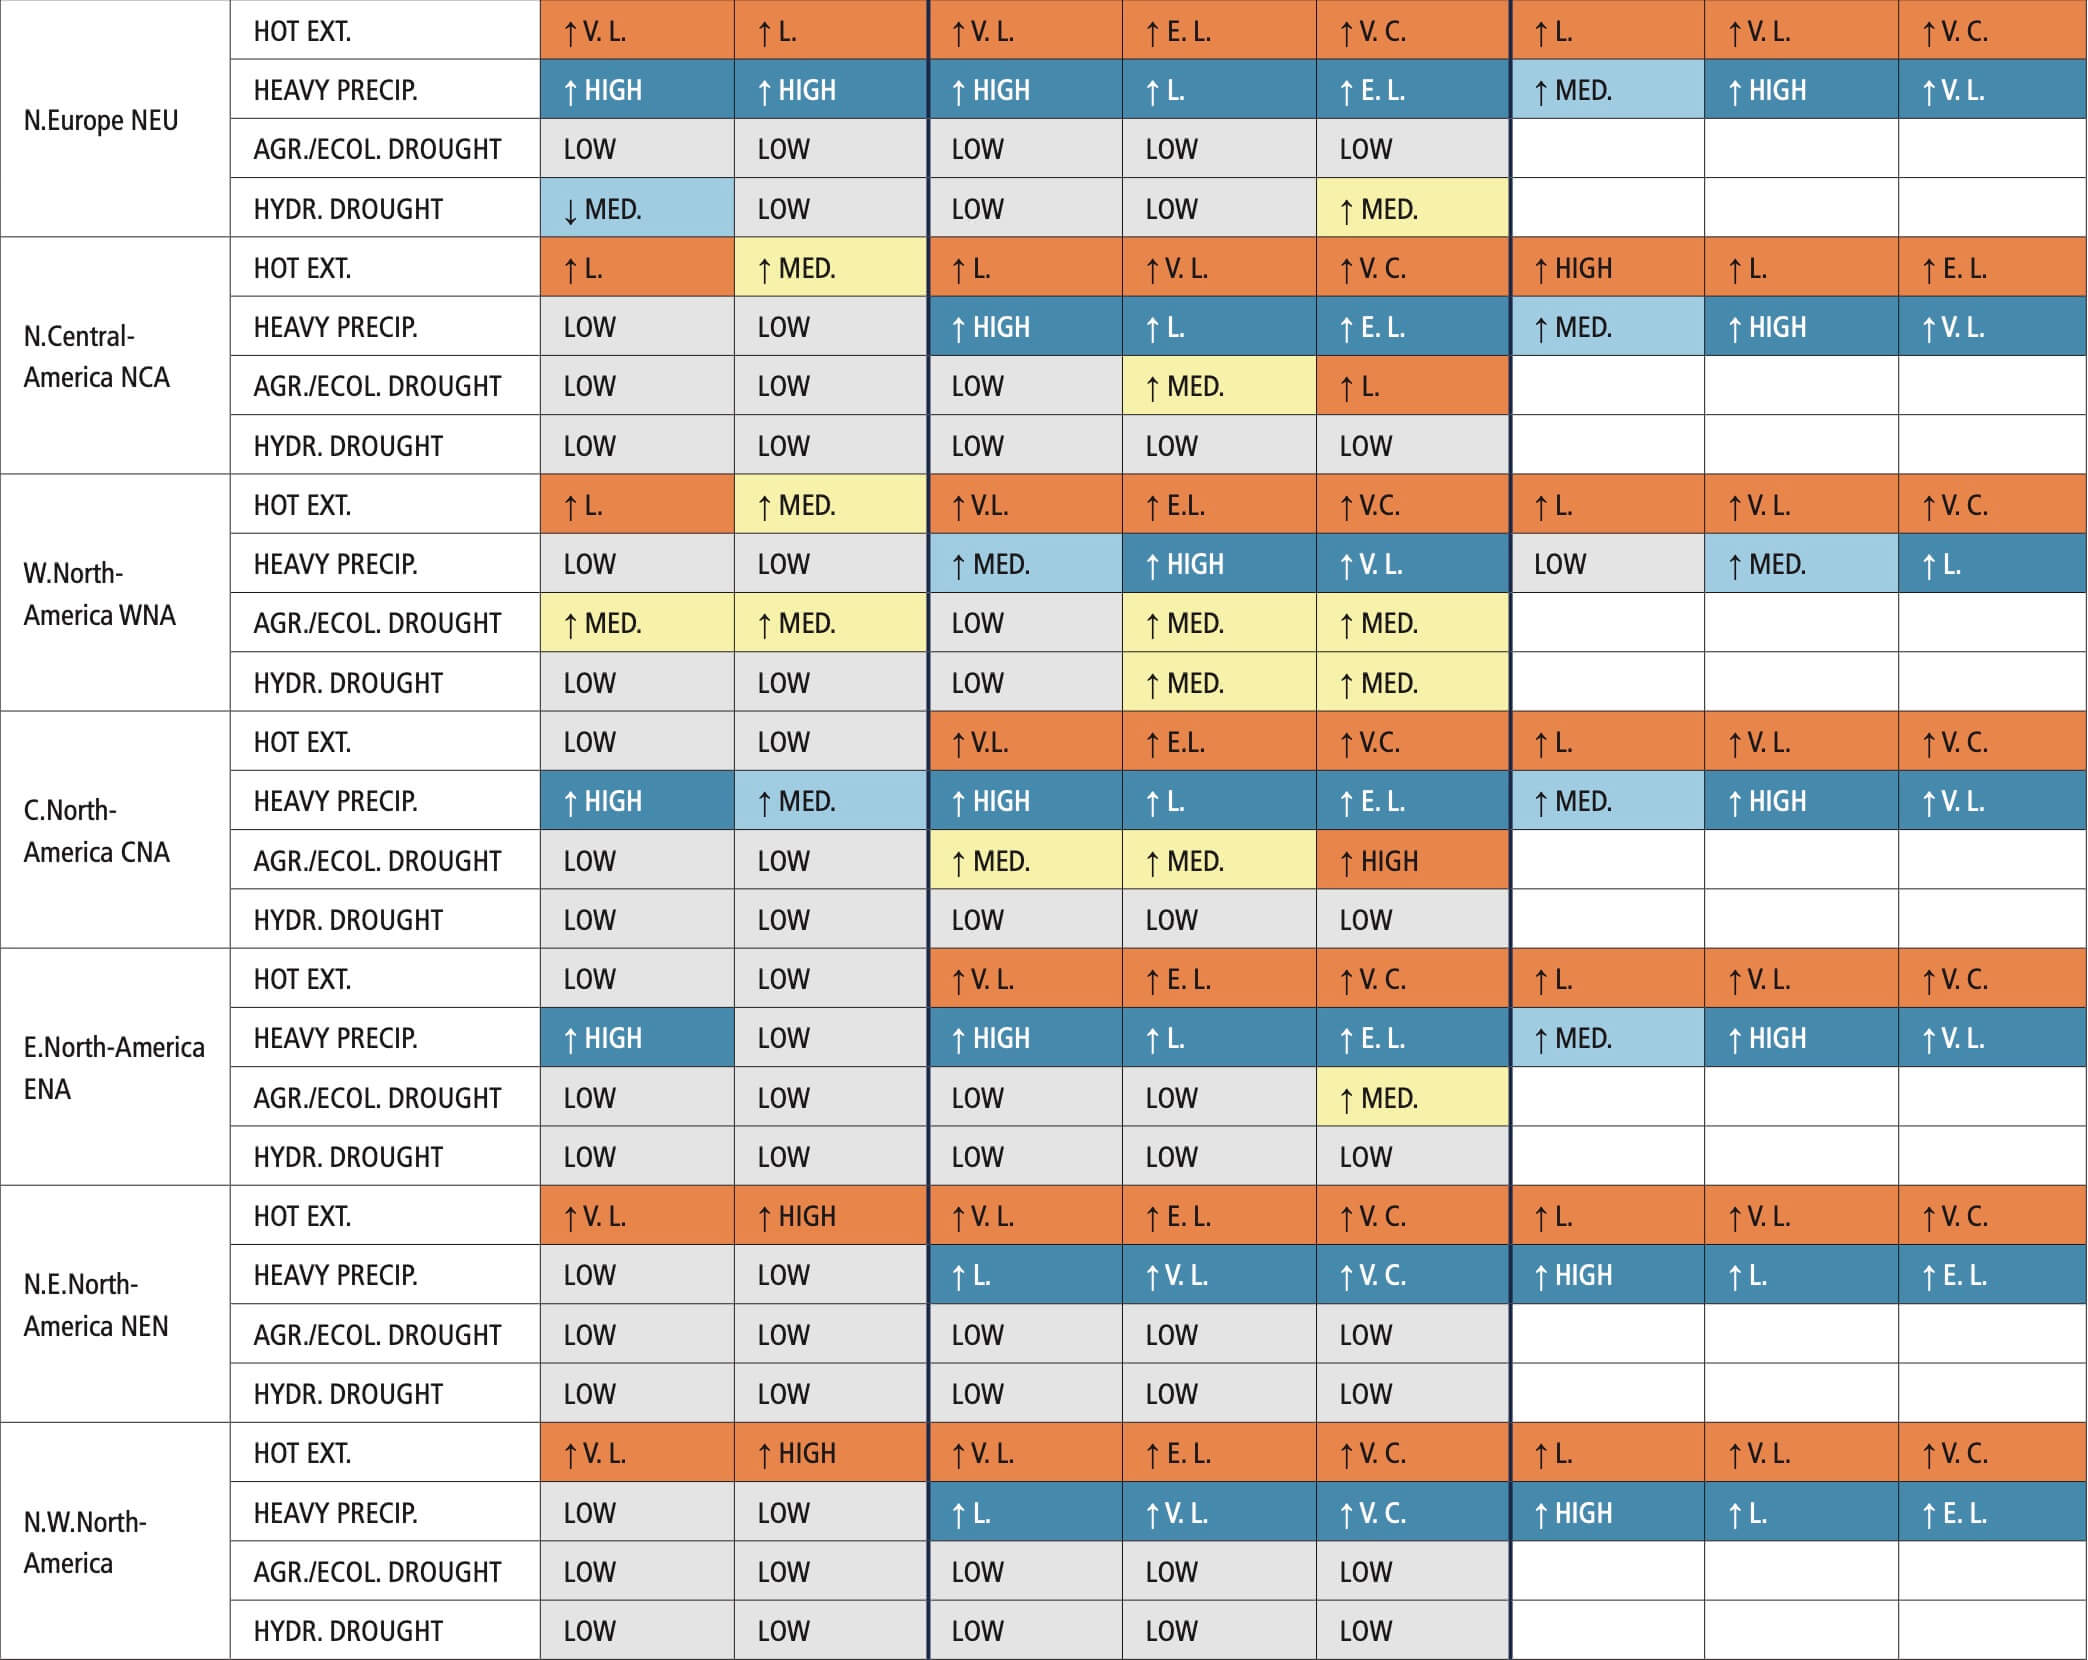
1See Figure 1.18 for definition of AR6 regions. Acronyms for inhabited regions: ARP: Arabian Peninsula; CAF: Central Africa; CAR: Caribbean; CAU: Central Australia; CNA: Central North America; EAS: East Asia; EAU: Eastern Australia; ECA: East Central Asia; EEU: Eastern Europe; ENA: Eastern North America; ESAF: East Southern Africa; ESB: East Siberia; GIC: Greenland/Iceland; MDG: Madagascar; MED: Mediterranean; NAU: Northern Australia; NCA: Northern Central America; NEAF: North Eastern Africa; NEN: North-Eastern North America; NES: North-Eastern South America; NEU: Northern Europe; NSA: Northern South America; NWN: North-Western North America; NWS: North-Western South America; NZ: New Zealand; RAR: Russian Arctic; RFE: Russian Far East; SAH: Sahara; SAM: South American Monsoon; SAS: South Asia; SAU: Southern Australia; SCA: Southern Central America; SEA: Southeast Asia; SEAF: South Eastern Africa; SES: South-Eastern South America; SSA: Southern South America; SWS: South-Western South America; TIB: Tibetan Plateau; WAF: Western Africa; WCA: West Central Asia; WCE: Western and Central Europe; WNA: Western North America; WSAF: West Southern Africa; WSB: West Siberia.
2Six-hourly intensity estimates during the lifetime of each TC.
3This region includes northern Africa and southern Europe.
4This region includes northern Africa and southern Europe.
5This region includes northern Africa and southern Europe.
6This region includes northern Africa and southern Europe.
7This region includes northern Africa and southern Europe.
8This region includes northern Africa and southern Europe.
9This region includes northern Africa and southern Europe.
10This region includes northern Africa and southern Europe.
11This region includes northern Africa and southern Europe.
12This region includes northern Africa and southern Europe.


