Special Report: Special Report on the Ocean and Cryosphere in a Changing Climate
Ch 06

Extremes, Abrupt Changes and Managing Risks

Coordinating Lead Authors:

  • Matthew Collins (United Kingdom)
  • Michael Sutherland (Trinidad & Tobago)

Lead Authors:

  • Laurens Bouwer (Netherlands)
  • So-Min Cheong (South Korea)
  • Thomas Frölicher (Switzerland)
  • Helene Jacot Des Combes (Fiji)
  • Mathew Koll Roxy (India)
  • Iñigo Losada (Spain)
  • Kathleen McInnes (Australia)
  • Beate Ratter (Germany)
  • Evelia Rivera-Arriaga (Mexico)
  • Raden Dwi Susanto (Indonesia)
  • Didier Swingedouw (France)
  • Lourdes Tibig (Philippines)

Contributing Authors:

  • Pepijn Bakker (Netherlands)
  • C. Mark Eakin (United States)
  • Kerry Emanuel (United States)
  • Michael Grose (Australia)
  • Mark Hemer (Australia)
  • Laura Jackson (United Kingdom)
  • Andreas Kääb (Norway)
  • Jules Kajtar (United Kingdom)
  • Thomas Knutson (United States)
  • Charlotte Laüfkotter (Switzerland, Germany)
  • Ilan Noy (New Zealand)
  • Mark Payne (Denmark)
  • Roshanka Ranasinghe (Netherlands)
  • Giovanni Sgubin (Italy)
  • Mary-Louise Timmermans (United States)

Review Editors:

  • Amjad Abdulla (Maldives)
  • Marcelino Hernádez González (Cuba)
  • Carol Turley (United Kingdom)

Chapter Scientist:

  • Jules Kajtar (United Kingdom)

FAQ 6.1 | How can risks of abrupt changes in the ocean and cryosphere related to climate change be addressed?

Reducing greenhouse gas (GHG) emissions will reduce the occurrence of extreme events and the likelihood of abrupt changes. Abrupt changes can be irreversible on human time scales and, as tipping points, bring natural systems to novel conditions. To reduce risks that emerge from these impacts of climate change, communities can protect themselves or accommodate to the new environment. In the last resort, they may retreat from exposed areas. Governance that builds on diverse expertise and considers a variety of actions is best equipped to manage remaining risks.

Climate change is projected to influence extreme events and to potentially cause abrupt changes in the ocean and the cryosphere. Both these phenomena can add to the other, slow-onset impacts of climate change, such as a global warming or sea level rise (SLR). In addition, abrupt changes can be tipping points, bringing the ocean, cryosphere, as well as their ecosystems, or the whole climate system, to new conditions instead or going back to the ones prevailing before the abrupt change.

In the ocean, a possible abrupt change is associated with an interruption of the Atlantic Meridional Overturning Circulation (AMOC), an important component of global ocean circulation. A slowdown of the AMOC could have consequences around the world: rainfall in the Sahel region could reduce, hampering crop production; the summer monsoon in Asia could weaken; regional SLR could increase around the Atlantic, and there might be more winter storms in Europe. The collapse of the West Antarctic Ice Sheet (WAIS) is considered to be one of the tipping points for the global climate. Such an event can be triggered when ice shelves break and ice flows towards the ocean. While, in general, it is difficult to assess the probability of occurrence of abrupt climate events they are physically plausible events that could cause large impacts on ecosystems and societies and may be irreversible.

Reducing GHG emissions is the main action to limit global warming to acceptable levels and reduce the occurrence of extreme events and abrupt changes. However, in addition to mitigation, a variety of measures and risk management strategies supports adaptation to future risks. Future risks linked to abrupt changes are strongly influenced by local conditions and different characteristics of the events themselves and evolve differently depending on the circumstances. One major factor for adaptation is whether the extreme events will simply amplify the known impacts or whether they will cause completely new conditions, which may be related to a tipping point. Another essential factor is whether an extreme event or abrupt change will happen in isolation or in conjunction with other events, in a chain of cascading impacts or as part of a compound risk where several events happen at the same time so that impacts can multiply each other. Also, impacts are heavily aggravated by increasing exposure and changes in vulnerability, for example reducing the availability of food, water and energy supply, and not just the occurrence of extremes themselves.

Successful management of extreme events and abrupt changes in the ocean and cryosphere involves all available resources and governance approaches, including among others land-use and spatial planning, indigenous knowledge and local knowledge. The management of the risks to ecosystems include their preservation, the sustainable use of resources and the recognition of the value of ecosystem services. There are three general approaches that, alone or in combination, can enable communities to adapt to these events: retreat from the area, accommodation to new conditions and protection. All have advantages and limitations and their success will depend on the specific circumstances and the community’s level of adaptability. But only transformative governance that integrates a variety of strategies and benefits from institutional change helps to address larger risks posed by compound events. Integrating risk-reduction approaches into institutional practices and inclusive decision making that builds on the respective competences of different government agencies and other stakeholders can support management of these extremes. A change of lifestyles and livelihoods might further support the adaptation to new conditions.

Figure 6.1
View details
Figure 6.2
View details
Figure 6.3
View details
Figure 6.4
View details
Figure 6.5
View details
Figure 6.6
View details
Figure 6.7
View details
Figure 6.8
View details
Figure 6.9
View details
Figure 6.10
View details
ES

Executive Summary

This chapter assesses extremes and abrupt or irreversible changes in the ocean and cryosphere in a changing climate, to identify regional hot spots, cascading effects, their impacts on human and natural systems, and sustainable and resilient risk management strategies. It is not comprehensive in terms of the systems assessed and some information on extremes, abrupt and irreversible changes, in particular for the cryosphere, may be found in other chapters

Ongoing and Emerging Changes in the Ocean and Cryosphere, and their Impacts on Ecosystems and Human Societies

Anthropogenic climate change has increased observed precipitation (medium confidence), winds (low confidence), and extreme sea level events (high confidence) associated with some tropical cyclones, which has increased intensity of multiple extreme events and associated cascading impacts (high confidence). Anthropogenic climate change may have contributed to a poleward migration of maximum tropical cyclone intensity in the western North Pacific in recent decades related to anthropogenically-forced tropical expansion (low confidence). There is emerging evidence for an increase in annual global proportion of Category 4 or 5 tropical cyclones in recent decades (low confidence). {6.3, Table 6.2, Figure 6.2, Box 6.1}. 

Changes in Arctic sea ice have the potential to influence mid-latitude weather (medium confidence), but there is low confidence in the detection of this influence for specific weather types. {6.3}

Extreme wave heights, which contribute to extreme sea level events, coastal erosion and flooding, have increased in the Southern and North Atlantic Oceans by around 1.0 cm yr–1 and 0.8 cm yr–1 over the period 1985–2018 (medium confidence). Sea ice loss in the Arctic has also increased wave heights over the period 1992–2014 (medium confidence). {6.3}

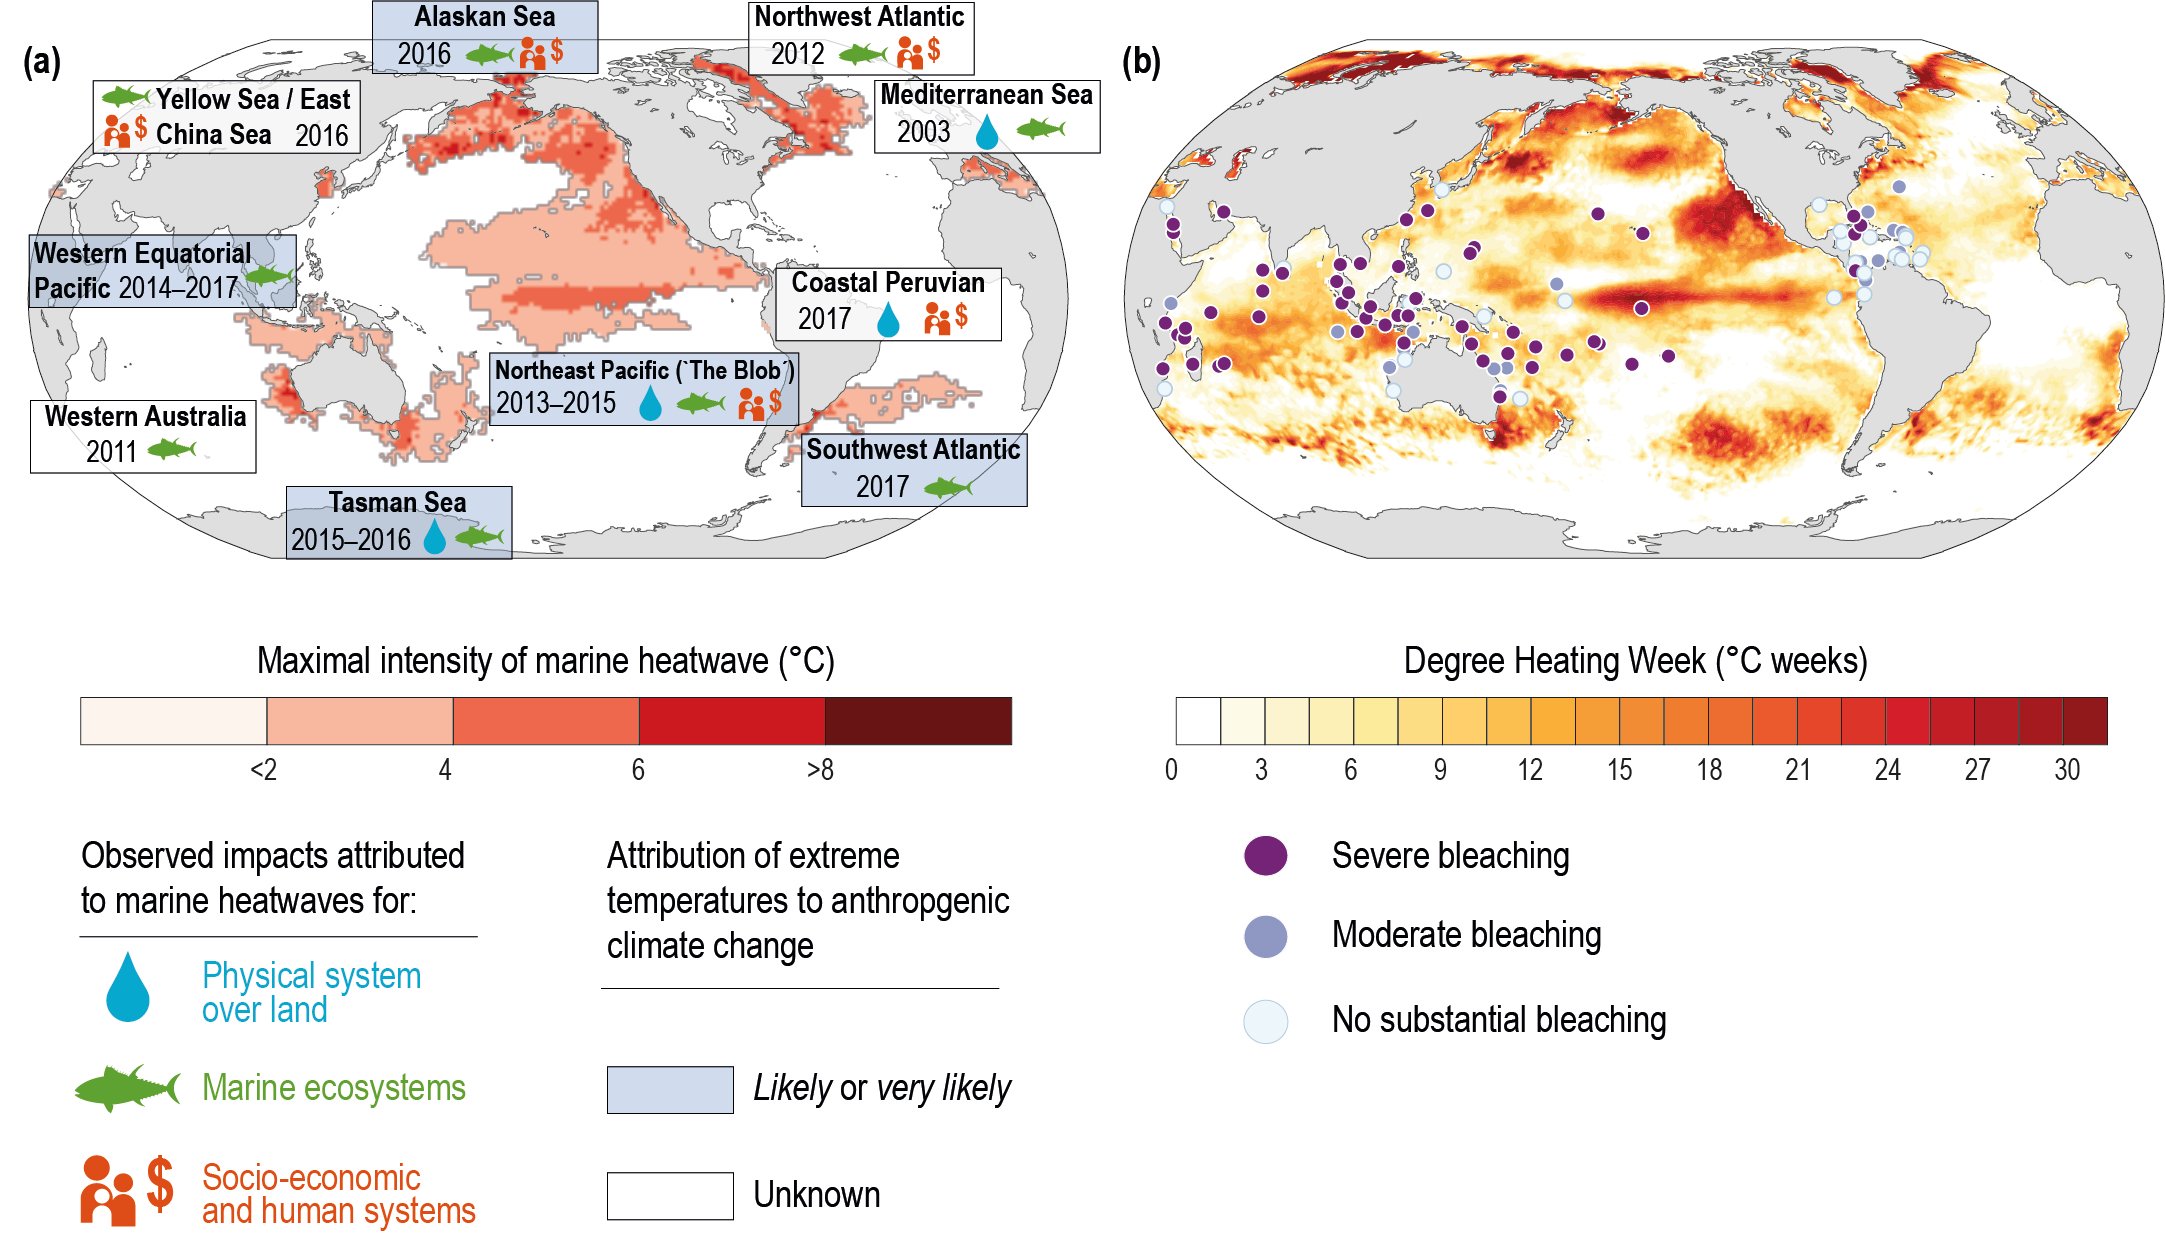
Marine heatwaves (MHWs), periods of extremely high ocean temperatures, have negatively impacted marine organisms and ecosystems in all ocean basins over the last two decades, including critical foundation species such as corals, seagrasses and kelps (very high confidence). Globally, marine heat related events have increased; marine heatwaves, defined when the daily sea surface temperature exceeds the local 99th percentile over the period 1982 to 2016, have doubled in frequency and have become longer-lasting, more intense and more extensive (very likely). It is very likely that between 84–90% of marine heatwaves that occurred between 2006 and 2015 are attributable to the anthropogenic temperature increase.{6.4, Figures 6.3, 6.4}

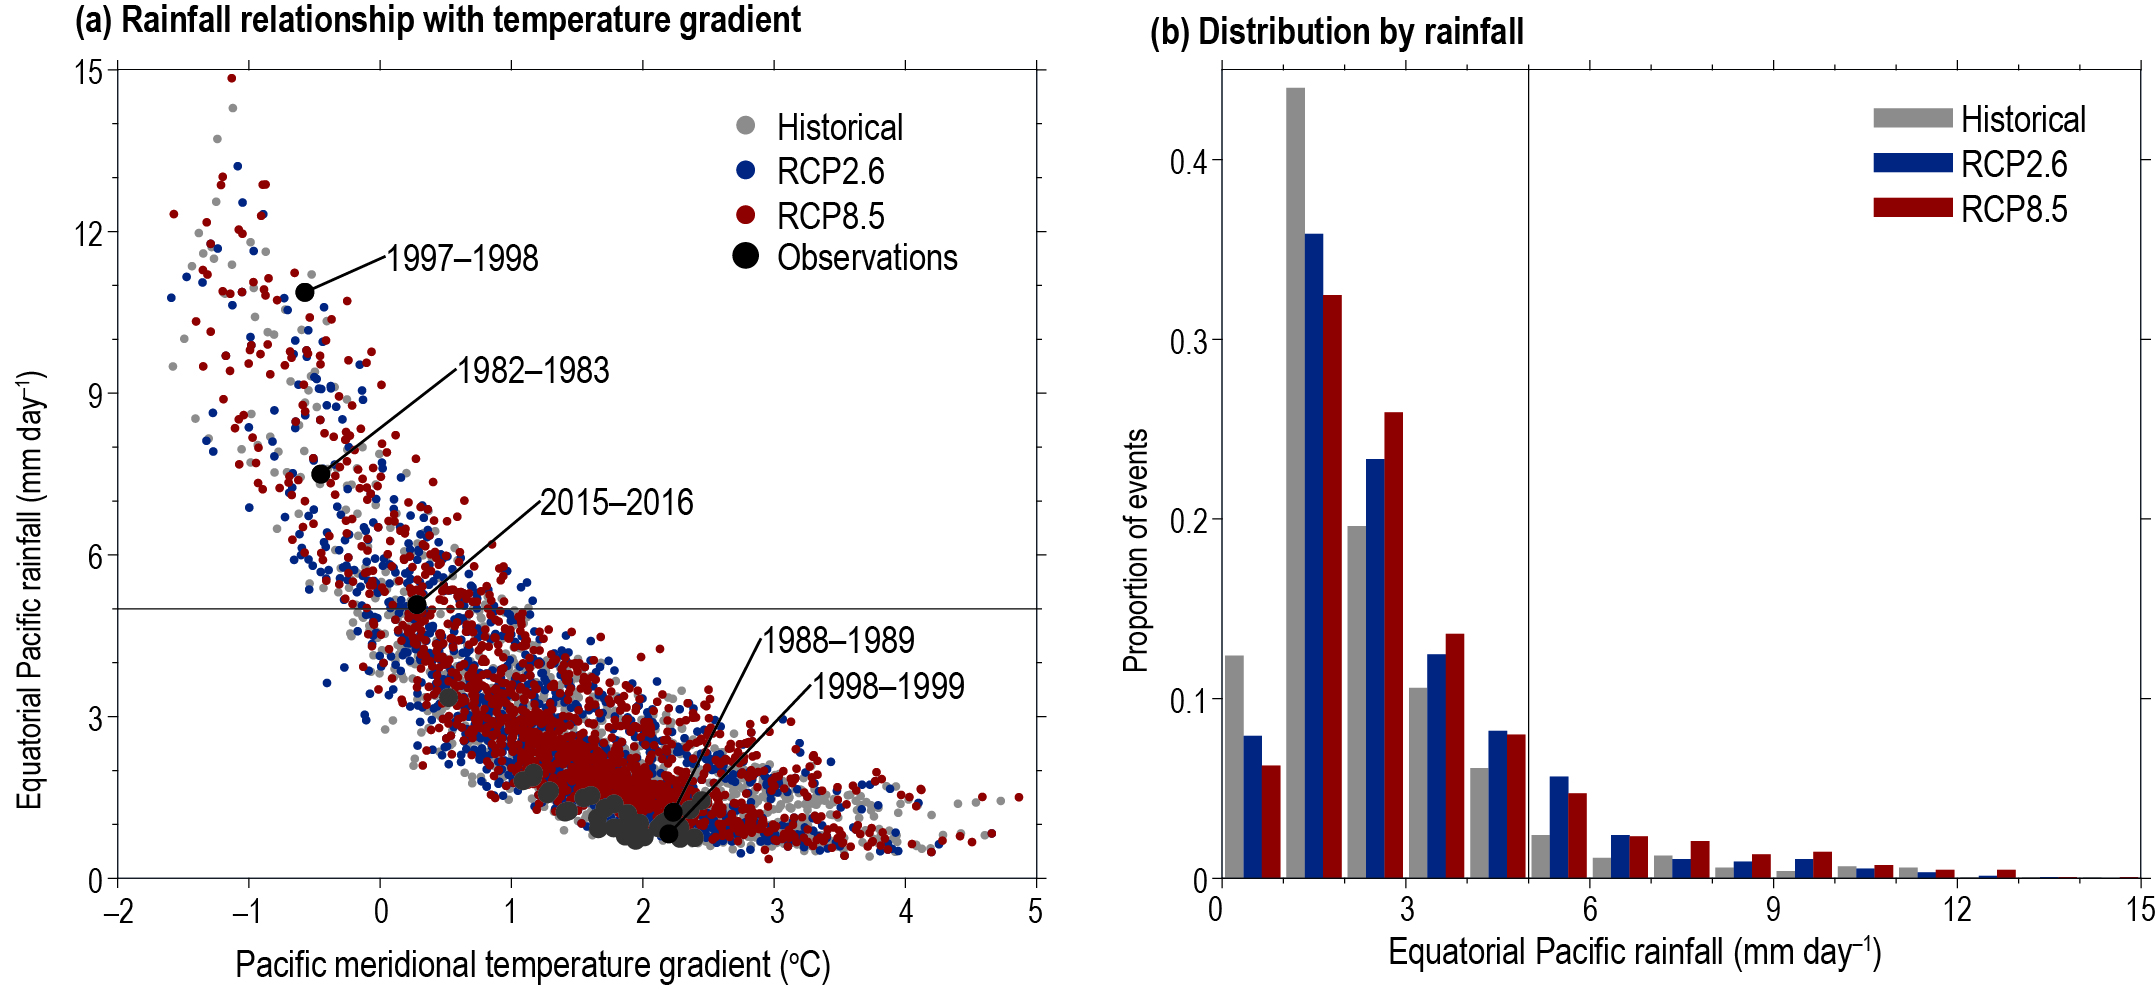
Both palaeoclimate and modern observations suggest that the strongest El Niño and La Niña events since the pre-industrial have occurred during the last fifty years (medium confidence). There have been three occurrences of extreme El Niño events during the modern observational period (1982–1983, 1997–1998, 2015–2016), all characterised by pronounced rainfall in the normally dry equatorial East Pacific. There have been two occurrences of extreme La Niña (1988–1989, 1998–1999). El Niño and La Niña variability during the last 50 years is unusually high compared with average variability during the last millennium. {6.5, Figure 6.5}

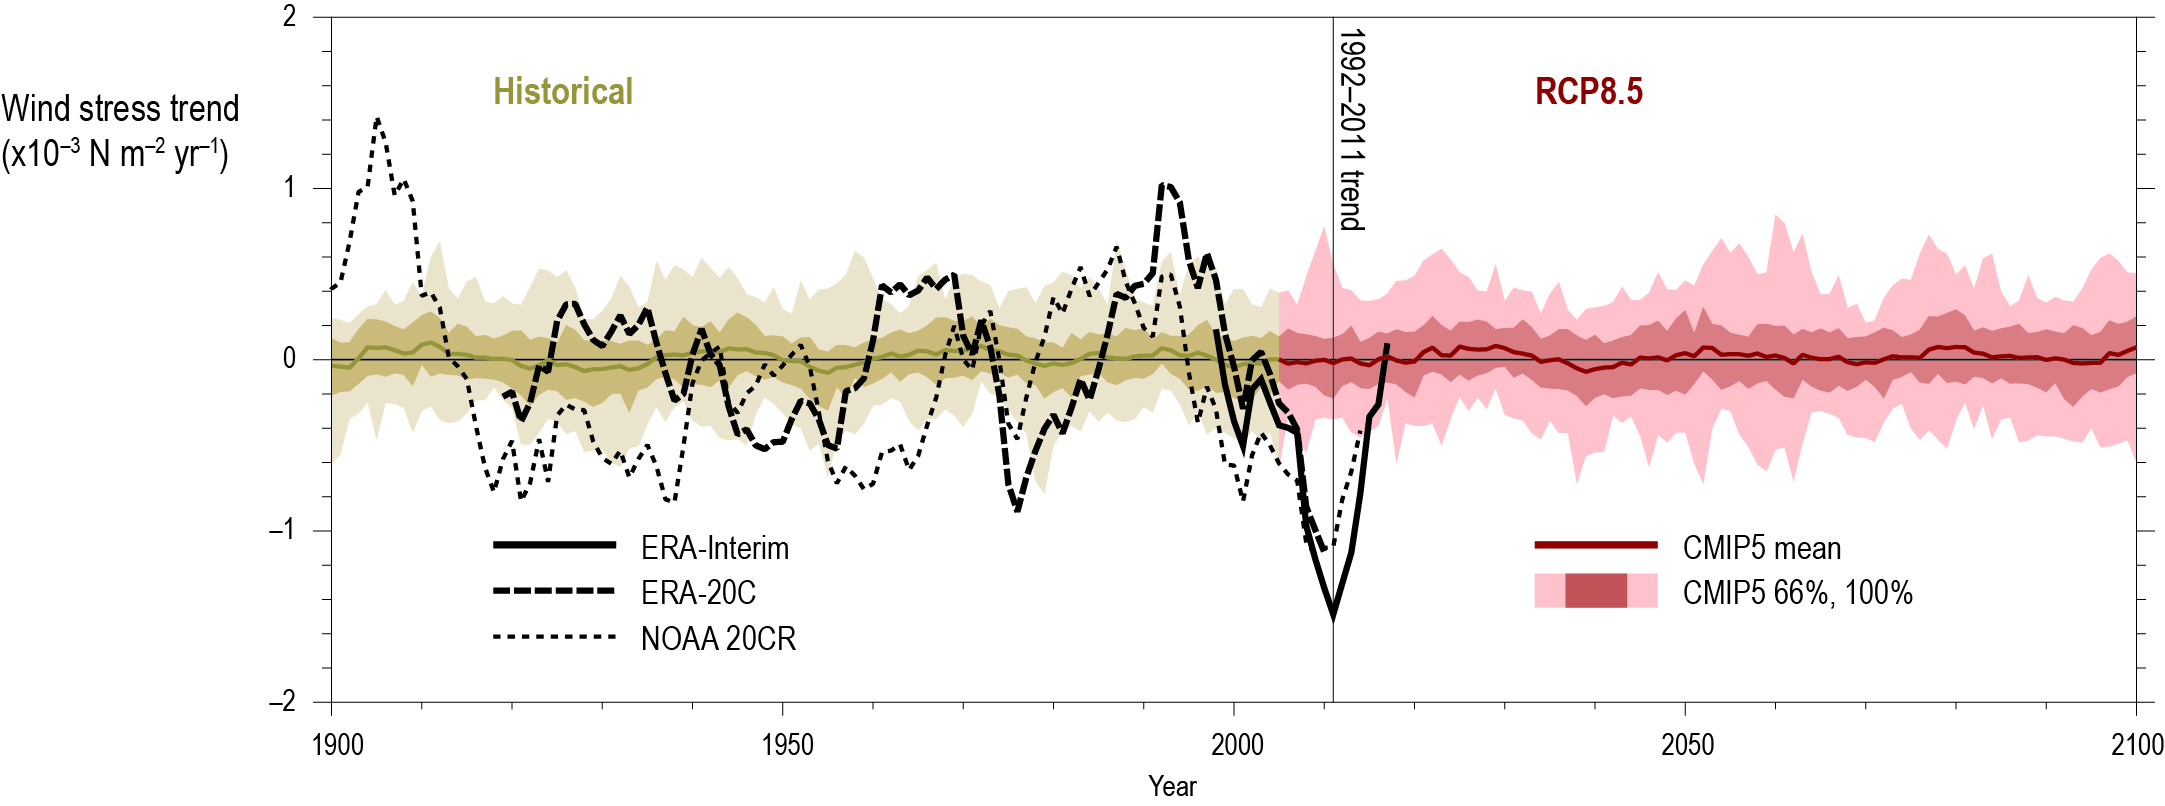
The equatorial Pacific trade wind system experienced an unprecedented intensification during 20012014, resulting in enhanced ocean heat transport from the Pacific to the Indian Ocean, influencing the rate of global temperature change (medium confidence). In the last two decades, total water transport from the Pacific to the Indian Ocean by the Indonesian Throughflow (ITF), and the Indian Ocean to Atlantic Ocean has increased (high confidence). Increased ITF has been linked to Pacific cooling trends and basin-wide warming trends in the Indian Ocean. Pacific sea surface temperature (SST) cooling trends and strengthened trade winds have been linked to an anomalously warm tropical Atlantic. {6.6, Figure 6.7}

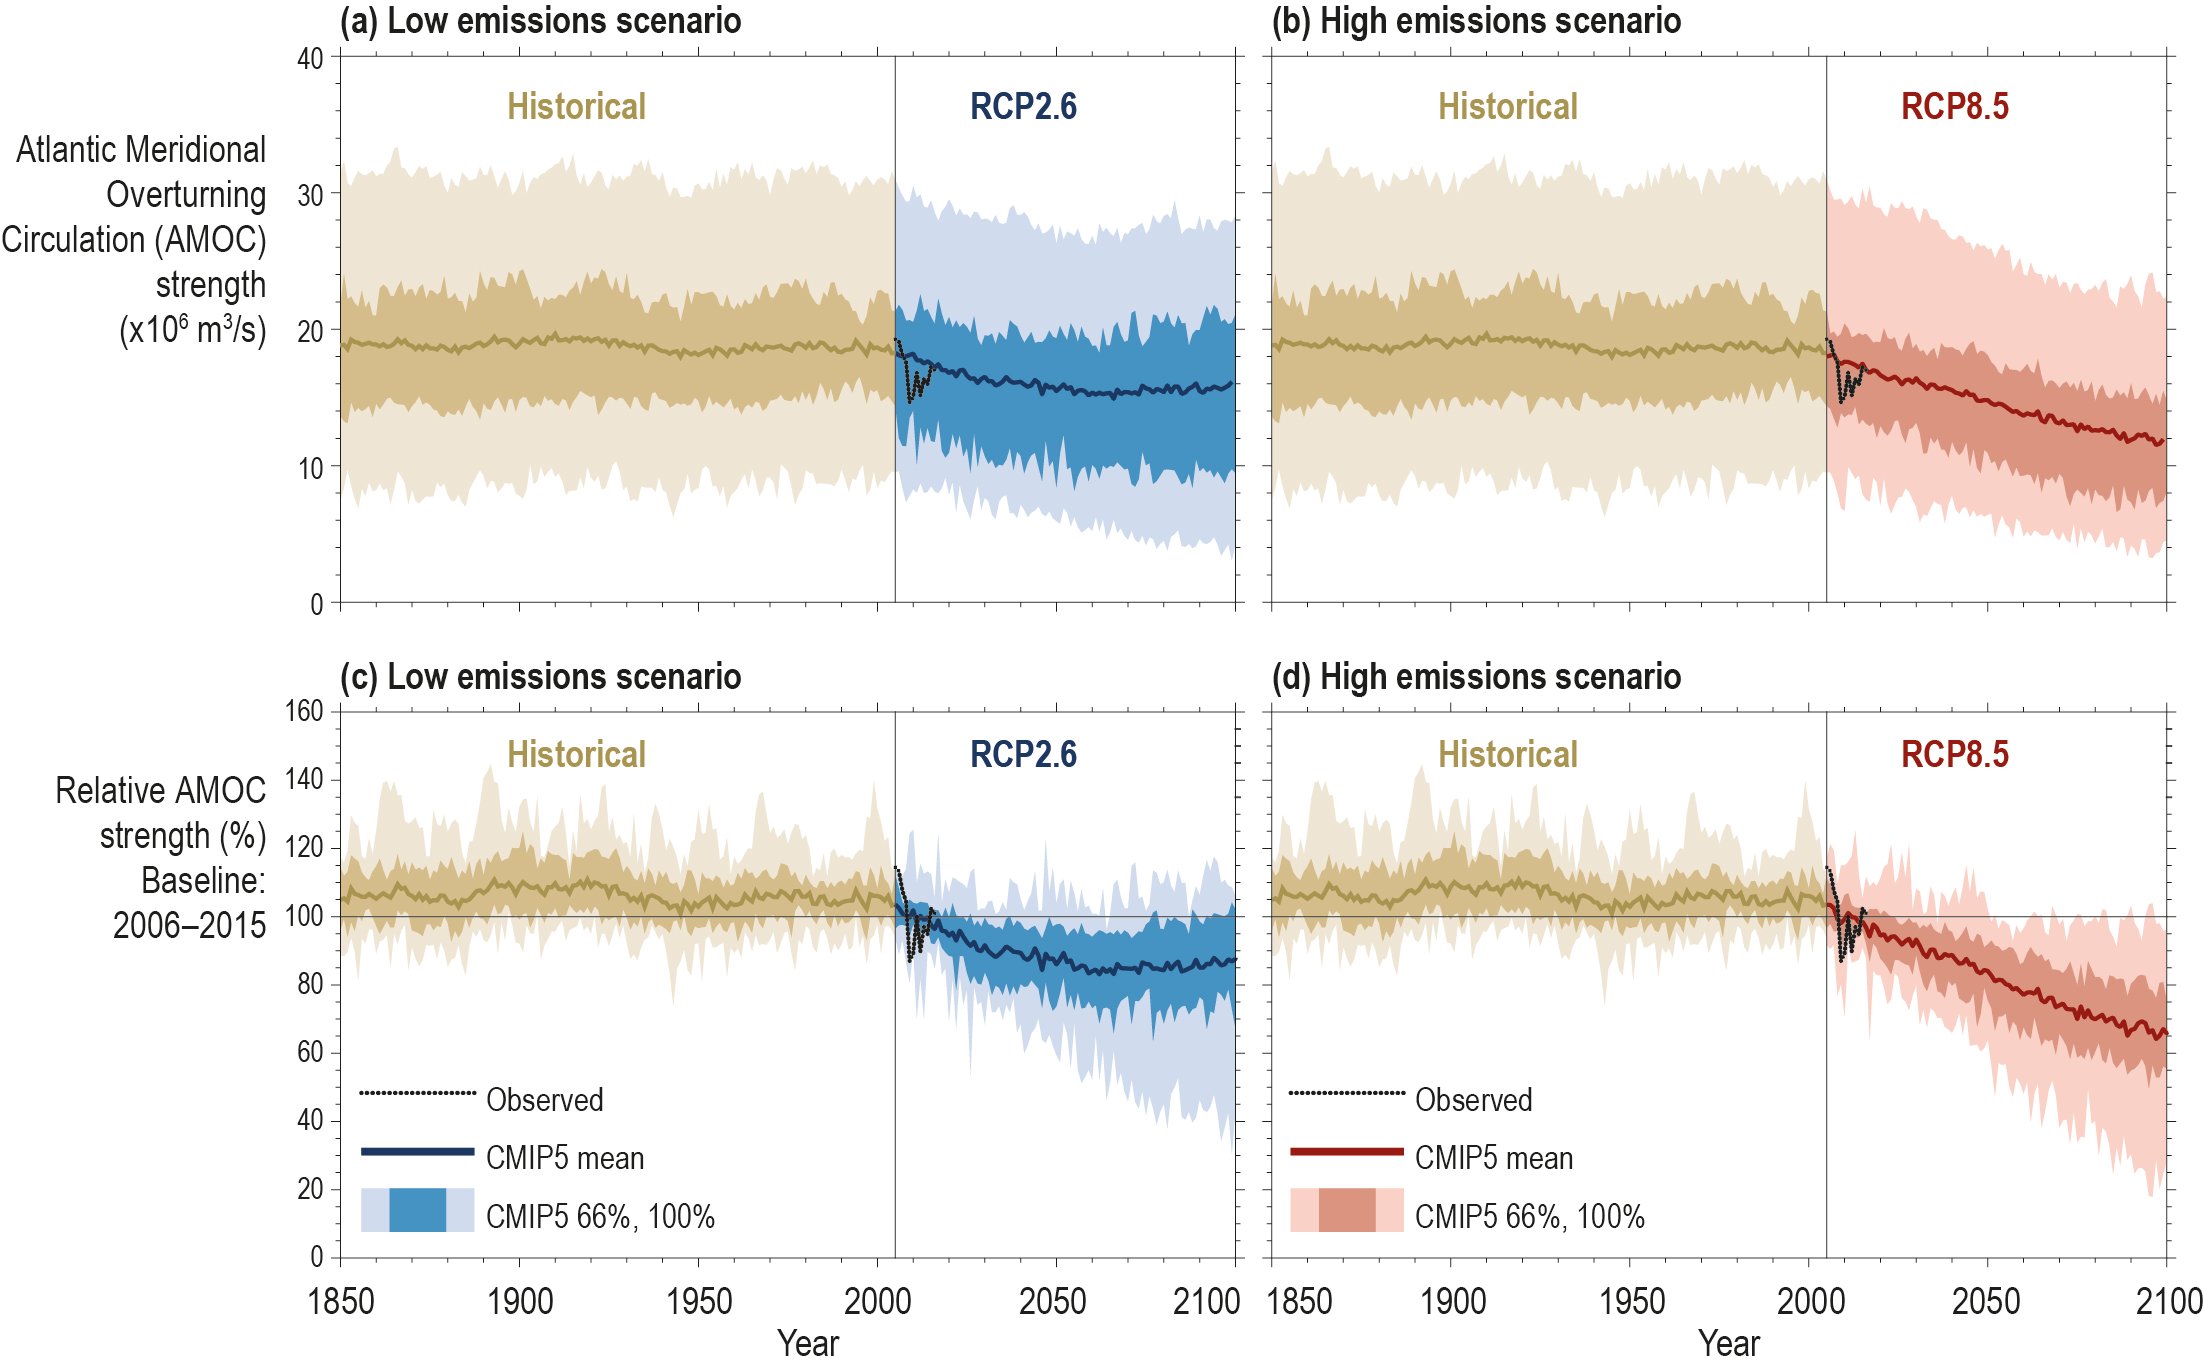
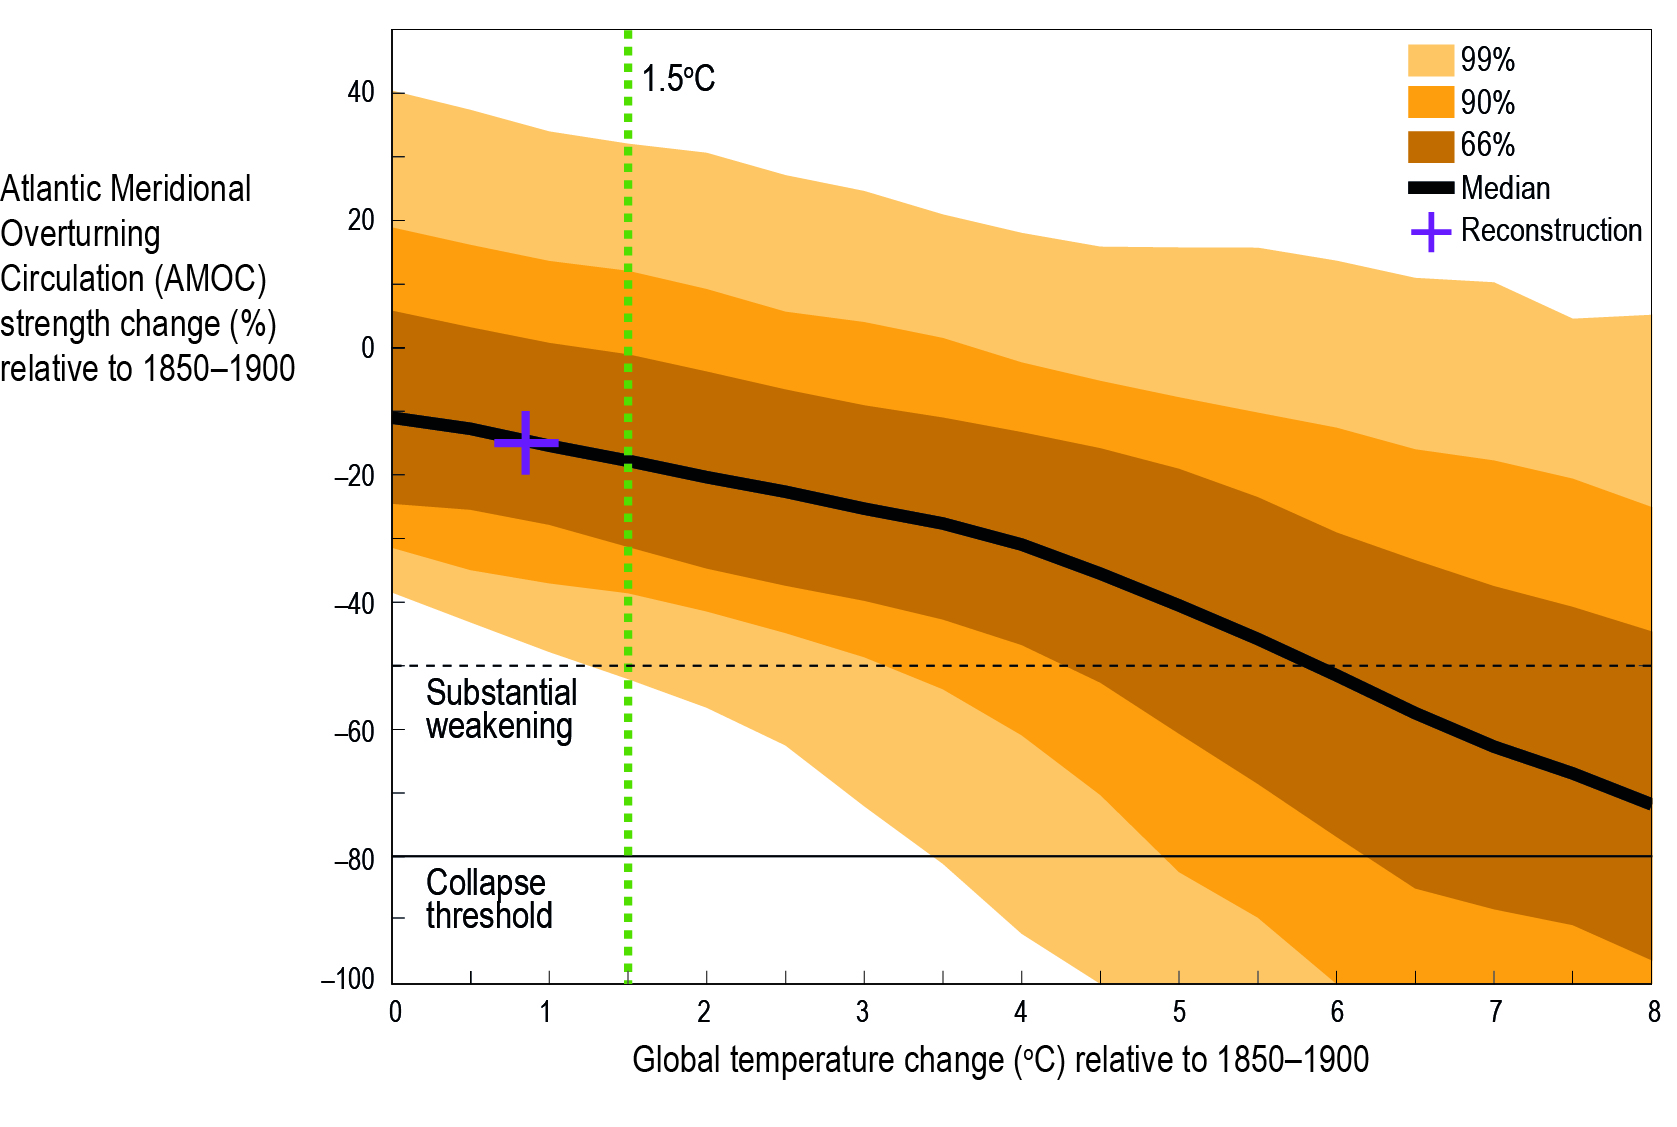
Observations, both in situ (2004–2017) and based on sea surface temperature reconstructions, indicate that the Atlantic Meridional Overturning Circulation (AMOC) has weakened relative to 1850–1900 (medium confidence). There is insufficient data to quantify the magnitude of the weakening, or to properly attribute it to anthropogenic forcing due to the limited length of the observational record. Although attribution is currently not possible, CMIP5 model simulations of the period 1850–2015, on average, exhibit a weakening AMOC when driven by anthropogenic forcing. {6.7, Figure 6.8}

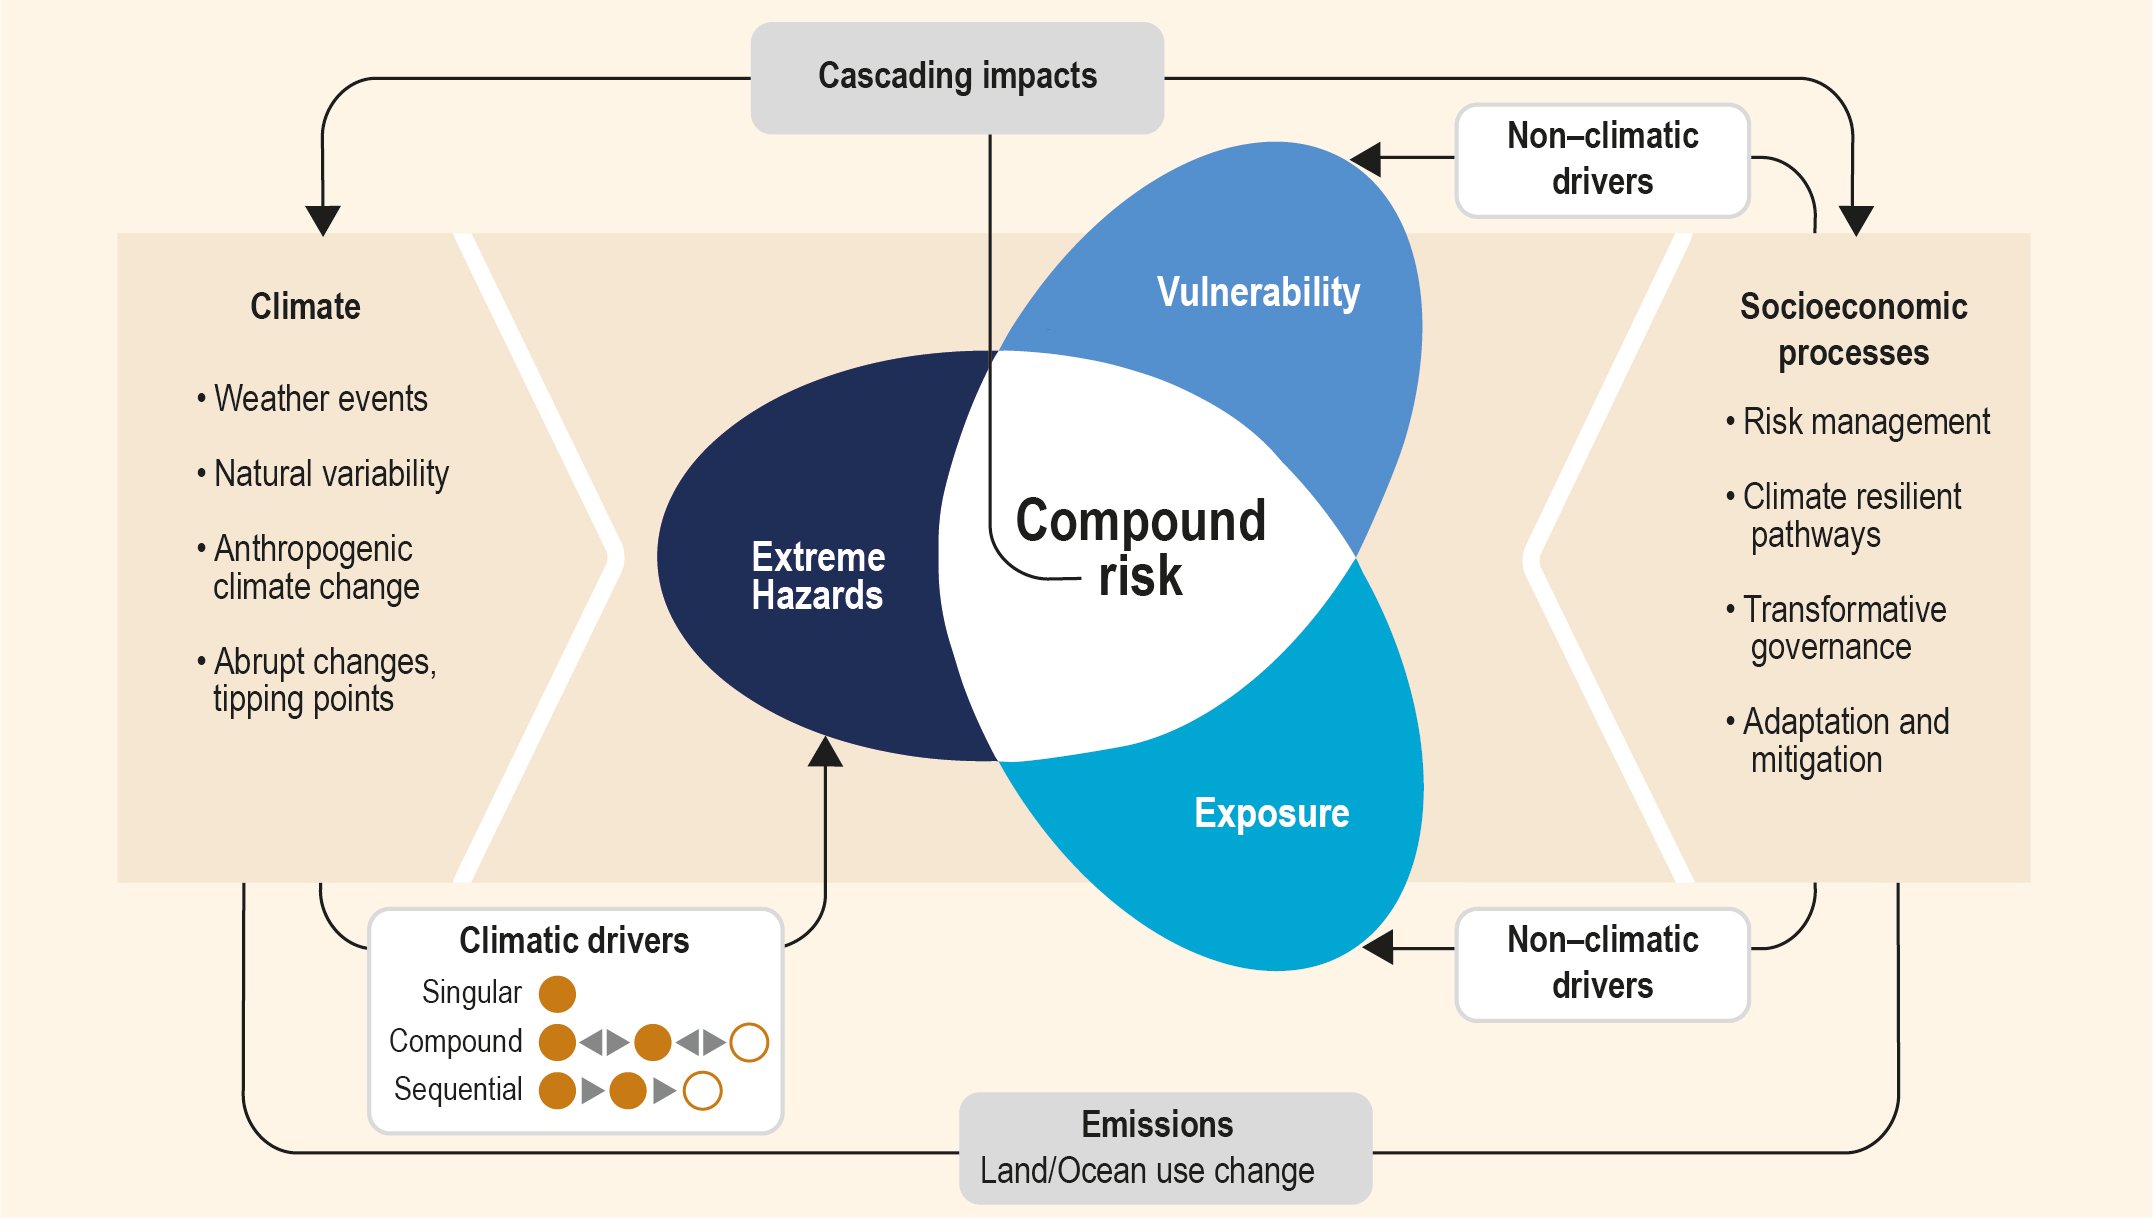
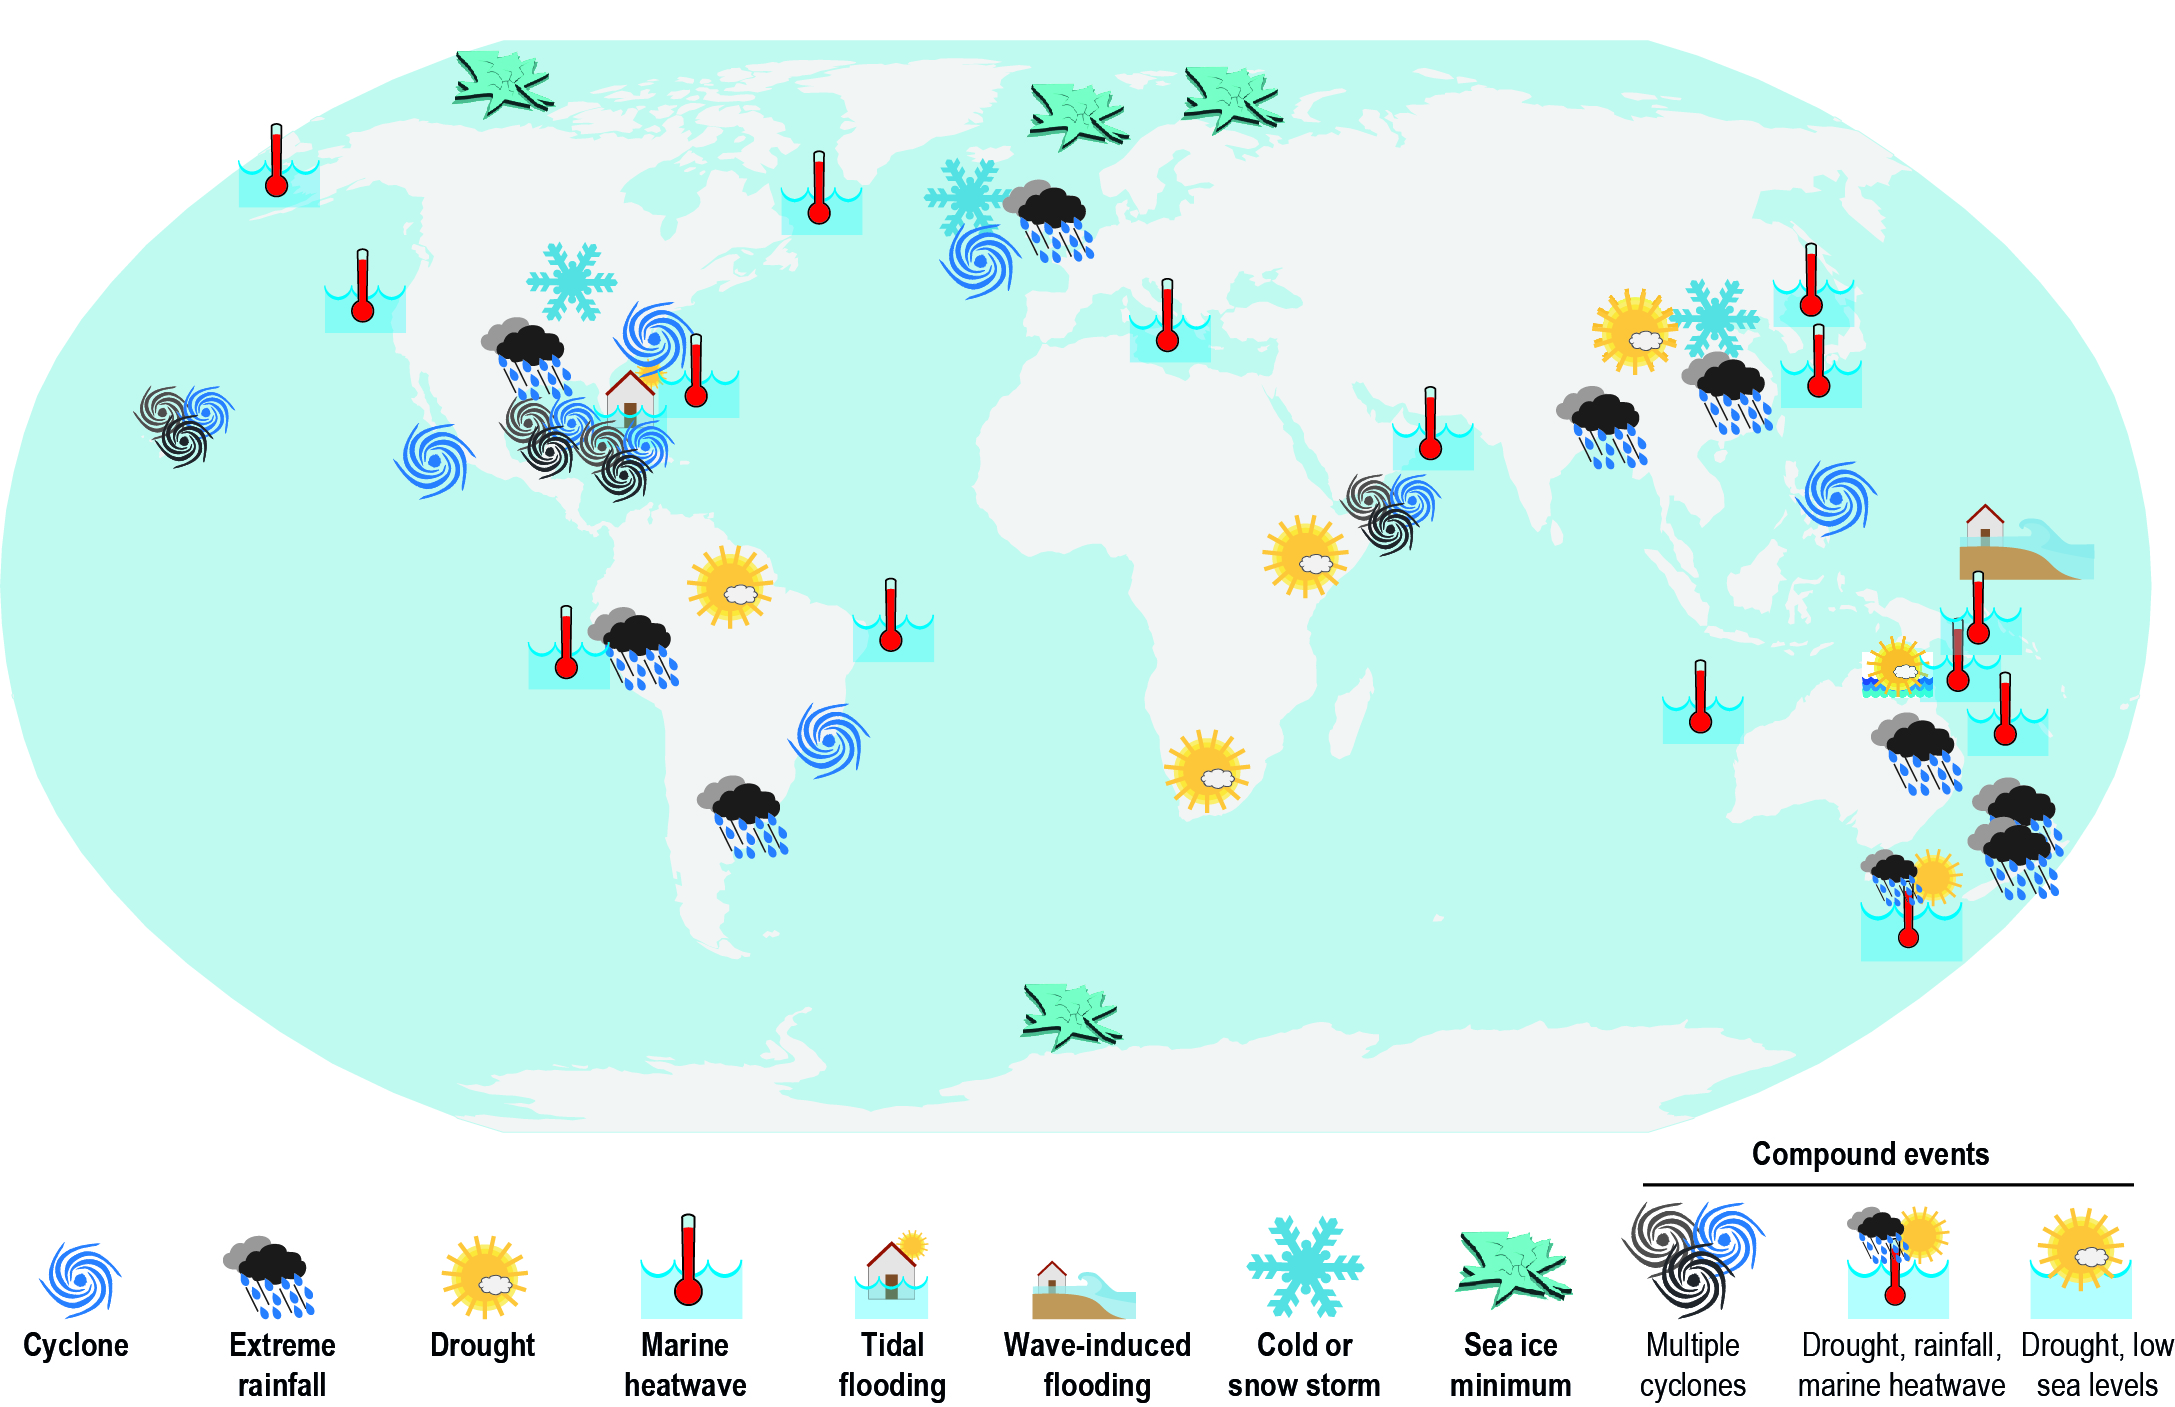
Climate change is modifying multiple types of climate-related events or hazards in terms of occurrence, intensity and periodicity. It increases the likelihood of compound hazards that comprise simultaneously or sequentially occurring events to cause extreme impacts in natural and human systems. Compound events in turn trigger cascading impacts (high confidence). Three case studies are presented in the chapter, (i) Tasmania’s Summer of 20152016, (ii) The Coral Triangle and (ii) Hurricanes of 2017. {6.8, Box 6.1}

Projections of Ocean and Cryosphere Change and Hazards to Ecosystems and Human Society Under Low and High Emission Futures

The average intensity of tropical cyclones, the proportion of Category 4 and 5 tropical cyclones and the associated average precipitation rates are projected to increase for a 2°C global temperature rise above any baseline period (medium confidence). Rising mean sea levels will contribute to higher extreme sea levels associated with tropical cyclones (very high confidence). Coastal hazards will be exacerbated by an increase in the average intensity, magnitude of storm surge and precipitation rates of tropical cyclones. There are greater increases projected under RCP8.5 than under RCP2.6 from around mid-century to 2100 (medium confidence). There is low confidence in changes in the future frequency of tropical cyclones at the global scale. {6.3.1}

Significant wave heights (the average height from trough to crest of the highest one-third of waves) are projected to increase across the Southern Ocean and tropical eastern Pacific (high confidence) and Baltic Sea (medium confidence) and decrease over the North Atlantic and Mediterranean Sea under RCP8.5 (high confidence). Coastal tidal amplitudes and patterns are projected to change due to sea level rise and coastal adaptation measures (very likely). Projected changes in waves arising from changes in weather patterns, and changes in tides due to sea level rise, can locally enhance or ameliorate coastal hazards (medium confidence). {6.3.1, 5.2.2}

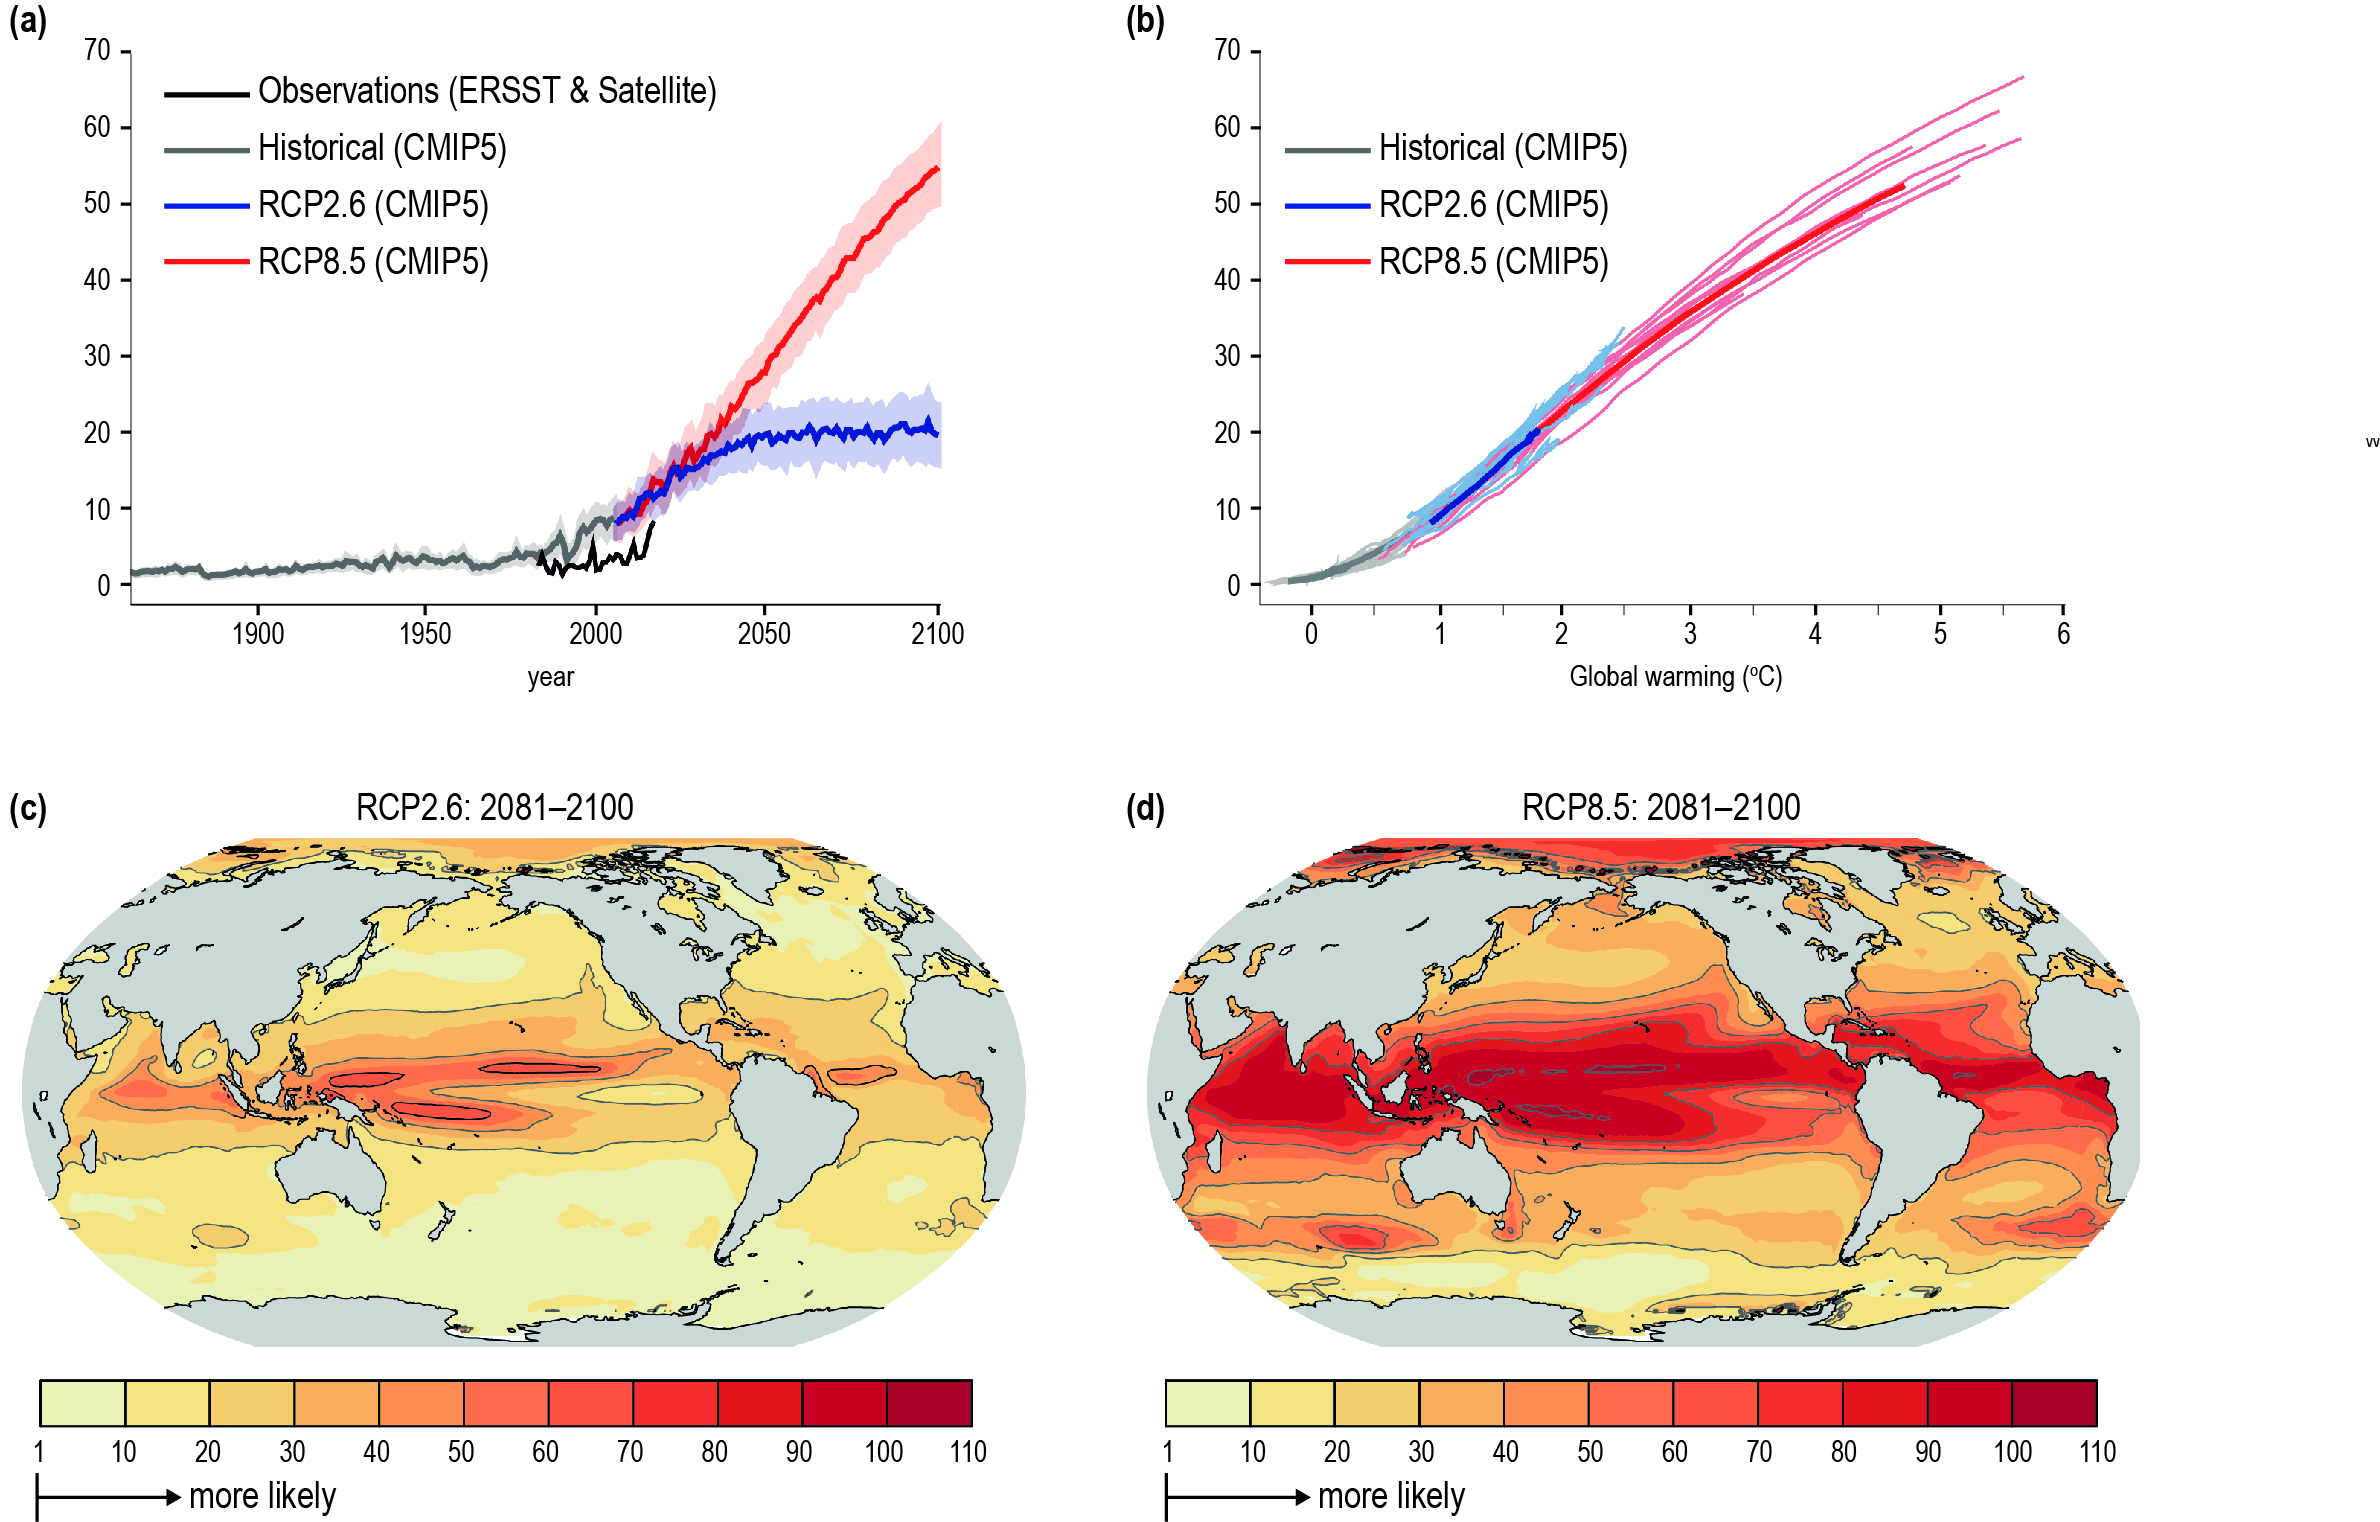
Marine heatwaves are projected to further increase in frequency, duration, spatial extent and intensity (maximum temperature) (very high confidence). Climate models project increases in the frequency of marine heatwaves by 2081-2100, relative to 1850–1900, by approximately 50 times under RCP8.5 and 20 times under RCP2.6 (medium confidence). The largest increases in frequency are projected for the Arctic and the tropical oceans (medium confidence). The intensity of marine heatwaves is projected to increase about 10-fold under RCP8.5 by 2081–2100, relative to 1850–1900 (medium confidence). {6.4}

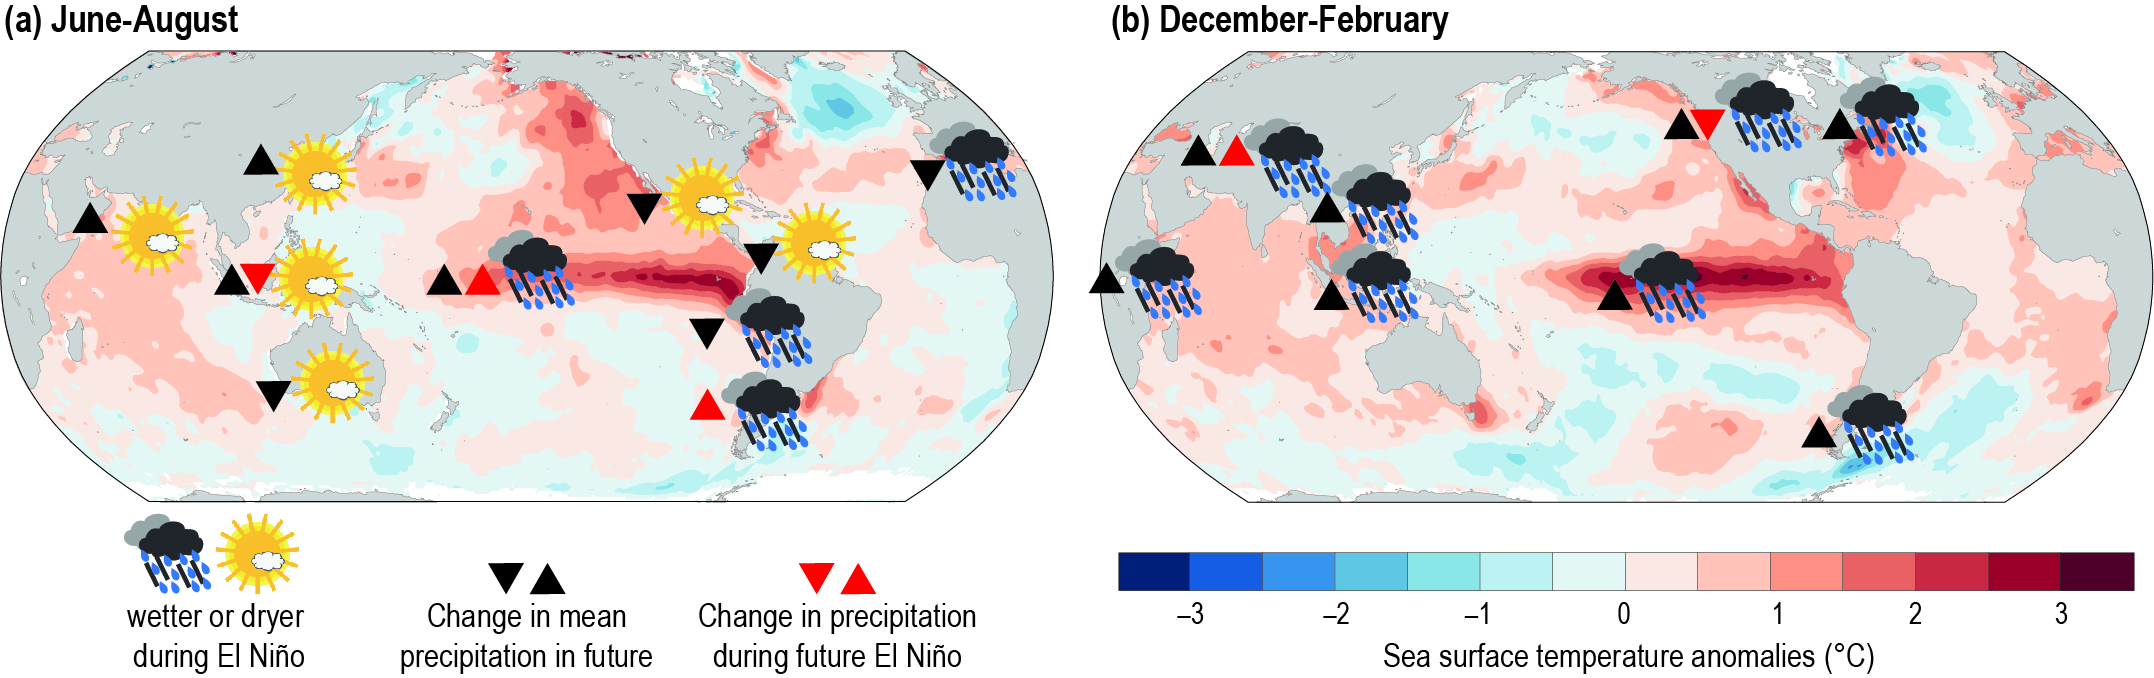
Extreme El Niño and La Niña events are projected to likely increase in frequency in the 21st century and to likely intensify existing hazards, with drier or wetter responses in several regions across the globe. Extreme El Niño events are projected to occur about as twice as often under both RCP2.6 and RCP8.5 in the 21st century when compared to the 20th century (medium confidence).  Projections indicate that extreme Indian Ocean Dipole events also increase in frequency (low confidence). {6.5; Figures 6.5, 6.6}

Lack of long-term sustained Indian and Pacific Ocean observations, and inadequacies in the ability of climate models to simulate the magnitude of trade wind decadal variability and the inter-ocean link, mean there is low confidence in future projections of the trade wind system. {6.6, Figure 6.7}

The AMOC will very likely weaken over the 21st century (high confidence), although a collapse is very unlikely (medium confidence). Nevertheless, a substantial weakening of the AMOC remains a physically plausible scenario. Such a weakening would strongly impact natural and human systems, leading to a decrease in marine productivity in the North Atlantic, more winter storms in Europe, a reduction in Sahelian and South Asian summer rainfall, a decrease in the number of TCs in the Atlantic, and an increase in regional sea level around the Atlantic especially along the northeast coast of North America (medium confidence). Such impacts would be superimposed on the global warming signal. {6.7, Figure 6.8}

Impacts from further changes in TC and ETCs, MHWs, extreme El Niño and La Niña events and other extremes will exceed the limits of resilience and adaptation of ecosystems and people, leading to unavoidable loss and damage (medium confidence). {6.9.2}

Strengthening the Global Responses in the Context of Sustainable Development Goals (SDGs) and Charting Climate Resilient Development Pathways for Oceans and Cryosphere 

There is medium confidence that including extremes and abrupt changes, such as AMOC weakening, ice sheet collapse (West Antarctic Ice Sheet (WAIS) and Greenland Ice Sheet (GIS)), leads to a several-fold increase in the cost of carbon emissions (medium confidence). If carbon emissions decline, the risk of extremes and abrupt changes are reduced, creating co-benefits. {6.8.5}

For TCs and ETCs, investment in disaster risk reduction, flood management (ecosystem and engineered) and early warning systems decreases economic loss (medium confidence), but such investments may be hindered by limited local capacities, such as increased losses and mortality from extreme winds and storm surges in less developed countries despite adaptation efforts. There is emerging evidence of increasing risks for locations impacted by unprecedented storm trajectories (low confidence). Managing the risk from such changing storm trajectories and intensity proves challenging because of the difficulties of early warning and its receptivity by the affected population (high confidence). {6.3, 6.9}

Limiting global warming would reduce the risk of impacts of MHWs, but critical thresholds for some ecosystems (e.g., kelp forests, coral reefs) will be reached at relatively low levels of future global warming (high confidence). Early warning systems, producing skillful forecasts of MHWs, can further help to reduce the vulnerability in the areas of fisheries, tourism and conservation, but are yet unproven at large scale (medium confidence). {6.4}

Sustained long-term monitoring and improved forecasts can be used in managing the risks of extreme El Niño and La Niña events associated with human health, agriculture, fisheries, coral reefs, aquaculture, wildfire, drought and flood management (high confidence). {6.5}

Extreme change in the trade wind system and its impacts on global variability, biogeochemistry, ecosystems and society have not been adequately understood and represent significant knowledge gaps. {6.6}

By 2300, an AMOC collapse is as likely as not for high emission pathways and very unlikely for lower ones, highlighting that an AMOC collapse can be avoided in the long term by CO2 mitigation (medium confidence). Nevertheless, the human impact of these physical changes have not been sufficiently quantified and there are considerable knowledge gaps in adaptation responses to a substantial AMOC weakening. {6.7}

The ratio between risk reduction investment and reduction of damages of extreme events varies. Investing in preparation and prevention against the impacts from extreme events is very likely less than the cost of impacts and recovery (medium confidence). Coupling insurance mechanisms with risk reduction measures can enhance the cost-effectiveness of adapting to climate change (medium confidence). {6.9}

Climate change adaptation and disaster risk reduction require capacity building and an integrated approach to ensure trade-offs between short- and long-term gains in dealing with the uncertainty of increasing extreme events, abrupt changes and cascading impacts at different geographic scales (high confidence). {6.9}

Limiting the risk from the impact of extreme events and abrupt changes leads to successful adaptation to climate change with the presence of well-coordinated climate-affected sectors and disaster management relevant agencies (high confidence). Transformative governance inclusive of successful integration of disaster risk management (DRM) and climate change adaptation, empowerment of vulnerable groups, and accountability of governmental decisions promotes climate-resilient development pathways (high confidence). {6.9}

6.1

Introduction

This chapter assesses extremes and abrupt or irreversible changes in the ocean and cryosphere in a changing climate, to identify regional hot spots, cascading effects, their impacts on human and natural systems, and sustainable and resilient risk management strategies. While not comprehensive in terms of discussing all such phenomena, it addresses a number of issues that are prominent in both the policy area and in the scientific literature. Further information may also be found in Chapters 2 to 4 for other aspects of the ocean and cryosphere.

Building on the Special Report on Managing the Risks of Extreme Events and Disasters to Advance Climate Change Adaptation (SREX; IPCC, 20121), IPCC 5th Assessment Report (AR5; IPCC, 20132; IPCC, 20143) assessments and the Special Report on Global Warming of 1.5 °C (SR15; IPCC, 20184), for each of the topics addressed, we provide an assessment of:

  • Key processes and feedbacks, observations, detection and attribution, projections;
  • Impacts on human and natural systems;
  • Monitoring and early warning systems;
  • Risk management and adaptation, sustainable and resilient pathways.

The chapter is organised in terms of the space- and time-scales of different phenomena. We move from small-scale TCs, which last for days to weeks, to the global-scale AMOC, which has time scales of decades to centuries. A common risk framework is adopted, based on that used in AR5 and introduced in Chapter 1, Section 1.5 and Cross-Chapter Box 1 in Chapter 1 (Figure 6.1). 

Figure 6.1

Figure 6.1 | Framework used in this chapter (see discussion in Chapter 1). Singular or multiple climate drivers can lead to extreme hazards and associated cascading impacts, which combined with non-climatic drivers affect exposure and vulnerability, leading to compound risks. Extremes discussed are tropical cyclones (TCs) and extratropical cyclones (ETCs) and associated sea surface dynamics (Section […]

Figure 6.1 | Framework used in this chapter (see discussion in Chapter 1). Singular or multiple climate drivers can lead to extreme hazards and associated cascading impacts, which combined with non-climatic drivers affect exposure and vulnerability, leading to compound risks. Extremes discussed are tropical cyclones (TCs) and extratropical cyclones (ETCs) and associated sea surface dynamics (Section 6.3); marine heatwaves (MHWs) (Section 6.4), extreme El Niño and La Niña events (Section 6.5); and extreme oceanic decadal variability (Section 6.6). Examples of abrupt events, irreversibility and tipping points discussed are the Atlantic Meridional Overturning Circulation (AMOC) and subpolar gyre (SPG) system (Section 6.7). Section 6.2 also collects examples of such events from the rest of the Special Report on the Oceans and Cryosphere in a Changing Climate (SROCC) and compiles examples of events whose occurrence or severity has been linked to climate change. Cascading impacts and compound events are discussed in Section 6.8 and three examples are given in Box 6.1. Section 6.9 discusses risk management, climate resilience pathways, transformative governance adaptation and mitigation required to address societal and environmental risks.

While much of what is discussed within the chapter concerns the ocean, we also summarise abrupt events in the cryosphere in Section 6.2, drawing information from Chapters 2 to 4, where the main assessment of those phenomena may be found. 

6.1.1

Definitions of Principal Terms

In discussing concepts such as abrupt changes, irreversibility, tipping points and extreme events it is important to define precisely what is meant by those terms. The following definitions are therefore adopted (based on either AR5, Special Report on Global Warming of 1.5°C (SR15) or Special Report on Climate Change and Land (SRCCL) Glossaries):

Abrupt climate change: A large-scale change in the climate system that takes place over a few decades or less, persists (or is anticipated to persist) for at least a few decades, and causes substantial disruptions in human and natural systems.

Extreme weather/climate event: An extreme event is an event that is rare at a particular place and time of year. Definitions of ‘rare’ vary, but an extreme event would normally be as rare as or rarer than the 10th or 90th percentile of a probability density function estimated from observations. By definition, the characteristics of what is called an extreme event may vary from place to place in an absolute sense. When a pattern of extreme weather persists for some time, such as a season, it may be classed as an extreme climate event, especially if it yields an average or total that is itself extreme (e.g., high temperature, drought, or total rainfall over a season).

Irreversibility: A perturbed state of a dynamical system is defined as irreversible on a given timescale, if the recovery timescale from this state due to natural processes is significantly longer than the time it takes for the system to reach this perturbed state. In the context of this report, the recovery time scale of interest is hundreds to thousands of years. 

Tipping point: A level of change in system properties beyond which a system reorganises, often in a nonlinear manner, and does not return to the initial state even if the drivers of the change are abated. For the climate system, the term refers to a critical threshold when global or regional climate changes from one stable state to another stable state. Tipping points are also used when referring to impact; the term can imply that an impact tipping point is (about to be) reached in a natural or human system.

These above four terms generally refer to aspects of the physical climate system. Here we extend their definitions to natural and human systems. For example, there may be gradual physical climate change which causes an irreversible change in an ecosystem. An adaptation tipping point could be reached when an adaptation option no longer remains effective. There may be a tipping point within a governance structure. 

We also introduce two new key terms relevant for discussing risk-related concepts:

Compound events refer to the combination of multiple drivers and/or hazards that contribute to societal or environmental risks.

Cascading impacts from extreme weather/climate events occur when an extreme hazard generates a sequence of secondary events in natural and human systems that result in physical, natural, social or economic disruption, whereby the resulting impact is significantly larger than the initial impact. Cascading impacts are complex and multi-dimensional, and are associated more with the magnitude of vulnerability than with that of the hazard. 

6.2

Climate Change influences on Abrupt Changes, Irreversibility, Tipping Points and Extreme Events

6.2.1

Introduction

Some potentially abrupt or irreversible events are assessed in other chapters, hence Table 6.1 presents a cross-chapter summary of those. Subsection numbers indicate where detailed information may be found.

Table 6.1

Cross-Chapter assessment of abrupt and irreversible phenomena related to the ocean and cryosphere. The column on the far right of the table indicates the likelihood of an abrupt/irreversible change based on the assessed literature which, in general, assesses Representative Concentration Pathway (RCP) scenarios. Assessments of likelihood and confidence are made according to IPCC guidance on uncertainties.


Change in system component Potentially abrupt Irreversibility if forcing reversed (time scales indicated) Impacts on natural and human systems; global vs. regional vs. local Projected likelihood and/or confidence level in 21st century under scenarios considered
Ocean
Atlantic Meridional Overturning Circulation (AMOC) collapse (Section 6.7) Yes Unknown Widespread; increased winter storms in Europe, reduced Sahelian rainfall and agricultural capacity, variations in tropical storms, increased sea levels on Atlantic coasts Very unlikely, but physically plausible 
Subpolar gyre (SPG) cooling (Section 6.7) Yes Irreversible within decades Similar to AMOC impacts but considerably smaller. Medium confidence
Marine heatwave (MHW) increase (Section 6.4) Yes Reversible within decades to centuries Coral bleaching, loss of biodiversity and ecosystem services, harmful algal blooms, species redistribution Very likely (very high confidence) for physical changes. High confidence for impacts
Arctic sea ice retreat (Section 3.3) Yes Reversible within decades to centuries Coastal erosion in Arctic (may take longer to reverse), impact on mid-latitude storms (low confidence); rise in Arctic surface temperatures (high confidence) High confidence
Ocean deoxygenation and hypoxic events (Section 5.2) Yes Reversible at surface, but irreversible for centuries to millennia at depth Major changes in ocean productivity, biodiversity and biogeochemical cycles Medium confidence 
Ocean acidification (Section 5.2) Yes Reversible at surface, but irreversible for centuries to millennia at depth Changes in growth, development, calcification, survival and abundance of species, for example, from algae to fish Virtually certain (very high confidence)
Cryosphere
Methane release from permafrost (Section 3.4) Yes Reversible due to short lifetime of methane in the atmosphere Further increased global temperatures through climate feedback Medium confidence
CO2 release from permafrost (Section 3.4) Yes Irreversible for millennia due to long lifetime of CO2 in the atmosphere Further increased global temperatures through climate feedback Low confidence
Partial West Antarctic Ice Sheet (WAIS) collapse (Cross Chapter Box 2 in Chapter 1, Section 4.2) Yes (late 21st century, under RCP8.5 only) Irreversible for decades to millennia Significant contribution to sea level rise (SLR) and local decrease in ocean salinity Low confidence
Greenland Ice sheet (GIS) decay (Cross Chapter Box 8, Section 4.2) No Irreversible for millennia Significant contribution to SLR, shipping (icebergs) High confidence for decay contributing 10s of cm of SLR
Ice-shelf collapses (Cross Chapter Box 8, Sections 3.3, 4.2} Yes Possibly irreversible for centuries May lead to SLR from contributing glaciers. Some shelves more prone than others. Low confidence
Glacier avalanches, surges, and collapses (Section 2.3) Yes Variable Local hazard; may accelerate SLR; local iceberg production; local ecosystems  Medium confidence for occurrence; Low confidence for increase in frequency/magnitude
Strong shrinkage or disappearance of individual glaciers (Sections 2.2, 3.3) Yes Reversible within decades to centuries Regional impact on water resources, tourism, ecosystems and global sea level Medium confidence
Landslides related to glaciers and permafrost, glacier lake outbursts (Section 2.3) Yes Irreversible for rock slopes; reversible within decades to centuries for glaciers, debris and lakes Local direct impact on humans, land use, infrastructure (hazard), and ecosystems  Medium confidence for increase in frequency
Change in biodiversity in high mountain areas (impact – Section 2.4) Yes In many cases irreversible (e.g., extinction of species) Local impacts on ecosystems and ecosystem services Medium confidence


6.2.2

Recent Anomalous Extreme Climate Events and their Causes

The attribution of changes in the observed statistics of extremes are generally addressed using well-established detection-attribution methods. In contrast, record-breaking weather and climate events are by definition unique, and can be expected to occur with or without climate change as the observed record lengthens. Therefore, event attribution begins with the premise that the climate is changing, the goal being to determine statistically how much climate change has contributed to the severity of the event (Trenberth et al., 20155; Shepherd, 20166). Annual reports dedicated to extreme event attribution (Peterson et al., 20127; Peterson et al., 20138; Herring et al., 20149; Herring et al., 201510; Herring et al., 201811) have helped stimulate studies that adopt recognised methods for extreme event attribution. The increasing pool of studies allows different approaches to be contrasted and builds consensus on the role of climate change when individual climate events are studied by multiple teams using different methods. A number of these events are summarised in Table 6.2 and Figure 6.2. Collectively, these studies show that the role of climate change in the ocean and cryosphere extreme events is increasingly driving extreme climate and weather events across the globe including compound events (high confidence). Some regions including Africa and the Pacific have had relatively fewer event attribution studies undertaken, possibly reflecting the lack of capacity by regional and national technical institutions. A caveat of this approach is that there is a potential for ‘null results’, that is, cases where attribution is not possible, to be reported. Nevertheless, there is no evidence that this is the case, and the number of recent studies and wide range of phenomena addressed suggests increasing influence of climate change on extreme events.

Figure 6.2

Figure 6.2 | Locations where extreme events with an identified link to ocean changes have been discussed in Table 6.2.

Figure 6.2 | Locations where extreme events with an identified link to ocean changes have been discussed in Table 6.2.

Table 6.2

A selection of extreme events with links to oceans and cryosphere. In many of these studies the method of event attribution has been used to estimate the role of climate change using either a probabilistic approach (using ensembles of climate models to assess how much more likely the event has become with anthropogenic climate change compared to a world without) or a storyline approach which examines the components of the climate system that contribute to the events and how changes in the climate system affect them (Shepherd, 201612).

Year/type of hazard Region Severe hazard Attribution to anthropogenic climate change Impact, costs
1998

Western equatorial Pacific, Great Barrier Reef, Australia Extreme sea surface temperatures (SSTs) Unknown if global warming has increased the probability. Coral bleaching
2003 Mediterranean Sea June to August with sea water temperatures 1°C–3°C above climatological mean (Olita et al., 200713; Garrabou et al., 200914; Galli et al., 201715) Increase in air temperature and a reduction of wind stress and air-sea exchanges (Olita et al., 200716). Unknown if global warming has increased the probability Mass mortality of macro-invertebrate species; amplified heatwave over central Europe in 2003
2004 South Atlantic First hurricane in the South Atlantic since 1970 Increasing trend to positive Southern Annular Mode (SAM) could favour the synoptic conditions for such events in the future (Pezza and Simmonds, 200517) Three deaths, 425 million USD damage (McTaggart-Cowan et al., 200620)
2005 North Atlantic Record number of tropical storms, hurricanes and Category 5 hurricanes since 1970 Trend in SST due to global warming contributed to half of the total SST anomaly. Atlantic Multidecadal Variability (AMV) and the after-effects of the 2004–2005 El Niño also played a role (Trenberth and Shea, 200618) Costliest US natural disaster; 1,836 deaths and 30 billion USD in direct economic costs in Louisiana due to Hurricane Katrina (Link, 201021)
2007 Arabian Sea Strongest tropical cyclone (TC) (Gonu) attaining sustained winds of 270 kph and gustiness of 315 kph No attribution study done, although it was noted that this Category 5 TC had followed an unusual path

(Dibajnia et al., 201019)

Caused around 4 billion USD in damages (Fritz et al., 201022; Coles et al., 201523)
2008 Western Pacific Islands North Pacific generated wave-swell event Event shown to have been made more extreme compared to other historical events due to La Niña and SLR (Hoeke et al., 201324) Wave-induced inundation in islands of six Pacific nations (Kiribati, Marshall Islands, Micronesia, Nauru, Papua New Guinea, Solomon Islands), salt water flooding of food and water supplies in Kosrae, Micronesia, 1,408 houses damaged and 63,000 people affected across eight provinces in Papua New Guinea (Hoeke et al., 201325)
2010 Western equatorial Pacific, Great Barrier Reef, Australia Extreme SST Unknown if global warming increased the probability Coral bleaching
2010 Southern Amazon Widespread drought in the Amazon led to lowest river levels of major Amazon tributaries on record (Marengo et al., 201126) Model-based attribution indicates human influences and SST natural variability increased probabilities of the 2010 severe drought in the South Amazon region whereas aerosol emissions had little effect (Shiogama et al., 201327) Relative to the long-term mean, the 2010 drought resulted in a reduction in biomass carbon uptake of 1.1 Pg C, compared to 1.6 Pg C for the 2005 event which was driven by an increase in biomass mortality (Feldpausch et al., 201628)
2010–2011 Eastern Australia Wettest spring since 1900 (Leonard et al., 201429) Based on La Niña SSTs during satellite era, La Niña alone is insufficient to explain total rainfall. 25% of rainfall was attributed to SST trend in region (Evans and Boyer-Souchet, 201230) Brisbane river catchment flooding in January 2011, costing 23 lives and an estimated 2.55 billion USD (van den Honert and McAneney, 201131)
2010–2011 UK Severely cold winter (coldest December since 1910 and second coldest since 1659) Model results indicate that human influence reduced the odds by at least 20% and possibly by as much as 4 times with a best estimate that the odds have been halved (Christidis and Stott, 201232) Many adverse consequences of the extreme temperatures, including closed schools and airports (Christidis and Stott, 201233)
2011 Western North Pacific Tropical Storm Washi (also known as TS Sendong) was world’s deadliest storm in 2011 No attribution done; disaster was the outcome of interplay of climatic, environmental and social factors (Espinueva et al., 201234) Fatalities: >1,250; injured: 2,002; missing: 1,049 (Rasquinho et al., 201335).

Socioeconomic costs: 63.3 million USD (Espinueva et al., 201236)

2011 Western Australia Most extreme warming event in the region in the last 140 years during which sea temperature anomalies of 2°C–4°C persisted for more than 10 weeks along >2,000 km of coastline.

from Ningaloo (22°S) to Cape Leeuwin (34°S); up to 5°C warmer SSTs than normal (Feng et al., 201343; Pearce and Feng, 201338; Benthuysen et al., 201439; Caputi et al., 201640; Perkins-Kirkpatrick et al., 201641)

Warming of poleward-flowing Leeuwin Current in Austral summer forced by oceanic and atmospheric teleconnections associated with the 2010–2011 La Niña (Feng et al., 201337). Conditions increased since 1970’s by negative Interdecadal Pacific Oscillation (IPO) and anthropogenic global warming (Feng et al., 201542). Shift of temperate marine ecosystem was climate-driven Widespread coral bleaching and fish kills.

Biodiversity patterns of temperate seaweeds, sessile invertebrates and demersal fish were altered leading to reduced abundance of habitat-forming seaweeds

(Wernberg et al., 201344)

2011 Golden Bay, New Zealand In December, Extreme two day

total rainfall was experienced (one in 500-year event)

Model based attribution indicated total moisture available for precipitation in Golden Bay, New Zealand was 1–5% higher due to anthropogenic emissions (Dean et al., 201345) In town of Takaka, 453 mm was recorded in 24 hours and 674 mm in 48 hours (Dean et al. 201346)
2012 Arctic Arctic sea ice minimum Model-based attribution indicated the exceptional 2012 sea ice loss was due to sea ice memory and positive feedback of warm atmospheric conditions, both contributing approximately equally (Guemas et al., 201347) and extremely unlikely to have occurred due to internal climate variability alone based on observations and model-based attribution (Zhang and Knutson, 201348) Up to 60% higher contribution of sea ice algae in the central Arctic (Fernández-Méndez et al., 201549; see also chapter 3.2.3)
2012 US East coast Hurricane Sandy Relative SLR shown to have increased probabilities of exceeding peak impact elevations since the mid-20th century (Sweet et al., 201350; Lackmann, 201551) Repair and mitigation expenditures funded at 60.2 billion USD. Losses of fishing vessels estimated at 52 million USD (Sainsbury et al., 201852)
2012 Northwest Atlantic First half of 2012, record-breaking SSTs (1°C–3°C above normal) from the Gulf of Maine to Cape Hatteras (Mills et al., 201353; Chen et al., 201454; Pershing et al., 201555; Zhou et al., 201556) Local warming from the atmosphere due to anomalous atmospheric jet stream position (Chen et al., 201457) . Unknown if global warming increased the probability Northward movement of warm water species and local migrations of lobsters earlier in the season (Mills et al., 201358; Pershing et al., 201558)
2013 UK Extreme winter rainfall Some evidence for a human-induced increase in extreme winter rainfall in the UK for events with time scales of 10 days (Christidis and Stott, 201560) Tidal surges,

widespread floodplain

inundation, and pronounced river flows leading to damages in transport infrastructure, business and residential properties and a cost of 560 million GBP in recovery schemes (Department for Communities and Local Government, 201461; Huntingford et al., 201462). Unprecedented deaths of over 4,400 Puffins found on UK and Scottish coasts linked to cold and strong winds during this event (Harris and Elkins, 201363)

2013 Western North Pacific Strongest and fastest Super Typhoon Haiyan (Category 5) in the region Occurred in a season with remarkably warm SSTs, (David et al., 201364; Takagi and Esteban, 201665). Ocean heat content and sea levels had increased since 1998 due to the negative Pacific Decadal Oscillation (PDO) phase but impacts were worsened by thermodynamic effects on SSTs, SLR and storm surges due to climate change (Trenberth et al., 201566) Deadliest and most expensive natural disaster in the Philippines (Fatalities: 6,245; Injured: 28,626; Missing: 1,039). Damage to mangroves was still apparent 18 months after the storm (Sainsbury et al., 201867)
2013–2015 Northeast Pacific Ocean Largest heatwave ever recorded (often called ‘The Blob’; Bond et al. 2015), with maximum SST anomalies of 6°C off Southern California (Jacox et al., 201669; Gentemann et al., 201770; Rudnick et al., 201771) and subsurface warm anomalies in the deep British Columbia Fjord that persisted through the beginning of 2018 (Jackson and Wood, 201872) Emerged in 2013 in response to teleconnections between North Pacific and the weak El Niño that drove strong positive sea level pressure anomalies across the northeast Pacific inducing smaller heat loss (Bond et al., 201573; Di Lorenzo and Mantua, 2016). Global warming increased the probability of occurrence for regional parts of the MHW (Weller et al., 201574; Jacox et al., 201875; Newman et al., 201876) Major impacts on entire marine food web. Caused a major outbreak of a toxic algal bloom along the US West Coast leading to impacts on fisheries (McCabe et al., 201677) . Increased mortality of sea birds (Jones et al., 201878). Contributed to drought conditions across the US West Coast
2014 Hawaiian hurricane season Extremely active hurricane season in the eastern and central Pacific Ocean, particularly around Hawaii Anthropogenic forcing could have contributed to the unusually large number of hurricanes in Hawaii in 2015, in combination with the moderately favourable El Niño event conditions (Murakami et al., 201579) Acute disturbance of coral along Wai‘ōpae coastline (southeastern tip of Hawai‘i Island) due to passages of Hurricanes Iselle, Julio and Ana that caused high waves, increased runoff and elevated SSTs associated with the 2014–2015 El Niño (Burns et al., 201680).
2014 Arabian Sea Cyclone Nilofar was the first severe TC to be recorded in the Arabian Sea in post-monsoon cyclone season (Murakami et al., 201781) Anthropogenic global warming has been shown to have increased the probability of post-monsoon TCs over the Arabian Sea (Murakami et al., 201782) Cyclone did not make landfall but produced heavy rainfall on western Indian coasts (Bhutto et al., 201783)
2014 Northland New Zealand Extreme five day rainfall in Northland Extreme five day rainfall over Northland, New Zealand was influenced by human-induced climate change (Rosier et al., 201584) 18.8 million NZD in insurance claims (Rosier et al., 201585)
2014–2017 Western equatorial Pacific, Great Barrier Reef, Australia Extreme SSTs Global warming increased probability of occurrence for regional parts of the MHW (Weller et al., 201865; Oliver et al., 2018b87) Anthropogenic greenhouse gas (GHG) emission increased the risk of coral bleaching through anomalously high SSTs and accumulation of heat stress (Lewis and Mallela, 201888)
2015 North America Anomalously low temperatures with intense snowstorms Reduced Arctic sea ice and anomalous SSTs may have contributed to establishing and sustaining the anomalous meander of the jet stream, and could enhance the probability of such extreme cold spells over North America (Bellprat et al., 201689) Several intense snowstorms resulting in power outages and large economic losses (Munich RE, 201690)
2015 Arctic Record low Northern Hemisphere (NH) sea ice extent in March 2015 Record low in NH sea ice maximum could not have been reached without human-induced change in climate, with the surface atmospheric conditions, on average, contributing 54% to the change (Fuckar et al., 201691) March NH sea ice content reached the lowest winter maximum in 2015. Emerging evidence of increased snow fall over regions outside the Arctic (see 3.4.1.1) due to sea ice reduction as well as changes in the timing, duration and intensity of primary production, which affect secondary production (3.2.3.1)
2015 Florida Sixth largest flood in Virginia Key, Florida since 1994, with the fifth highest in response to hurricanes The probability of a 0.57 m flood has increased by 500% (Sweet et al., 201692) Flooding in several Miami-region communities with 0.57 m of ocean water on a sunny day
2015–/2016 Ethiopia and Southern Africa One of the worst droughts in 50 years, also intensified flash droughts characterised by severe heatwaves Anthropogenic warming contributed substantially to the very warm 2015–2016 El Niño SSTs, land local air temperatures thereby reducing Northern Ethiopia and Southern Africa rainfall and runoff (Funk et al., 201893; Yuan et al., 201894) A 9 million tonne cereal deficit resulted in more than 28 million people in need of humanitarian aid (Funk et al. 201895)
2015 Eastern North Pacific TC Patricia, the most intense and rapidly intensifying storm in the Western Hemisphere (estimated mean sea level (MSL) pressure of 872 hPa (Rogers et al., 201796), intensified rapidly into a Category 5 TC (Diamond and Schreck, 201697) A near-record El Niño combined with a positive Pacific Meridional Mode provided extreme record SSTs and low vertical wind shear that fuelled the 2015 eastern North Pacific hurricane season to near-record levels (Collins et al., 201698) Approximately 9,000 homes and agricultural croplands, including banana crops, were damaged by wind and rain from Patricia that made landfall near Jalisco, Mexico (Diamond and Schreck, 201699)
2015 Arabian Sea, Somalia and Yemen Cyclones Chapala and Megh occurred within a week of each other and both tracked westward across Socotra Island and Yemen. Rainfall from Chapala was seven times the annual average Anthropogenic global warming has been shown to have increased the probability of post-monsoon TCs over the Arabian Sea (Murakami et al., 2017100) Death toll in Yemen from Chapala and Megh was 8 and 20 respectively. Thousands of houses and businesses damaged or destroyed by both cyclones and fishing disrupted. The coastal town of Al Mukalla experienced a 10 m storm surge that destroyed the seafront (Kruk, 2016101). Flooding in Somalia led to thousands of livestock killed and damage to infrastructure (IFRC, 2016)
2015–2016 Northern Australia (Gulf of Carpentaria) High temperatures, low rainfall, extended drought period and low sea levels Attributed to anomalously high temperatures and low rainfall and low sea levels associated with El Niño (Duke et al., 2017103) 1,000 km of mangrove tidal wetland dieback (>74,000 ha). with potential flow-on consequences to Gulf of Carpentaria fishing industry worth 30 million AUS yr-1 due to loss of recruitment habitat
2015–2016 Tasman Sea MHW lasted for 251 days with maximum SSTs of 2.9°C above the 1982–2005 average (Oliver et al., 2017104) Enhanced southward transport in the East Australian current driven by increased wind stress (Oliver et al., 2017105). The intensity and duration of the MHW were unprecedented and both had a clear human signature (Oliver et al., 2017106) Disease outbreaks in farmed shellfish, mortality in wild shellfish and species found further south than previously recorded. Drought followed by severe rainfall caused severe bushfires and flooding in northeast Tasmania (see Box 6.1).
2016 Arctic Record high air temperatures and record low sea ice were observed in the Arctic winter/spring of 2016 (Petty et al., 2017107) Would not have been possible without anthropogenic forcing (Kam et al., 2018108), however the relative role of preconditioning, seasonal atmospheric/ocean forcing and storm activity in determining the evolution of the Arctic sea ice cover is still highly uncertain (Petty et al., 2018109) Impacts on Arctic ecosystems (e.g., Post et al., 2013; Meier et al., 2014), potential changes to mid-latitude weather (e.g., Cohen et al., 2014; Francis and Skific, 2015111; Screen et al., 2015112) and human activities in the Arctic
2016 Bering Sea/Gulf of Alaska, Record-setting warming with peak SSTs of 6°C above the 1981–2010 climatology (Walsh et al., 2017113; Walsh et al., 2018114) Nearly fully attributed to human-induced climate change (Oliver et al., 2018b115; Walsh et al., 2018116) Impacts on marine ecosystems in Alaska, included favouring some phytoplankton species, but resulted in one of the largest harmful algal blooms on record which reached the Alaska coast in 2015 (Peterson et al., 2017117), uncommon paralytic shellfish poisoning events in Kachemak Bay and oyster farm closures in 2015 and 2016, dramatic mortality events in seabird species such as common murres in 2015–2016 (Walsh et al., 2018118)
2016 East China Sea MHW Warming predominantly attributable to combined effects of oceanic advection

(-0.18°C, 24%) and net heat flux (-0.44°C, 58%; Tan and Cai, 2018)

Impacts on marine organisms (Kim and Han, 2017120)’
2016 Eastern China Super cold surge This cold surge would have been stronger if there was no anthropogenic warming (Qian et al., 2018121; Sun and Miao, 2018122) Extreme weather brought by the cold surge caused significant impacts on >1 billion people in China in terms of transportation and electricity transmission systems, agriculture and human health (Qian et al. 2018123)
2016 Antarctic Antarctic sea ice extent decreased at a record rate 46% faster than the mean rate and 18% faster than any spring rate in the satellite era producing a record minimum for the satellite period (1979–2016) (Turner et al., 2017124) Largely attributable to thermodynamic surface forcing (53%), while wind stress and the sea ice and oceanic conditions from the previous summer (January 2016) explain the remaining 34% and 13%, respectively (Kusahara et al., 2018125) linked with a shift to positive phase of PDO and negative SAM in late 2016 (Meehl et al., 2019126; see also 3.2.1.1) Potential impacts on ecosystems and fisheries are poorly known (chapter 3.6)
2017 Yellow Sea/East China Sea SSTs 2°C–7°C higher than normal (Kim and Han, 2017127; Tan and Cai, 2018128) Unknown if global warming has increased the probability Impacts on marine organisms
2017 Western North Atlantic Hurricanes Harvey, Irma and Maria Rainfall intensity in Harvey attributed to climate change and winds for Irma and Maria attributed to climate change. (Emanuel, 2017129; Risser and Wehner, 2017130; van Oldenborgh et al., 2017131; see Box 6.1) Extensive impacts (see Box 6.1)
2017 Europe Storm Ophelia In agreement with projections of increase of cyclones of tropical origin hitting European coasts (Haarsma et al., 2013132) Largest ever recorded hurricane in East Atlantic; extreme winds and coastal erosion in Ireland
2017 Persian Gulf Severe warming in the Gulf with reef bottom temperatures resulting in 5.5°C-weeks of thermal stress as degree heating weeks

(Burt et al., 2019134)

Mortality of corals shown to have been caused by increases in sea-bottom temperatures (Burt et al., 2019133) 94.3% of corals bleached in the Gulf
2017 East Africa Drought (across Tanzania, Ethiopia, Kenya and Somalia) Extremely warm ‘Western V’ (stretching poleward and eastward from a point near the Maritime Continent) SST doubled the probability of drought (Funk et al., 2018135) Contributed to extreme food insecurity (Funk et al., 2018136) approaching near-famine conditions (FEWS NET and FSNAU, 2017137; WFP et al., 2017138)
2017 Peru Extremely wet rainy season Human influence is estimated to make such events at least 1.5 times more likely (Christidis et al., 2018a139) Widespread flooding and landslides 1.7 million people, a death toll of 177 and an estimated damages of 3.1 billion USD (Christidis et al., 2018a140)
2017 Bangladesh Pre-monsoon extreme six day rainfall event The likelihood of this 2017 pre-monsoon extreme rainfall is nearly doubled by anthropogenic climate change; although this contribution is sensitive to the climatological period used (Rimi et al., 2018141) Triggered flash floods affecting 850,000 households and 220,000 hectares of harvestable crops leading to a 30% rice price hike (FAO, 2017)
2017 Uruguay, South America April-May heavy precipitation The risk of the extreme rainfall in the Uruguay River increased two-fold by anthropogenic climate change Triggered wide-spread overbank flooding along the Uruguay River causing economic loss of 102 million USD (FAMURS, 2017142) and displacement of 3,500 people (de Abreu et al., 2019)
2017 Northeast China Persistent summer-spring hot and dry extremes Risk of persistent spring-summer hot and dry extremes is increased by 5–55% and 37–113%, respectively, by anthropogenic climate change (Wang et al., 2018143) Affected more than 7.4 million km² of crops and herbage and direct economic loss of about 10 billion USD (Zhang et al., 2017c144)
2017 Coastal Peru Strong shallow ocean warming of up to 10°C off the northern coast of Peru Unknown if global warming increased the probability Caused heavy rainfall and flooding (ENFEN, 2017145; Garreaud, 2018146). Affected anchovies (decreased fat content and early spawning as a reproductive strategy; IMPARPE, 2017147)
2017 Southwestern Atlantic SSTs were 1.7°C higher than previous maximum from February to March 2017 between 32°S–38°S (Manta et al., 2018148) High air temperature and low wind speed led to MHW. Unknown if global warming increased the probability Fish species mass mortalities
6.3

Changes in Tracks, Intensity, and Frequency of Tropical and Extratropical Cyclones and Associated Sea Surface Dynamics

This section addresses new literature on TCs and ETCs and their effects on the ocean in the context of understanding how the changing nature of extreme events can cause compound hazards, risk and cascading impacts (discussed in Section 6.8). These topics are also discussed in Chapter 4 in the context of changes to ESLs (see Section 4.2.3.4).

6.3.1

Changes in Storms and Associated Sea Surface Dynamics

6.3.1.1

Tropical Cyclones

IPCC AR5 concluded that there was low confidence in any long-term increases in TC activity globally and in attribution of global changes to any particular cause (Bindoff et al., 2013149; Hartmann et al., 2013150). Based on process understanding and agreement in 21st century projections, it is likely that the global TC frequency will either decrease or remain essentially unchanged, while global mean TC maximum wind speed and precipitation rates will likely increase although there is low confidence in region-specific projections of frequency and intensity (Christensen et al., 2013151). The AR5 concluded that circulation features have moved poleward since the 1970s, associated with a widening of the tropical belt, a poleward shift of storm tracks and jet streams, and contractions of the northern polar vortex and the Southern Ocean westerly wind belts. However it is noted that natural modes of variability on interannual to decadal time scales prevent the detection of a clear climate change signal (Hartmann et al., 2013152). 

Since the AR5 and Knutson et al. (2010), palaeoclimatic surveys of coastal overwash sediments and stalagmites have provided further evidence of historical TC variability over the past several millennia. Patterns of storm activity across TC basins show variations through time that appear to be correlated with El Niño-Southern Oscillation (ENSO), North Atlantic Oscillation (NAO), and changes in atmospheric dynamics related to changes in precession of the sun (Toomey et al., 2013153; Denommee et al., 2014154; Denniston et al., 2015155). 

Further studies have investigated the dynamics of TCs. A modelling study investigated a series of low-frequency increases and decreases in TC activity over the North Atlantic over the 20th century (Dunstone et al., 2013156). These variations, culminating in a recent rise in activity, are thought to be due in part to atmospheric aerosol forcing variations (aerosol forcing), which exerts a cooling effect (Booth et al., 2012157; Dunstone et al., 2013158). However, the relative importance of internal variability vs. radiative forcing for multidecadal variability in the Atlantic basin, including TC variability, remains uncertain (Weinkle et al., 2012159; Zhang et al., 2013160; Vecchi et al., 2017161; Yan et al., 2017162). Although the aerosol cooling effect has largely cancelled the increases in potential intensity over the observational period, according to Coupled Model Intercomparison Project Phase 5 (CMIP5) model historical runs, further anthropogenic warming in the future is expected to dominate the aerosol cooling effect leading to increasing TC intensities (Sobel et al., 2016163).

TCs amplify wave heights along the tracks of rapidly moving cyclones (e.g., Moon et al., 2015a) and can therefore increase mixing to the surface of cooler subsurface water. Several studies found that TCs reduce the projected thermal stratification of the upper ocean in CMIP5 models under global warming, thereby slightly offsetting the simulated TC-intensity increases under climate warming conditions (Emanuel, 2015164; Huang et al., 2015b165; Tuleya et al., 2016166). On the other hand, freshening of the upper ocean by TC rainfall enhances density stratification by reducing near-surface salinity and this reduces the ability of TCs to cool the upper ocean, thereby having an influence opposite to the thermal stratification effect (Balaguru et al., 2015). In the late 21st century, increased salinity stratification was found to offset about 50% of the suppressive effects that TC mixing has on temperature stratification (Balaguru et al., 2015167). Coupled ocean-atmosphere models still robustly project an increase of TC intensity with climate warming, and particularly for new TC-permitting coupled climate model simulations that compute internally consistent estimates of thermal stratification change (e.g., Kim et al., 2014a; Bhatia et al., 2018169). Higher TC intensities in turn may further aggravate the impacts of SLR on TC-related coastal inundation extremes (Timmermans et al., 2017170). 

Kossin et al. (2014)171 identified a poleward expansion of the latitudes of maximum TC intensity in recent decades, which has been linked to an anthropogenically-forced tropical expansion (Sharmila and Walsh, 2018172) and a continued poleward shift of cyclones projected over the western North Pacific in a warmer climate (Kossin et al., 2016173). A 10% slowdown in translation speed of TCs over the 1949–2016 period has been linked to the weakening of the tropical summertime circulation associated with tropical expansion and a more pronounced slowdown in the range 16–22% was found over land areas affected by TCs in the western North Pacific, North Atlantic and Australian regions (Kossin, 2018174). Slow-moving TCs together with higher moisture carrying capacity can cause significantly greater flood hazards (Emanuel, 2017175; Risser and Wehner, 2017176; van Oldenborgh et al., 2017177; see also Table 6.2 and Box 6.1).

Trends in TCs over decades to a century or more have been investigated in several new studies. Key findings include: i) decreasing frequency of severe TCs that make landfall in eastern Australia since the late 1800s (Callaghan and Power, 2011178); ii) increase in frequency of moderately large US storm surge events since 1923 (Grinsted et al., 2012179); iii) recent increase of extremely severe cyclonic storms over the Arabian Sea in the post-monsoon season (Murakami et al., 2017180); iv) intense TCs that make landfall in East and Southeast Asia in recent decades (Mei and Xie, 2016181; Li et al., 2017182); and v) an increase in annual global proportion of hurricanes reaching Category 4 or 5 intensity in recent decades (Holland and Bruyère, 2014183).

Rapid intensification of tropical cyclones (RITCs) poses forecast challenges and increased risks for coastal communities (Emanuel, 2017184). Warming of the upper ocean in the central and eastern tropical Atlantic associated with the positive phase of the Atlantic Multidecadal Oscillation (AMO) (Balaguru et al., 2018185) and in the western North Pacific in recent decades due to a La Niña-like pattern (Zhao et al., 2018186) has favoured RITCs in these regions. One new modelling study suggests there has been a detectable increase in RITC occurrence in the Atlantic basin in recent decades, with a positive contribution from anthropogenic forcing (Bhatia et al., 2019187). Nonetheless, the background conditions that favour RITCs across the Atlantic basin as a whole tend to be associated with less favourable conditions for TC occurrence along the US east coast (Kossin, 2017188). 

New studies have used event attribution to explore attribution of certain individual TC events or anomalous seasonal cyclone activity events to anthropogenic forcing (Lackmann, 2015189; Murakami et al., 2015190; Takayabu et al., 2015191; Zhang et al., 2016192; Emanuel, 2017193; see also Table 6.2 and Box 6.1). Risser and Wehner (2017) and van Oldenborgh et al. (2017) concluded that for the Hurricane Harvey event, there is a detectable human influence on extreme precipitation in the Houston area, although their detection analysis is for extreme precipitation in general and not specifically for TC-related precipitation. 

There have been more TC dynamical or statistical/dynamical downscaling studies and higher resolution General Circulation Model (GCM) experiments (e.g., Emanuel, 2013; Manganello et al., 2014196; Knutson et al., 2015197; Murakami et al., 2015198; Roberts et al., 2015199; Wehner et al., 2015200; Yamada et al., 2017201). The findings of these studies generally support the AR5 projections of a general increase in intensity of the most intense TCs and a decline in TC frequency overall. However, the projected increase in global TC frequency by Emanuel (2013)202 and Bhatia et al. (2018)203 differed from most other TC frequency projections and previous assessments. For studies into future track changes of TCs under climate warming scenarios (Li et al., 2010204; Kim and Cai, 2014205; Manganello et al., 2014206; Knutson et al., 2015207; Murakami et al., 2015208; Roberts et al., 2015209; Wehner et al., 2015210; Nakamura et al., 2017211; Park et al., 2017212; Sugi et al., 2017213; Yamada et al., 2017214; Yoshida et al., 2017215; Zhang et al., 2017a216), it is difficult to identify a robust consensus of projected change in TC tracks, although several of the studies found either poleward or eastward expansion of TC occurrence over the North Pacific region resulting in greater storm occurrence in the central North Pacific. There have been new studies on storm size (Kim et al., 2014a217; Knutson et al., 2015218; Yamada et al., 2017219) under climate warming scenarios. These project TC size changes of up to ±10% between basins and studies and provide preliminary findings on this issue that future studies will continue to investigate. Several studies of TC storm surge (e.g., Lin et al., 2012; Garner et al., 2017220) suggest that SLR will dominate the increased height of storm surge due to TCs under climate change. 

Taking the above into account, the following is a summary assessment of TC detection and attribution. The observed poleward migration of the latitude of maximum TC intensity in the western North Pacific appears to be unusual compared to expected natural variability and therefore there is low to medium confidence that this change represents a detectable climate change, though with only low confidence that the observed shift has a discernible positive contribution from anthropogenic forcing. Anthropogenic forcing is believed to be producing some poleward expansion of the tropical circulation with climate warming. Additional studies of observed long-term TC changes such as: an increase in annual global proportion of Category 4 or 5 TCs in recent decades, severe TCs occurring in the Arabian Sea and making landfall in East and Southeast Asia, the increasing frequency of moderately large US storm surge events since 1923 and the decreasing frequency of severe TCs that make landfall in eastern Australia since the late 1800s, may each represent emerging anthropogenic signals, but still with low confidence (limited evidence). The lack of confident climate change detection for most TC metrics continues to limit confidence in both future projections and in the attribution of past changes and TC events, since TC event attribution in most published studies is generally being inferred without support from a confident climate change detection of a long-term trend in TC activity. 

TCs projections for the late 21st century are summarised as follows: 1) there is medium confidence that the proportion of TCs that reach Category 4–5 levels will increase, that the average intensity of TCs will increase (by roughly 1–10%, assuming a 2°C global temperature rise), and that average TCs precipitation rates (for a given storm) will increase by at least 7% per degree Celsius SST warming, owing to higher atmospheric water vapour content, 2) there is low confidence (low agreement, medium evidence) in how global TC frequency will change, although most modelling studies project some decrease in global TC frequency and 3) SLR will lead to higher storm surge levels for the TCs that do occur, assuming all other factors are unchanged (very high confidence).

6.3.1.2

Extratropical Cyclones and Blocking

ETCs form in the mid-latitudes of the North Atlantic, North Pacific and Southern Oceans, and the Mediterranean Sea. The storm track regions are characterised by large surface equator-to-pole temperature gradients and baroclinic instability, and jet streams influence the direction and speed of movement of ETCs in this region. The thermodynamic response of the atmosphere to CO2 tends to have opposing influences on storm tracks; surface shortwave cloud radiative changes increase the equator-to-pole temperature gradient whereas longwave cloud radiative changes reduce it (Shaw et al., 2016221). AR5 concluded that the global number of ETCs is not expected to decrease by more than a few percent due to anthropogenic change. The Southern Hemisphere (SH) storm track is projected to have a small poleward shift, but the magnitude is model dependent (Christensen et al., 2013). AR5 also found a low confidence in the magnitude of regional storm track changes and the impact of such changes on regional surface climate (Christensen et al., 2013223).

A ‘blocking’ event is an extratropical weather system in which the anticyclone (region of high pressure) becomes quasi-stationary and interrupts the usual westerly flow and/or storm tracks for up to a week or more (Woollings et al., 2018224). Recent attention has focused on whether Arctic warming is linked to increased blocking and mid-latitude weather extremes (Barnes and Screen, 2015225; Francis and Skific, 2015226; Francis and Vavrus, 2015227; Kretschmer et al., 2016228), such as drought in California due to sea ice changes that cause a reorganisation of tropical convection (Cvijanovic et al., 2017229), cold and snowy winters over Europe and North America (Liu et al., 2012230; Cohen et al., 2018231), extreme summer weather (Tang et al., 2013232; Coumou et al., 2014233) and Balkan flooding (Stadtherr et al., 2016234). Studies suggest how blocking may influence arctic sea ice extent (Gong and Luo, 2017235) and various pathways whereby Arctic warming could influence extreme weather (Barnes and Screen, 2015236) such as reducing the equator to pole temperature gradient, slowing the jet stream thereby increasing its meandering behaviour (Röthlisberger et al., 2016237; Mann et al., 2017238) or causing it to split (Coumou et al., 2014239), changing local dynamics in the vicinity of the sea ice edge (Screen and Simmonds, 2013240) or weakening the stratospheric polar vortex (Cohen et al., 2014241). However, sensitivity to choice of methodology (Screen and Simmonds, 2013242) and large internal atmospheric variability masks the detection of such links in past records, and climate change can lead to opposing effects on the mid-latitude jet stream response leading to large uncertainty in future changes (Barnes and Polvani, 2015243; Barnes and Screen, 2015244).

New studies of future storm track behaviour in the NH, include Harvey et al. (2014)245 who find that the future changes to upper and lower tropospheric equator-to-pole temperature differences by the end of the century in a CMIP5 multi-model RCP8.5 ensemble are not well correlated and the lower temperature gradient dominates the summer storm track response whereas both upper and lower temperature gradients play a role in winter. In the northern North Atlantic storm track region, projected changes are found to be more strongly associated with changes in the lower rather than upper tropospheric equator-to-pole temperature difference (Harvey et al., 2015). In the SH, Harvey et al. (2014) find equator-to-pole temperature differences in the upper and lower troposphere in the future climate across a multi-model ensemble are well correlated with a general strengthening of the storm track. The total number of ETCs in a CMIP5 GCM multi-model ensemble decreased in the future climate, whereas the number of strong ETCs increased in most models and in the ensemble mean (Grieger et al., 2014246). This was associated with a general poleward shift related to both tropical upper tropospheric warming and shifting meridional SST gradients in the Southern Ocean. The poleward movement of baroclinic instability and associated storm formation over the observational period due to external radiative forcing, is projected to continue, with associated declining rainfall trends in the mid-latitudes and positive trends further polewards (Frederiksen et al., 2017247).

A number of new studies have found links between Arctic amplification, blocking events and various types of weather extremes in NH mid-latitudes in recent decades. However, the sensitivity of results to analysis technique and the generally short record with respect to internal variability means that at this stage there is low confidence in these connections. Consistent with the AR5, projected changes to NH storm tracks exhibit large differences between responses, causal mechanisms and ocean basins and so there remains low confidence in future changes in blocking and storm tracks in the NH. The storm track projections for the SH remain consistent with previous studies in indicating an observed poleward contraction and a continued strengthening and southward contraction of storm tracks in the future (medium confidence).

6.3.1.3

Waves and Extreme Sea Levels

AR5 also concluded that there is medium confidence that mean significant wave height has increased in the North Atlantic north of 45°N based on ship observations and reanalysis-forced wave model hindcasts. ESL events have increased since 1970, mainly due to a rise in mean sea levels (MSLs) over this period (Rhein et al., 2013248). There is medium confidence that mid-latitude jets will move 1–2 degrees further poleward by the end of the 21st century under RCP8.5 in both hemispheres with weaker shifts in the NH. In the SH during austral summer, the poleward movement of the mid-latitude westerlies under climate change is projected to be partially offset by stratospheric ozone recovery. There is low confidence in projections of NH storm tracks particularly in the North Atlantic. Tropical expansion is likely to continue causing wider tropical regions and poleward movement of the subtropical dry zones (Collins et al., 2013249). In the SH, it is likely that enhanced wind speeds will cause an increase in annual mean significant wave heights. Wave swells generated in the Southern Ocean may also affect wave heights, periods and directions in adjacent ocean basins. The projected reduction in sea ice extent in the Arctic Ocean (Holland et al., 2006250) will increase wave heights and wave season length (Church et al., 2013251).

Since AR5, new studies have shown observed changes in wave climate. Satellite observations from 19852018, showed small increases in significant wave height (+0.3 cm/year) and larger increases in extreme wave heights (90th percentiles), especially in the Southern (+1 cm/year) and North Atlantic (+0.8 cm/year) Oceans (Young and Ribal, 2019252) as well as positive trends in wave height in the Arctic over 1992–2014 due to sea ice loss (Stopa et al., 2016253; Thomson et al., 2016254). Based on a wave reanalysis and satellite observations, Reguero et al. (2019)255 found that the global wave power, which represents the transport of the energy transferred from the wind into the sea surface motion, therefore including wave height, period and direction, has increased globally at a rate of 0.41% yr-1 between 1948 and 2008, with large variations across oceans. Long-term correlations are found between the increase in wave power and SSTs, particularly between the tropical Atlantic temperatures and the wave power in high southern latitudes, the most energetic region globally.

The results of several new global wave climate projection studies are consistent with those presented in IPCC AR5. Mentaschi et al. (2017) find up to a 30% increase in 100-year return level wave energy flux (the rate of transfer of wave energy) for the majority of coastal areas in the southern temperate zone, and a projected decrease in wave energy flux for most NH coastal areas at the end of the century in wave model simulations forced by six CMIP5 RCP8.5 simulations. The most significant long-term trends in extreme wave energy flux are explained by their relationship to modelled climate indices (Arctic Oscillation, ENSO and NAO). Wang et al. (2014b) assessed the climate change signal and uncertainty in a 20-member ensemble of wave height simulations, and found model uncertainty (inter-model variability) is significant globally, being about 10 times as large as the variability between RCP4.5 and RCP8.5 scenarios. In a study focussing on the western north Pacific wave climate, Shimura et al. (2015)256 associate projected regions of future change in wave climate with spatial variation of SSTs in the tropical Pacific Ocean. A review of 91 published global and regional scale wind-wave climate projection studies found a consensus on a projected increase in significant wave height over the Southern Ocean, tropical eastern Pacific (high confidence) and Baltic Sea (medium confidence), and decrease over the North Atlantic and Mediterranean Sea. They found little agreement between studies of projected changes over the Atlantic Ocean, southern Indian and eastern North Pacific Ocean and no regional agreement of projected changes to extreme wave height. It was noted that few studies focussed on wave direction change, which is important for shoreline response (Morim et al., 2018257).

Significant developments have taken place since the AR5 to model storm surges and tides at the global scale. An unstructured global hydrodynamic modelling system has been developed with maximum coastal resolution of 5 km (Verlaan et al., 2015258) and used to develop a global climatology of ESLs due to the combination of storm surge and tide (Muis et al., 2016259). A global modelling study finds that under SLR of 0.5–10 m, changes to astronomical tidal mean high water exceed the imposed SLR by 10% or more at around 10% of coastal cities when coastlines are held fixed. When coastal recession is permitted a reduction in tidal range occurs due to changes in the period of oscillation of the basin under the changed coastline morphology (Pickering et al., 2017260). A recent study on global probabilistic projections of ESLs considering MSL, tides, wind-waves and storm surges shows that under RCP4.5 and RCP8.5, the global average 100-year ESL is very likely to increase by 34–76 cm and 58–172 cm, respectively between 20002100 (Vousdoukas et al., 2018261). Despite the advancements in global tide and surge modelling, using CMIP GCM multi-model ensembles to examine the effects of future weather and circulation changes on storm surges in a globally consistent way is still a challenge because of the low confidence in GCMs being able to represent small scale weather systems such as TCs. To date only a small number of higher resolution GCMs are able to produce credible cyclone climatologies (e.g., Murakami et al., 2012) although this will probably improve with further GCM development and increases to GCM resolution (Walsh et al., 2016262). 

The role of austral winter swell waves on ESL have been investigated in the Gulf of Guinea (Melet et al., 2016263) and the Maldives (Wadey et al., 2017264). Multivariate statistical analysis and probabilistic modelling is used to show that flood risk in the northern Gulf of Mexico is higher than determined from short observational records (Wahl et al., 2016265). In Australia, changes in ESLs were modelled using four CMIP5 RCP8.5 simulations (Colberg et al., 2019266). On the southern mainland coast, the southward movement of the subtropical ridge in the climate models led to small reductions (up to 0.4 m) in the modelled 20-year (5% probability of occurring in a year) storm surge. Over the Gulf of Carpentaria in the north, changes were largest and positive during austral summer in two out of the four models in response to a possible eastward shift in the northwest monsoon. Synthetic cyclone modelling was used to evaluate probabilities, interannual variability and future changes of extreme water levels from tides and TC-induced storm surge (storm tide) along the coastlines of Fiji (McInnes et al., 2014) and Samoa (McInnes et al., 2016268). Higher resolution modelling for Apia, Samoa incorporating waves highlights that although SLR reduces wave setup and wind setup by 10–20%, during storm surges it increases wave energy reaching the shore by up to 200% (Hoeke et al., 2015269).

In the German Bight, Arns et al. (2015) show that under SLR, increases in extreme water levels occur due to a change in phase of tidal propagation; which more than compensates for a reduction in storm surge due to deeper coastal sea levels. Vousdoukas et al. (2017)271 develop ESL projections for Europe that account for changes in waves and storm surge. In 2100, increases of up to 0.35 m relative to the SLR projections occur towards the end of the century under RCP8.5 along the North Sea coasts of northern Germany and Denmark and the Baltic Sea coast, whereas little to negative change is found for the southern European coasts. 

In the USA, Garner et al. (2017) combine downscaled TCs, storm surge models, and probabilistic SLR projections to assess flood hazard associated with changing storm characteristics and SLR in New York City from the pre-industrial era to 2300. Increased storm intensity was found to compensate for offshore shifts in storm tracks leading to minimal change in modelled storm surge heights through 2300. However, projected SLR leads to large increases in future overall flood heights associated with TCs in New York City. Consequently, flood height return periods that were 500y (0.2% probability of occurring in a given year) during the pre-industrial era have fallen to 25y (4% probability of occurring annually) at present and are projected to fall to 5y (20% probability of occurring annually) within the next three decades.

In summary, new studies on observed wave climate change from 1985–2018 showed small increases in significant wave height of +0.3 cm/year and larger increases in 90th percentile wave heights of +1 cm/year in the Southern Ocean and +0.8 cm/year in the North Atlantic ocean (medium confidence). Sea ice loss in the Arctic has also increased wave heights over the period 1992–2014 (medium confidence). Global wave power has increased over the last six decades with differences across oceans related to long-term correlations with SST (low confidence). Future projections indicate an increase of the mean significant wave height across the Southern Ocean and tropical eastern Pacific (high confidence) and Baltic Sea (medium confidence) and decrease over the North Atlantic and Mediterranean Sea under RCP8.5 (high confidence). Extreme waves are projected to increase in the Southern Ocean and decrease in the North Atlantic and Mediterranean Sea under RCP4.5 and RCP8.5 (high confidence). There is still limited knowledge on projected wave period and direction. For coastal ESLs, new studies at the regional to global scale have generally had a greater focus on multiple contributing factors such as waves, tides, storm surges and SLR. At the global scale, probabilistic projections of extreme sea levels considering these factors projects the global average 100- year ESL is very likely to increase by 34–76 cm and 58–172 cm, under RCP4.5 and RCP8.5, respectively between 2000–2100.

6.3.2

Impacts

As shown in previous assessments, increasing exposure is a major driver of increased cyclone risk (wind damages), as well as flood risk associated with cyclone rainfall and surge, besides possible changes in hazard intensities from anthropogenic climate change (Handmer et al., 2012273; Arent et al., 2014274). Changes in TC trajectories are potentially a major source of increased risk, as the degree of vulnerability is typically much higher in locations that were previously not exposed to the hazard (Noy, 2016). Typhoon Haiyan’s move to the south of the usual trajectories of TCs in the western North Pacific basin (Yonson et al., 2018275) made the evacuation more difficult as people were less willing to heed storm surge warnings they received. 

Abrupt changes in impacts therefore are not only determined by changes in cyclone hazard, but also by the sensitivity or tipping points that are crossed in terms of flooding for instance, that can be driven by SLR but also by changes in local exposure. The frequency of nuisance flooding along the US east coast is expected to accelerate further in the future (Sweet and Park, 2014276). The loss of coral reef cover and mangrove forests have also been shown to increase damages from storm surge events (e.g., Beck et al., 2018). Cyclones also affect marine life, habitats and fishing. There is some evidence that fish may evacuate storm areas or be redistributed by storm waves and currents (FAO, 2018; Sainsbury et al., 2018277). Other examples of damage to fisheries from cyclones and storm surges can be found in FAO (2018: Chapter V, Table 1).

With regard to property losses, according to most projections, increasing losses from more intense cyclones are not offset by a possible reduction in frequency (Handmer et al., 2012278). While the relation between aggregate damages and frequency may be linear, the relationship between intensity and damages is most probably highly nonlinear; with research suggesting a 10% increase in wind speed associated with a 30–40% increase in damages (e.g., Strobl, 2012). Although it is clear that direct damages from cyclones could increase, investigations into the economic impact of past cyclone events is less common, as these are much more difficult to identify. Examples of such work include Strobl (2012)279 on hurricane impacts in the Caribbean, Haque and Jahan (2016) on TC Sidr in Bangladesh, Jakobsen (2012) on Hurricane Mitch in Nicaragua, and Taupo and Noy (2017) on TC Pam in Tuvalu. The relation between changes in TCs and property losses is complex, and there are indications that wind shear changes may have larger impact than changes in global temperatures (Wang and Toumi, 2016280). With regard to loss of life, total fatalities and mortality from cyclone-related coastal flooding is globally declining, probably as a result of improved forecasting and evacuation, although in some low-income countries mortality is still high (Paul, 2009281; Lumbroso et al., 2017282; Bouwer and Jonkman, 2018283). A global analysis finds that despite adaptation efforts, further SLR could increase storm surge mortality in many parts of the developing world (Lloyd et al., 2016284). 

An assessment of future changes in coastal impacts based on direct downscaling of indicators of flooding such as total water level and number of hours per year with breakwater overtopping over a given threshold for port operability is provided by Camus et al. (2017)285. These indicators are multivariable and include the combined effect of SLR, storm surge, astronomical tide and waves. Regional projected wave climate is downscaled from global multi-model projections from 30 CMIP5 model realisations. For example, projections by 2100 under the RCP8.5 scenario show a spatial variability along the coast of Chile with port operability loss between 600–800 h yr–1 and around 200 h yr–1 relative to present (1979–2005) conditions. Although wave changes are included in projected overtopping distributions, future changes of operability are mainly due to the SLR contribution.

6.3.3

Risk Management and Adaptation

The most effective risk management strategy in the last few decades has been the development of early warning systems for cyclones (Hallegatte, 2013286). Generally, however, a lack of familiarity with the changed nature of storms prevails. Powerful storms often generate record storm surges (Needham et al., 2015287), such as in the cases of Cyclone Nargis and Typhoon Haiyan but surge warnings had been less well understood and followed because they had tended to be new or rare to the locality (Lagmay et al., 2015288). A US study on storm surge warnings highlights the issue of the right timing to warn, as well as the difficulty in delivering accurate surge maps (Morrow et al., 2015289). Previous experience with warnings that were not followed by hazard events show the ‘crying wolf’ problem leading many to ignore future warnings (Bostrom et al., 2018290).

There is scant literature on the management of storms that follow less common trajectories. The most recent and relatively well-studied ones are Superstorm Sandy in 2012 in the USA and Typhoon Haiyan in 2013 in the Philippines. These two storms were unexpected and having underestimated the levels of impact, people ignored warnings and evacuation directives. In the case of Typhoon Haiyan, the dissemination of warnings via scripted text messages were ineffective without an explanation of the difference between Haiyan’s accompanying storm surge and that of other ‘normal’ storms to which people were used to (Lejano et al., 2016291). Negative experiences of previous evacuations also lead to the reluctance of authorities to issue mandatory evacuation orders, for example, during Superstorm Sandy (Kulkarni et al., 2017292), and contributes to a preventable high number of casualties (Dalisay and De Guzman, 2016293). These examples also show that saving lives and assets through warning and evacuation is limited. Providing biophysical protection measures as well as improving self-reliance during such events can complement warning and evacuation. 

After the storms, retreat or rebuild options exist. Rebuilding options can depend on whether insurance is still affordable after the event. Buyout programs, a form of ‘managed retreat’ whereby government agencies pay people affected by extreme weather events to relocate to safer areas, gained traction in recent years as a potential solution to reduce exposure to changing storm surge and flood risk. The decision to retreat or rebuild in situ depends, at least partially, on how communities have recovered in the past and therefore on the perceived success of a future recovery (Binder, 2014294). However, political and jurisdictional conflicts between local, regional, and national government over land management responsibilities, lack of coordinated nation-wide adaptation plans, and clashes between individual and community needs have led to some unpopular buyout programs after Hurricane Sandy (Boet-Whitaker, 2017295). Relocation (i.e., managed retreat) is often very controversial, can incur significant political risk even when it is in principle voluntary (Gibbs et al., 2016296), and is rarely implemented with much success at larger scales (Beine and Parsons, 2015297; Hino et al., 2017298). In addition, managed retreats are often fraught with legal, distributional and human rights issues, as seen in the case of resettlements after Typhoon Haiyan (Thomas, 2015299; see also Cross-Chapter Box 5 in Chapter 1), and extend to loss of cultural heritage and indigenous qualities in the case of small island states. 

If rebuilding in situ is pursued after catastrophic events and without decreased exposure, it is often accompanied by actions that aim to reduce vulnerability in order to adapt to the increasing risk (Harman et al., 2013300). In many cases, resilient designs and sustainable urban plans integrating climate change concerns, that are inclusive of vegetation barriers as coastal defences and hybrid designs, are considered (Cheong et al., 2013301; Saleh and Weinstein, 2016302). However, often more physical structures that are known to be less sustainable in the long-term, but potentially more protective in the short-term, are constructed (Knowlton and Rotkin-Ellman, 2014303; Rosenzweig and Solecki, 2014304). Anticipatory planning approaches are under way to warn and enable decision making in time (Bloemen et al., 2018305; Lawrence et al., 2018306).

6.4

Marine Heatwaves and their Implications

AR5 concluded that it is virtually certain that the global ocean temperature in the upper few hundred meters has increased from 19712010 (Rhein et al., 2013307), and that the temperature is projected to further increase during the 21st century (Collins et al., 2013308). For an update on observed and projected long-term changes in ocean temperature and heat, see Chapter 5. 

Superimposed onto the long-term ocean warming trend are short-term extreme warming events, called MHWs, during which ocean temperatures are extremely high. Whereas the response of marine organisms and ecosystems to gradual trends in temperature has been assessed in AR5 (e.g., Hoegh-Guldberg et al., 2014; Pörtner et al., 2014309), research on the response of the natural, physical and socioeconomic systems to MHWs has newly emerged since AR5. Notable exceptions are studies on the effect of MHWs on intertidal systems and tropical coral reef ecosystems, which have been already assessed in AR5 (Gattuso et al., 2014310; Pörtner et al., 2014311).

MHWs are periods of extremely high ocean temperatures that persist for days to months, can extend up to thousands of kilometres and can penetrate multiple hundreds of metres into the deep ocean (see SROCC Glossary; Hobday et al., 2016a312; Scannell et al., 2016313; Benthuysen et al., 2018314). A MHW is an event at a particular place and time of the year that is rare and predominately, but not exclusively, defined with a relative threshold; that is, an event rarer than 90th or 99th percentile of a probability density function. By definition, the characteristics of what is called a MHW may therefore vary from place to place in an absolute sense. Different metrics are used to quantify changes in MHW characteristics, such as frequency, duration, intensity, spatial extent and severity. To monitor and predict coral bleaching risk, the metric degree heating week (DHW; e.g., Eakin et al., 2010) is often used, which combines the effect of duration and magnitude of the heatwave. 

6.4.1

Observations and Key Processes, Detection and Attribution, Projections

6.4.1.1

Recent Documented MHWs and Key Driving Mechanisms

MHWs have been observed and documented in all ocean basins over the last two decades (Figure 6.3a, Figure 6.2, Table 6.2). Prominent examples include the Northeast Pacific 2013–2015 MHW (often called ‘The Blob’; Bond et al. 2015315), the Yellow Sea/East China Sea 2016 MHW (KMA, 2016; KMA, 2017; KMA, 2018), the Western Australia 2011 MHW (Pearce and Feng, 2013316; Kataoka et al. 2014317), and the Northwest Atlantic 2012 MHW (Mills et al. 2013318).

The dominant ocean and/or atmospheric processes leading to the buildup, persistence and decay of MHWs vary greatly among the individual MHWs and depend on the location and time of occurrence. One of the most important global driver of MHWs are El Niño events (Oliver et al., 2018a319). During El Niño events, the SST, in particular of the central and eastern equatorial Pacific and the Indian Ocean, are anomalously warm (see Section 6.5). MHWs may also be associated with other large-scale modes of climate variability, such as the Pacific Decadal Oscillation (PDO), AMO, Indian Ocean Dipole (IOD), North Pacific Oscillation and NAO, which modulate ocean temperatures at the regional scale (Benthuysen et al., 2014320; Bond et al., 2015321; Chen et al., 2015b322; Di Lorenzo and Mantua, 2016). These modes can change the strength, direction and location of ocean currents that build up areas of extreme warm waters, or they can change the air-sea heat flux, leading to a warming of the ocean surface from the atmosphere. For example, predominant La Niña conditions in 2010 and 2011 strengthened and shifted the Leeuwin Current southward along the west coast of Australia leading to the Western Australia 2011 MHW (Pearce and Feng, 2013323; Kataoka et al., 2014324). Another example is The Blob, which emerged in 2013 in response to teleconnections between the North Pacific and the weak El Niño that drove strong positive sea level pressure anomalies across the northeast Pacific inducing a smaller heat loss from the ocean (Bond et al., 2015325; Di Lorenzo and Mantua, 2016). Low sea ice concentrations in the Arctic, however, may have also played a role (Lee et al., 2015a326). 

The buildup and decay of extreme warm SSTs may also be caused by small-scale atmospheric and oceanic processes, such as ocean mesoscale eddies or local atmospheric weather patterns (Carrigan and Puotinen, 2014327; Schlegel et al., 2017a328; Schlegel et al., 2017b329). For example, the Tasman Sea 2015–2016 MHW was caused by enhanced southward transport in the East Australian current driven by increased wind stress curl across the mid-latitude South Pacific (Oliver and Holbrook, 2014330; Oliver et al., 2017331) with local downwelling-favourable winds also having played a role in the subsurface intensification of the MHW (Schaeffer and Roughan, 2017332). In addition, the 2016 MHW in the southern part of the Great Barrier Reef was mitigated by the ETC Winston that passed over Fiji on February 20th. The cyclone caused strong winds, cloud cover and rain, which lowered SST and prevented corals from bleaching (Hughes et al., 2017b333). 

6.4.1.2

Detection and Attribution of MHW Events

The upper ocean temperature has significantly increased in most regions over the last few decades, with anthropogenic forcing very likely being the main driver (Bindoff et al., 2013334). Concurrent with the long-term increase in upper ocean temperatures, MHWs have become more frequent, extensive and intense (Frölicher and Laufkötter, 2018335; Oliver et al., 2018a336; Smale et al., 2019337). Analysis of satellite daily SST data reveal that the number of MHW days exceeding the 99th percentile, calculated over the 1982–2016 period, has doubled globally between 1982 and 2016, from about 2.5 heatwave days yr–1 to 5 heatwave days yr–1 (Frölicher et al. 2018338; Oliver et al. 2018a339). At the same time, the maximum intensity of MHWs has increased by 0.15°C and the spatial extent by 66% (Frölicher et al., 2018340). Using a classification system to separate MHWs into categories (I-IV, depending on the level to which SSTs exceed local averages), Hobday et al. (2018)341 show that the occurrence of MHWs has increased for all categories over the past 35 years with the largest increase (24%) in strong (Category II) MHW events. In 2016, about a quarter of the surface ocean experienced either the longest or most intense MHW (Hobday et al., 2016a; Figure 6.3b). 

The observed trend towards more frequent, intense and extensive MHWs, defined relative to a fixed baseline period, is very likely due to the long-term anthropogenic increase in mean ocean temperatures, and cannot be explained by natural climate variability (Frölicher et al., 2018342; Oliver et al., 2018a343; Oliver, 2019344). As climate models project a long-term increase in ocean temperatures over the 21st century (Collins et al., 2013345), a further increase in the probability of MHWs under continued global warming can be expected (see Section 6.4.1.3). Extending the analysis to the pre-satellite period (before 1982) by using a combination of daily in situ measurements and gridded monthly in situ based data sets, Oliver et al. (2018a) show that the global frequency and duration of MHWs have increased since 1925. At regional scale, MHWs have become more common in 38% of the world’s coastal ocean over the last few decades (Lima and Wethey, 2012346). In tropical reef systems, the interval between recurrent MHWs and associated coral bleaching events has diminished steadily since 1980, from once every 25 to 30 years in early 1980s to once every 6 years in 2016 (Hughes et al., 2018a347). Due to the scarcity of below surface temperature data with high temporal and spatial resolution, it is currently unknown if and how MHWs at depth have changed over the past decades. 

Several attribution studies (summarised in Table 6.2) have investigated if the likelihood of individual MHW events has changed due to anthropogenic warming. On a global scale and at present day (2006–2015), climate models suggest that 84–90% (very likely range) of all globally occurring MHWs are attributable to the temperature increase since 1850–1900 (Fischer and Knutti, 2015348; Frölicher et al., 2018349). Attribution studies on individual MHW events show that the intensity of the western tropical Pacific MHW in 2014 (Weller et al., 2015350), the intensity of the Alaskan Sea 2016 MHW (Oliver et al., 2018b351; Walsh et al., 2018352) and the extreme SSTs in the central equatorial Pacific in 2015–2016 can be fully attributed to anthropogenic warming. In other words, the aforementioned studies show that such events could not have occurred without the temperature increase since 1850–1900. In addition, extreme SSTs in the northeast Pacific in 2014 have become about five times more likely with human-induced global warming (Wang et al., 2014a353; Kam et al., 2015354; Weller et al., 2015355). The Tasman Sea 2015–2016 MHW was 330 times (for duration) and 6.8 times (for intensity) more likely with anthropogenic climate change than without (Oliver et al., 2017356), and the northern Australia 2016 MHW was up to fifty times more likely due to anthropogenic climate change (Weller et al., 2015357; King et al., 2017358; Lewis and Mallela, 2018359; Newman et al., 2018360; Oliver et al., 2018b361). Also the risk of the Great Barrier Reef bleaching event in 2016 was increased due to anthropogenic climate change (King et al., 2017362; Lewis and Mallela, 2018363). Even though natural variability is still needed for the events to occur, these studies show that most of the individual MHW events analysed so far have a clear human-induced signal. However, such attribution studies have not been undertaken for all major individual MHW events yet (e.g., five out of ten MHWs indicated in Figure 6.3a have not been assessed), and it is therefore still unknown for some of the observed individual MHW events if they have an anthropogenic signal or not (labelled as ‘unknown’ in Figure 6.3a).

We conclude that it is very likely that MHWs have increased in frequency, duration and intensity since pre-industrial (1850–1900), and that between 20062015 most MHWs (84–90%; very likely range) are attributable to the temperature increase since 1850–1900. Only few studies on the attribution of individual MHW events exist, but they all point to human influence on recent MHW events. 

Figure 6.3

Figure 6.3 | Examples of recent marine heatwaves (MHWs) and their observed impacts. (a) Examples of documented MHWs over the last two decades and their impacts on natural, physical and socioeconomic systems. The colour map shows the maximum sea surface temperature (SST) anomaly during the MHW using the National Oceanic and Atmospheric Administration’s (NOAA) daily […]

Figure 6.3 | Examples of recent marine heatwaves (MHWs) and their observed impacts. (a) Examples of documented MHWs over the last two decades and their impacts on natural, physical and socioeconomic systems. The colour map shows the maximum sea surface temperature (SST) anomaly during the MHW using the National Oceanic and Atmospheric Administration’s (NOAA) daily Optimum Interpolation SST dataset (Reynolds et al. 2007364; Banzon et al. 2016365). A MHW is defined here as a set of spatially and temporally coherent grid points exceeding the 99th percentile. The 99th percentile is calculated over the 1982–2011 reference period after de-seasonalising the data. Red shading of the boxes indicates if the likelihood of MHW occurrence has increased due to anthropogenic climate change, and symbols denote observed impacts on physical systems over land, marine ecosystems, and socioeconomic and human systems. Figure is updated from Frölicher and Laufkötter (2018)366 and is not a complete compilation of all documented MHWs. (b) The record warming years 2015 and 2016 and the global extent of mass bleaching of corals during these years. The colour map shows the Degree Heating Week (DHW) annual maximum over 2015 and 2016 from NOAA’s Coral Reef Watch Daily Global 5 km Satellite Coral Bleaching Heat Stress Monitoring Product Suite v.3.1 (Liu et al. 2014a367). The DHW describes how much heat has accumulated in an area over the past twelve weeks by adding up any temperatures that exceed 1oC above the maximum summertime mean (e.g., Eakin et al. 2010). Symbols show reef locations that are assessed in Hughes et al. (2018a) and indicate where severe bleaching affected more than 30% of corals (purple circles), moderate bleaching affected less than 30% of corals (blue circles), and no substantial bleaching was recorded (light blue circles).

6.4.1.3

Future Changes

MHWs will increase in frequency, duration, spatial extent and intensity throughout the ocean under future global warming (Oliver et al., 2017368; Ramírez and Briones, 2017369; Alexander et al., 2018370; Frölicher et al., 2018371; Frölicher and Laufkötter, 2018372; Darmaraki et al., 2019373). Projections based on 12 CMIP5 Earth system models suggest that, on global scale, the probability of MHWs exceeding the pre-industrial (1850–1900) 99th percentile will very likely increase by a factor of 20–27 by 2031–2050 and very likely by a factor of 46–55 by 2081–2100 under the RCP8.5 greenhouse gas (GHG) scenario (Figure 6.4a; Frölicher et al. 2018374). In other words, a one-in-hundred-day event at pre-industrial levels is projected to become a one-in-four-day event by 2031–2050 and a one-in-two-day event by 2081–2100. The duration of MHW is projected to very likely increase from 8–10 days at 1850–1900, to 126–152 days in 2081–2100 under the RCP8.5 scenario (Frölicher et al., 2018375). The maximum intensity (maximum exceedance of the 1850–1900 99th percentile) will very likely increase from 0.3°C–0.4°C in 1850–1900, to 3.1°C–3.8°C in 2081–2100 under the RCP8.5 scenario. Under the RCP2.6 scenario, the magnitude of changes in the different MHW metrics would be substantially reduced (Frölicher et al., 2018376). For example, the probability ratio would very likely increase by a factor of 16–24 by 2081–2100 for RCP2.6; less than half of that is projected for the RCP8.5. The magnitude of changes in the probability ratio scales with global mean atmospheric surface temperature and is independent of the warming path (Figure 6.4b), that is, it does not depend on whether a particular warming level is reached sooner (RCP8.5) or later (RCP2.6).

Figure 6.4

Figure 6.4 | Global and regional changes in the probability ratio of marine heatwaves (MHWs). The probability ratio is the fraction by which the number of MHW days yr–1 has changed since 1850–1900. (a) Changes in the annual mean probability ratio of MHWs exceeding the 99th percentile of pre-industrial local daily sea surface temperature (SST) […]

Figure 6.4 | Global and regional changes in the probability ratio of marine heatwaves (MHWs). The probability ratio is the fraction by which the number of MHW days yr–1 has changed since 1850–1900. (a) Changes in the annual mean probability ratio of MHWs exceeding the 99th percentile of pre-industrial local daily sea surface temperature (SST) averaged over the ocean. The thick lines represent the multi-model averages of 12 climate models that participated in the Coupled Model Intercomparison Project Phase 5 (CMIP5) covering the 1861–2100 period for the Representative Concentration Pathway (RCP) 8.5 and RCP2.6 scenarios, respectively. The shaded bands indicate the 90% confidence interval of the standard error of the mean. The black line shows an observational-based estimate. As daily SST data are available only for the 1982–2016 period, we assume that the observed mean temperature change is the main cause of the change in frequency of extremes (Frölicher et al. 2018; Oliver, 2019). We therefore subtracted first the differences between 1854–1900 and 1982–2016 obtained from the extended reconstructed SST Version 4 dataset (ERSSTv4; Huang et al. 2015a) from the daily satellite data before calculating the 99th percentile for the observations. (b) Same as (a), but the probability ratio is plotted for different levels of global surface atmospheric warming and for the individual models. The simulated time series in (b) are smoothed with a 10-year running mean. (c,d) Simulated regional changes in the multi-model mean probability ratio of MHWs exceeding the preindustrial 99th percentile in 2081–2100 for the (c) RCP2.6 scenario and the (d) RCP8.5 scenario. The grey contours in (c,d) highlight the spatial pattern. Figure is modified from Frölicher et al. (2018)380.

The changes in MHWs will not be globally uniform. CMIP5 models project that the largest increases in the probability of MHWs will occur in the tropical ocean, especially in the western tropical Pacific, and the Arctic Ocean (Figure 6.4c,d), and that most of the large marine ecosystems will also experience large increases in the number of MHW days (Alexander et al., 2018381; Frölicher et al., 2018382). Smallest increases are projected for the Southern Ocean. In addition, MHW events in the Great Barrier Reef, such as the one associated with the bleaching in 2016, are projected to be at least twice as frequent under 2°C global warming than they are today (King et al., 2017383). The magnitude of projected changes at the local scale is uncertain, partly due to issues of horizontal and vertical resolution of CMIP5-type Earth system models. Only a few studies have used higher resolution oceanic models (eddy-resolving) to assess the local-to-regional changes in MHW characteristics. For example, regional high-resolution coupled climate model simulations suggest that the Mediterranean Sea will experience at least one long lasting MHW every year by the end of the 21st century under the RCP8.5 scenario (Darmaraki et al., 2019384), and eddy-resolving ocean model simulations project a further increase in the likelihood of extreme temperature events in the Tasman Sea (Oliver et al., 2014385; Oliver et al., 2015386; Oliver et al., 2017387). 

Most of the global changes in the probability of MHWs, when defined relative to a fixed temperature climatology and using coarse resolution CMIP5-type climate models, are driven by the global-scale shift in the mean ocean temperature (Alexander et al., 2018388; Frölicher et al., 2018389). However, previously ice-covered regions, such as the Arctic Ocean, will exhibit larger SST variability under future global warming. This is because of an enhanced SST increase in summer due to sea ice retreat, but SST remaining near the freezing point in winter (Carton et al., 2015390; Alexander et al., 2018391). When contrasting the changes in the probability of MHWs with land-based heatwaves (Fischer and Knutti, 2015392), it is evident that MHWs are projected to occur more frequently (Frölicher et al., 2018393; Frölicher and Laufkötter, 2018394). This is because the temperature variability is much smaller in ocean surface waters than in the atmosphere (Frölicher and Laufkötter, 2018395)

We conclude that there is very high confidence that MHWs will increase in frequency, duration, spatial extent and intensity in all ocean basins under future global warming, mainly because of an increase in mean ocean temperature. However, higher resolution models are needed to make robust projections at the local-to-regional scale. 

6.4.2

Impacts on Natural, Physical and Human Systems

6.4.2.1

Impacts on Marine Organisms and Ecosystems

Temperature plays an essential role in the biology and ecology of marine organisms (e.g., Pörtner, 2002; Pörtner and Knust, 2007396; Poloczanska et al., 2013397; Hoegh-Guldberg et al., 2014398), and therefore extreme high ocean temperature can have large impacts on marine ecosystems. Recent studies show that MHWs have strongly impacted marine organisms and ecosystem services in all ocean basins (Smale et al., 2019399) over the last two decades. Impacts include coral bleaching and mortality (Hughes et al., 2017b400; Hughes et al., 2018a401; Hughes et al., 2018b402), loss of seagrass and kelp forests (Smale et al., 2019403), shifts in species range (Smale and Wernberg, 2013404), and local (Wernberg et al., 2013405; Wernberg et al., 2016406) and potentially global extinctions of coral species (Brainard et al., 2011407). 

A growing number of studies have reported that MHWs negatively affect corals and coral reefs through bleaching, disease, and mortality (see Chapter 5 for an extensive discussion on coral reefs and coral bleaching). The recent (2014–2017) high ocean temperatures in the tropics and subtropics triggered a pan-tropical episode of unprecedented mass bleaching of corals (100s of km2), the third global-scale event after 1997–1998 and 2010 (Heron et al., 2016408; Eakin et al., 2017409; Hughes et al., 2017b410; Eakin et al., 2018411; Hughes et al., 2018a412). The heat stress during this event was sufficient to cause bleaching at 75% of global reefs (Hughes et al., 2018a; Figure 6.3b) and mortality at 30% (Eakin et al., 2017414), much more than any previously documented global bleaching event. In some locations, many reefs bleached extensively for the first time on record, and over half of the reefs bleached multiple times during the three year event. However, there were distinct geographical variations in bleaching, mainly determined by the spatial pattern and magnitude of the MHW (Figure 6.3b). For example, bleaching was extensive and severe in the northern regions of the Great Barrier Reef, with 93% of the northern Australian Great Barrier Reef coral suffering bleaching in 2016, but impacts were moderate at the southern coral reefs of the Great Barrier Reef (Brainard et al., 2018415; Stuart-Smith et al., 2018416). 

Apart from strong impacts on corals, recent MHWs have demonstrated their potential impacts on other marine ecosystems and ecosystems services (Ummenhofer and Meehl, 2017417; Smale et al., 2019418). Two of the best studied MHWs with extensive ecological implications are the Western Australia 2011 MHW and the Northeast Pacific 2013–2015 MHW. The Western Australia 2011 MHW resulted in a regime shift of the temperate reef ecosystem (Wernberg et al., 2013419; Wernberg et al., 2016420). The abundance of the dominant habitat-forming seaweeds Scytohalia dorycara and Ecklonia radiata became significantly reduced and Ecklonia kelp forest was replaced by small turf-forming algae with wide ranging impacts on associated sessile invertebrates and demersal fish. The sea grass Amphibolis antarctica in Shark Bay underwent defoliation after the MHW (Fraser et al., 2014421), and together with the loss of other sea grass species, these lead to releases of 2–9 Tg CO2 to the atmosphere during the subsequent three years after the MHW (Arias-Ortiz et al., 2018422). In addition, coral bleaching and adverse impacts on invertebrate fisheries were documented (Depczynski et al., 2013423; Caputi et al., 2016424). The Northeast Pacific 2013–2015 MHW also caused extensive alterations to open ocean and coastal ecosystems (Cavole et al., 2016425). Impacts included increased mortality events of sea birds (Jones et al., 2018426), salmon and marine mammals (Cavole et al., 2016427), very low ocean primary productivity (Whitney, 2015428; Jacox et al., 2016429), an increase in warm water copepod species (Di Lorenzo and Mantua, 2016) and novel species compositions (Peterson et al., 2017430). In addition, a coast wide bloom of the toxigenic diatom Pseudo-nitzschia resulted in the largest ever recorded outbreak of domoic acid along the North American west coast (McCabe et al., 2016431). Domoic acid was detected in many marine mammals, such as whales, dolphins, porpoises, seals and sea lions. The elevated toxins in commercially harvested fish and invertebrates resulted in prolonged and geographically extensive closure of razor clam and crab fisheries. 

Other MHWs also demonstrated the vulnerability of marine organisms and ecosystems to extremely high ocean temperatures. The Northwest Atlantic 2012 MHW strongly impacted coastal ecosystems by causing a northward movement of warm water species and local migrations of some species (e.g., lobsters) earlier in the season (Mills et al., 2013432; Pershing et al., 2015)433. The Mediterranean Sea 2003 MHW lead to mass mortalities of macro-invertebrate species (Garrabou et al., 2009434) and the Tasman Sea 2015–2016 MHW had impacts on sessile, sedentary and cultured species in the shallow, near-shore environment including outbreaks of disease in commercially viable species (Oliver et al., 2017435). Vibrio outbreaks were also observed in the Baltic Sea in response to elevated SSTs (Baker-Austin et al., 2013436). The Alaskan Sea 2016 MHW favoured some phytoplankton species, leading to harmful algal blooms, shellfish poisoning events and mortality events in seabirds (Walsh et al., 2018437; see chapter 3 for more details). Also, lower than average size of multiple groundfish species were observed including Pollock, Pacific cod, and Chinook salmon (Zador and Siddon, 2016438). The Yellow Sea/East China Sea 2016 MHW killed a large number of different marine organisms in coastal and bay areas around South Korea (Kim and Han, 2017439) and the Southwest Atlantic 2017 MHW lead to toxic algal blooms (Manta et al., 2018440). The Coastal Peruvian 2017 MHW affected anchovies, which showed decreased fat content and early spawning as a reproductive strategy (IMPARPE, 2017), a behaviour usually seen during warm El Niño conditions (Ñiquen and Bouchon, 2004442). 

Based on the examples described above we conclude with very high confidence that a range of organisms and ecosystems have been impacted by MHWs across all ocean basins over the last two decades. Given that MHWs will very likely increase in intensity and frequency with further climate warming, we conclude with high confidence that this will push some marine organisms, fisheries and ecosystem beyond the limits of their resilience. These impacts will occur on top of those expected from a progressive shift in global mean ocean temperatures. 

6.4.2.2

Impacts on the Physical System

MHWs can impact weather patterns over land via teleconnections causing drought, heavy precipitation or heat wave events. For example, the Northeast Pacific 2013–2015 MHW and the associated persistent atmospheric high-pressure ridge prevented normal winter storms from reaching the West Coast of the US and may have contributed to the drought conditions across the entire West Coast (Seager et al., 2015443; Di Lorenzo and Mantua, 2016). The Tasman Sea 2015–2016 MHW has increased the intensity of rainfall that caused flooding in northeast Tasmania in January 2016 (see Box 6.1) and the Coastal Peruvian 2017 MHW caused heavy rainfall and flooding on the west coast of tropical South America (ENFEN, 2017444; Echevin et al., 2018445; Garreaud, 2018446; Takahashi et al., 2018447). Similarly, MHWs in the Mediterranean Sea may have amplified heatwaves (Feudale and Shukla, 2007448; García-Herrera et al., 2010449) and heavy precipitation events over central Europe (Messmer et al., 2017450), as well as trigger intense ETCs over the Mediterranean Sea (GonzálezAlemán et al., 2019451). Such physical changes induced by MHWs may then also affect ecosystems and human systems on land (Reimer et al., 2015452). 

It should be noted that past and future impacts of MHWs on weather patterns over land depend not only on the duration and intensity of MHWs, but also on a wide range of different additional processes in the climate system such as the large-scale circulation of the atmosphere and oceans, and changes in the mean climate. Therefore, we conclude that there is currently low confidence in how MHWs impact the weather systems over land. 

6.4.2.3

Impacts on the Human System

MHWs can also lead to significant socioeconomic ramifications when affecting aquaculture or important fishery species, or when triggering heavy rain or drought events on land. The Northwest Atlantic 2012 MHW, for example, had major economic impacts on the US lobster industry in 2015 (Mills et al., 2013). The MHWs lead to changes in lobster fishing practices and harvest patterns, because the lobsters moved from the deep offshore waters into shallower coastal areas much earlier in the season than usual causing a rapid rise in lobster catch rates. Together with a supply chain bottleneck, the record catch outstripped market demand and contributed to a collapse in lobster prices (Mills et al., 2013453). Even though high catch volumes were reported, the price collapse threatened the economic viability of many US and Canadian lobster fisheries. Economic impacts through changes in fisheries were also reported during the Northeast Pacific 2013–2015 MHW and the Alaskan Sea 2016 MHW. The Northeast Pacific 2013–2015 MHW led to closing of both commercial and recreational fisheries resulting in millions of USD in losses among fishing industries (Cavole et al., 2016455). In addition, the toxin produced by the harmful algal blooms can be transferred through the marine food web and humans who eat contaminated fish, shellfish or crustaceans (Berdalet et al., 2016456; Du et al., 2016457; McCabe et al., 2016458). The ingestion of such contaminated seafood products, the inhalation of aerosolised toxins or the skin contact with toxin-contaminated water may cause toxicity in humans. Symptoms in human associated with the ingestion of the contaminated seafood range from mild gastrointestinal distress to seizures, coma, permanent short-term memory loss and death (Perl et al., 1990459). The ecological changes associated with the Alaskan Sea 2016 MHW impacted subsistence and commercial activities. For example, ice-based harvesting of seals, crabs and fish in western Alaska was delayed due to the lack of winter sea ice. MHWs can also impact the socioeconomic and human system through changes to weather patterns. For example, heavy rain associated with the Coastal Peruvian 2017 MHW triggered numerous landslides and flooding, which resulted in a death toll of several hundred, and widespread damage to infrastructure and civil works (United Nations, 2017460).

Studies on the impact of MHWs on human systems are still relatively scarce, even though many show negative impacts on human health and economy. We therefore conclude with medium confidence that MHWs can negatively impact human health and economy. 

6.4.3

Risk Management and Adaptation, Monitoring and Early Warning Systems

Risk management strategies to respond to MHWs include early warning systems as well as seasonal (weeks to several months) and multi-annual predictions systems. Since 1997, the National Oceanic and Atmospheric Administration’s (NOAA) Coral Reef Watch has used satellite SST data to provide near real-time warning of coral bleaching (Liu et al., 2014a461). These satellite-based products, along with NOAA Coral Reef Watch’s four month coral bleaching outlook based on operational climate forecast models (Liu et al., 2018462), and coral disease outbreak risk (Heron et al., 2010463) provide critical guidance to coral reef managers, scientists, and other stakeholders (Tommasi et al., 2017b464; Eakin et al., 2018465). These products are also used to implement proactive bleaching response plans (Rosinski et al., 2017466), brief stakeholders, and allocate monitoring resources in advance of bleaching events, such as the 2014–2017 global coral bleaching event (Eakin et al., 2017467). For example, Thailand closed ten reefs for diving in advance of the bleaching peak in 2016, while Hawaii immediately began preparation of resources both to monitor the 2015 bleaching and to place specimens of rare corals in climate controlled, onshore nurseries in response to these forecast systems (Tommasi et al., 2017b468). New measurement techniques, such as Argo and deep Argo floats, may help to further develop prediction systems for subsurface MHWs, but such systems are not yet in place.

SST forecasts ranging from seasonal to decadal (5–10 years) have also been used or are planned to be used as early warning systems for multiple other ecosystems and fisheries in addition to coral reefs, including aquaculture, lobster, sardine, and tuna fisheries (Hobday et al., 2016b469; Payne et al., 2017470; Tommasi et al., 2017b471). For example, seasonal forecasts of SST around Tasmania may help farm managers of salmon aquaculture to prepare and respond to upcoming MHWs by changing stocking densities, varying feed mixes, transferring fish to different locations in the farming region and implementing disease management (Spillman and Hobday, 2014472; Hobday et al., 2016b473). Skilful multi-annual to decadal SST predictions may also inform and improve decisions about spatial and industrial planning, as well as the management of various extractive sectors such as the adjustments to quotas for internationally shared fish stocks (Tommasi et al., 2017a474). It has been shown that global climate forecasts have significant skill in predicting the occurrence of above average warm or cold SST events at decadal timescales in coastal areas (Tommasi et al., 2017a475), but barriers to their widespread usage in fishery and aquaculture industry still exist (Tommasi et al., 2017b476). 

Even with a monitoring and prediction system in place, MHWs have developed without warning and had catastrophic effects (Payne et al., 2017477). For example, governmental agencies, socioeconomic sectors, public health officials and citizens were not forewarned of the Coastal Peruvian 2017 MHW, despite a basin-wide monitoring system across the Pacific. The reason was partly due to a coastal El Niño definition problem and a new government (in Nicaragua) that may have hindered actions (Ramírez and Briones, 2017478). Therefore, early warning systems should not only provide predictions of physical changes, but should also connect different institutions to assist decision makers in performing time-adaptive measures (Chang et al., 2013479). 

Monitoring and prediction systems are important and can be advanced by the use of common metrics to describe MHWs. So far, MHWs are often defined differently in the literature, and it is only recently that a categorising scheme (Categories I to IV; based on the degree to which temperatures exceed the local climatology), similar to what is used for hurricanes, has been developed (Hobday et al., 2018480). Such a categorising scheme, can easily be applied to real data and predictions, and may facilitate comparison, public communication and familiarity with MHWs. Similar metrics (e.g., DHW) have been successfully developed and used to identify ocean regions where conditions conducive to coral bleaching are developing. 

6.5

Extreme ENSO Events and Other Modes of Interannual Climate Variability

6.5.1

Key Processes and Feedbacks, Observations, Detection and Attribution, Projections

6.5.1.1

Extreme El Niño, La Niña

AR5 (Christensen et al., 2013481) and SREX do not provide a definition for an extreme El Niño but mention such events, especially in the context of the 1997–1998 El Niño and its impacts. AR5 and SREX concluded that confidence in any specific change in ENSO variability in the 21st century is low. However, they did note that due to increased moisture availability, precipitation variability associated with ENSO is likely to intensify. Since AR5 and SREX, there is now a limited body of literature that examines the impact of climate change on ENSO over the historical period.

Palaeo-ENSO studies suggest that ENSO was highly variable throughout the Holocene, with no evidence for a systematic trend in ENSO variance (Cobb et al., 2013482) but with some indication that the ENSO variance over 1979–2009 has been much larger than that over 1590–1880 (McGregor et al., 2013483). Palaeo-ENSO reconstruction for the past eight centuries suggests that central Pacific ENSO activity has increased between the last two decades (1980-2015; Liu et al., 2017b484), with an increasing number of central Pacific El Niño events compared to east Pacific El Niño events (Freund et al., 2019485). Further proxy evidence exists for changes in the mean state of the equatorial Pacific in the last 2000 years (Rustic et al., 2015486; Henke et al., 2017487). Simulations using an Earth System Model indicate significantly higher ENSO variance during 1645–1715 than during the 21st century warm period, though it is unclear whether these simulated changes are realistic (Keller et al., 2015488). For the 20th century, the frequency and intensity of El Niño events were high during 1951–2000, in comparison with the 1901–1950 period (Lee and McPhaden, 2010489; Kim et al., 2014b490; Roxy et al., 2014491). Current instrumental observational records are not long enough and the quality of data before 1950 is limited, to assert these changes with high confidence (Wittenberg, 2009492; Stevenson et al., 2010493) though the palaeo records mentioned here signal the emergence of a statistically significant increase in ENSO variance in recent decades.

Since SREX and AR5, an extreme El Niño event occurred in 2015–2016. This has resulted in significant new literature regarding physical processes and impacts but there are no firm conclusions regarding the impact of climate change on the event. The SST anomaly peaked toward the central equatorial Pacific causing floods in many regions of the world such as those in the west coasts of the USA and other parts of North America, some parts of South America close to Argentina and Uruguay, the UK and China (Ward et al., 2014494; Ward et al., 2016495; Zhai et al., 2016496; Scaife et al., 2017497; Whan and Zwiers, 2017498; Sun and Miao, 2018499; Yuan et al., 2018500). 

The main new body of literature concerns future projections of the frequency of occurrence and variability of extreme ENSO events with improved confidence (Cai et al., 2014a501; Cai et al., 2018502). These studies define extreme El Niño events as those El Niño events which are characterised by a pronounced eastward extension of the west Pacific warm pool and development of atmospheric convection, and hence a rainfall increase of greater than 5 mm day-1 during December to February (above 90th percentile), in the usually cold and dry equatorial eastern Pacific (Niño 3 region, 150°W–90°W, 5°S–5°N; Cai et al., 2014a503), such as the 1982–1983, 1997–1998 and 2015–2016 El Niños (Santoso et al., 2017504; Figure 6.5).

The background long-term warming puts the 2015–2016 El Niño among the three warmest in the instrumental records (24 El Niño events occurred during 1900–2018; Huang et al., 2016505; Santoso et al., 2017506). The 2015–2016 event can be viewed as the first emergence of an extreme El Niño in the 21st century – one which satisfies the rainfall threshold definition, but not characterised by the eastward extension of the west Pacific warm pool (L’Heureux et al., 2017507; Santoso et al., 2017508).

Based on the precipitation threshold, extreme El Niño frequency is projected to increase with the global mean temperatures (medium confidence) with a doubling in the 21st century under 1.5°C of global warming, from about one event every 20 years during 1891–1990, to one every 10 years (Cai et al., 2014a509; Figure 6.5). The increase in frequency continues for up to a century even after global mean temperature has stabilised at 1.5°C, thereby challenging the limits to adaptation, and hence indicates high risk even at the 1.5°C threshold (Wang et al., 2017510; Hoegh-Guldberg et al., 2018511). Meanwhile, the La Niña events also tend to increase in frequency and double under RCP8.5 (Cai et al., 2015512), but indicate no further significant changes after global mean temperatures have stabilised (Wang et al., 2017513). Particularly concerning is that swings from extreme El Niño to extreme La Niña (opposite of extreme El Niño) have been projected to occur more frequently under greenhouse warming (Cai et al., 2015514). The increasing ratio of Central Pacific El Niño events to East Pacific El Niño events is projected to continue, under increasing emissions (Freund et al., 2019515). Further, CMIP5 models indicate that the risk of major rainfall disruptions has already increased for countries where the rainfall variability is linked to ENSO variability. This risk will remain elevated for the entire 21st century, even if substantial reductions in global GHG emissions are made (medium confidence). The increase in disruption risk is caused by anthropogenic warming that drives an increase in the frequency and magnitude of ENSO events and also by changes in background SST patterns (Power et al., 2013516; Chung et al., 2014517; Huang and Xie, 2015518). While many of these studies have adopted the precipitation view of an extreme El Nino, studies also indicate an increase in SST variability for events with their main SST anomalies in the east Pacific (Cai et al., 2018519). Also, a role of cross-equatorial winds has been identified (Hu and Fedorov, 2018520)

Figure 6.5

Figure 6.5 | Frequency of extreme El Niño Southern Oscillation (ENSO) events, adapted from Cai et al. (2014a). (a) December to February mean meridional sea surface temperature (SST) gradient (x-axis: 5oN–10oN, 210oE–270oE minus 2.5oS–2.5oN, 210oE–270oE) versus equatorial Pacific anomalous rainfall (y-axis: 5oS–5oN, 210oE–270oE). Data from only those Coupled Model Intercomparison Project Phase 5 (CMIP5) models […]

Figure 6.5 | Frequency of extreme El Niño Southern Oscillation (ENSO) events, adapted from Cai et al. (2014a). (a) December to February mean meridional sea surface temperature (SST) gradient (x-axis: 5oN–10oN, 210oE–270oE minus 2.5oS–2.5oN, 210oE–270oE) versus equatorial Pacific anomalous rainfall (y-axis: 5oS–5oN, 210oE–270oE). Data from only those Coupled Model Intercomparison Project Phase 5 (CMIP5) models that capture the observed relationship between Pacific SST and rainfall are shown. Black dots are from observations with extreme El Niño and extreme La Niña years indicated. The horizontal line denotes the threshold of 5 mm day–1 for an extreme event. (b)Histogram showing the relative frequency of rainfall rates. The vertical line denotes the 5 mm day–1 threshold. Higher counts of extreme events under the Representative Concentration Pathway (RCP)8.5 scenario suggest an increase in the frequency of extreme El Niño under global warming.

6.5.1.2

Indian Ocean Basin-wide Warming and Changes in Indian Ocean Dipole (IOD) Events

The Indian Ocean has experienced consistent warming from the surface to 2,000 m during 1960–2015, with most of the warming occurring in the upper 300 m (Cheng et al., 2015521; Nieves et al., 2015522; Cheng et al., 2017523; Gnanaseelan et al., 2017524). New historical ocean heat content (OHC) estimates show an abrupt increase in the Indian Ocean upper 700 m OHC after 1998, contributing to more than 28% of the global ocean heat gain, despite representing only about 12% of the global ocean area (Cheng et al., 2017525; Makarim et al., 2019526). The tropical Indian Ocean SST has warmed by 1.04°C during 1950–2015, while the tropical SST warming is 0.83°C and the global SST warning is 0.65°C. More than 90% of the surface warming in the Indian Ocean has been attributed to changes in GHG emissions (Dong et al., 2014527), with the heat redistributed in the basin via local ocean and atmospheric dynamics (Liu et al., 2015b528), the ITF (Section 6.6.1; Susanto et al., 2012529; Sprintall and Revelard, 2014530; Lee et al., 2015b531; Susanto and Song, 2015532; Zhang et al., 2018533) and the Walker circulation (Roxy et al., 2014534; Abish et al., 2018535). 

The dynamic processes related to the projected changes in IOD under global warming have a large inter-model spread (Cai et al., 2013536). The frequency of extreme positive IOD events are projected to increase by almost a factor of three, from a one-in-seventeen-year event in the 20th century to a one-in-six-year event in the 21st century (low confidence). The bias in the CMIP5 models and internal variability could enlarge the projected increase in the extreme positive IOD events (Li et al., 2016a537; Hui and Zheng, 2018538). The increase in IOD events is not linked to the change in the frequency of El Niño events but instead to mean state change—with weakening of both equatorial westerly winds and eastward oceanic currents in association with a faster warming in the western than the eastern equatorial Indian Ocean (Cai et al., 2014b539). A combination of extreme ENSO and IOD events has led to a northward shift in the Intertropical Convergence Zone (ITCZ) during 1979–2015, which is expected to increase further in the future (Freitas et al., 2017540).

6.5.2

Impacts on Human and Natural Systems

Increasing frequency of extreme ENSO and IOD events have the potential to have widespread impacts on natural and human systems in many parts of the globe. Though the occurrence of the extreme 2015–2016 El Niño has produced a large body of literature, it is still not clear how climate change may have altered such an impact, nor how such impacts might change in the future with increasing frequency of extreme ENSO events. We highlight here some studies that have attempted to assess the joint impact of mean change and variability. In addition to observed high variability of rainfall, severe weather events and impacts on TCs activity (Yonekura and Hall, 2014541; Zhang and Guan, 2014542; Wang and Liu, 2016543; Zhan, 2017544), extreme El Nino events have substantial impacts on natural systems which include those on marine ecosystems (Sanseverino et al., 2016545; Mogollon and Calil, 2017546; Ohman et al., 2017537), such as severe and repeated bleaching of corals (Hughes et al., 2017a548; Hughes et al., 2017b549; Eakin et al., 2018550), and glacial growth and retreat (Thompson et al., 2017551). On the other hand, impacts on human, including managed systems are: increased incidences of forest fires (Christidis et al., 2018b552; Tett et al., 2018553), degraded air quality (Koplitz et al., 2015554; Chang et al., 2016555; Zhai et al., 2016556) such as the dense haze over most parts of Indonesia and the neighbouring countries in Southeast Asia as a result of prolonged Indonesian wildfires, thus imposing adverse impacts on public health in the affected areas (Koplitz et al., 2015557; WMO, 2016), decreased agricultural yields in many parts of the globe (e.g., in most of the Pacific Islands countries, Thailand, eastern and southern Africa and others which had resulted food insecurity, particularly in eastern and southern Africa (UNSCAP, 2015; WMO, 2016; Christidis et al., 2018b558; Funk et al., 2018559), and regional uptick in the number of reported cases of plague and hantavirus in Colorado and New Mexico, cholera in Tanzania, dengue in Brazil and Southeast Asia (Anyamba et al., 2019560) and Zika virus in South America (Caminade et al., 2017561), including increases in heat stroke cases (Christidis et al., 2018b562). Substantial economic losses had resulted from droughts and floods across various parts of the globe due to teleconnections. For instance, direct losses of 10 billion USD (Sun and Miao, 2018563; Yuan et al., 2018564) and 6.5 billion USD (Christidis et al., 2018b565) were estimated to have been incurred from severe urban inundation in cities along the Yangtze River in China and the extreme drought in Thailand, respectively. 

ENSO events affect TCs activity through variations in the low-level wind anomalies, vertical wind shear, mid-level relative humidity, steering flow, the monsoon trough and the western Pacific subtropical high in Asia (Yonekura and Hall, 2014566; Zhang and Guan, 2014567). The subsurface heat discharge due to El Niño can intensify TCs in the eastern Pacific (Jin et al., 2014568; Moon et al., 2015b569). TCs are projected to become more frequent (~20–40%) during future-climate El Niño events compared with present climate El Niño events (medium confidence), and less frequent during future-climate La Niña events, around a group of small island nations (for example, Fiji, Vanuatu, Marshall Islands and Hawaii) in the Pacific (Chand et al., 2017570). The Indian Ocean basin-wide warming has led to an increase in TC heat potential in the Indian Ocean over the last 30 years, however the link to the changes in the frequency of TCs is not robust (Rajeevan et al., 2013571).

During the early stages of an extreme El Niño event (2015–2016 El Niño), there is an initial decrease in atmospheric CO2 concentrations over the tropical Pacific Ocean, due to suppression of equatorial upwelling, reducing the supply of CO2 to the surface (Chatterjee et al., 2017572), followed by a rise in atmospheric CO2 concentrations due reduced terrestrial CO2 uptake and increased fire emissions (Bastos et al., 2018573). It is not clear how a future increase in the frequency extreme events would modulate the carbon cycle on longer decadal time scales.

Studies on projections of changes in ENSO impacts or teleconnections are rather limited. Nevertheless, Power and Delage (2018) provide a multi-model assessment of CMIP5 models and their simulated changes in the precipitation response to El Niño in the future (Figure 6.6). They identify different combinations of changes that might further impact natural and human systems. El Niño causes either positive or negative precipitation anomalies in diverse regions of the globe. Dry El Niño teleconnection anomalies may be further strengthened by, either mean climate drying in the region (Amazon, Central America and Australia in June to August (JJA)), or a strengthening of the El Niño dry teleconnection, or both. Conversely, wet El Niño teleconnections can be further strengthened by either increases in mean precipitation (East Africa and southeastern South America in December to February (DJF)) or a strengthening of the El Niño wet teleconnection (southeastern South America in JJA), or both (Tibetan Plateau, DJF). However, a present day dry El Niño response may be dampened by a wet mean response (South, East and Southeast Asia in JJA) or a wet present day El Niño response may be weakened by a dry mean change (Southern Europe/Mediterranean and West Coast South America in JJA). Finally, changes in the mean and El Niño response may be in the opposite direction (Southeast Asia, JJA and Central North America, DJF). Such changes could have an impact on phenomena such as wildfires (Fasullo et al., 2018575). However, in many other regions that are currently impacted by El Niño, e.g., regions of South America, studies have found no significant changes in the ENSO-precipitation relationship (Tedeschi and Collins, 2017576) and agreement between models for many regions suggests low confidence in projections of teleconnection changes (Yeh et al., 2018577).

Along with extreme El Niño events, abrupt warming in the Indian Ocean and extreme IOD events have largely altered the Asian and African monsoon, impacting the food and water security over these regions. As a response to rising global SSTs and partially due to extreme El Niño events, the NH summer monsoon showed substantial intensification during 1979–2011, with an increase in rainfall by 9.5% per degree Celsius of global warming (Wang et al., 2013578). However, the Indian summer monsoon circulation and rainfall exhibits a statistically significant weakening since the 1950s. This weakening has been hypothesised to be a response to the Indian Ocean basin-wide warming (Mishra et al., 2012579; Roxy et al., 2015580) and also to increased aerosol emissions (Guo et al., 2016581) and changes in land use (Paul et al., 2016582). Warming in the north Indian Ocean has resulted in increasing fluctuations in the southwest monsoon winds and a three-fold increase in extreme rainfall events across central India (Roxy et al., 2017583). The frequency and duration of heatwaves have increased over the Indian subcontinent, and these events are associated with the Indian Ocean basin-wide warming and frequent El Niños (Rohini et al., 2016584). In April 2016, as a response to the extreme El Niño, Southeast Asia experienced surface air temperatures that surpassed national records, increased energy consumption, disrupted agriculture and resulted in severe human discomfort (Thirumalai et al., 2017585). A strong negative IOD event in 2016 led to large climate impact on East African rainfall, with some regions recording below 50% of normal rainfall, leading to devastating drought, food insecurity and unsafe drinking water for over 15 million people in Somalia, Ethiopia and Kenya.

Figure 6.6

Figure 6.6 | Schematic figure indicating future changes in El Niño teleconnections based on the study of Power and Delage (2018). The background pattern of sea surface temperature (SST) anomalies (oC) are averaged from June 2015 to August 2015 (panel a) and December 2015 to February 2016 (panel b), during the most recent extreme El […]

Figure 6.6 | Schematic figure indicating future changes in El Niño teleconnections based on the study of Power and Delage (2018)589. The background pattern of sea surface temperature (SST) anomalies (oC) are averaged from June 2015 to August 2015 (panel a) and December 2015 to February 2016 (panel b), during the most recent extreme El Niño event (anomalies computed with respect to 1986–2005). Symbols indicate present day teleconnections for El Niño events. Black arrows indicate if there is a model consensus on change in mean rainfall in the region. Red arrows indicate if there is a model consensus on change in the rainfall anomaly under a future El Niño event. Direction of the arrow indicates whether the response in precipitation is increasing (up) or decreasing (down). Significance is determined when two-thirds or more of the models agree on the sign.

6.5.3

Risk Management and Adaptation

Risk management of ENSO events has focussed on two main aspects: better prediction and early warning systems, and better mechanisms for reducing risks to agriculture, infrastructure, fisheries and aquaculture, wildfire and flood management. Extreme ENSO events are rare, with three such events since 1950 and they are difficult to predict due to the different drivers influencing them (Puy et al., 2017586). The impacts of ENSO events also vary between events and between the different regions affected (Murphy et al., 2014587; Fasullo et al., 2018588; Power and Delage, 2018589) however, there is limited literature on the change in the impacts of extreme ENSO compared to other ENSO events. In addition, there are also no specific risk management and adaptation strategies for human and natural systems for more extreme events other than what is in place for ENSO events (see also Chapter 4, Section 4.4 for the response to sea level change, an observed impact of ENSO). A first step in risk management and adaptation is thus to better understand the impacts these events have and to identify conditions that herald such extreme events that could be used to better predict extreme ENSO events. 

Monitoring and forecasting are the most developed ways to manage extreme ENSOs. Several systems are already in place for monitoring and predicting seasonal climate variability and ENSO occurrence. However, the sustainability of the observing system is challenging and currently the Tropical Pacific Observing System 2020 (TPOS 2020) has the task of redesigning such a system, with ENSO prediction as one of its main objectives. These systems could be further elaborated to include extreme ENSO events. Westerly wind events in the Western Tropical Pacific, (Lengaigne et al., 2004590; Chen et al., 2015a591; Fedorov et al., 2015592) strong easterly wind events in the tropical Pacific (Hu and Fedorov, 2016593; Puy et al., 2017594), nonlinear interaction between air-sea fluxes and atmospheric deep convection (Bellenger et al., 2014595; Takahashi and Dewitte, 2016596) and advection of mean temperature by anomalous eastward zonal currents (Kim and Cai, 2014597) are some of the factors that play an important role in the evolution of extreme ENSO events, which can be considered while improving the monitoring and forecasting system. 

Despite the specificity of each extreme El Niño event, their forecasting is expected to improve through monitoring of recently identified precursory signals that peak in a window of two years before the event (Varotsos et al., 2016598). An early warning system for coral bleaching associated, among other stressors, with extreme ENSO heat stress is provided by the NOAA Coral Reef Watch service with a 5 km resolution (Liu et al., 2018599). The impacts of ENSO-associated extreme heat stress are heterogeneous, indicating the influence of other factors either biotic such as coral species composition, local adaptation by coral taxa reef depth or abiotic such as local upwelling or thermal anomalies (Claar et al., 2018600). When identified and quantified, these factors can be used for risk analysis and risk management for these ecosystems.

In principle, it is easier to transfer the financial risk associated with extreme ENSO events through, for example, insurance products or other risk transfer instruments such as Catastrophe Bonds, than for more moderate events. An accurate prediction system is not required, but the measurement of these events, and quantification of likely impacts is required. As in other types of insurance systems, this can be done through, for example, calculations of average annual losses associated with extreme ENSO, and the design of appropriate financial instruments. Examples of research that can support the design of risk transfer instruments include Anderson et al. (2018) and Gelcer et al. (2018) for specific crops yields, and Aguilera et al. (2018) and Broad et al. (2002) for specific fisheries. Several risk transfer instruments have been implemented to deal with ENSO impacts, including parametric insurance based on SSTs for heavy rainfall damages, and another scheme for agricultural damages, both in Peru. Other examples include forecast-based financial aid (Red Cross Climate Centre, 2016). More broadly, other forms of risk management and governance can be designed with better information about the likely impacts of extreme ENSO events (e.g., Vignola et al., 2018).

6.6

Inter-Ocean Exchanges and Global Change

Section 3.6.5.1 in AR5 briefly described the Indonesian Throughflow (ITF) but did not explain its variability and impacts. Palaeoclimate record, observations, and climate model studies suggest that ITF plays an integral role in global ocean circulation, directly impacting mass, heat and freshwater budgets of the Pacific and Indian Oceans (high confidence). ITF is influenced by equatorial Pacific trade wind system which experienced an unprecedented intensification during 2001–2014, resulting in enhanced ocean heat transport from the Pacific to the Indian Ocean and influencing the rate of global temperature change (medium confidence). Yet, numerical models are not able to simulate the magnitude of decadal variability and the inter-ocean link, which means there is low confidence in future projections of the trade wind system.

6.6.1

Key Processes and Feedbacks, Observations, Detection and Attribution, Projections

In the last two decades, total water transport from the Pacific to the Indian Ocean and the Indian Ocean to the Atlantic Ocean has increased (high confidence). Increased ITF has been attributed to Pacific cooling and basin-wide warming in the Indian Ocean. The ITF annual average is 15 x 106 m3 s–1 (Susanto et al., 2012). ITF varies from intraseasonal to decadal time scales. On seasonal time scale, South China Sea Throughflow controls freshwater flux and modulates the main ITF (Fang et al., 2010606; Susanto et al., 2013607; Lee et al., 2019608; Wang et al., 2019609; Wei et al., 2019610). During the extreme El Niño of 1997–1998, the ITF transport was reduced to 9.2 x 10⁶ m3 s–1. Based on observations and proxy records from satellite altimetry and gravimetry, in the last two decades, 1992–2012, ITF has been stronger (Sprintall and Revelard, 2014611; Liu et al., 2015a612; Susanto and Song, 2015613), which translates to an increase in ocean heat-flux into the Indian Ocean (Lee et al., 2015b614). Exchanges of heat and fresh water between ocean basins are important at the global scale (Flato et al., 2013615). ITF may have played a key role in the slowdown of the Pacific SST warming during 1998–2013, and the rapid warming in the surface and subsurface Indian Ocean during this period (Section 6.5.1.2; Makarim et al., 2019616), by transferring warm water from the western Pacific into the Indian Ocean (Lee et al., 2015b617; Dong and McPhaden, 2018618). 

Under 1.5°C warming both El Niño and La Niña frequencies may increase (see Section 6.5) and hence ITF variability may also increase. ITF is also influenced by the IOD events, with an increase in transport during a positive IOD and vice-versa during a negative IOD event (Potemra and Schneider, 2007619; Pujiana et al., 2019620). Positive IODs are projected to increase threefold in the 21st century as a response to changes in the mean state rather than changes in the El Niño frequency (Section 6.5.1.2; Cai et al., 2014b621) and this may have an impact on the ITF, additional to the changes due to increasing extreme ENSO events. In response to greenhouse warming, climate models predict that on interannual time scale, it is likely that the mean ITF may decrease due to wind variability (Sen Gupta et al., 2016), but recent observation trend tends to strengthen which has led to speculations about the fidelity of the current climate models (Chung et al., 2019622). On multidecadal and centennial timescales, it is likely that mean ITF decreases which is not associated with wind variability but due to reduction of net deep ocean upwelling in the tropical South Pacific (Sen Gupta et al., 2016; Feng et al., 2017623; Feng et al., 2018624). Due to a lack of long-term sustained ITF observations, their impacts on Indo-Pacific climate varibility, biogeochemisty, ecosystem as well as society are not fully understood.

Pacific SST cooling trends and strengthened the equatorial Pacific trade winds have been linked to anomalously warm tropical Indian and Atlantic oceans. The period following the mid-1990s saw a marked strengthening of both the easterly trade winds in the central equatorial Pacific (Figure 6.7) and the Walker circulation (L’Heureux et al., 2013; England et al., 2014625). Both the magnitude and duration of this trend are large when compared with past variability reconstructed using atmosphere reanalyses. (The 1886–1905 extreme weakening trend is poorly constrained by observations and we note the disparity between reanalysis products going back in time.) Moreover, it is very unusual when model simulations are used as an estimate of internal climate variability (Figure 6.7; England et al., 2014629; Kociuba and Power, 2015630). The slowdown in global surface warming is dominated by the cooling in the Pacific SSTs, which is associated with a strengthening of the Pacific trade winds (Kosaka and Xie, 2013631). This pattern leads to cooling over land and possibly to additional heat uptake by the ocean, although recent studies suggest that ocean heat uptake may even slow down during surface warming slowdown periods (Xie et al., 2016632; von Känel et al., 2017). The intensification of the Pacific trade winds has been related to inter-ocean basin SST trends, with rapid warming in the Indian (see section 6.5.1.2) and Atlantic Oceans both hypothesised as drivers (Kucharski et al., 2011633; Luo et al., 2012634; McGregor et al., 2014635; Zhang and Karnauskas, 2017636). While the extreme event of strengthening trade winds are potentially a result of natural internal variability, a role of anthropogenic contribution has not been ruled out. Nevertheless, the CMIP5 models indicate no general change in trends into the future (Figure 6.7), giving more weight to natural internal variability as an explanation. 

Figure 6.7

Figure 6.7 | Running twenty-year trends of zonal wind stress over the central Pacific (area-averaged over 8oS–8oN and 160oE–150oW) in Coupled Model Intercomparison Project Phase 5 (CMIP5) models and three reanalyses: European Centre for Medium-Range Weather Forecasts (ECMWF) Interim re-analysis, ERA-Interim (Dee et al. 2011), ECMWF 20th century reanalysis, ERA-20C (Poli et al. 2016), and […]

Figure 6.7 | Running twenty-year trends of zonal wind stress over the central Pacific (area-averaged over 8oS–8oN and 160oE–150oW) in Coupled Model Intercomparison Project Phase 5 (CMIP5) models and three reanalyses: European Centre for Medium-Range Weather Forecasts (ECMWF) Interim re-analysis, ERA-Interim (Dee et al. 2011626), ECMWF 20th century reanalysis, ERA-20C (Poli et al. 2016627), and the National Oceanic and Atmospheric Administration’s (NOAA) 20th century reanalysis, NOAA 20CR v2c (Compo et al. 2011628). The 66% and 100% ranges of all available CMIP5 historical simulations with Representative Concentration Pathway (RCP)8.5 extension are shown.

Among the number of potential causes of this decadal variability in surface global temperature, a prolonged negative phase of the Pacific Decadal Oscillation/Interdecadal Pacific Oscillation (PDO/IPO) was suggested as a contributor. Because of the magnitude and duration of this Pacific-centred variability (Figure 6.7), it is identified as an extreme decadal climate event. One line of research has explored the role of the warm tropical Atlantic decadal variability in forcing the trade wind trends and associated cooling Pacific SST trends (Kucharski et al., 2011637; McGregor et al., 2014638; Li et al., 2016b639). It appears that climate models may misrepresent this link due to tropical Atlantic biases (Kajtar et al., 2018640; McGregor et al., 2018641) and thus potentially underestimate global mean temperature decadal variability. Nevertheless, there is no indication that such an underestimation of global temperature variability is evident in the models (Flato et al., 2013642; Marotzke and Forster, 2015643). The impact of modes of natural variability on global mean temperature decadal variability remains an active area of research.

In the Indian Ocean, water exits the Indonesian Seas mostly flowing westward along with the South Equatorial Current, and some supplying the Leeuwin Current. The South Equatorial Current feeds the heat and biogeochemical signatures from the Indian Ocean into the Agulhas Current, which transports it further into the Atlantic Ocean. Observations of Mozambique Channel inflow from 20032012 measured a mean transport of 16.7 x 10⁶ m3 s–1 with a maximum in austral winter, and IOD related interannual variability of 8.9 x 10⁶ m3 s–1 (Ridderinkhof et al., 2010644). A multidecadal proxy, from three years of mooring data and satellite altimetry, suggests that the Agulhas Current has been broadening since the early 1990s due to an increase in eddy kinetic energy (Beal and Elipot, 2016645). Numerical model experiments suggest an intensification of the Agulhas leakage since the 1960s, which has contributed to the warming in the upper 300 m of the tropical Atlantic Ocean (Lübbecke et al., 2015646). Agulhas leakage is found to covary with the AMOC on decadal and multi-decadal timescales and has likely contributed to the AMOC slowdown (Biastoch et al., 2015647; Kelly et al., 2016648). Meanwhile, climate projections indicate that Agulhas leakage is likely to strengthen and may partially compensate the AMOC slowdown projected by coarse-resolution climate models (Loveday et al., 2015649).

6.6.2

Impacts on Natural and Human Systems

Interannual to decadal variability of Indo-Pacific SST variability is likely to affect extreme hydroclimate in East Africa (Ummenhofer et al., 2018650). The Pacific cooling pattern is often synonymous with predominance of La Niña events in 1998 and 2012 is linked to megadroughts in the USA (Baek et al., 2019651). On decadal to multidecadal time scales, PDO/IPO and Atlantic variability may have impacts on megadroughts in North America (Coats et al., 2016652; Diodato et al., 2019653) and Australia (Vance et al., 2015654) as well as Indian subcontinent (Bao et al., 2015655; Joshi and Rai, 2015656). It is likely that occurrence of megadroughts in North America and Australia increased (Kiem et al., 2016657; Baek et al., 2019658). PDO and North Pacific Gyre Oscillation may also influence the decadal variability of North Pacific nutrient, chlorophyll and zooplankton taxa (Di Lorenzo et al., 2013).

The Pacific cooling pattern may have significant impacts on terrestrial carbon uptake via teleconnections. The reduced ecosystem respiration due to the smaller warming over land has significantly accelerated the net biome productivity and therefore increased the terrestrial carbon sink (Ballantyne et al., 2017659) and paused the growth rate of atmospheric CO2 despite increasing anthropogenic carbon emissions (Keenan et al., 2016660). During the 2000s, the global ocean carbon sink has also strengthened (Fay and McKinley, 2013661; Landschützer et al., 2014662; Majkut et al., 2014663; Landschützer et al., 2015664; Munro et al., 2015665), reversing a trend of stagnant or declining carbon uptake during the 1990s. It has been suggested that the upper ocean overturning circulation has weakened during the 2000s thereby decreasing the outgassing of natural CO2, especially in the Southern Ocean (Landschützer et al., 2015666), and enhanced the global ocean CO2 sink (DeVries et al., 2017667). How this is connected to the global warming slowdown is currently unclear.

6.7

Risks of Abrupt Change in Ocean Circulation and Potential Consequences

6.7.1

Key Processes and Feedbacks, Observations, Detection and Attribution, Projections

6.7.1.1

Observational and Model Understanding of Atlantic Ocean Circulation Changes

Palaeo-reconstructions indicate that the North Atlantic is a region where rapid climatic variations can occur (IPCC, 2013668). Deep waters formed in the northern North Atlantic induces a large-scale AMOC which transports large amounts of heat northward across the hemispheres, explaining part of the difference in temperature between the two hemispheres, as well as the northward location of the ITCZ (e.g., Buckley and Marshall, 2016). This circulation system is believed to be a key tipping point of the Earth’s climate system (IPCC, 2013669).

Considerable effort has been dedicated in the last decades to improve the observation system of the large-scale ocean circulation (e.g., Argo and its array of about 3,800 free-drifting profiling floats), including the AMOC through dedicated large-scale observing arrays (at 16°N (Send et al., 2011) and 26°N (McCarthy et al., 2015b670), in the subpolar gyre (SPG) (Lozier et al., 2017671), between Portugal and the tip of Greenland (Mercier et al., 2015672), at 34.5°S (Meinen et al., 2013673), among others). The strength of the AMOC at 26°N has been continuously estimated since 2004 with an annual mean estimate of 17 ± 1.9 x 10⁶ m3 s–1 over the 2004–2017 period (Smeed et al., 2018674). The AMOC at 26°N has been 2.7 x 10⁶ m3 s–1 weaker in 2008-2017 than in the first four years of measurement (Smeed et al., 2018675). However, the record is not yet long enough to determine if there is a long-term decline of the AMOC. McCarthy et al. (2012) reported a 30% reduction in the AMOC in 2009–2010, followed by a weaker minimum a year later. Analysis of forced ocean models suggests such events may occur once every two or three decades (Blaker et al., 2015676). At 34.5°S, the mean AMOC is estimated as 14.7 ± 8.3 x 10⁶ m3 s–1 over the period 2009–2017 (Meinen et al., 2018677) also with large interannual variability, while no trend has been identified at this latitude. Estimates based on ocean reanalyses show considerable diversity in their AMOC mean state, and its evolution over the last 50 years (Karspeck et al., 2017678; Menary and Hermanson, 2018679), because only very few deep ocean observations before the Argo era, starting around 2004, are available. During the Argo era, the reanalyses agree better with each other (Jackson et al., 2016680).

During the last interglacial warm period, palaeo-data suggest that the AMOC may have been weaker (Govin et al., 2012681) and also show proxy record evidences of instabilities (Galaasen et al., 2014682). Based on an AMOC reconstruction using SST fingerprints, it has been suggested that the AMOC may have experienced around 3 ± 1 x 10⁶ m3 s–1 of weakening (about 15% decrease) since the mid-20th century (Caesar et al., 2018683). Such a trend in AMOC was also suspected in a former study using Principal Component Analysis of SST (Dima and Lohmann, 2010684). Palaeo-proxies also highlight that the historical era may exhibit an unprecedented low AMOC over the last 1,600 years (Sherwood et al., 2011685; Rahmstorf et al., 2015686; Thibodeau et al., 2018687; Thornalley et al., 2018688). Nevertheless, these proxy records are indirect measurements of the AMOC so that considerable uncertainty remains concerning these results. Moreover, the exact mechanisms to explain such a long-term weakening are not fully understood and some reconstructions show a weakening starting very early in the historical era, when the level of anthropogenic perturbation and warming was very low. Climate model simulations (Figure 6.8) do show a weakening over the historical era, but this weakening is mainly occurring over the recent decades. Climate projections exhibit a weakening of around 1.4 ± 1.4 x 10⁶ m3 s–1 for present day (2006–2015) minus pre-industrial (1850–1900), highlighting that anthropogenic warming may have already forced an AMOC weakening. Nevertheless, no proper detection and attribution of the on-going changes has been led so far due to still limited observational evidences. Thus, we conclude that there is medium confidence that the AMOC has weakened over the historical era but there is insufficient evidence to quantify a likely range of the magnitude of the change.

Examination of 14 models from the CMIP5 archive, which do not take into account the melting (either from runoff, basal melting or icebergs) from the GIS (cf. Section 6.7.1.2), led to the assessment that the AMOC is very unlikely to collapse in the 21st century in response to increasing GHG concentrations (IPCC, 2013689). Nonetheless, the CMIP5 models agree that a weakening of the AMOC into the 21st century will lead to localised cooling (relative to the global mean) centred in the North Atlantic SPG (Menary and Wood, 2018690), although the precise location as well as the extension of this cooling patch, notably towards Europe, remains uncertain (Sgubin et al., 2017691; Menary and Wood, 2018692).

Abrupt variations in SST or sea ice cover have been found in 19 out of the 40 models of the CMIP5 archive (Drijfhout et al., 2015693). Large cooling trends, which can occur in a decade, are found in the subpolar North Atlantic in 9 out of 40 models. Results show that the heat transport in the AMOC plays a role in explaining such a rapid cooling, but other processes are also key for setting the rapid (decadal-scale) timeframe of SPG cooling, notably vertical heat transport in the ocean and interactions with sea ice and the atmosphere (Sgubin et al., 2017694). Using the representation of stratification as an emergent constraint, rapid changes in subpolar convection and associated cooling are occurring in the 21st century in 5 of the 11 best models (Sgubin et al., 2017695). The poor representation of ocean deep convection in most CMIP5 models has been confirmed in Heuze (2017), which can notably limit a key feedback mechanism related with warm summer in the North Atlantic and its impact on oceanic convection in winter (Oltmanns et al., 2018697). Thus, there is low confidence in the projections of SPG fate. Increasing the horizontal resolution of the ocean in next generation climate models might be a way to increase confidence in ocean convection future changes.

The SPG dynamical system has been identified as a tipping element of the climate system (Mengel et al., 2012699; Born et al., 2013700). If this element reaches its tipping point, the SPG circulation can change very abruptly between different stable steady states, due to positive feedback between convective activity and salinity transport within the gyre (Born et al., 2016). It has been argued that a transition between two SPG stable states can explain the onset of the Little Ice Age that may have occurred around the 14–15th century (Lehner et al., 2013701; Schleussner et al., 2015702; Moreno-Chamarro et al., 2017703) possibly triggered by large volcanic eruption (Schleussner and Feulner, 2013704). Furthermore a few CMIP5 climate models also showed a rapid cooling in the SPG within the 1970s cooling events, as a nonlinear response to aerosols (Bellucci et al., 2017705). The SPG therefore appears as a tipping element in the climate system, with a faster (decade) response than the AMOC (century), but with lower induced SST cooling. Thus, the SPG system can cross a threshold in climate projections when surface water in the subpolar becomes lighter due to increase in temperature and decrease in salinity related with changes in radiative forcing (Sgubin et al., 2017706).

Figure 6.8

Figure 6.8 | Atlantic Meridional Overturning Circulation (AMOC) changes at 26oN as simulated by 27 models (only 14 were shown in the IPCC 5th Assessment Report (AR5); IPCC, 2013). The dotted line shows the observation-based estimate at 26oN (McCarthy et al. 2015b) and the thick grey/blue/red lines the multi-model ensemble mean. Values of AMOC maximum […]

Figure 6.8 | Atlantic Meridional Overturning Circulation (AMOC) changes at 26oN as simulated by 27 models (only 14 were shown in the IPCC 5th Assessment Report (AR5); IPCC, 2013). The dotted line shows the observation-based estimate at 26oN (McCarthy et al. 2015b) and the thick grey/blue/red lines the multi-model ensemble mean. Values of AMOC maximum at 26oN (in units 106 m3 s–1) are shown in historical simulations (most of the time 1850–2005) followed for 2006–2100 by a) Representative Concentration Pathway (RCP)2.6 simulations and b) RCP8.5 simulations. In c) and d), the time series show the AMOC strength relative to the value during 2006–2015, a period over which observations are available. c) shows historical followed by RCP2.6 simulations and d) shows historical followed by RCP8.5 simulations. The 66% and 100% ranges of all-available CMIP5 simulations are shown in grey for historical, blue for RCP2.6 scenario and red for RCP8.5 scenario.

Evaluation of AMOC variations in the CMIP5 database has been further analysed in this report (Figure 6.8) using almost twice as many models as in AR5 (IPCC, 2013707). The AR5 assessment of a very unlikely AMOC collapse has been confirmed, although one model (FGOALS-s2) does show such a collapse (e.g., decrease larger than 80% relative to present day) before the end of the century for RCP8.5 scenario (Figure 6.8). Now based on up to 27 model simulations, the decrease of the AMOC is assessed to be of -2.1 ± 2.6 x 10⁶ m3 s–1 (-11 ± 14%, likely range) in 2081–2100 relative to present day (2006–2015) for RCP2.6 scenario and –5.5 ± 2.7 x 10⁶ m3 s–1 (-32 ± 14%) for RCP8.5 scenario, in line with a process-based probabilistic assessment (Schleussner et al., 2014708). Furthermore, the uncertainty in AMOC changes has been shown to be mainly related to the spread in model responses rather than scenarios (RCP4.5 and RCP8.5) or internal variability uncertainty (Reintges et al., 2017709). This behaviour is very different from the uncertainty in global SST changes, which is mainly driven by emission scenario after a few decades (Frölicher et al., 2016711). To explain the AMOC decline, a new mechanism has been proposed on top of the classical changes in heat and freshwater forcing (Gregory et al., 2016712). A potential role for sea ice decrease has been highlighted (Sevellec et al., 2017713), due to large heat uptake increase in the Arctic leading to a strong warming of the North Atlantic, increasing the vertical stability of the upper ocean, as already observed in the Greenland and Iceland seas (Moore et al., 2015714). It has also been showed that convection sites may move northward in future projections, following the sea ice edge (Lique and Thomas, 2018715).

6.7.1.2

Role of GIS Melting and their Freshwater Release Sources

Satellite data indicate accelerated mass loss from the GIS beginning around 1996, and freshwater contributions to the subpolar North Atlantic from Greenland, Canadian Arctic Archipelago glaciers and sea ice melt totalling around 60,000 m3 s–1 in 2013, a 50% increase since the mid-1990s (Yang et al., 2016b), in line with more recent estimates (Bamber et al., 2018). This increase in GIS melting is unprecedented over the last 350 years (Trusel et al., 2018). Since the mid-1990s, there has been about a 50% decrease in the thickness of the dense water mass formed in the Labrador Sea, suggesting a possible relationship between enhanced freshwater fluxes and suppressed formation of North Atlantic Deep Water (Yang et al., 2016b). This hypothesis has been further supported by high-resolution ocean-only simulations showing that GIS melting may have affected the Labrador Sea convection since 2010, which may imply an emerging on-going impact of this melting on the SPG but a still non-detectable impact on the AMOC (Boning et al., 2016). Thus, while some studies argue that this melting may have affected the evolution of the AMOC over the 20th century (Rahmstorf et al., 2015; Yang et al., 2016b), considerable variability and limitation in ocean models restrain the full validation of this hypothesis, which remains model dependent (Proshutinsky et al., 2015; Dukhovskoy et al., 2016). Furthermore, some deep convection events resumed since 2014 (Yashayaev and Loder, 2017). 

The impact of GIS melting is neglected in AR5 projections (Swingedouw et al., 2013) but has been considered in a recent multi-model study (Bakker et al., 2016; Figure 6.9). The decrease of the AMOC in projections including this melting term is depicted in Figure 6.9. GIS melting estimates added in those simulations were based on the Lenaerts et al. (2015) approach, using a regional atmosphere model to estimate GIS mass balance. Results from eight climate models and an extrapolation by an emulator calibrated on these models showed that GIS melting has an impact on the AMOC, potentially adding up to around 5–10% more AMOC weakening in 2100 under RCP8.5. Based on Figure 6.8 and 6.9, the risk of collapse before the end of the century is very unlikely, although biases in present-day climate models only provide medium confidence in this assessment. By 2290–2300, Bakker et al. (2016; Figure 6.9) estimated at 44% the likelihood of an AMOC collapse in RCP8.5 scenario, while the AMOC weakening stabilises in RCP4.5 (37% reduction, (15–65%) very likely range). This result suggests that an AMOC collapse can be avoided in the long term by mitigation.

Concerning the question of the reversibility of the AMOC, a few ramp-up/ramp-down simulations have been performed to evaluate it for transient time scales (a few centuries, while millennia will be necessary for a full steady state). Results usually show a reversibility of the AMOC (Jackson et al., 2014; Sgubin et al., 2015) although the timing and amplitude is highly model dependent (Palter et al., 2018). A hysteresis behaviour of the AMOC in response to freshwater release has been found in a few climate models (Hawkins et al., 2011; Jackson et al., 2017) even at the eddy resolving resolution (Mecking et al., 2016; Jackson and Wood, 2018). This is in line with the possibility of tipping point in the AMOC system. The biases of present-day models in representing the transport at 30°S (Deshayes et al., 2013; Liu et al., 2017a; Mecking et al., 2017) or the salinity in the tropical era (Liu et al., 2014b) may considerably affect the sensitivity of the models to freshwater release, but more on the multi-centennial time scale. 

Figure 6.9

Figure 6.9 | The changes in the Atlantic Meridional Overturning Circulation (AMOC) strength as a function of transient changes in global mean temperature for projections from RCP4.5 and RCP8.5 scenario. This probabilistic assessment of annual mean AMOC strength changes (%) at 26oN (below 500 m and relative to 1850–1900) as a function of global temperature […]

Figure 6.9 | The changes in the Atlantic Meridional Overturning Circulation (AMOC) strength as a function of transient changes in global mean temperature for projections from RCP4.5 and RCP8.5 scenario. This probabilistic assessment of annual mean AMOC strength changes (%) at 26oN (below 500 m and relative to 1850–1900) as a function of global temperature change (degrees Celsius; relative to 1850–1900) results from 10,000 RCP4.5 and 10,000 RCP8.5 experiments over the period 2006–2300, which are derived from an AMOC emulator calibrated with simulations from eight climate models including the Greenland Ice Sheet (GIS) melting (Bakker et al. 2016). The annual mean AMOC strength changes are taken from transient simulations and are therefore not equilibrium values per se. Moreover, it should be stressed that the results stem from future runs, not past or historical runs. Thus, due to internal variability both in the global mean temperature and AMOC in this transient simulation, large weakening can be found even at 0oC global warming. The ranges (66%, 90% and 99%) correspond to the amount of simulations that are within each envelope. The thick black line corresponds to the ensemble mean, while the different colours stand for different probability quantiles. The horizontal black thick line corresponds to the value of 80% of AMOC decrease, which can be seen as an almost total collapse of the AMOC. The horizontal black dashed thick line corresponds to a reduction of 50% of the AMOC, which can be considered as a substantial weakening. The vertical dashed green line stands for the 1.5oC of global warming threshold (relative to 1850–1900). The violet cross stands for the observation-based reduction estimate from Caesar et al. (2018). The size of the cross represents the uncertainty in this estimate.

6.7.2

Impacts on Climate, Natural and Human Systems

Even though the AMOC is very unlikely to collapse over the 21st century, its weakening may be substantial, which may therefore induce strong and large-scale climatic impacts with potential far-reaching impacts on natural and human systems (e.g., Good et al., 2018). Furthermore, the SPG subsystem has been shown to potentially shift, in the future, into a cold state over a decadal time scale, with significant climatic implications for the North Atlantic bordering regions (Sgubin et al., 2017). There have been far more studies analysing impacts on climate of an AMOC weakening than SPG collapse. We will thus in the following mainly depict impacts of an AMOC substantial weakening. 

The AR5 report concludes that based on palaeoclimate data, large changes in the Atlantic Ocean circulation can cause worldwide climatic impacts (Masson-Delmotte et al., 2013), with notably, for an AMOC weakening, a cooling of the North Atlantic, a warming of the South Atlantic, less evaporation and therefore precipitation over the North Atlantic, and a shift of the ITCZ. Impacts of AMOC or SPG changes and their teleconnections in the atmosphere and ocean are supported by a large amount of palaeo-evidence (Lynch-Stieglitz, 2017). Such impacts and teleconnections have been further evaluated over the last few years both using new palaeo-data and higher resolution models. Furthermore, multi-decadal variations in SST observed over the last century, the so-called Atlantic Multidecadal Variability (AMV) or Atlantic Multidecadal Oscillation (AMO), also provide observational evidence of potential impacts of changes in ocean circulation. Nevertheless, due to a lack of long-term direct measurements of the Atlantic Ocean circulation, the exact link between SST and circulation remains controversial (Clement et al., 2015; Zhang, 2017). 

The different potential impacts of large changes in the Atlantic Ocean circulation are summarised in Figure 6.10. Based on variability analysis, it has been shown that a decrease in the AMOC strength has impacts on storm track position and intensity in the North Atlantic (Gastineau et al., 2016), with a potential increase in the number of winter storms hitting Europe (Woollings et al., 2012; Jackson et al., 2015), although some uncertainty remains with respect to the models considered (Peings et al., 2016). The influence on the Arctic sea ice cover has also been evidenced at the decadal scale, with a lower AMOC limiting the retreat of Arctic sea ice (Yeager et al., 2015; Delworth and Zeng, 2016). The climatic impacts could be substantial over Europe (Jackson et al., 2015), where an AMOC weakening can lead to high pressure over the British Isles in summer (Haarsma et al., 2015), reminiscent of a negative summer NAO, inducing an increase in precipitation in Northern Europe and a decrease in Southern Europe. In winter, the response of atmospheric circulation may help to reduce the cooling signature over Europe (Yamamoto and Palter, 2016), notably through an enhancement of warming maritime effect due to a stronger storm track (Jackson et al., 2015), driving more powerful storms in the North Atlantic (Hansen et al., 2016). The observed extreme low AMOC in 2009–2010, which was followed by a reduction in ocean heat content to the north (Cunningham et al., 2013), has been possibly implicated in cold European weather events in winter 2009–2010 and December 2010 (Buchan et al., 2014) although a robust attribution is missing. In summer, cold anomalies in the SPG, like the one occurring during the so-called cold blob (Josey et al., 2018), have been suspected to potentially enhance the probability of heatwaves over Europe in summer (Duchez et al., 2016). Nevertheless, considerable uncertainties remain with regard to this aspect due to the lack of historical observations before 2004 and due to poor model resolution of small-scale processes related to frontal dynamics around the Gulf Stream region (Vanniere et al., 2017). In addition, oceanic changes in the Gulf Stream region may occur in line with AMOC weakening (Saba et al., 2016) with potential rapid warming due to a northward shift of the Gulf Stream. However, these changes are largely underestimated in coarse resolution models (Saba et al., 2016) . In North America, a negative phase of the AMV, reminiscent of a weakening of the AMOC, lowers agricultural production in a few Mexican coastal states (Azuz-Adeath et al., 2019).

Changes in ocean circulation can also strongly impact sea level in the regions bordering the North Atlantic (McCarthy et al., 2015a; Palter et al., 2018). A collapse of the AMOC or of the SPG could induce substantial increase of sea level up to a few tens of centimetres along the western boundary of the North Atlantic (Ezer et al., 2013; Little et al., 2017; cf. Chapter 5). For instance, such a link may explain 30% of the extreme observed SLR event (a short-lived increase of 12 mm during 2 years) in northeast America in 2009–2010 (Ezer, 2015; Goddard et al., 2015). This illustrates that monitoring changes in AMOC may have practical implications for coastal protection.

The AMOC teleconnections are widespread and notably strongly affect the tropical area, as evidenced in palaeo-data for the Sahel region (Collins et al., 2017; Mulitza et al., 2017) and in model simulations (Jackson et al., 2015; Delworth and Zeng, 2016). These teleconnections may affect vulnerable populations. For instance, Defrance et al. (2017) found that a substantial decrease in the AMOC, at the very upper end of potential changes, may strongly diminish precipitation in the Sahelian region, decreasing the millet and sorghum emblematic crop production, which may impact subsistence of tens of millions of people, increasing their potential for migration. Smaller amplitude variations in Sahelian rainfall, driven by North Atlantic SST, has been found to be predictable up to a decade ahead (Gaetani and Mohino, 2013; Mohino et al., 2016; Sheen et al., 2017), potentially providing mitigation and adaptation opportunities. The number of tropical storms in the North Atlantic has been found to be very sensitive to the AMOC (Delworth and Zeng, 2016; Yan et al., 2017) as well as to the SPG (Hermanson et al., 2014) variations, so that a large weakening of the AMOC or cooling of the SPG may decrease the number of Atlantic tropical storms. The Asian monsoon may also potentially weaken in the case of large changes in the AMOC (Marzin et al., 2013; Jackson et al., 2015; Zhou et al., 2016; Monerie et al., 2019) implying substantial adverse impacts on populations. The interactions of the Atlantic basin with the Pacific has also been largely discussed over the last few years, with the supposed influence of a cool North Atlantic inducing a warm tropical Pacific (McGregor et al., 2014; Chafik et al., 2016; Li et al., 2016b), although not found in all models (Swingedouw et al., 2017), which may induce stronger amplitudes of El Niño (Dekker et al., 2018).

Figure 6.10

Figure 6.10 | Infographic on teleconnections and impacts due to Atlantic Meridional Overturning Circulation (AMOC) collapse or substantial weakening. Changes in circulation have multiple impacts around the Atlantic Basin, but also include remote impacts in Asia and Antarctica. Reductions in AMOC lead to an excess of heat in the South Atlantic, leading to increased flooding, […]

Figure 6.10 | Infographic on teleconnections and impacts due to Atlantic Meridional Overturning Circulation (AMOC) collapse or substantial weakening. Changes in circulation have multiple impacts around the Atlantic Basin, but also include remote impacts in Asia and Antarctica. Reductions in AMOC lead to an excess of heat in the South Atlantic, leading to increased flooding, methane emissions and drought, and a concomitant negative impact on food production and human systems. In the North Atlantic region hurricane frequency is decreased on the western side of the basin, but storminess increases in the east. Marine and terrestrial ecosystems, including food production, are impacted while sea level rise (SLR) is seen on both sides of the Atlantic. The arrows indicate the direction of the change associated with each icon and is put on its right. An assessment of the confidence level in the understanding of the processes at play is indicated below each arrow.

The AMOC plays an important function in transporting excess heat and anthropogenic carbon from the surface to the deep ocean (Kostov et al., 2014; Romanou et al., 2017), and therefore in setting the pace of global warming (Marshall et al., 2014). A large potential decline in the AMOC strength reduces global surface warming. This is due to changes in the location of ocean heat uptake and associated expansion of the cryosphere around the North Atlantic, which increases surface albedo (Rugenstein et al., 2013; Winton et al., 2013), as well as cloud cover variations and modifications in water vapour content (Trossman et al., 2016). As the uptake of excess heat occurs preferentially in regions with delayed warming (Winton et al., 2013; Frölicher et al., 2015; Armour et al., 2016), a potential large reduction of the AMOC may shift the uptake of excess heat from the low to the high latitudes (Rugenstein et al., 2013; Winton et al., 2013), where the atmosphere is more sensitive to external forcing (Winton et al., 2010; Rose et al., 2014; Rose and Rayborn, 2016; Rugenstein et al., 2016). A decrease in AMOC may also decrease the subduction of anthropogenic carbon to deeper waters (Zickfeld et al., 2008; Winton et al., 2013; Randerson et al., 2015; Rhein et al., 2017). A potential impact of methane emissions has also been highlighted for past Heinrich events during which massive icebergs discharge in the North Atlantic may have led to large AMOC disruptions. Large increases (>100 ppb) in methane production have been associated with these events (Rhodes et al., 2015) potentially due to increased wetland production in the SH, related to teleconnections of the North Atlantic with tropical area (Ringeval et al., 2013; Zurcher et al., 2013). All these different effects indicate a potentially positive feedback of the AMOC on the carbon cycle (Parsons et al., 2014), although other elements from the terrestrial biosphere may limit its strength or even reverse its sign (Bozbiyik et al., 2011). 

Changes in Atlantic Ocean circulation can also strongly impact marine life and can be seen at all levels of different ecosystems. For instance, changes in the abundance and distribution of species in response to circulation changes in the SPG have been documented amongst plankton (Hátún et al., 2009), fish (Payne et al., 2012; Miesner and Payne, 2018), seabirds (Descamps et al., 2013) and top predators such as tuna, billfish and pilot whales (Hátún et al., 2009; MacKenzie et al., 2014). Nutrient concentrations in the northeast Atlantic have also been shown to be limited by the recent weakening of the SPG, with concomitant ecosystem impacts (Johnson et al., 2013; Hátún et al., 2016). The influence of SPG circulation also extends to ecosystems beyond from the immediate area, and has a clear impact on the productivity of cod (Gadus morhua) in the Barents Sea, for example (Årthun et al., 2017; Årthun et al., 2018). On a broader scale, changes in the AMOC are an important driver of AMV, which has also been linked to substantial changes in marine ecosystems on both sides of the North Atlantic (Alheit et al., 2014; Nye et al., 2014). Recent AMOC weakening is also suspected to explain large marine deoxygenation in the northwest coastal Atlantic (Claret et al., 2018). In addition, a recent study using a marine productivity proxy from Greenland ice cores suggest that net primary productivity has decreased by 10 ± 7% in the subarctic Atlantic over the past two centuries possibly related to changes in AMOC (Osman et al., 2019). Finally, a model study investigated the impact of mitigation by reversing the forcing from a RCP8.5 scenario from 2100 and found that global marine net productivity may recover very rapidly and even overshoot contemporary values at the end of the reversal, highlighting the potential benefit of mitigation (John et al., 2015).

Following all these potential impacts, it has been suggested that a collapse of the AMOC may have the potential to induce a cascade of abrupt events, related to the crossing of thresholds from different tipping points, itself potentially driven by GIS rapid melting. For example, a collapse of the AMOC may induce causal interactions like changes in ENSO characteristics (Rocha et al., 2018), dieback of the Amazon rainforest and shrinking of the WAIS due to seesaw effect, ITCZ southern migration and large warming of the Southern Ocean (Cai et al., 2016). However, such a worst case scenario remains very poorly constrained quantitatively due to the large uncertainty in GIS and AMOC response to global warming. 

The potential impacts of such rapid changes in ocean circulation on agriculture, economy and human health remain poorly evaluated up to now with very few studies on the topic (Kopits et al., 2014). The available impact literature on AMOC weakening has focussed on impacts from temperature change only (reduced warming), globally leading to economic benefits (e.g., Anthoff et al., 2016), and local losses can amount to a few percent of gross domestic product (GDP), however under a complete shutdown (Link and Tol, 2011). Declines in Barents Sea fish species could lead to economic losses (Link and Tol, 2009), but more comprehensive economic studies are lacking.

6.7.3

Risk Management and Adaptation

The numerous potential impacts of AMOC weakening (see Section 6.7.2) require adaptation responses. A specific adaptation action is a monitoring and early warning system using observation and prediction systems, which can help to respond in time to effects of an AMOC decline. Although it is difficult to warn very early for large changes in AMOC to come, notably due to large natural decadal variability of the AMOC (Boulton et al., 2014), the observation arrays that are in place may allow the development of such an early warning system. Nevertheless, the prospects for its operational use for early warnings have not yet been fully developed. In this respect, developing early warning systems that do not depend on statistical timeseries analysis of long observational record might be seen as an important research goal in the future.

Decadal prediction systems can help fill this gap. Skilful prediction of AMOC variation has been demonstrated on the multi-annual scale (Matei et al., 2012) and retrospective prediction experiments have demonstrated that the large changes in the SPG seen in the mid-1990s could have been foreseen several years in advance (Wouters et al., 2013; Msadek et al., 2014). The World Climate Research Programme’s grand challenge of launching decadal predictions every year (Kushnir et al., 2019) is an important step towards anticipating rapid changes in the near term and can drive decadal-scale climate services. For example, a few studies have already shown that small variations anticipated by decadal predictions (e.g., Sheen et al., 2017) can be useful for the development of climate services, notably for agriculture in south and east Africa (Nyamwanza et al., 2017). Decadal predictions also match the decision making time horizons of many users of the ocean (Tommasi et al., 2017b) and are expected to play an increasingly important role in this sector in the future (Payne et al., 2017).

6.8

Compound Events and Cascading Impacts

6.8.1

Concepts

Compound events refer to events that are characterised by multiple failures that can amplify overall risk and/or cause cascading impacts (Helbing, 2013; Gallina et al. 2016; Figure 6.1). These impacts may be triggered by multiple hazards that occur coincidently or sequentially and can lead to substantial disruption of natural or human systems (Leonard et al., 2014; Oppenheimer et al., 2014; Gallina et al., 2016; Zscheischler et al., 2018). These concepts are illustrated in a series of recent case studies that show how compound events interact with multiple elements of the ecosystem and society to create compound risk and cascading impacts (Box 6.1).

Compound events and cascading impacts are examples of deep uncertainty because data deficiency often prevents the assessment of probabilities and consequences of the risks from compound events. Furthermore, climate drivers that contribute to compound events could cross tipping points in the future (e.g., Cai et al., 2016; Cross-Chapter Box 4 in Chapter 1). Concepts and methods for addressing compound events and cascading impacts have a solid foundation in disaster risk reduction frameworks (Scolobig, 2017) where they may be assessed with scenarios, risk mapping, and participatory governance (Marzocchi et al., 2012; Komendantova et al., 2014). However, these approaches have tended to not consider the effects of climate change, rather considering hazards and vulnerability as stationary entities (Gallina et al., 2016). Trends in geophysical and meteorological extreme events and their interaction with more complex social, economic and environmental vulnerabilities overwhelm existing governance and institutional capacities (Shimizu and Clark, 2015) because of the aggregated cascading impacts. 

6.8.2

Multiple Hazards

Understanding regions where changes in the climate system could increase the likelihood or severity of multiple hazards is relevant to understanding compound events (Figure 6.1). Several recent studies have highlighted coastal regions that are becoming more susceptible to multiple hazards from changes in regional climate. Warming and poleward expansion of the warm western boundary current regions (WBCs; Yang et al., 2016a) together with intensified cyclogenesis in these WBC regions; the Gulf Stream (Booth et al., 2012), the Kuroshio (Hirata et al., 2016) and the East Australian Current (EAC; Pepler et al., 2016a) can increase the likelihood of multiple hazards. These include increased rates of SLR (Brunnabend et al., 2017; Zhang et al., 2017b) together with increases in severe rainfall, storm surges and associated flooding (Thompson et al., 2013; Oey and Chou, 2016; Pepler et al., 2016a). WBCs have undergone an intensification and poleward expansion in all but the Gulf Stream where the weakening of the AMOC cancelled this effect (Seager and Simpson, 2016; Yang et al., 2016a). 

Acknowledging the dual role of regional SLR and TCs frequency and intensity changes for future flood risk, Little et al. (2015) developed a flood index that takes account of local projected SLR along with TC frequency and intensity changes in a CMIP5 multi-model ensemble. They find that relative to 1986–2005, the Flood Index is 4–75 times higher by 2080–2099 for RCP2.6 (10–90th percentile range) and 35–350 times higher for RCP8.5. In the vicinity of the East Australian Current, Pepler et al. (2016b) found warmer SSTs boost the intensification of weak to moderate ETC’s. Neglecting the compounding effects of flood and extreme sea level drivers can cause significant underestimation of flood risk and projected failure probability (Wahl et al., 2016; Moftakhari et al., 2017). 

Over the last decade, several efforts have been made to address long-term shoreline change driven by the cascading impact of SLR, waves and MSL. Ranasinghe et al. (2012) presented the Probabilistic Coastline Recession model, which provides probabilistic estimates of coastline recession in response to both storms and SLR in the 21st century. Dune recession is estimated for each storm considering the recovery between storms, which is obtained empirically. More recently, Toimil et al. (2017) developed a methodology to address shoreline change over this century due to the action of waves, storm surges, astronomical tides in combination with SLR. The methodology considers the generation of thousands of multi-variate hourly time series of waves and storm surges to reconstruct future shoreline evolution probabilistically, which enables estimates of extreme recessions and long-term coastline change to be obtained. The model proposed by Vitousek et al. (2017) integrates longshore and cross-shore transport induced by GCM-projected waves and SLR, which allows it to be applied to both long and pocket sandy beaches. The analysis provides only one instance of what coastline change over the 21st century may be.

To summarise, new studies highlight regions such as coasts including those adjacent to WBCs, that are experiencing larger changes to multiple phenomena simultaneously such as SLR and cyclone intensity linked to higher SST increases (medium confidence), which increases the likelihood of extremes from multiple hazards occurring (medium confidence). Failing to account for the multiple factors responsible for extreme events will lead to an underestimation of the probabilities of occurrence (high confidence).

6.8.3

Cascading Impacts on Ecosystems

Damage and loss of ecosystems (mangrove, coral reefs, polar deserts, wetlands and salt marshes); or regime shifts in ecosystem communities lead to reduced resilience of all the ecosystems and possible flow-on effects to human systems. For example, recent studies showed that living corals and reef structures have experienced significant losses from human-related drivers such as coastal development; sand and coral mining; overfishing, acidification, and climate-related storms and bleaching events (Smith, 2011; Nielsen et al., 2012; Hilmi et al., 2013; Graham et al., 2015; Lenoir and Svenning, 2015; Hughes et al., 2017b). As a consequence, reef flattening is taking place globally due the loss of corals and from the bio-erosion and dissolution of the underlying reef carbonate structures (Alvarez-Filip et al., 2009). Reef mortality and flattening due to non-climate and climate-related drivers trigger cascading impacts and risks due to the loss of the protection services provided to coastal areas. High emission scenarios are expected to lead to almost the complete loss of coral cover by 2100, although policies aiming to lower the combined aerosol-radiation interaction and aerosol-cloud interaction (e.g., IPCC RCP 6.0) may partially limit the impacts on coral reefs and the associated habitat loss, thereby preserving an estimated 14 to 20 billion USD in consumer surplus 2100 (2014 USD, 3% discount; Speers et al., 2016). Moreover, projected SLRwill increase flooding risks, and these risks will be even greater if reefs that now help protect coasts from waves are lost due to bleaching-induced mortality. 

6.8.4

Cascading Impacts on Social Systems

Impacts of compound events also have significant multi-effects in the societal system. Cascading impacts are particularly driven by the loss or (temporary) disruption of critical infrastructure (Pescaroli and Alexander, 2018), such as communications, transport, and power supply, on housing, dams and flood protection; as well as health provision. Repeated extreme and compound events are leading to critical transitions in social systems (Kopp et al., 2016) which may cause the disruption of (local) communities, creating cascading impacts consisting of short-term impacts as well as long-lasting economic effects, and in some cases migration. When the responses of the economic sector to short term weather variations are applied to long term-climate projections, risks associated with climate change on different sectors are projected to result in an average 1.2% of decrease of US GDP per degree Celsius of warming. Furthermore, broad geographical discrepancies generate a large transfer of value northwards and westwards with the expected consequence of increased economic inequality (Hsiang et al., 2017). The severity and intensity of the cascading impacts also depend on the affected societies’ vulnerability and resilience. For example, the intensity and influence of compound events are dependent on the size and scale of the affected society and the percentage of economy or GDP impacted (Handmer et al., 2012 in IPCC SREX). Smaller countries and especially small islands face the challenge of being unable to ‘hedge’ the risk through geographical redistribution (see Cross-Chapter Box 9). 

Impacts from the natural system can descend into a cascade of disasters. For example, in 2005, Hurricane Katrina led to heavy flooding in the coastal area, dike breaches, emergency response failures, chaos in evacuation (traffic jams) and social disruption. Flooding in Thailand in 2011 led to the closure of many factories which not only impacted on the country’s economy but impaired the global automobile and electronic industry (Kreibich et al., 2014). Female-owned establishments are more challenged with failures than businesses owned by men due to less experience, shorter duration and smaller size of businesses (Haynes et al., 2011; Marshall et al., 2015). The impact of compound events on ecosystems can also, in the long run, have devastating impacts on societal systems, for example, impacts from tropical storms can lead to coral degradation, which leads to increased wave impact and subsequent accelerated coastal erosion and impacts on fishing resources. This subsequently can have an impact on local economies, potentially leading to social disruption and migration (Saha, 2017). Impacts on marine ecosystems and habitats will also affect subsistence and commercial fisheries and, as a result, food security (Barrow et al., 2018). Climate-induced community relocations in Alaska stem from repeated extreme weather events coupled with climate change-induced coastal erosion and these impact the habitability of the whole community (Bronen, 2011; Durrer and Adams, 2011; Marino, 2011; Marino, 2012; Bronen and Chapin, 2013; see also Cross-Chapter Boxes 2 and 5 in Chapter 1).

6.8.5

Risk Management and Adaptation, Sustainable and Resilient Pathways

The management of compound events and cascading impacts in the context of governance poses challenges, partly because it is place dependent and heavily influenced by local parameters such as hazard experience and cultural values. Moreover, in some cases, people perceive that their community or country is less affected than others, leading to a ‘spatial optimism bias’ that delays or reduces the scope of actions (Nunn et al., 2016). In other cases it is unclear who will take responsibility when compound events and cascading impacts occur (Scolobig, 2017), although for some compound risks (e.g.,. na-tech disasters – when natural hazards trigger technological disasters), the private sector cooperates with governments to manage and respond to risks (Krausmann et al., 2017). Considerable variations exist among and inside countries. The level of engagement depends on the process of cascading impacts and the role of governance arrangement at the country level (Lawrence et al., 2018) countries’ capacity to develop integrated risk and disaster frameworks and regulations, viable multi-stakeholder and public-private partnership in the case of multiple technological and natural hazards (Gerkensmeier and Ratter, 2018), the initiatives of local governments to exercise compound risk operations, and experience in interagency cooperation (Scolobig, 2017). The importance of local knowledge and traditional practices in disaster risk prevention and reduction is widely recognised (Hiwasaki et al., 2014; Hilhorst et al., 2015; Audefroy and Sánchez, 2017) (high confidence). The need to strengthen DRM is evident and can be improved and communicated effectively by integrating local knowledge such as Inuit’s indigenous knowledge and local knowledge in Alaska (Pearce et al., 2015; Cross-Chapter Box 3 in Chapter 1) since it is easier for communities to accept than pure science-based DRM (Ikeda et al., 2016). 

Despite difficulties of governance and decision making, many researchers and policy makers have recognised the need to study combined climatic and other hazards and their impacts. Several methods are now being employed to assess climatic hazards and compound events simultaneously, and also in combination (Klerk et al., 2015; van den Hurk et al., 2015; Wahl et al., 2015; Zscheischler and Seneviratne, 2017; Wu et al., 2018; Zscheischler et al., 2018). Policy makers can also begin to plan for disaster risk reduction and adaptation, based on these analyses of compound events and risks. Addressing limitations in understanding the compound hazards, as well as adequate mechanisms of the cascading impacts is needed. Finally, there are limits to resources to study these complex interactions in sufficient detail, as well as limits to data and information on past events that would allow the simulation of these effects, including economic impacts.

6.8.6

Global Impact of Tipping Points

A small number of studies (Lontzek et al., 2015; Cai et al., 2016; Lemoine and Traeger, 2016) use different versions of the Dynamic Integrated Climate-Economy assessment model (Nordhaus, 1992; Nordhaus, 2017) to assess the impact of diverse sets of tipping points and causal interactions between them on the socially optimal reduction of gas emissions and the present social cost of carbon, representing the economic cost caused by an additional ton of CO2 emissions or its equivalent.

Cai et al. (2016) consider five interacting, stochastic, potential climate tipping points: reorganisation of the AMOC; disintegration of the GIS; collapse of the WAIS; dieback of the Amazon Rain Forest; and shift to a more persistent El Niño regime. The deep uncertainties associated with the likelihood of each of these tipping points and the dependence of them on the state of the others is addressed through expert elicitation. There is limited evidence, but high agreement that present costs of carbon are clearly underestimated. Double (Lemoine and Traeger, 2016), triple (Ceronsky et al., 2011), to eightfold (Cai et al., 2016) increase of the carbon price are suggested, depending on the working hypothesis. Cai et al. (2016) indicate that with the prospect of multiple interacting tipping points, the present social cost of carbon increases from 15–116 USD per tonne of CO2, and conclude that stringent efforts are needed to reduce CO2 emission if these impacts are to be avoided.

6.9

Governance and Policy Options, Risk Management, Including Disaster Risk Reduction and Enhancing Resilience

6.9.1

Decision Making for Abrupt Change and Extreme Events

As outlined earlier in this report, several approaches exist for adaptive responses towards climate change impacts. Other sections that deal with adaptation responses to extremes include Section 1.5.2, Section 4.4 (SLR and coastal flooding), Cross Chapter Box 4 in Chapter 1 and Section 5.5.2.5 in Chapter 5 (adaptation limits for coastal infrastructure and ecosystems). Here, we address adaptation responses especially to abrupt and extreme changes (for responses to special abrupt changes (e.g., AMOC; see also Section 6.7).

Since AR5, growing discussions have advocated for transformative adaptation, implying that they support fundamental societal shift towards sustainability and climate-resilient development pathways (Moloney et al., 2017; IPCC, 2018; Morchain, 2018). Successful adaptation to abrupt change and extreme events incorporates climate change concerns and the impact of climate extremes on vulnerable populations taking into account community participation and local knowledge (Tozier de la Poterie and Baudoin, 2015). These interventions reduce risk and enhance resilience, and contribute to the SDGs and social justice (Mal et al., 2018). Temporal scales denote before and after abrupt changes and extreme events (prevention and post-event response), long- and short-term adaptation measures, and the lag time between forecast, warning and event (Field et al., 2012; IPCC, 2012). Spatial dimensions include local risk management and adaptation as well as regional and international coordination to prepare for unexpected extremes tackling the impacts at multiple geographic scales (Devine-Wright, 2013; Barnett et al., 2014; Lyth et al., 2016; Barange et al., 2018). 

Decision making about abrupt change or extreme events is not autonomous; it is constrained by formal and informal institutional processes such as regulatory structures, property rights, as well as culture, traditions and social norms (Field et al., 2012; IPCC, 2012). Efforts in various countries and large cities to improve resilience and adaptation are growing, and these efforts are linked to a global network of research, information and best practices (e.g., Aerts et al., 2014). In both northern and southern high latitudes, extreme climatic conditions and remoteness from densely populated regions constrain human choices. The question is whether responses to extremes and abrupt changes require approaches that are different from the anticipatory management of adaptation to changes in climate and weather extremes. While there are several impact studies on extreme events and abrupt change, very few focus on the necessity of dedicated individual, governmental or business adaptive responses (Tol et al., 2006; Anthoff et al., 2010; Anthoff et al., 2016).

Making appropriate decisions to manage abrupt change and extreme events given deep uncertainty is challenging (Weaver et al., 2013; see Cross-Chapter Boxes 4 and 5 in Chapter 1). This requires the construction of new models integrating different uncertainties under extreme or abrupt scenarios and evaluation of value for money (Weaver et al., 2013). Examples include the inclusion of rapid SLR for assessing coastal impacts and adaptation options (Ranger et al., 2013; Haasnoot et al., 2018; see Sections 6.4 and 6.7). Decision analysis frameworks such as ‘Robust Decision Making’, ‘Decision Scaling’, ‘Assess Risk of Policy’, ‘Info-gap’, ‘Dynamic Adaptation Policy Pathways’, ‘Dynamic Adaptive Pathways Planning’, ‘Multi-Criteria Decision Analysis’, ‘Real Options Analysis’ and ‘Context-First’ accommodate a wide range of uncertainties with subsequent socio-ecological impact (Weaver et al., 2013). The central question remains, however, how one can overcome path dependencies which may cause technical lock-ins in the current system. Monitoring systems of climatic and derived variables, in order to predict necessary shifts in adaptation policies are in development (Haasnoot et al., 2015). However, these frameworks have so far been mostly applied to more gradual shifts of climate change, rather than extreme events and abrupt changes.

Request for the use of ‘actionable’ information and communication based on climate science and modelling will increase (McNie, 2007; Moser and Boykoff, 2013). Such information can only be effective when it is perceived as ‘credible, salient, and legitimate’ (Paton, 2007; Paton, 2008; Dilling et al., 2015). Since SREX (IPCC, 2012), there is medium confidence that trust in the information and the institution (Hardin, 2002; Townley and Garfield, 2013) that governs extreme events and abrupt change (Malka et al., 2009; Birkmann et al., 2011; Schoenefeld and McCauley, 2016) is important. Trust in expert and scientific knowledge helps people make sense of climate change impact and engage with adaptation measures (Moser and Boykoff, 2013; Yeh, 2016). Without such knowledge, people have little recourse to believe and evaluate relevant information (Bråten et al., 2011). Individuals who trust their government can be complacent and do not prepare for the consequences of extremes (Simpson, 2012; Edmondson and Levy, 2019), and shift the responsibility to the government (Edmondson and Levy, 2019). Familiarity with and information about hazards, community characteristics, as well as the relationship between people and government agencies influence the level of trust (Paton, 2007).

Recent literature shows that there are crucial differences between the ethical challenges of mitigation and those of adaptation (Wallimann-Helmer, 2015; Wallimann-Helmer, 2016) in their dealings with Loss and Damage (L&D); and the ongoing analysis disputes how to distribute responsibilities between mitigation and adaptation based on climate justice criteria (Wallimann-Helmer et al., 2019). The Warsaw International Mechanism on L&D under the United Nations Framework Convention on Climate Change (UNFCCC) addresses irreversible changes and limits to adaptation at the global scale (see also Cross-Chapter Box 1 in Chapter 1). This is in contrast to national and local policies, addressing impacts and adaptation. Within the SROCC report, several of the documented and projected irreversible or unavoidable and thus residual impacts beyond adaptation would potentially fall under this category (e.g., Warner and van der Geest, 2013; Huggel et al., 2019; Mechler et al., 2019), including impacts from SLR, land erosion and reduced freshwater resources on small islands, changes in high mountains and cryosphere changes, as well as changes in ocean species and resources. Apart from climate hazards, risks for L&D are also determined by increasing exposure and vulnerability (Birkmann and Welle, 2015). Such impacts can be assessed using conventional frameworks, but the debate on the precise scope of such impacts remains, including those from anthropogenic climate change impacts as well as natural climate variability and extremes (e.g., James et al., 2014). More work is required to explore the range of activities available for responding to L&D resulting from slow onset processes in the scope of the SROCC report such as ocean acidification (Harrould-Kolieb and Hoegh-Guldberg, 2019) and mountain cryosphere changes (Huggel et al., 2019).

Under the same L&D mechanism, risk transfer mechanisms and insurance have been suggested as a specific adaptation policy option. Several forms of ‘climate change’ insurance have been proposed recently, but their potential for adaptation has met with criticism, importantly because of the costs of formal insurance and other risk transfer options, as well as issues with sustainability given the lack of loss prevention and adaptation (Surminski et al., 2016; Linnerooth-Bayer et al., 2019). A compensation mechanism for low-lying small islands inclusive of L&D proposal is in progress (Adelman, 2016). Insurance (see also Section 4.4.4) can help absorb extreme shocks for both individuals, using traditional insurance and parametric insurance. Sovereign insurance mechanisms can help governments absorb large losses (Linnerooth-Bayer et al., 2019), but eventually they need to be coupled with other incentives for adaptation and risk reduction measures to be cost-effective (Botzen, 2013) (medium confidence).

There is a consensus that investing in disaster risk reduction has economic benefits, although there is medium evidence about the range of the estimated benefits which varies from a global estimate of two to four dollars saved for each dollar invested (Kull et al., 2013; Mechler, 2016) to about 400 EUR per invested 1 EUR in the case of flood early warning systems in Europe (Pappenberger et al., 2015). The US Federal Emergency Management Agency indicated that a 1% increase in annual investment in flood management decreases flood damage by 2.1% (Davlasheridze et al., 2017). Conserving ecosystems that provide services for risk reduction also has monetary benefits. Wetlands have been observed to reduce damages during storms. Wetlands and floodplains in Otter Creek (Vermont, USA) reduced damages caused by storms by 54–78% and 84–95%, respectively, for Tropical Storm Irene (Watson et al., 2016). For the whole of the USA, wetlands provide 23.2 billion USD yr-1 in storm protection services and the loss of 1 hectare of wetland is estimated to correspond to an average 33,000 USD increase in storm damage from specific storms (Costanza et al., 2008). Engineered structures are also expected to reduce risks. In Europe, to maintain the coastal flood loss constant relative to the size of the economy, flood defence structures need to be able to protect coastal areas for a projected increase of sea level between 0.52.5 m. Without these risk reduction actions, the expected damages from coastal floods could increase by two or three degrees of magnitude compared to the present (Vousdoukas et al., 2018). Although risk reduction actions are generally considered an effective way to reduce the damages by shifting the loss-exceedance curve, cost-benefit analysis of disaster risk reduction actions faces several challenges, including its limited role in informing decisions, spatial and temporal uncertainty scales, and discounting and choice of discount rate that affect cost-benefit analysis results heavily (Mechler, 2016).

6.9.2

Transformative Governance and Integrating Disaster Risk Reduction and Climate Change Adaptation

Governance for effective adaptation defined as changes in practice, process and structure (Smit et al., 2001) considers equity, legitimacy and co-benefits (Patterson et al., 2018) appropriate to the issue (Young, 2002). Countries, sectors and localities place different values and perspectives on these categories, and they can change over time (Plummer et al., 2017; see Cross-Chapter Boxes 1 and 2 in Chapter 1). Transformative governance embraces a wider application of climate change-induced mitigation and adaptation strategies to generate fundamental change. It is society-wide and goes beyond the goals of climate change policies and measures (IPCC, 2013; Patterson et al., 2018). It is distinguished from conventional strategies and solutions, as it includes both natural and human systems and intertwines with the SDGs (Fleurbaey et al., 2014; Tàbara et al., 2019). Transformational adaptation is also needed when incremental adaptation to extreme events and abrupt changes are insufficient (Kates et al., 2012). Planned retreat from SLR and climate refugees illustrate the need for transformative governance as the current coastal and risk management regimes do not have the capacity to handle these issues adequately. Inclusion of bilateral and regional agreements related to climate-induced migration (McAdam, 2011), land use planning frameworks to respond to policy, institutional and cultural implications of migration (Matthews and Potts, 2018), and identification of beneficiaries of managed retreat (Hino et al., 2017) along with positive opportunities for migrants to diversify income and avoid being in harm’s way (Gemenne, 2015) are steps towards transformative governance. Retreat and migration entail local responses that include indigenous and local knowledges and perspectives that can be applied to solve these issues (Farbotko and Lazrus, 2012; Hilhorst et al., 2015; Tharakan, 2015; Iloka, 2016; Nunn et al., 2016; see also Cross-Chapter Boxes 2 and 5 in Chapter 1). Another example is the Polar region which has started to pursue transformative governance given the potential for increased tourism and cooperation that require changed governance structure (see Sections 3.5.2; 3.5.5 and Table 3.7 in Chapter 3). Accountability for transformations and transitions has been identified as a crucial factor to support responsible action and strengthen climate governance (Edmondson and Levy, 2019).

Though discourse abounds related to transformative governance, it falls short of its ideal in climate change action plans as it is unclear whether communities have the capacity to engage in substantive change to build low-carbon and resilient communities (Burch et al., 2014). The results of a study on the USA by Tang and Dessai (2012) indicate that climate adaptation and mitigation plans’ treatment of extreme climate conditions and disaster preparedness is limited. Moreover, risk communication with the public is part of an integrated disaster warning system, but behavioural response to disaster warnings are often governed by personal beliefs about the nature of the hazard; and ultimately swaying individual decisions to comply with or ignore the warning message (Mayhorn and McLaughlin, 2014). New approaches such as the ‘first mile’ of early warning systems, built on the specific needs from beneficiary communities instead of on technological progress, are being implemented (Zommers et al., 2017); but they have not yet been assessed. 

Coupling disaster risk reduction and management with climate change adaptation effort—following the set targets of UNFCCC and the Sendai Framework—has shown progress since SREX and AR5 (e.g., Lawrence and Saunders, 2017). Substantial literature exists on the topic, but there is little assessment of practices on the ground in the implementation of integrated disaster management and climate change adaptation (Nalau et al., 2016) including health (Banwell et al., 2018). Mainstreaming disaster risk reduction and climate change adaptation within and across sectors is considered essential to ensure administrative coordination and coherence across sectoral plans and policies (Shimizu and Clark, 2015) (medium confidence). Financial and technological support and capacity building especially related to public works, savings or loans enable households to build assets and improve livelihoods (Ulrichs et al., 2019). No assessment is available so far of the efficiency and effectiveness of mainstreaming especially related to the integration of climate change adaptation and disaster risk reduction, let alone for abrupt and extreme impacts.

Case studies of integration note major problems, for example, weak coordination among government agencies (Seidler et al., 2018); lack of data and user-friendly information to guide decision making at the local level (Jones et al., 2017) and the need for the central governmental support for data availability (Putra et al., 2018); fragmentation due to competing local objectives (Forino et al., 2017); dependence on regional and international frameworks in the absence of a national framework (Rivera and Wamsler, 2014); limited availability of formal training in integration (Hemstock et al., 2017); and turf wars between responsible government agencies (Nemakonde and Van Niekerk, 2017). The case of Pacific islands such as Vanuatu is indicative of these problems. Though they have coupled disaster risk reduction with climate change adaptation, problems manifest in relationships, responsibilities, capacity and expectations between government agencies and other actors (e.g., international donors and non-governmental organisations), as analysed by Vanuatu’s response to the Category 5 TC Pam (Nalau et al., 2017). Some solutions are proposed such as getting all the actors on the same page and focusing on reducing vulnerability to longer-term environmental hazards (Schipper et al., 2016); focussing on specific goals, objectives and strategies (Organization of American States, 2014); assigning a single department to handle integration (APEC, 2016); and citing real-life decision examples in national guidelines (Bell et al., 2017). Place-based responses also entail the inclusion and the acknowledgement of indigenous and local knowledge for an enhanced resilience pathway (Hilhorst et al., 2015; Tharakan, 2015; Iloka, 2016; Nunn et al., 2016). 

Given the significance of disaster risk reduction to enhance climate change adaptation regardless of the integration of the two, the Sendai Framework for Disaster Risk Reduction 2015–2030 focuses on seven targets and four priorities that foster participation beyond information sharing and include partnerships and collaborations within society (UNISDR, 2015). Inclusion of, and coordination between, different stakeholders is a key component for managing risks of extreme events, including in a changing climate (medium confidence). In the Wadden Sea coastal area, for example, crucial parts of coordinating disaster risk reduction, include (i) responsibility-sharing among authorities, sectors and stakeholders, (ii) all-of-society engagement and partnership with empowerment and inclusive participation, and (iii) development of international, regional, subregional and transboundary cooperation schemes (González-Riancho et al., 2017). In India, a change in the coordination structure was pivotal in reducing fatalities from over 10,000 to 45 between cyclones Orissa (Odisha) in 1999 and Phailin in 2013. In this case, the Disaster Management Act of 2005 established a comprehensive policy and command and control system during disaster response that empowered the most qualified government officials regardless of their rank. This system provides authority to and holds accountability for those in charge of ground operations. Though this rigid system may sometimes be questioned, a unified and top-down command structure works better when there is a lack of mature disaster management system (Pal et al., 2017).

In sum, limiting the risk from the impact of extreme events and abrupt changes leads to successful adaptation to climate change if climate-affected sectors and disaster management relevant agencies coordinate well (high confidence). Transformative governance, including successful integration of disaster risk management and climate change adaptation, empowerment of vulnerable groups, accountability of governmental decisions, and longer-term planning promotes climate-resilient development pathways (high confidence). An enhanced understanding of the institutional capacity as well as the legal framework addressing abrupt changes and extreme events is especially important (medium confidence). 

Knowledge gaps limit the identification of the most relevant actions to achieve and pursue climate-resilient development pathways. Since SREX and AR5, there is little research on indirect impacts of climatic extremes on ecosystems and consequences on poverty and livelihoods critical to the SDGs. For example, adaptation solutions and limitations, including governance challenges, for the ocean do not include extreme events (Sections 5.5.2 and 5.5.3 in Chapter 5). Further, there is only scant literature on L&D, including non-economic impacts, resulting from well-documented processes such as MHWs (Section 6.4), SLR impacts on low-lying coasts (Section 4.3), and cryosphere changes (Section 2.3; Chapter 3) (high confidence). Limited information is available concerning the cost-benefit and effectiveness of risk-reduction measures. Coupling risk transfer and insurance mechanisms with risk reduction measures, for example, can enhance the cost-effectiveness of adapting to climate change (medium confidence).

6.10

Knowledge Gaps

A comprehensive, detailed list of all the knowledge gaps that have been identified during the assessment performed in this chapter is not possible, hence we focus here on gaps that are relevant for multiple phenomena.

Detection, attribution and projection of physical aspects of climate change at regional and local scales are generally limited by uncertainties in the response of climate models to changes in GHGs and other forcing agents. Additionally, regionally-based attribution studies for extreme events may be lacking in some areas, possibly reflecting the lack of capacity or imperative by regional and national technical institutions to undertake such studies. Thermodynamic aspects of change may be more robust than those involving changes in dynamics e.g., the tracks of TCs or ocean dynamical components of MHW formation. Increasing resolution and improvements in climate models may help to reduce uncertainty. However, because extreme events and highly nonlinear changes (e.g., AMOC collapse) are, by definition, found in the ‘tails’ of distributions, ensembles or long climate model runs may be required.

While it may not be possible to quantify the likelihood of very rare events or irreversible phenomena, it may be possible to quantify their impacts on natural and human systems. Such information may be more useful to policy makers (Sutton, 2018). Impacts on natural systems (e.g., marine ecosystems) are in general better quantified than impacts on human systems, but there are still many gaps in the literature for the phenomena assessed here (e.g., future impacts of extreme El Niño and La Niña events). The body of literature on compound risks and cascading impacts is growing but is still rather small. One area where there seems to be a serious lack of literature is in the assessment of the economic impacts of extreme and abrupt/irreversible events.

Literature on managing risks and adaptation strategies for abrupt and irreversible events is sparse, as is the literature on the combined impacts of climate-driven events and societal development or maladaptation. The same is true for compound risks and cascading impacts. Theory on transformative governance is emerging but practical demonstrations are few.

Finally, research is still often ‘siloed’ in physical modelling, ecosystem modelling, social sciences etc. Researchers who can cross boundaries between these disciplines will help accelerate research in the areas covered by this chapter.


C

Citation

Collins M., M. Sutherland, L. Bouwer, S.-M. Cheong, T. Frölicher, H. Jacot Des Combes, M. Koll Roxy, I. Losada, K. McInnes, B. Ratter, E. Rivera-Arriaga, R.D. Susanto, D. Swingedouw, and L. Tibig, 2019: Extremes, Abrupt Changes and Managing Risk. In: IPCC Special Report on the Ocean and Cryosphere in a Changing Climate [H.-O. Pörtner, D.C. Roberts, V. Masson-Delmotte, P. Zhai, M. Tignor, E. Poloczanska, K. Mintenbeck, A. Alegría, M. Nicolai, A. Okem, J. Petzold, B. Rama, N.M. Weyer (eds.)]. Cambridge University Press, Cambridge, UK and New York, NY, USA, pp. 589-655. https://doi.org/10.1017/9781009157964.008.

References

  1. IPCC, 2012: Managing the Risks of Extreme Events and Disasters to Advance Climate Change Adaptation. A Special Report of Working Groups I and II of the Intergovernmental Panel on Climate Change. Cambridge University Press, Cambridge, UK, and New York, NY, USA, 582 pp. [Field, C.B., V. Barros, T.F. Stocker, D. Qin, D.J. Dokken, K.L. Ebi, M.D. Mastrandrea, K.J. Mach, G.-K. Plattner, S.K. Allen, M. Tignor, and P.M. Midgley (Eds.)]
  2. IPCC, 2013: Climate Change 2013: The Physical Science Basis. Contribution of Working Group I to the Fifth Assessment Report of the Intergovernmental Panel on Climate Change [Stocker, T.F., D. Qin, G.-K. Plattner, M. Tignor, S.K. Allen, J. Boschung, A. Nauels, Y. Xia, V. Bex and P.M. Midgley (eds.)]. Cambridge University Press, Cambridge, United Kingdom and New York, NY, USA, 1535 pp.
  3. IPCC, 2014: Climate Change 2014: Impacts, Adaptation, and Vulnerability. Part A: Global and Sectoral Aspects. Contribution of Working Group II to the Fifth Assessment Report of the Intergovernmental Panel on Climate Change [Field, C.B., V.R. Barros, D.J. Dokken, K.J. Mach, M.D. Mastrandrea, T.E. Bilir, M. Chatterjee, K.L. Ebi, Y. O. Estrada, R.C. Genova, B. Girma, E.S. Kissel, A.N. Levy, S. MacCracken, P.R. Mastrandrea and L.L. White (eds.)]. Cambridge University Press, Cambridge, United Kingdom and New York, NY, USA.
  4. IPCC, 2018: Global Warming of 1.5° C: An IPCC Special Report on the Impacts of Global Warming of 1.5° C Above Pre-industrial Levels and Related Global Greenhouse Gas Emission Pathways, in the Context of Strengthening the Global Response to the Threat of Climate Change, Sustainable Development, and Efforts to Eradicate Poverty [Masson-Delmotte, V., P. Zhai, H.-O. Pörtner, D. Roberts, J. Skea, P.R. Shukla, A. Pirani, W. Moufouma-Okia, C. Péan, R. Pidcock, S. Connors, J.B.R. Matthews, Y. Chen, X. Zhou, M.I. Gomis, E. Lonnoy, T. Maycock, M. Tignor, and T. Waterfield (eds.)], in press
  5. Trenberth, K.E., J.T. Fasullo and T.G. Shepherd, 2015: Attribution of climate extreme events. Nat. Clim. Change, 5, 725, doi:10.1038/nclimate2657.
  6. Shepherd, T.G., 2016: A Common Framework for Approaches to Extreme Event Attribution. Curr. Clim., 2(1), 28–38, doi:10.1007/s40641-016-0033-y.
  7. Peterson, T.C., M.P. Hoerling, P.A. Stott and S. Herring, 2013: Explaining extreme events of 2012 from a climate perspective. Bull. Am. Meterol. Soc., 94(9), S1–S74, doi:10.1175/Bams-D-13-00085.1.
  8. Peterson, T.C., M.P. Hoerling, P.A. Stott and S. Herring, 2013: Explaining extreme events of 2012 from a climate perspective. Bull. Am. Meterol. Soc., 94(9), S1–S74, doi:10.1175/Bams-D-13-00085.1.
  9. Herring, S.C., M.P. Hoerling, T.C. Peterson and P.A. Stott, 2014: Explaining extreme events of 2013 from a climate perspective. Bull. Am. Meterol. Soc., 95(9), S1–S96, doi:10.1175/1520-0477-95.9.S1.1.
  10. Herring, S.C. et al., 2015: Explaining extreme events of 2014 from a climate perspective. Bull. Am. Meterol. Soc., 96, S1–S172, doi:10.1175/BAMS-ExplainingExtremeEvents2014.1.
  11. Herring, S.C. et al., 2018: Introduction to explaining extreme events of 2016 from a climate perspective. In “Explaining Extreme Events of 2016 from a Climate Perspective”. Bull. Am. Meterol. Soc., 99(1), S54–S59, doi:10.1175/BAMS-D-17-0118.1.
  12. Shepherd, T.G., 2016: A Common Framework for Approaches to Extreme Event Attribution. Curr. Clim., 2(1), 28–38, doi:10.1007/s40641-016-0033-y.
  13. Olita, A. et al., 2007: Effects of the 2003 European heatwave on the Central Mediterranean Sea: surface fluxes and the dynamical response. Ocean Sci., 3(2), 273–289, doi:10.5194/os-3-273-2007.
  14. Garrabou, J. et al., 2009: Mass mortality in Northwestern Mediterranean rocky benthic communities: effects of the 2003 heat wave. Global Change Biol., 15(5), 1090–1103, doi:10.1111/j.1365-2486.2008.01823.x.
  15. Galli, G., C. Solidoro and T. Lovato, 2017: Marine Heat Waves Hazard 3D Maps and the Risk for Low Motility Organisms in a Warming Mediterranean Sea. Front. Mar. Sci., 4, 136, doi:10.3389/fmars.2017.00136.
  16. Olita, A. et al., 2007: Effects of the 2003 European heatwave on the Central Mediterranean Sea: surface fluxes and the dynamical response. Ocean Sci., 3(2), 273–289, doi:10.5194/os-3-273-2007.
  17. Pezza, A.B. and I. Simmonds, 2005: The first South Atlantic hurricane: Unprecedented blocking, low shear and climate change. Geophys. Res. Lett., 32(15), L15712, doi:10.1029/2005GL023390.
  18. Trenberth, K.E. and D.J. Shea, 2006: Atlantic hurricanes and natural variability in 2005. Geophys. Res. Lett., 33(12), L12704, doi:10.1029/2006GL026894.
  19. Dibajnia, M., M. Soltanpour, R. Nairn and M. Allahyar, 2010: Cyclone Gonu: the most intense tropical cyclone on record in the Arabian Sea. In: Indian ocean tropical cyclones and climate change. EYassine Charabi (Ed.), Springer Netherlands Springer, 149–157, ISBN: 978-90-481-3108-2.
  20. McTaggart-Cowan, R. et al., 2006: Analysis of Hurricane Catarina (2004). Mon. Weather Rev., 134(11), 3029–3053, doi:10.1175/mwr3330.1.
  21. Link, L.E., 2010: The anatomy of a disaster, an overview of Hurricane Katrina and New Orleans. Ocean Engineering, 37(1), 4–12, doi:10.1016/j.oceaneng.2009.09.002.
  22. Fritz, H.M., C.D. Blount, F.B. Albusaidi and A.H.M. Al-Harthy, 2010: Cyclone Gonu storm surge in Oman. Estuar. Coast. Shelf,, 86(1), 102–106, doi:10.1016/j.ecss.2009.10.019.
  23. Coles, S.L., E. Looker and J. A. Burt, 2015: Twenty-year changes in coral near Muscat, Oman estimated from manta board tow observations. Mar. Environ. Res., 103, 66–73, doi:10.1016/j.marenvres.2014.11.006.
  24. Hoeke, R.K. et al., 2013: Widespread inundation of Pacific islands triggered by distant-source wind-waves. Glob. Planet. Change, 108, 128–138, doi:10.1016/j.gloplacha.2013.06.006.
  25. Hoeke, R.K. et al., 2013: Widespread inundation of Pacific islands triggered by distant-source wind-waves. Glob. Planet. Change, 108, 128–138, doi:10.1016/j.gloplacha.2013.06.006.
  26. Marengo, J.A. et al., 2011: The drought of 2010 in the context of historical droughts in the Amazon region. Geophys. Res. Lett., 38(12), L12703, doi:10.1029/2011GL047436.
  27. Shiogama, H. et al., 2013: An event attribution of the 2010 drought in the South Amazon region using the MIROC5 model. Atmos. Sci. Lett., 14(3), 170–175, doi:10.1002/asl2.435.
  28. Feldpausch, T.R. et al., 2016: Amazon forest response to repeated droughts. Global Biogeochem. Cy., 30(7), 964–982, doi:10.1002/2015GB005133.
  29. Leonard, M. et al., 2014: A compound event framework for understanding extreme impacts. WiRes. Clim. Change, 5(1), 113–128, doi:10.1002/wcc.252.
  30. Evans, J.P. and I. Boyer-Souchet, 2012: Local sea surface temperatures add to extreme precipitation in northeast Australia during La Niña. Geophys. Res. Lett., 39(10), L10803, doi:10.1029/2012GL052014.
  31. van den Honert, R.C. and J. McAneney, 2011: The 2011 Brisbane Floods: Causes, Impacts and Implications. Water, 3(4), 1149, doi:10.3390/w3041149.
  32. Christidis, N. and P.A. Stott, 2012: Lengthened odds of the cold UK winter of 2010/11 attributable to human influence. Bull. Am. Meterol. Soc., 93(7), 1060–1062, doi:10.1175/BAMS-D-12-00021.1.
  33. Christidis, N. and P.A. Stott, 2012: Lengthened odds of the cold UK winter of 2010/11 attributable to human influence. Bull. Am. Meterol. Soc., 93(7), 1060–1062, doi:10.1175/BAMS-D-12-00021.1.
  34. Espinueva, S.R., E.O. Cayanan and N.C. Nievares, 2012: A retrospective on the devastating impacts of Tropical Storm Washi. Tropical Cyclone Research and Review, 1(2), 163–176, doi:10.6057/2012TCRR02.11.
  35. Rasquinho, O., J. Liu and D. Leong, 2013: Assessment on disaster risk reduction of tropical storm Washi. Tropical Cyclone Research and Review, 2(3), 169–175, doi:10.6057/2013TCRR03.04.
  36. Espinueva, S.R., E.O. Cayanan and N.C. Nievares, 2012: A retrospective on the devastating impacts of Tropical Storm Washi. Tropical Cyclone Research and Review, 1(2), 163–176, doi:10.6057/2012TCRR02.11.
  37. Feng, M., M.J. McPhaden, S.-P. Xie and J. Hafner, 2013: La Niña forces unprecedented Leeuwin Current warming in 2011. Sci. Rep., 3, 1277, doi:10.1038/srep01277.
  38. Pearce, A.F. and M. Feng, 2013: The rise and fall of the “marine heat wave” off Western Australia during the summer of 2010/2011. J. Marine Syst., 111–112, 139–156, doi:10.1016/j.jmarsys.2012.10.009.
  39. Benthuysen, J.A., M. Feng and L. Zhong, 2014: Spatial patterns of warming off Western Australia during the 2011 Ningaloo Niño: Quantifying impacts of remote and local forcing. Cont. Shelf Res., 91(Supplement C), 232–246, doi:10.1016/j.csr.2014.09.014.
  40. Caputi, N. et al., 2016: Management adaptation of invertebrate fisheries to an extreme marine heat wave event at a global warming hot spot. Ecol. Evol., 6(11), 3583–3593, doi:10.1002/ece3.2137.
  41. Perkins-Kirkpatrick, S. E. et al., 2016: Natural hazards in Australia: heatwaves. Clim. Change, 139(1), 101–114, doi:10.1007/s10584-016-1650-0.
  42. Feng, M., M.J. McPhaden, S.-P. Xie and J. Hafner, 2013: La Niña forces unprecedented Leeuwin Current warming in 2011. Sci. Rep., 3, 1277, doi:10.1038/srep01277.
  43. Feng, M. et al., 2015: Decadal increase in Ningaloo Niño since the late 1990s. Geophys. Res. Lett., 42(1), 104–112, doi:10.1002/2014GL062509.
  44. Wernberg, T. et al., 2013: An extreme climatic event alters marine ecosystem structure in a global biodiversity hotspot. Nat. Clim. Change, 3(1), 78–82, doi:10.1038/Nclimate1627.
  45. Dean, S.M., S. Rosier, T. Carey-Smith and P.A. Stott, 2013: The role of climate change in the two-day extreme rainfall in Golden Bay, New Zealand, December 2011 [in “Explaining Extreme Events of 2012 from a Climate Perspective”]. Bull. Am. Meterol. Soc., 94(9), S61–S63, doi:10.1175/BAMS-D-13-00085.1.
  46. Dean, S.M., S. Rosier, T. Carey-Smith and P.A. Stott, 2013: The role of climate change in the two-day extreme rainfall in Golden Bay, New Zealand, December 2011 [in “Explaining Extreme Events of 2012 from a Climate Perspective”]. Bull. Am. Meterol. Soc., 94(9), S61–S63, doi:10.1175/BAMS-D-13-00085.1.
  47. Guemas, V. et al., 2013: September 2012 Arctic sea ice minimum: discriminating between sea ice memory, the August 2012 extreme storm, and prevailing warm conditions. In: “Explaining Extremes of 2012 from a Climate Perspective”. Bull. Am. Meterol. Soc., 94(9), S20–S22, doi:10.1175/BAMS-D-13-00085.1.
  48. Zhang, R. et al., 2013: Have aerosols caused the observed Atlantic multidecadal variability? J. Atmos. Sci., 70(4), 1135–1144, doi:10.1175/JAS-D-12-0331.1.
  49. Fernández-Méndez, M. et al., 2015: Photosynthetic production in the central Arctic Ocean during the record sea-ice minimum in 2012. Biogeosciences, 12(11), 3525–3549, doi:10.5194/bg-12-3525-2015.
  50. Sweet, W.V., C. Zervas, S. Gill and J. Park, 2013: Hurricane Sandy inundation probabilities today and tomorrow. In “Explaining Extremes of 2012 from a Climate Perspective”. Bull. Am. Meterol. Soc., 94(9), S17–S20, doi:10.1175/BAMS-D-13-00085.1.
  51. Lackmann, G.M., 2015: Hurricane Sandy before 1900 and after 2100. Bull. Am. Meterol. Soc., 96(4), 547–560, doi:10.1175/Bams-D-14-00123.1.
  52. Sainsbury, N.C. et al., 2018: Changing storminess and global capture fisheries. Nat. Clim. Change, 8(8), 655–659, doi:10.1038/s41558-018-0206-x.
  53. Mills, K. et al., 2013: Fisheries Management in a Changing Climate: Lessons From the 2012 Ocean Heat Wave in the Northwest Atlantic. Oceanography, 26(2), 191–195, doi:10.5670/oceanog.2013.27.
  54. Chen, K., G. Gawarkiewicz, Y.-O. Kwon and W.G. Zhang, 2015b: The role of atmospheric forcing versus ocean advection during the extreme warming of the Northeast U.S. continental shelf in 2012. J. Geophys. Res.-Oceans, 120(6), 4324-4339, doi:10.1002/2014JC010547.
  55. Pershing, A.J. et al., 2015: Slow adaptation in the face of rapid warming leads to collapse of the Gulf of Maine cod fishery. Science, 350(6262), 809–812, doi:10.1126/science.aac9819.
  56. Zhou, C., M.D. Zelinka, A.E. Dessler and S.A. Klein, 2015: The relationship between interannual and long-term cloud feedbacks. Geophys. Res. Lett., 42(23), 10,463–10,469, doi:10.1002/2015GL066698.
  57. Chen, K., G. Gawarkiewicz, Y.-O. Kwon and W.G. Zhang, 2015b: The role of atmospheric forcing versus ocean advection during the extreme warming of the Northeast U.S. continental shelf in 2012. J. Geophys. Res.-Oceans, 120(6), 4324-4339, doi:10.1002/2014JC010547.
  58. Mills, K. et al., 2013: Fisheries Management in a Changing Climate: Lessons From the 2012 Ocean Heat Wave in the Northwest Atlantic. Oceanography, 26(2), 191–195, doi:10.5670/oceanog.2013.27.
  59. Pershing, A.J. et al., 2015: Slow adaptation in the face of rapid warming leads to collapse of the Gulf of Maine cod fishery. Science, 350(6262), 809–812, doi:10.1126/science.aac9819.
  60. Christidis, N. and P.A. Stott, 2015: Extreme rainfall in the United Kingdom during winter 2013/14: the role of atmospheric circulation and climate change. Bull. Am. Meterol. Soc., 96(12), S46-S50, doi:10.1175/BAMS-D-15-00094.1.
  61. Department for Communities and Local Government, 2014: Winter 2013/14 severe weather recovery progress report. Department for Communities and Local Government, Fry Building, 2 Marsham Street, London, SW1P 4DF, UK , 38pp. Available at: https://assets.publishing.service.gov.uk/government/uploads/system/uploads/attachment_data/file/380573/Winter_2013-14_severe_weather_recovery_progress_report.pdf.
  62. Huntingford, C. et al., 2014: Potential influences on the United Kingdom’s floods of winter 2013/14. Nat. Clim. Change, 4(9), 769, doi:10.1038/nclimate2314.
  63. Harris, M.P. and N. Elkins, 2013: An unprecedented wreck of Puffins in eastern Scotland in March and April 2013. Scottish Birds, 33(2), 157–159.
  64. David, C.P., B.A.B. Racoma, J. Gonzales and M.V. Clutario, 2013: A manifestation of climate change? A look at Typhoon Yolanda in relation to the historical tropical cyclone archive. Science Diliman, 25(2), 78–86.
  65. Takagi, H. and M. Esteban, 2016: Statistics of tropical cyclone landfalls in the Philippines: unusual characteristics of 2013 Typhoon Haiyan. Nat. Hazards, 80(1), 211–222, doi:10.1007/s11069-015-1965-6.
  66. Trenberth, K.E., J.T. Fasullo and T.G. Shepherd, 2015: Attribution of climate extreme events. Nat. Clim. Change, 5, 725, doi:10.1038/nclimate2657.
  67. Sainsbury, N.C. et al., 2018: Changing storminess and global capture fisheries. Nat. Clim. Change, 8(8), 655–659, doi:10.1038/s41558-018-0206-x.
  68. Bond, N.A., M.F. Cronin, H. Freeland and N. Mantua, 2015: Causes and impacts of the 2014 warm anomaly in the NE Pacific. Geophys. Res. Lett., 42(9), 3414–3420, doi:10.1002/2015gl063306.
  69. Jacox, M.G. et al., 2018: Forcing of Multiyear Extreme Ocean Temperatures that Impacted California Current Living Marine Resources in 2016. Bull. Am. Meterol. Soc., 99(1), S27–S33, doi:10.1175/bams-d-17-0119.1.
  70. Gentemann, C.L., M.R. Fewings and M. García-Reyes, 2017: Satellite sea surface temperatures along the West Coast of the United States during the 2014–2016 northeast Pacific marine heat wave. Geophys. Res. Lett., 44(1), 312–319, doi:10.1002/2016gl071039.
  71. Rudnick, D.L., K.D. Zaba, R.E. Todd and R.E. Davis, 2017: A climatology of the California Current System from a network of underwater gliders. Progress in Oceanography, 154(Supplement C), 64–106, doi:10.1016/j.pocean.2017.03.002.
  72. Jackson, L.C. and R.A. Wood, 2018: Hysteresis and Resilience of the AMOC in an Eddy-Permitting GCM. Geophys. Res. Lett., 45(16), 8547–8556, doi:10.1029/2018gl078104.
  73. Bond, N.A., M.F. Cronin, H. Freeland and N. Mantua, 2015: Causes and impacts of the 2014 warm anomaly in the NE Pacific. Geophys. Res. Lett., 42(9), 3414–3420, doi:10.1002/2015gl063306.
  74. Weller, E. et al., 2015: Human Contribution to the 2014 Record High Sea Surface Temperatures Over the Western Tropical And Northeast Pacific Ocean. Bull. Am. Meterol. Soc., 96(12), S100–S104, doi:10.1175/bams-d-15-00055.1.
  75. Jacox, M.G. et al., 2018: Forcing of Multiyear Extreme Ocean Temperatures that Impacted California Current Living Marine Resources in 2016. Bull. Am. Meterol. Soc., 99(1), S27–S33, doi:10.1175/bams-d-17-0119.1.
  76. Newman, M. et al., 2018: The extreme 2015/16 El Nino, in the context of historical climate variability and change. In “Explaining Extreme Events of 2016 from a Climate Perspective”. Bull. Am. Meterol. Soc., 99(1), S15–S20, doi:10.1175/bams-d-17-0116.1.
  77. McCabe, R.M. et al., 2016: An unprecedented coastwide toxic algal bloom linked to anomalous ocean conditions. Geophys. Res. Lett., 43(19), 10,366–10,376, doi:10.1002/2016gl070023.
  78. Jones, T. et al., 2018: Massive Mortality of a Planktivorous Seabird in Response to a Marine Heatwave. Geophys. Res. Lett., 45, 3193–3202, doi:10.1002/2017GL076164.
  79. Murakami, H. et al., 2015: Investigating the influence of anthropogenic forcing and natural variability on the 2014 Hawaiian hurricane season. Bull. Am. Meterol. Soc., 96(12), S115–S119, doi:10.1175/Bams-D-15-00119.1.
  80. Burns, J. et al., 2016: Assessing the impact of acute disturbances on the structure and composition of a coral community using innovative 3D reconstruction techniques. Methods in Oceanography, 15-16, 49–59, doi:10.1016/j.mio.2016.04.001.
  81. Murakami, H. et al., 2017: Dominant role of subtropical Pacific warming in extreme eastern Pacific hurricane seasons: 2015 and the future. J. Clim., 30(1), 243–264, doi:10.1175/Jcli-D-16-0424.1.
  82. Murakami, H. et al., 2017: Dominant role of subtropical Pacific warming in extreme eastern Pacific hurricane seasons: 2015 and the future. J. Clim., 30(1), 243–264, doi:10.1175/Jcli-D-16-0424.1.
  83. Bhutto, A.Q., M.J. Iqbal and M.J. Baig, 2017: Abrupt Intensification and Dissipation of Tropical Cyclones in Indian Ocean: A Case Study of Tropical Cyclone Nilofar – 2014. Journal of Basic & Applied Sciences, 13, 566–576, doi:10.6000/1927-5129.2017.13.92.
  84. Rosier, S. et al., 2015: Extreme Rainfall in Early July 2014 in Northland, New Zealand—Was There an Anthropogenic Influence? In “Explaining Extreme Events of 2014 from a Climate Perspective”. Bull. Am. Meterol. Soc., 96(12), S136–S140, doi:10.1175/BAMS-D-15-00105.1.
  85. Rosier, S. et al., 2015: Extreme Rainfall in Early July 2014 in Northland, New Zealand—Was There an Anthropogenic Influence? In “Explaining Extreme Events of 2014 from a Climate Perspective”. Bull. Am. Meterol. Soc., 96(12), S136–S140, doi:10.1175/BAMS-D-15-00105.1.
  86. Weller, E. et al., 2015: Human Contribution to the 2014 Record High Sea Surface Temperatures Over the Western Tropical And Northeast Pacific Ocean. Bull. Am. Meterol. Soc., 96(12), S100–S104, doi:10.1175/bams-d-15-00055.1.
  87. Oliver, E.C.J., S.E. Perkins-Kirkpatrick, N. J. Holbrook and N. L. Bindoff, 2018b: Anthropogenic and natural influences on record 2016 marine heat waves. In “Explaining Extreme Events of 2016 from a Climate Perspective”. Bull. Am. Meterol. Soc., 99(1), S44–S48, doi:10.1175/BAMS-ExplainingExtremeEvents2016.1.
  88. Lewis, S.C. and J. Mallela, 2018: A multifactor risk analysis of the record 2016 Great Barrier Reef bleaching. In “Explaining Extreme Events of 2016 from a Climate Perspective”. Bull. Am. Meterol. Soc., 99(1), S144–S149, doi:10.1175/BAMS-D-17-0118.1.
  89. Bellprat, O. et al., 2016: The Role of Arctic Sea Ice and Sea Surface Temperatures on the Cold 2015 February Over North America. Bull. Am. Meterol. Soc., 97(12), S36–S41, doi:10.1175/bams-d-16-0159.1.
  90. Munich R.E., 2016: 2015 US natural catastrophe losses curbed by El Niño; brutal North American winter caused biggest insured losses. Press Release, Munich Reinsurance America, Inc., Princeton, NJ, USA, 4 pp. http://www.munichre.com/site/mram-mobile/get/documents_E1831215213/mram/assetpool.munichreamerica.wrap/PDF/07Press/2015_natural_catastrophe_losses_US_010416.pdf. Accessed 2019/20/08.
  91. Fuckar, N.S. et al., 2016: Record low northern hemisphere sea ice extent in March 2015. Bull. Am. Meterol. Soc., 97(12), S136–S143, doi:10.1175/Bams-D-16-0153.1.
  92. Sweet, W.V. et al., 2016: In tide’s way: Southeast Florida’s September 2015 sunny-day flood. In “Explaining Extremes of 2012 from a Climate Perspective”. Bull. Am. Meterol. Soc., 97(12), S25–S30, doi:10.1175/BAMS-D-13-00085.1.
  93. Funk, C. et al., 2018: Anthropogenic enhancement of moderate-to-strong El Nino events likely contributed to drought and poor harvests in Southern Africa during 2016 [in “Explaining Extreme Events of 2016 from a Climate Perspective”]. Bull. Am. Meterol. Soc., 99(1), S91–S101, doi:10.1175/BAMS-ExplainingExtremeEvents2016.1.
  94. Yuan, X., S. Wang and Z.Z. Hu, 2018: Do climate change and El Nino increase likelihood of Yangtze River extreme rainfall? In “Explaining Extreme Events of 2016 from a Climate Perspective”. Bull. Am. Meterol. Soc., 99(1), S113–S117, doi:10.1175/BAMS-D-17-0118.1.
  95. Funk, C. et al., 2018: Anthropogenic enhancement of moderate-to-strong El Nino events likely contributed to drought and poor harvests in Southern Africa during 2016 [in “Explaining Extreme Events of 2016 from a Climate Perspective”]. Bull. Am. Meterol. Soc., 99(1), S91–S101, doi:10.1175/BAMS-ExplainingExtremeEvents2016.1.
  96. Rogers, R.F. et al., 2017: Rewriting the Tropical Record Books: The Extraordinary Intensification of Hurricane Patricia (2015). Bull. Am. Meterol. Soc., 98(10), 2091–2112, doi:10.1175/bams-d-16-0039.1.
  97. Diamond, H. J. and C. J. Schreck, 2016: Tropical Cyclones [in “State of the Climate in 2015”]. Bull. Am. Meterol. Soc., 97(8), S104–S130, doi:10.1175/2016BAMSStateoftheClimate.1.
  98. Collins, J.M. et al., 2016: The record-breaking 2015 hurricane season in the eastern North Pacific: An analysis of environmental conditions. Geophys. Res. Lett., 43(17), 9217–9224, doi:10.1002/2016GL070597.
  99. Diamond, H. J. and C. J. Schreck, 2016: Tropical Cyclones [in “State of the Climate in 2015”]. Bull. Am. Meterol. Soc., 97(8), S104–S130, doi:10.1175/2016BAMSStateoftheClimate.1.
  100. Murakami, H. et al., 2017: Dominant role of subtropical Pacific warming in extreme eastern Pacific hurricane seasons: 2015 and the future. J. Clim., 30(1), 243–264, doi:10.1175/Jcli-D-16-0424.1.
  101. Kruk, M.C., 2016: Tropical cyclones: North Indian Ocean. In “State of the Climate in 2015”. Bull. Am. Meterol. Soc., 97(8), S114–S115 doi:10.1175/2016BAMSStateoftheClimate.1.
  102. IFRC, 2016: Somalia: Tropical Cyclone Chapala. Emergency Plan of Action Final Report, International Federation of Red Cross and Red Crescent Societies, 11 pp. https://reliefweb.int/sites/reliefweb.int/files/resources/MDRSO004FR.pdf. Accessed 2019/20/08.
  103. Duke, N.C. et al., 2017: Large-scale dieback of mangroves in Australia’s Gulf of Carpentaria: a severe ecosystem response, coincidental with an unusually extreme weather event. Mar. Freshwater Res., 68(10), 1816–1829, doi:10.1071/MF16322.
  104. Oliver, E.C.J. et al., 2017: The unprecedented 2015/16 Tasman Sea marine heatwave. Nat. Commun., 8, 16101, doi:10.1038/ncomms16101.
  105. Oliver, E.C.J. et al., 2017: The unprecedented 2015/16 Tasman Sea marine heatwave. Nat. Commun., 8, 16101, doi:10.1038/ncomms16101.
  106. Oliver, E.C.J. et al., 2017: The unprecedented 2015/16 Tasman Sea marine heatwave. Nat. Commun., 8, 16101, doi:10.1038/ncomms16101.
  107. Petty, A.A. et al., 2017: Skillful spring forecasts of September Arctic sea ice extent using passive microwave sea ice observations. Earth’s Future, 5(2), 254–263, doi:10.1002/2016EF000495.
  108. Kam, J., T.R. Knutson, F. Zeng and A.T. Wittenberg, 2018: CMIP5 model-based assessment of anthropoegenic influence on highly anomalous Arctic Warmth during November-December 2016. In “Explaining Extreme Events of 2016 from a Climate Perspective”. Bull. Am. Meterol. Soc., 99(1), S34–S38, doi:10.1175/BAMS-ExplainingExtremeEvents2016.1.
  109. Petty, A.A. et al., 2018: The Arctic sea ice cover of 2016: a year of record-low highs and higher-than-expected lows. The Cryosphere, 12(2), 433–452, doi:10.5194/tc-12-433-2018.
  110. Meier, W.N. et al., 2014: Arctic sea ice in transformation: A review of recent observed changes and impacts on biology and human activity. Rev. Geophys., 52(3), 185–217, doi:10.1002/2013RG000431.
  111. Francis, J. and N. Skific, 2015: Evidence linking rapid Arctic warming to mid-latitude weather patterns. Philos. Trans. Royal Soc. A., 373(2045), 20140170, doi:10.1098/rsta.2014.0170.
  112. Screen, J.A., C. Deser and L. Sun, 2015: Projected changes in regional climate extremes arising from Arctic sea ice loss. Environ. Res. Lett., 10(8), 084006, doi:10.1088/1748-9326/10/8/084006.
  113. Walsh, J.E. et al., 2017: The Exceptionally Warm Winter of 2015/16 in Alaska. J. Clim., 30(6), 2069–2088, doi:10.1175/jcli-d-16-0473.1.
  114. Walsh, J.E. et al., 2018: The high latitude marine heat wave of 2016 and its impacts on Alaska. In “Explaining Extreme Events of 2016 from a Climate Perspective”. Bull. Am. Meterol. Soc., 99(1), S39–S43, doi:10.1175/bams-d-17-0105.1.
  115. Oliver, E.C.J., S.E. Perkins-Kirkpatrick, N. J. Holbrook and N. L. Bindoff, 2018b: Anthropogenic and natural influences on record 2016 marine heat waves. In “Explaining Extreme Events of 2016 from a Climate Perspective”. Bull. Am. Meterol. Soc., 99(1), S44–S48, doi:10.1175/BAMS-ExplainingExtremeEvents2016.1.
  116. Walsh, J.E. et al., 2018: The high latitude marine heat wave of 2016 and its impacts on Alaska. In “Explaining Extreme Events of 2016 from a Climate Perspective”. Bull. Am. Meterol. Soc., 99(1), S39–S43, doi:10.1175/bams-d-17-0105.1.
  117. Peterson, W.T. et al., 2017: The pelagic ecosystem in the Northern California Current off Oregon during the 2014–2016 warm anomalies within the context of the past 20 years. J. Geophys. Res.-Oceans, 122(9), 7267–7290, doi:10.1002/2017jc012952.
  118. Walsh, J.E. et al., 2018: The high latitude marine heat wave of 2016 and its impacts on Alaska. In “Explaining Extreme Events of 2016 from a Climate Perspective”. Bull. Am. Meterol. Soc., 99(1), S39–S43, doi:10.1175/bams-d-17-0105.1.
  119. Tan, H. and R. Cai, 2018: What caused the record‐breaking warming in East China Seas during August 2016? Atmos. Sci. Lett., 19(10), e853, doi:10.1002/asl.853.
  120. Kim, J.-Y. and I.-S. Han, 2017: Sea Surface Temperature Time Lag Due to the Extreme Heat Wave of August 2016. J. Korean Soc. Mar. Environ. Saf., 23(6), 677–683, doi:10.7837/kosomes.2017.23.6.677.
  121. Qian, C. et al., 2018: Human influence on the record-breaking cold event in January of 2016 in Eastern China. In “Explaining Extreme Events of 2016 from a Climate Perspective”. Bull. Am. Meterol. Soc., 99(1), S118–S122, doi:10.1175/BAMS-ExplainingExtremeEvents2016.1.
  122. Sun, Q. and C. Miao, 2018: Extreme rainfall (R20mm, Rx5day) in Yangtze-Huai, China in June-July 2016: The role of ENSO and anthropogenic climate change. In “Explaining Extreme Events of 2016 from a Climate Perspective”. Bull. Am. Meterol. Soc., 99(1), S102–S106, doi:10.1175/BAMS-D-17-0118.1.
  123. Qian, C. et al., 2018: Human influence on the record-breaking cold event in January of 2016 in Eastern China. In “Explaining Extreme Events of 2016 from a Climate Perspective”. Bull. Am. Meterol. Soc., 99(1), S118–S122, doi:10.1175/BAMS-ExplainingExtremeEvents2016.1.
  124. Turner, J. et al., 2017: Unprecedented springtime retreat of Antarctic sea ice in 2016. Geophys. Res. Lett., 44(13), 6868-6875, doi:10.1002/2017GL073656.
  125. Kusahara, K. et al., 2018: An ocean-sea ice model study of the unprecedented Antarctic sea ice minimum in 2016. Environ. Res. Lett., 13(8), 084020, doi:10.1088/1748-9326/aad624.
  126. Meehl, G.A. et al., 2019: Sustained ocean changes contributed to sudden Antarctic sea ice retreat in late 2016. Nat. Commun., 10(1), 14, doi:10.1038/s41467-018-07865-9.
  127. Kim, J.-Y. and I.-S. Han, 2017: Sea Surface Temperature Time Lag Due to the Extreme Heat Wave of August 2016. J. Korean Soc. Mar. Environ. Saf., 23(6), 677–683, doi:10.7837/kosomes.2017.23.6.677.
  128. Tan, H. and R. Cai, 2018: What caused the record‐breaking warming in East China Seas during August 2016? Atmos. Sci. Lett., 19(10), e853, doi:10.1002/asl.853.
  129. Emanuel, K.A., 2017: Assessing the present and future probability of Hurricane Harvey’s rainfall. PNAS, 114(48), 12681–12684, doi:10.1073/pnas.1716222114.
  130. Risser, M.D. and M.F. Wehner, 2017: Attributable Human‐Induced Changes in the Likelihood and Magnitude of the Observed Extreme Precipitation during Hurricane Harvey. Geophys. Res. Lett., 44(24), 12,457–12,464, doi:10.1002/2017GL075888.
  131. van Oldenborgh, G.J. et al., 2017: Attribution of extreme rainfall from Hurricane Harvey, August 2017. Environ. Res. Lett., 12(12), 124009, doi:10.1088/1748-9326/aa9ef2.
  132. Haarsma, R.J. et al., 2013: More hurricanes to hit western Europe due to global warming. Geophys. Res. Lett., 40(9), 1783–1788, doi:10.1002/grl.50360.
  133. Burt, J.A. et al., 2019: Causes and consequences of the 2017 coral bleaching event in the southern Persian/Arabian Gulf. Coral Reefs, 38(4), 567–589, doi:10.1007/s00338-019-01767-y.
  134. Burt, J.A. et al., 2019: Causes and consequences of the 2017 coral bleaching event in the southern Persian/Arabian Gulf. Coral Reefs, 38(4), 567–589, doi:10.1007/s00338-019-01767-y.
  135. Funk, C. et al., 2018: Anthropogenic enhancement of moderate-to-strong El Nino events likely contributed to drought and poor harvests in Southern Africa during 2016 [in “Explaining Extreme Events of 2016 from a Climate Perspective”]. Bull. Am. Meterol. Soc., 99(1), S91–S101, doi:10.1175/BAMS-ExplainingExtremeEvents2016.1.
  136. Funk, C. et al., 2018: Anthropogenic enhancement of moderate-to-strong El Nino events likely contributed to drought and poor harvests in Southern Africa during 2016 [in “Explaining Extreme Events of 2016 from a Climate Perspective”]. Bull. Am. Meterol. Soc., 99(1), S91–S101, doi:10.1175/BAMS-ExplainingExtremeEvents2016.1.
  137. FEWS NET and FSNAU, 2017: Risk of Famine (IPC Phase 5) persists in Somalia. Somalia Food Security Outlook, Famine Early Warning Systems Network; Food Security and Nutrition Analysis Unit – Somalia, 16 pp. http://www.fsnau.org/downloads/FEWSNET-FSNAU-Joint-Somalia-Food-Security-Outlook-February-to-September-2017_0.pdf. Accessed 2019/20/08.
  138. WFP, FEWS NET, European Commission and FAO, 2017: Persistent drought in Somalia leads to major food security crisis. Joint Press Release, World Food Programme; Famine Early Warning Systems Network; European Commission; Food and Agriculture Organization of the United Nations, Rome, Italy, 6 pp. https://documents.wfp.org/stellent/groups/public/documents/ena/wfp290554.pdf?_ga=2.40555818.965568665.1558310041-1569466447.1558310041%5D.
  139. Christidis, N., R.A. Betts and P.A. Stott, 2018a: The Extremely Wet March of 2017 in Peru [in “Explaining Extremes of 2017 from a Climate Perspective”]. Bull. Am. Meterol. Soc., 100(1), S31–S37, doi:10.1175/BAMS-ExplainingExtremeEvents2017.1.
  140. Christidis, N., R.A. Betts and P.A. Stott, 2018a: The Extremely Wet March of 2017 in Peru [in “Explaining Extremes of 2017 from a Climate Perspective”]. Bull. Am. Meterol. Soc., 100(1), S31–S37, doi:10.1175/BAMS-ExplainingExtremeEvents2017.1.
  141. Rimi, R.H., K. Huaustein, M.R. Allen and E.J. Barbour, 2018: Risks of pre-monsoon extreme rainfall events of Bangladesh: Is anthropogenic climate change playing a role? In “Explaining Extremes of 2017 from a Climate Perspective”. Bull. Am. Meterol. Soc., 100(1), S61–S66, doi:10.1175/BAMS-D-18-0135.1.
  142. FAMURS, 2017: Sobe para R$ 339 milhões o valor dos prejuízos com o temporal no RS. Federação das Associações de Municípios do Rio Grande do Sul (FAMURS). Porto Allegre, Brazil. Available at: http://www.famurs.com.br/noticias/sobe-para-r-339-milhoes-o-valor-dos-prejuizos-com-o-temporal-no-rs/. Accessed 2019/05/20.]
  143. Wang, S., X. Yuan and R. Wu, 2018: Attribution of the Persistent Spring–Summer Hot and Dry Extremes over Northeast China in 2017. In “Explaining Extremes of 2017 from a Climate Perspective”. Bull. Am. Meterol. Soc., 100(1), S85–S90, doi:10.1175/BAMS-D-18-0135.1.
  144. Zhang, Y., L. Zhang, S.P. Wang and J. Feng, 2017c: Drought events and their influence in summer of 2017 in China (in Chinese). J. Arid. Meteorol., 35, 899–905.
  145. ENFEN, 2017: El Niño Costero 2017. Informe Técnico Extraordinario, N°001-2017/ENFEN, Estudio Nacional del Fenómeno “El Niño”, Estudio Nacional Del Fenómeno “El Niño” (ENFEN). Peru. 31 pp. http://www.imarpe.pe/imarpe/archivos/informes/imarpe_inftco_informe__tecnico_extraordinario_001_2017.pdf. Accessed 2018/09/28.
  146. Garreaud, R.D., 2018: A plausible atmospheric trigger for the 2017 coastal El Niño. Int. J. Climatol., 38, e1296-–e1302, doi:10.1002/joc.5426.
  147. IMPARPE, 2017: Informe integrado de la operación EUREKA LXIX Instituto del Mar del Perú, 23 pp [Available at: http://www.imarpe.pe/imarpe/archivos/informes/Informe_Operacion_EUREKA_LXIX%20_21_23feb_2017.pdf%5D. [publisher information: Instituto del Mar del Perú (IMPARPE). Peru. Accessed 2018/09/28.]
  148. Manta, G. et al., 2018: The 2017 Record Marine Heatwave in the Southwestern Atlantic Shelf. Geophys. Res. Lett., 45(22), 12,449–12,456, doi:10.1029/2018GL081070.
  149. Bindoff, N.L. et al., 2013: Detection and Attribution of Climate Change: from Global to Regional. In: Climate Change 2013: The Physical Science Basis. Contribution of Working Group I to the Fifth Assessment Report of the Intergovernmental Panel on Climate Change [Stocker, T.F., D. Qin, G.-K. Plattner, M. Tignor, S.K. Allen, J. Boschung, A. Nauels, Y. Xia, V. Bex and P.M. Midgley (eds.)]. Cambridge University Press, Cambridge, United Kingdom and New York, NY, USA, 867-952.
  150. Hartmann, D. L. et al., 2013: Observations: Atmosphere and Surface. In: Climate Change 2013: The Physical Science Basis. Contribution of Working Group I to the Fifth Assessment Report of the Intergovernmental Panel on Climate Change [Stocker, T.F., D. Qin, G.-K. Plattner, M. Tignor, S.K. Allen, J. Boschung, A. Nauels, Y. Xia, V. Bex and P.M. Midgley (eds.)]. Cambridge University Press, Cambridge, United Kingdom and New York, NY, USA, 159-254.
  151. Christensen, J.H. et al., 2013: Climate Phenomena and their Relevance for Future Regional Climate Change. In: Climate Change 2013: The Physical Science Basis. Contribution of Working Group I to the Fifth Assessment Report of the Intergovernmental Panel on Climate Change [Stocker, T.F., D. Qin, G.-K. Plattner, M. Tignor, S.K. Allen, J. Boschung, A. Nauels, Y. Xia, V. Bex and P.M. Midgley (eds.)]. Cambridge University Press, Cambridge, United Kingdom and New York, NY, USA, 1217-1308.
  152. Hartmann, D. L. et al., 2013: Observations: Atmosphere and Surface. In: Climate Change 2013: The Physical Science Basis. Contribution of Working Group I to the Fifth Assessment Report of the Intergovernmental Panel on Climate Change [Stocker, T.F., D. Qin, G.-K. Plattner, M. Tignor, S.K. Allen, J. Boschung, A. Nauels, Y. Xia, V. Bex and P.M. Midgley (eds.)]. Cambridge University Press, Cambridge, United Kingdom and New York, NY, USA, 159-254.
  153. Toomey, M.R., J.P. Donnelly and J.D. Woodruff, 2013: Reconstructing mid-late Holocene cyclone variability in the Central Pacific using sedimentary records from Tahaa, French Polynesia. Quaternary Sci. Rev., 77, 181–189, doi:https://doi.org/10.1016/j.quascirev.2013.07.019.
  154. Denommee, K.C., S.J. Bentley and A.W. Droxler, 2014: Climatic controls on hurricane patterns: a 1200-y near-annual record from Lighthouse Reef, Belize. Sci. Rep., 4, 3876, doi:10.1038/srep03876.
  155. Denniston, R. F. et al., 2015: Extreme rainfall activity in the Australian tropics reflects changes in the El Niño/Southern Oscillation over the last two millennia. PNAS, 112 (15), 4576, doi:10.1073/pnas.1422270112.
  156. Dunstone, N. et al., 2013: Anthropogenic aerosol forcing of Atlantic tropical storms. Nat. Geosci., 6(7), 534–539, doi:10.1038/NGEO1854.
  157. Booth, J.F., L. Thompson, J. Patoux and K.A. Kelly, 2012: Sensitivity of midlatitude storm intensification to perturbations in the sea surface temperature near the Gulf Stream. Mon. Weather Rev., 140(4), 1241–1256, doi:10.1175/mwr-d-11-00195.1.
  158. Dunstone, N. et al., 2013: Anthropogenic aerosol forcing of Atlantic tropical storms. Nat. Geosci., 6(7), 534–539, doi:10.1038/NGEO1854.
  159. Weinkle, J., R. Maue and R. Pielke Jr, 2012: Historical global tropical cyclone landfalls. J. Clim., 25(13), 4729–4735, doi:10.1175/JCLI-D-11-00719.1.
  160. Zhang, R. et al., 2013: Have aerosols caused the observed Atlantic multidecadal variability? J. Atmos. Sci., 70(4), 1135–1144, doi:10.1175/JAS-D-12-0331.1.
  161. Vecchi, G.A., T.L. Delworth and B. Booth, 2017: Climate science: Origins of Atlantic decadal swings. Nature, 548(7667), 284, doi:10.1038/nature23538.
  162. Yan, X., R. Zhang and T.R. Knutson, 2017: The role of Atlantic overturning circulation in the recent decline of Atlantic major hurricane frequency. Nat. Commun., 8(1), 1695, doi:10.1038/s41467-017-01377-8.
  163. Sobel, A.H. et al., 2016: Human influence on tropical cyclone intensity. Science, 353(6296), 242–246, doi:10.1126/science.aaf6574.
  164. Emanuel, K. A., 2015: Effect of upper-ocean evolution on projected trends in tropical cyclone activity. J. Clim., 28(20), 8165–8170, doi:10.1175/Jcli-D-15-0401.1.
  165. Huang, P., I.I. Lin, C. Chou and R.-H. Huang, 2015b: Change in ocean subsurface environment to suppress tropical cyclone intensification under global warming. Nat. Commun., 6, 7188, doi:10.1038/ncomms8188.
  166. Tuleya, R.E. et al., 2016: Impact of upper-tropospheric temperature anomalies and vertical wind shear on tropical cyclone evolution using an idealized version of the operational GFDL hurricane model. J. Atmos. Sci., 73(10), 3803-3820, doi:10.1175/Jas-D-16-0045.1.
  167. Balaguru, K. et al., 2015: Dynamic Potential Intensity: An improved representation of the ocean’s impact on tropical cyclones. Geophys. Res. Lett., 42(16), 6739–6746, doi:10.1002/2015GL064822.
  168. Balaguru, K. et al., 2015: Dynamic Potential Intensity: An improved representation of the ocean’s impact on tropical cyclones. Geophys. Res. Lett., 42(16), 6739–6746, doi:10.1002/2015GL064822.
  169. Bhatia, K. et al., 2018: Projected response of tropical cyclone intensity and intensification in a global climate model. J. Clim., 31(20), 8281–8303, doi:10.1175/JCLI-D-17-0898.1.
  170. Timmermans, B., D. Stone, M. Wehner and H. Krishnan, 2017: Impact of tropical cyclones on modeled extreme wind-wave climate. Geophys. Res. Lett., 44(3), 1393–1401, doi:10.1002/2016GL071681.
  171. Kossin, J.P., K.A. Emanuel and G.A. Vecchi, 2014: The poleward migration of the location of tropical cyclone maximum intensity. Nature, 509(7500), 349–352, doi:10.1038/nature13278.
  172. Sharmila, S. and K.J.E. Walsh, 2018: Recent poleward shift of tropical cyclone formation linked to Hadley cell expansion. Nat. Clim. Change, 8, 730–736, doi:10.1038/s41558-018-0227-5.
  173. Kossin, J.P., K.A. Emanuel and S.J. Camargo, 2016: Past and Projected Changes in Western North Pacific Tropical Cyclone Exposure. J. Clim., 29(16), 5725–5739, doi:10.1175/Jcli-D-16-0076.1.
  174. Kossin, J.P., 2018: A global slowdown of tropical-cyclone translation speed. Nature, 558(7708), 104–107, doi:10.1038/s41586-018-0158-3.
  175. Emanuel, K.A., 2017: Assessing the present and future probability of Hurricane Harvey’s rainfall. PNAS, 114(48), 12681–12684, doi:10.1073/pnas.1716222114.
  176. Risser, M.D. and M.F. Wehner, 2017: Attributable Human‐Induced Changes in the Likelihood and Magnitude of the Observed Extreme Precipitation during Hurricane Harvey. Geophys. Res. Lett., 44(24), 12,457–12,464, doi:10.1002/2017GL075888.
  177. van Oldenborgh, G.J. et al., 2017: Attribution of extreme rainfall from Hurricane Harvey, August 2017. Environ. Res. Lett., 12(12), 124009, doi:10.1088/1748-9326/aa9ef2.
  178. Callaghan, J. and S.B. Power, 2011: Variability and decline in the number of severe tropical cyclones making land-fall over eastern Australia since the late nineteenth century. Clim. Dynam., 37(3), 647–662, doi:10.1007/s00382-010-0883-2.
  179. Grinsted, A., J.C. Moore and S. Jevrejeva, 2012: Homogeneous record of Atlantic hurricane surge threat since 1923. PNAS, 109(48), 19601–19605, doi:10.1073/pnas.1209542109.
  180. Murakami, H. et al., 2017: Dominant role of subtropical Pacific warming in extreme eastern Pacific hurricane seasons: 2015 and the future. J. Clim., 30(1), 243–264, doi:10.1175/Jcli-D-16-0424.1.
  181. Mei, W. and S.-P. Xie, 2016: Intensification of landfalling typhoons over the northwest Pacific since the late 1970s. Nat. Geosci., 9, 753, doi:10.1038/ngeo2792.
  182. Li, R.C.Y., W. Zhou, C.M. Shun and T.C. Lee, 2017: Change in destructiveness of landfalling tropical cyclones over China in recent decades. J. Clim., 30(9), 3367–3379, doi:10.1175/Jcli-D-16-0258.1.
  183. Holland, G. and C.L. Bruyère, 2014: Recent intense hurricane response to global climate change. Clim. Dynam., 42(3), 617–627, doi:10.1007/s00382-013-1713-0.
  184. Emanuel, K.A., 2017: Assessing the present and future probability of Hurricane Harvey’s rainfall. PNAS, 114(48), 12681–12684, doi:10.1073/pnas.1716222114.
  185. Balaguru, K., G.R. Foltz and L.R. Leung, 2018: Increasing Magnitude of Hurricane Rapid Intensification in the Central and Eastern Tropical Atlantic. Geophys. Res. Lett., 45(9), 423–4247, doi:10.1029/2018gl077597.
  186. Zhao, H., X. Duan, G.B. Raga and P.J. Klotzbach, 2018: Changes in Characteristics of Rapidly Intensifying Western North Pacific Tropical Cyclones Related to Climate Regime Shifts. J. Clim., 31(19), 8163–8179, doi:10.1175/jcli-d-18-0029.1.
  187. Bhatia, K.T. et al., 2019: Recent increases in tropical cyclone intensification rates. Nat. Commun., 10(1), 635, doi:10.1038/s41467-019-08471-z.
  188. Kossin, J.P., 2017: Hurricane intensification along United States coast suppressed during active hurricane periods. Nature, 541, 390, doi:10.1038/nature20783.
  189. Lackmann, G.M., 2015: Hurricane Sandy before 1900 and after 2100. Bull. Am. Meterol. Soc., 96(4), 547–560, doi:10.1175/Bams-D-14-00123.1.
  190. Murakami, H. et al., 2015: Investigating the influence of anthropogenic forcing and natural variability on the 2014 Hawaiian hurricane season. Bull. Am. Meterol. Soc., 96(12), S115–S119, doi:10.1175/Bams-D-15-00119.1.
  191. Takayabu, I. et al., 2015: Climate change effects on the worst-case storm surge: a case study of Typhoon Haiyan. Environ. Res. Lett., 10(6), 064011, doi:10.1088/1748-9326/10/6/064011.
  192. Zhang, W. et al., 2016: The Pacific Meridional Mode and the Occurrence of Tropical Cyclones in the Western North Pacific. J. Clim., 29(1), 381–398, doi:10.1175/jcli-d-15-0282.1.
  193. Emanuel, K.A., 2017: Assessing the present and future probability of Hurricane Harvey’s rainfall. PNAS, 114(48), 12681–12684, doi:10.1073/pnas.1716222114.
  194. Zhan, R., 2017: Intensified mega-ENSO has increased the proportion of intense tropical cyclones over the western northwest Pacific since the late 1970s. Geophys. Res. Lett., 44(23), 11,959–11,966, doi:10.1002/2017glo75916.
  195. Zhan, R., 2017: Intensified mega-ENSO has increased the proportion of intense tropical cyclones over the western northwest Pacific since the late 1970s. Geophys. Res. Lett., 44(23), 11,959–11,966, doi:10.1002/2017glo75916.
  196. Manganello, J.V. et al., 2014: Future Changes in the Western North Pacific Tropical Cyclone Activity Projected by a Multidecadal Simulation with a 16-km Global Atmospheric GCM. J. Clim., 27(20), 7622–7646, doi:10.1175/JCLI-D-13-00678.1.
  197. Knutson, T.R. et al., 2015: Global Projections of Intense Tropical Cyclone Activity for the Late Twenty-First Century from Dynamical Downscaling of CMIP5/RCP4.5 Scenarios. J. Clim., 28(18), 7203–7224, doi:10.1175/JCLI-D-15-0129.1.
  198. Murakami, H. et al., 2015: Investigating the influence of anthropogenic forcing and natural variability on the 2014 Hawaiian hurricane season. Bull. Am. Meterol. Soc., 96(12), S115–S119, doi:10.1175/Bams-D-15-00119.1.
  199. Roberts, M.J. et al., 2015: Tropical cyclones in the UPSCALE ensemble of high-resolution global climate models. J. Clim., 28(2), 574–596, doi:10.1175/Jcli-D-14-00131.1.
  200. Wehner, M. et al., 2015: Resolution Dependence of Future Tropical Cyclone Projections of CAM5.1 in the US CLIVAR Hurricane Working Group Idealized Configurations. J. Clim., 28(10), 3905–3925, doi:10.1175/JCLI-D-14-00311.1.
  201. Yamada, Y. et al., 2017: Response of Tropical Cyclone Activity and Structure to Global Warming in a High-Resolution Global Nonhydrostatic Model. J. Clim., 30, 9703–9724, doi:10.1175/Jcli-D-17-0068.1.
  202. Emanuel, K.A., 2013: Downscaling CMIP5 climate models shows increased tropical cyclone activity over the 21st century. PNAS, 110(30), 12219–12224, doi:10.1073/pnas.1301293110.
  203. Bhatia, K. et al., 2018: Projected response of tropical cyclone intensity and intensification in a global climate model. J. Clim., 31(20), 8281–8303, doi:10.1175/JCLI-D-17-0898.1.
  204. Li, T. et al., 2010: Global warming shifts Pacific tropical cyclone location. Geophys. Res. Lett., 37(21), L21804, doi:10.1029/2010gl045124.
  205. Kim, H.S. et al., 2014a: Tropical Cyclone Simulation and Response to CO2 Doubling in the GFDL CM2.5 High-Resolution Coupled Climate Model. J. Clim., 27(21), 8034–8054, doi:10.1175/jcli-d-13-00475.1.
  206. Manganello, J.V. et al., 2014: Future Changes in the Western North Pacific Tropical Cyclone Activity Projected by a Multidecadal Simulation with a 16-km Global Atmospheric GCM. J. Clim., 27(20), 7622–7646, doi:10.1175/JCLI-D-13-00678.1.
  207. Knutson, T.R. et al., 2015: Global Projections of Intense Tropical Cyclone Activity for the Late Twenty-First Century from Dynamical Downscaling of CMIP5/RCP4.5 Scenarios. J. Clim., 28(18), 7203–7224, doi:10.1175/JCLI-D-15-0129.1.
  208. Murakami, H. et al., 2015: Investigating the influence of anthropogenic forcing and natural variability on the 2014 Hawaiian hurricane season. Bull. Am. Meterol. Soc., 96(12), S115–S119, doi:10.1175/Bams-D-15-00119.1.
  209. Roberts, M.J. et al., 2015: Tropical cyclones in the UPSCALE ensemble of high-resolution global climate models. J. Clim., 28(2), 574–596, doi:10.1175/Jcli-D-14-00131.1.
  210. Wehner, M. et al., 2015: Resolution Dependence of Future Tropical Cyclone Projections of CAM5.1 in the US CLIVAR Hurricane Working Group Idealized Configurations. J. Clim., 28(10), 3905–3925, doi:10.1175/JCLI-D-14-00311.1.
  211. Nakamura, J. et al., 2017: Western North Pacific Tropical Cyclone Model Tracks in Present and Future Climates. J. Geophys. Res.-Atmos., 122(18), 9721–9744, doi:10.1002/2017jd027007.
  212. Park, D.-S.R. et al., 2017: Asymmetric response of tropical cyclone activity to global warming over the North Atlantic and western North Pacific from CMIP5 model projections. Sci. Rep., 7, 41354, doi:10.1038/srep41354.
  213. Sugi, M., H. Murakami and K. Yoshida, 2017: Projection of future changes in the frequency of intense tropical cyclones. Clim. Dynam., 49(1–2), 619–632, doi:10.1007/s00382-016-3361-7.
  214. Yamada, Y. et al., 2017: Response of Tropical Cyclone Activity and Structure to Global Warming in a High-Resolution Global Nonhydrostatic Model. J. Clim., 30, 9703–9724, doi:10.1175/Jcli-D-17-0068.1.
  215. Yoshida, K. et al., 2017: Future Changes in Tropical Cyclone Activity in High‐Resolution Large‐Ensemble Simulations. Geophys. Res. Lett., 44(19), 9910–9917, doi:10.1002/2017GL075058.
  216. Zhang, L., K.B. Karnauskas, J.P. Donnelly and K. Emanuel, 2017a: Response of the North Pacific Tropical Cyclone Climatology to Global Warming: Application of Dynamical Downscaling to CMIP5 Models. J. Clim., 30(4), 1233–1243, doi:10.1175/jcli-d-16-0496.1.
  217. Kim, H.S. et al., 2014a: Tropical Cyclone Simulation and Response to CO2 Doubling in the GFDL CM2.5 High-Resolution Coupled Climate Model. J. Clim., 27(21), 8034–8054, doi:10.1175/jcli-d-13-00475.1.
  218. Knutson, T.R. et al., 2015: Global Projections of Intense Tropical Cyclone Activity for the Late Twenty-First Century from Dynamical Downscaling of CMIP5/RCP4.5 Scenarios. J. Clim., 28(18), 7203–7224, doi:10.1175/JCLI-D-15-0129.1.
  219. Yamada, Y. et al., 2017: Response of Tropical Cyclone Activity and Structure to Global Warming in a High-Resolution Global Nonhydrostatic Model. J. Clim., 30, 9703–9724, doi:10.1175/Jcli-D-17-0068.1.
  220. Garner, A.J. et al., 2017: Impact of climate change on New York City’s coastal flood hazard: Increasing flood heights from the preindustrial to 2300 CE. PNAS, 114(45), 11861–-11866, doi:10.1073/pnas.1703568114.
  221. Shaw, T.A. et al., 2016: Storm track processes and the opposing influences of climate change. Nat. Geosci., 9, 656, doi:10.1038/ngeo2783.
  222. Christensen, J.H. et al., 2013: Climate Phenomena and their Relevance for Future Regional Climate Change. In: Climate Change 2013: The Physical Science Basis. Contribution of Working Group I to the Fifth Assessment Report of the Intergovernmental Panel on Climate Change [Stocker, T.F., D. Qin, G.-K. Plattner, M. Tignor, S.K. Allen, J. Boschung, A. Nauels, Y. Xia, V. Bex and P.M. Midgley (eds.)]. Cambridge University Press, Cambridge, United Kingdom and New York, NY, USA, 1217-1308.
  223. Christensen, J.H. et al., 2013: Climate Phenomena and their Relevance for Future Regional Climate Change. In: Climate Change 2013: The Physical Science Basis. Contribution of Working Group I to the Fifth Assessment Report of the Intergovernmental Panel on Climate Change [Stocker, T.F., D. Qin, G.-K. Plattner, M. Tignor, S.K. Allen, J. Boschung, A. Nauels, Y. Xia, V. Bex and P.M. Midgley (eds.)]. Cambridge University Press, Cambridge, United Kingdom and New York, NY, USA, 1217-1308.
  224. Woollings, T. et al., 2018: Blocking and its Response to Climate Change. Curr. Clim., 4(3), 287–300, doi:10.1007/s40641-018-0108-z.
  225. Barnes, E.A. and L.M. Polvani, 2015: CMIP5 Projections of Arctic Amplification, of the North American/North Atlantic Circulation, and of Their Relationship. J. Clim., 28(13), 5254–5271, doi:10.1175/jcli-d-14-00589.1.
  226. Francis, J. and N. Skific, 2015: Evidence linking rapid Arctic warming to mid-latitude weather patterns. Philos. Trans. Royal Soc. A., 373(2045), 20140170, doi:10.1098/rsta.2014.0170.
  227. Francis, J. and N. Skific, 2015: Evidence linking rapid Arctic warming to mid-latitude weather patterns. Philos. Trans. Royal Soc. A., 373(2045), 20140170, doi:10.1098/rsta.2014.0170.
  228. Kretschmer, M., D. Coumou, J.F. Donges and J. Runge, 2016: Using Causal Effect Networks to Analyze Different Arctic Drivers of Midlatitude Winter Circulation. J. Clim., 29(11), 4069–4081, doi:10.1175/jcli-d-15-0654.1.
  229. Cvijanovic, I. et al., 2017: Future loss of Arctic sea-ice cover could drive a substantial decrease in California’s rainfall. Nat. Commun., 8(1), 1947, doi:10.1038/s41467-017-01907-4.
  230. Liu, J. et al., 2012: Impact of declining Arctic sea ice on winter snowfall. PNAS, 109(11), 4074, doi:10.1073/pnas.1114910109.
  231. Cohen, J., K. Pfeiffer and J.A. Francis, 2018: Warm Arctic episodes linked with increased frequency of extreme winter weather in the United States. Nat. Commun., 9(1), 869, doi:10.1038/s41467-018-02992-9.
  232. Tang, Q., X. Zhang, X. Yang and J.A. Francis, 2013: Cold winter extremes in northern continents linked to Arctic sea ice loss. Environ. Res. Lett., 8(1), 014036, doi:10.1088/1748-9326/8/1/014036.
  233. Coumou, D. et al., 2014: Quasi-resonant circulation regimes and hemispheric synchronization of extreme weather in boreal summer. PNAS, 111(34), 12331, doi:10.1073/pnas.1412797111.
  234. Stadtherr, L. et al., 2016: Record Balkan floods of 2014 linked to planetary wave resonance. Sci. Adv., 2(4), e1501428, doi:10.1126/sciadv.1501428.
  235. Gong, T. and D. Luo, 2017: Ural Blocking as an Amplifier of the Arctic Sea Ice Decline in Winter. J. Clim., 30(7), 2639–2654, doi:10.1175/jcli-d-16-0548.1.
  236. Barnes, E.A. and L.M. Polvani, 2015: CMIP5 Projections of Arctic Amplification, of the North American/North Atlantic Circulation, and of Their Relationship. J. Clim., 28(13), 5254–5271, doi:10.1175/jcli-d-14-00589.1.
  237. Röthlisberger, M., S. Pfahl and O. Martius, 2016: Regional-scale jet waviness modulates the occurrence of midlatitude weather extremes. Geophys. Res. Lett., 43, 10,989–10,997, doi:10.1002/2016GL070944.
  238. Mann, M.E. et al., 2017: Influence of Anthropogenic Climate Change on Planetary Wave Resonance and Extreme Weather Events. Sci. Rep., 7, 45242, doi:10.1038/srep45242.
  239. Coumou, D. et al., 2014: Quasi-resonant circulation regimes and hemispheric synchronization of extreme weather in boreal summer. PNAS, 111(34), 12331, doi:10.1073/pnas.1412797111.
  240. Screen, J.A. and I. Simmonds, 2013: Exploring links between Arctic amplification and mid-latitude weather. Geophys. Res. Lett., 40(5), 959–964, doi:10.1002/grl.50174.
  241. Cohen, J. et al., 2014: Recent Arctic amplification and extreme mid-latitude weather. Nat. Geosci., 7, 627, doi:10.1038/ngeo2234.
  242. Screen, J.A. and I. Simmonds, 2013: Exploring links between Arctic amplification and mid-latitude weather. Geophys. Res. Lett., 40(5), 959–964, doi:10.1002/grl.50174.
  243. Barnes, E.A. and L.M. Polvani, 2015: CMIP5 Projections of Arctic Amplification, of the North American/North Atlantic Circulation, and of Their Relationship. J. Clim., 28(13), 5254–5271, doi:10.1175/jcli-d-14-00589.1.
  244. Barnes, E.A. and L.M. Polvani, 2015: CMIP5 Projections of Arctic Amplification, of the North American/North Atlantic Circulation, and of Their Relationship. J. Clim., 28(13), 5254–5271, doi:10.1175/jcli-d-14-00589.1.
  245. Harvey, B.J., L.C. Shaffrey and T.J. Woollings, 2015: Deconstructing the climate change response of the Northern Hemisphere wintertime storm tracks. Clim. Dynam., 45(9), 2847–2860, doi:10.1007/s00382-015-2510-8.
  246. Grieger, J. et al., 2014: Southern Hemisphere winter cyclone activity under recent and future climate conditions in multi-model AOGCM simulations. Int. J. Climatol., 34(12), 3400–3416, doi:10.1002/joc.3917.
  247. Frederiksen, C.S., J.S. Frederiksen, J.M. Sisson and S.L. Osbrough, 2017: Trends and projections of Southern Hemisphere baroclinicity: the role of external forcing and impact on Australian rainfall. Clim. Dynam., 48(9), 3261–3282, doi:10.1007/s00382-016-3263-8.
  248. Rhein, M. et al., 2013: Observations: Ocean. In: Climate Change 2013: The Physical Science Basis. Contribution of Working Group I to the Fifth Assessment Report of the Intergovernmental Panel on Climate Change [Stocker, T.F., D. Qin, G.-K. Plattner, M. Tignor, S.K. Allen, J. Boschung, A. Nauels, Y. Xia, V. Bex and P.M. Midgley (eds.)]. Cambridge University Press, Cambridge, United Kingdom and New York, NY, USA, 255-316.
  249. Collins, M. et al., 2013: Long-term Climate Change: Projections, Commitments and Irreversibility. In: Climate Change 2013: The Physical Science Basis. Contribution of Working Group I to the Fifth Assessment Report of the Intergovernmental Panel on Climate Change [Stocker, T.F., D. Qin, G.-K. Plattner, M. Tignor, S.K. Allen, J. Boschung, A. Nauels, Y. Xia, V. Bex and P.M. Midgley (eds.)]. Cambridge University Press, Cambridge, United Kingdom and New York, NY, USA, 1029-1136.
  250. Holland, M. M., C. M. Bitz and B. Tremblay, 2006: Future abrupt reductions in the summer Arctic sea ice. Geophys. Res. Lett., 33(23), L23503, doi:10.1029/2006GL028024.
  251. Church, J.A. et al., 2013: Sea Level Change. In: Climate Change 2013: The Physical Science Basis. Contribution of Working Group I to the Fifth Assessment Report of the Intergovernmental Panel on Climate Change [Stocker, T.F., D. Qin, G.-K. Plattner, M. Tignor, S.K. Allen, J. Boschung, A. Nauels, Y. Xia, V. Bex and P.M. Midgley (eds.)]. Cambridge University Press, Cambridge, United Kingdom and New York, NY, USA, 1137-1216.
  252. Young, I.R. and A. Ribal, 2019: Multiplatform evaluation of global trends in wind speed and wave height. Science, 364(6440), 548, doi:10.1126/science.aav9527.
  253. Stopa, J.E., F. Ardhuin and F. Girard-Ardhuin, 2016: Wave climate in the Arctic 1992–2014: seasonality and trends. The Cryosphere, 10(4), 1605–1629, doi:10.5194/tc-10-1605-2016.
  254. Thomas, A.R., 2015: Resettlement in the Wake of Typhoon Haiyan in the Philippines: A Strategy to Mitigate Risk or a Risky Strategy? The Brookings-LSE Project on Internal Displacement, The Brookings Institution, Washington, D.C., 29 pp. http://www.brookings.edu/wp-content/uploads/2016/06/Brookings-Planned-Relocations-Case-StudyAlice-Thomas-Philippines-case-study-June-2015.pdf. Accessed 2019/20/08.
  255. Reguero, B.G., I.J. Losada and F.J. Méndez, 2019: A recent increase in global wave power as a consequence of oceanic warming. Nat. Commun., 10(1), 205–205, doi:10.1038/s41467-018-08066-0.
  256. Shimizu, M. and A.L. Clark, 2015: Interconnected risks, cascading disasters and disaster management policy: a gap analysis. Planet@ Risk, 3(2), Global Risk Forum GRF Davos, Promenade 35, CH-7270 Davos Platz, Switzerland 260–270. ISSN 2296-8172
  257. Morim, J. et al., 2018: On the concordance of 21st century wind-wave climate projections. Glob. Planet. Change, 167, 160–171, doi:10.1016/j.gloplacha.2018.05.005.
  258. Verlaan, M., S. De Kleermaeker and L. Buckman, 2015: GLOSSIS: Global storm surge forecasting and information System. In: Australasian Coasts and Ports Conference 2015 [22nd Australasian Coastal and Ocean Engineering Conference and the 15th Australasian Port and Harbour Conference, Auckland, New Zealand.. Engineers Australia and IPENZ, 229-234. ISBN: 9781922107794
  259. Muis, S. et al., 2016: A global reanalysis of storm surges and extreme sea levels. Nat. Commun., 7, 11969, doi:10.1038/ncomms11969.
  260. Pickering, M.D. et al., 2017: The impact of future sea level rise on the global tides. Cont. Shelf Res., 142(Supplement C), 50–68, doi:10.1016/j.csr.2017.02.004.
  261. Vousdoukas, M.I. et al., 2018: Climatic and socioeconomic controls of future coastal flood risk in Europe. Nat. Clim. Change, 8(9), 776–780, doi:10.1038/s41558-018-0260-4.
  262. Walsh, J.E. et al., 2018: The high latitude marine heat wave of 2016 and its impacts on Alaska. In “Explaining Extreme Events of 2016 from a Climate Perspective”. Bull. Am. Meterol. Soc., 99(1), S39–S43, doi:10.1175/bams-d-17-0105.1.
  263. Melet, A., R. Almar and B. Meyssignac, 2016: What dominates sea level at the coast: a case study for the Gulf of Guinea. Ocean Dynam., 66(5), 623–636, doi:10.1007/s10236-016-0942-2.
  264. Wadey, M., S. Brown, R.J. Nicholls and I. Haigh, 2017: Coastal flooding in the Maldives: an assessment of historic events and their implications. Nat. Hazards, 89(1), 131–159, doi:10.1007/s11069-017-2957-5.
  265. Wahl, T., N.G. Plant and J.W. Long, 2016: Probabilistic assessment of erosion and flooding risk in the northern Gulf of Mexico. J. Geophys. Res.-Oceans, 121(5), 3029–3043, doi:10.1002/2015JC011482.
  266. Colberg, F., K.L. McInnes, J. O’Grady and R. Hoeke, 2019: Atmospheric circulation changes and their impact on extreme sea levels around Australia. Nat. Hazard. Earth Sys., 19, 1–20, doi:10.5194/nhess-2018-64.
  267. McInnes, K.L. et al., 2014: Quantifying storm tide risk in Fiji due to climate variability and change. Glob. Planet. Change, 116, 115–129, doi:10.1016/j.gloplacha.2014.02.004.
  268. McInnes, K.L. et al., 2016: Application of a synthetic cyclone method for assessment of tropical cyclone storm tides in Samoa. Nat. Hazards, 80(1), 425–444, doi:10.1007/s11069-015-1975-4.
  269. Hoeke, R.K., K. McInnes and J. O’Grady, 2015: Wind and Wave Setup Contributions to Extreme Sea Levels at a Tropical High Island: A Stochastic Cyclone Simulation Study for Apia, Samoa. J. Mar. Sci. Tech., 3(3), 1117, doi:10.3390/jmse3031117.
  270. Hoeke, R.K., K. McInnes and J. O’Grady, 2015: Wind and Wave Setup Contributions to Extreme Sea Levels at a Tropical High Island: A Stochastic Cyclone Simulation Study for Apia, Samoa. J. Mar. Sci. Tech., 3(3), 1117, doi:10.3390/jmse3031117.
  271. Vousdoukas, M.I. et al., 2017: Extreme sea levels on the rise along Europe’s coasts. Earth’s Future, 5(3), 304–323, doi:10.1002/2016ef000505.
  272. Vousdoukas, M.I. et al., 2017: Extreme sea levels on the rise along Europe’s coasts. Earth’s Future, 5(3), 304–323, doi:10.1002/2016ef000505.
  273. Handmer, J. et al., 2012: Changes in Impacts of Climate Extremes: Human Systems and Ecosystems. In: Managing the Risks of Extreme Events and Disasters to Advance Climate Change Adaptation. A Special Report of Working Groups I and II of the Intergovernmental Panel on Climate Change (IPCC) [Field, C.B., V. Barros, T.F. Stocker, D. Qin, D.J. Dokken, K.L. Ebi, M.D. Mastrandrea, K.J. Mach, G.K. Plattner, S.K. Allen, M. Tignor and P.M. Midgley (eds.)]. Cambridge University Press, Cambridge, United Kingdom and New York, NY, USA, 231-290.
  274. Arent, D.J. et al., 2014: Key economic sectors and services. In: Climate Change 2014: Impacts, Adaptation, and Vulnerability. Part A: Global and Sectoral Aspects. Contribution of Working Group II to the Fifth Assessment Report of the Intergovernmental Panel of Climate Change [Field, C.B., V.R. Barros, D.J. Dokken, K.J. Mach, M.D. Mastrandrea, T.E. Bilir, M. Chatterjee, K.L. Ebi, Y.O. Estrada, R.C. Genova, B. Girma, E.S. Kissel, A.N. Levy, S. MacCracken, P.R. Mastrandrea and L.L. White (eds.)]. Cambridge University Press, Cambridge, United Kingdom and New York, NY, USA, 659-708.
  275. Yonson, R., I. Noy and J.C. Gaillard, 2018: The measurement of disaster risk: An example from tropical cyclones in the Philippines. Review of Development Economics, 22(2), 736–765, doi:10.1111/rode.12365.
  276. Sweet, W.V. and J. Park, 2014: From the extreme to the mean: Acceleration and tipping points of coastal inundation from sea level rise. Earth’s Future, 2(12), 579–600, doi:10.1002/2014ef000272.
  277. Sainsbury, N.C. et al., 2018: Changing storminess and global capture fisheries. Nat. Clim. Change, 8(8), 655–659, doi:10.1038/s41558-018-0206-x.
  278. Handmer, J. et al., 2012: Changes in Impacts of Climate Extremes: Human Systems and Ecosystems. In: Managing the Risks of Extreme Events and Disasters to Advance Climate Change Adaptation. A Special Report of Working Groups I and II of the Intergovernmental Panel on Climate Change (IPCC) [Field, C.B., V. Barros, T.F. Stocker, D. Qin, D.J. Dokken, K.L. Ebi, M.D. Mastrandrea, K.J. Mach, G.K. Plattner, S.K. Allen, M. Tignor and P.M. Midgley (eds.)]. Cambridge University Press, Cambridge, United Kingdom and New York, NY, USA, 231-290.
  279. Strobl, E., 2012: The economic growth impact of natural disasters in developing countries: Evidence from hurricane strikes in the Central American and Caribbean regions. J. Dev. Econ., 97(1), 130–141, doi:10.1016/j.jdeveco.2010.12.002.
  280. Wang, S. and R. Toumi, 2016: On the relationship between hurricane cost and the integrated wind profile. Environ. Res. Lett., 11(11), 114005, doi:10.1088/1748-9326/11/11/114005.
  281. Paul, B.K., 2009: Why relatively fewer people died? The case of Bangladesh’s Cyclone Sidr. Nat. Hazards, 50(2), 289–304, doi:10.1007/s11069-008-9340-5.
  282. Lumbroso, D.M., N.R. Suckall, R.J. Nicholls and K.D. White, 2017: Enhancing resilience to coastal flooding from severe storms in the USA: international lessons. Nat. Hazard. Earth Sys., 17(8), 1357, doi:10.5194/nhess-17-1357-2017.
  283. Bouwer, L.M. and S.N. Jonkman, 2018: Global mortality from storm surges is decreasing. Environ. Res. Lett., 13, 014008, doi:10.1088/1748-9326/aa98a3.
  284. Lloyd, S.J. et al., 2016: Modelling the influences of climate change-associated sea level rise and socioeconomic development on future storm surge mortality. Clim. Change, 134(3), 441–455, doi:10.1007/s10584-015-1376-4.
  285. Camus, P. et al., 2017: Statistical wave climate projections for coastal impact assessments. Earth’s Future, 5(9), 918–933, doi:10.1002/2017EF000609.
  286. Hallegatte, S., 2013: A Cost Effective Solution to Reduce Disaster Losses in Developing Countries: Hydro-Meteorological Services, Early Warning, and Evacuation. In: Global Problems, Smart Solutions: Costs and Benefits [Lomborg, B. (ed.)]. Cambridge University Press, pp. 481–499. ISBN: 9781107039599
  287. Needham, H.F., B.D. Keim and D. Sathiaraj, 2015: A review of tropical cyclone‐generated storm surges: Global data sources, observations, and impacts. Rev. Geophys., 53(2), 545–591, doi:10.1002/2014RG000477.
  288. Lagmay, A.M.F. et al., 2015: Devastating storm surges of Typhoon Haiyan. Int. J. Disast. Risk Re., 11, 1–12, doi:10.1016/j.ijdrr.2014.10.006.
  289. Morrow, B.H., J.K. Lazo, J. Rhome and J. Feyen, 2015: Improving storm surge risk communication: Stakeholder perspectives. Bull. Am. Meterol. Soc., 96(1), 35–48, doi:10.1175/Bams-D-13-00197.1.
  290. Bostrom, A. et al., 2018: Eyeing the storm: How residents of coastal Florida see hurricane forecasts and warnings. Int. J. Disast. Risk Re., 30, 105–119, doi:10.1016/j.ijdrr.2018.02.027.
  291. Lejano, R.P., J.M. Tan and A.M.W. Wilson, 2016: A Textual Processing Model of Risk Communication: Lessons from Typhoon Haiyan. Weather Clim. Soc., 8(4), 447–463, doi:10.1175/WCAS-D-16-0023.1.
  292. Kulkarni, P.A. et al., 2017: Evacuations as a Result of Hurricane Sandy: Analysis of the 2014 New Jersey Behavioral Risk Factor Survey. Disaster Med. Public., 11(6), 720–728, doi:10.1017/dmp.2017.21.
  293. Dalisay, S.N. and M.T. De Guzman, 2016: Risk and culture: the case of typhoon Haiyan in the Philippines. Disaster Prevention and Management: An International Journal, 25(5), 701–714, doi:10.1108/Dpm-05-2016-0097.
  294. Binder, S.B., 2014: Resilience and postdisaster relocation: A study of New York’s home buyout plan in the wake of Hurricane Sandy. University of Hawai’i at Manoa. [Doctoral dissertation, Honolulu, University of Hawaii at Manoa, May 2014]
  295. Boet-Whitaker, S.K., 2017: Buyouts as resiliency planning in New York City after Hurricane Sandy. Masters dissertation, Cambridge, Massachusetts Institute of Technology, June 2017
  296. Gibbs, L., H.C. Gallagher, K. Block and E. Baker, 2016: Post-bushfire relocation decision-making and personal wellbeing: a case study from Victoria, Australia. In: Planning for Community-based Disaster Resilience Worldwide. Routledge, UK, pp. 355–378. ISBN: 9781472468154
  297. Beine, M. and C. Parsons, 2015: Climatic factors as determinants of international migration. Scand. J. Econ., 117(2), 723–767, doi:10.1111/sjoe.12098.
  298. Hino, M., C.B. Field and K.J. Mach, 2017: Managed retreat as a response to natural hazard risk. Nat. Clim. Change, 7(5), 364–370, doi:10.1038/Nclimate3252.
  299. Thomas, A.R., 2015: Resettlement in the Wake of Typhoon Haiyan in the Philippines: A Strategy to Mitigate Risk or a Risky Strategy? The Brookings-LSE Project on Internal Displacement, The Brookings Institution, Washington, D.C., 29 pp. http://www.brookings.edu/wp-content/uploads/2016/06/Brookings-Planned-Relocations-Case-StudyAlice-Thomas-Philippines-case-study-June-2015.pdf. Accessed 2019/20/08.
  300. Harman, B.P., S. Heyenga, B.M. Taylor and C.S. Fletcher, 2013: Global lessons for adapting coastal communities to protect against storm surge inundation. J. Coastal Res., 31(4), 790–801, doi:10.2112/JCOASTRES-D-13-00095.1.
  301. Cheong, S.-M. et al., 2013: Coastal adaptation with ecological engineering. Nat. Clim. Change, 3(9), 787, doi:10.1038/Nclimate1854.
  302. Saleh, F. and M.P. Weinstein, 2016: The role of nature-based infrastructure (NBI) in coastal resiliency planning: a literature review. J. Environ. Manage. 183(Pt 3), 1088–1098, doi:10.1016/j.jenvman.2016.09.077.
  303. Knowlton, K. and M. Rotkin-Ellman, 2014: Preparing for Climate Change: Lessons for Coastal Cities from Hurricane Sandy. Natural Resources Defense Council Report, New York City, NY, 25 pp. http://www.nrdc.org/sites/default/files/hurricane-sandy-coastal-flooding-report.pdf. Accessed 2019/20/08.
  304. Rose, B.E.J. et al., 2014: The dependence of transient climate sensitivity and radiative feedbacks on the spatial pattern of ocean heat uptake. Geophys. Res. Lett., 41(3), 1071–1078, doi:10.1002/2013gl058955.
  305. Bloemen, P., M. Van Der Steen and Z. Van Der Wal, 2018: Designing a century ahead: climate change adaptation in the Dutch Delta. Policy and Society, 38, 58–76, doi:10.1080/14494035.2018.1513731.
  306. Lawrence, J. et al., 2018: National guidance for adapting to coastal hazards and sea level rise: Anticipating change, when and how to change pathway. Environ. Sci. Policy, 82, 100–107, doi:10.1016/j.envsci.2018.01.012.
  307. Rhein, M. et al., 2013: Observations: Ocean. In: Climate Change 2013: The Physical Science Basis. Contribution of Working Group I to the Fifth Assessment Report of the Intergovernmental Panel on Climate Change [Stocker, T.F., D. Qin, G.-K. Plattner, M. Tignor, S.K. Allen, J. Boschung, A. Nauels, Y. Xia, V. Bex and P.M. Midgley (eds.)]. Cambridge University Press, Cambridge, United Kingdom and New York, NY, USA, 255-316.
  308. Collins, M. et al., 2013: Long-term Climate Change: Projections, Commitments and Irreversibility. In: Climate Change 2013: The Physical Science Basis. Contribution of Working Group I to the Fifth Assessment Report of the Intergovernmental Panel on Climate Change [Stocker, T.F., D. Qin, G.-K. Plattner, M. Tignor, S.K. Allen, J. Boschung, A. Nauels, Y. Xia, V. Bex and P.M. Midgley (eds.)]. Cambridge University Press, Cambridge, United Kingdom and New York, NY, USA, 1029-1136.
  309. Pörtner, H.O. et al., 2014: Ocean systems. In: Climate Change 2014: Impacts, Adaptation, and Vulnerability. Part A: Global and Sectoral Aspects. Contribution of Working Group II to the Fifth Assessment Report of the Intergovernmental Panel of Climate Change [Field, C.B., V.R. Barros, D.J. Dokken, K.J. Mach, M.D. Mastrandrea, T.E. Bilir, M. Chatterjee, K.L. Ebi, Y.O. Estrada, R.C. Genova, B. Girma, E.S. Kissel, A.N. Levy, S. MacCracken, P.R. Mastrandrea and L.L. White (eds.)]. Cambridge University Press, Cambridge, United Kingdom and New York, NY, USA, 411-484.
  310. Gattuso, J.P., O. Hoegh-Guldberg and H.O. Pörtner, 2014: Cross-chapter box on coral reefs. In: Climate Change 2014: Impacts, Adaptation, and Vulnerability. Part A: Global and Sectoral Aspects. Contribution of Working Group II to the Fifth Assessment Report of the Intergovernmental Panel of Climate Change [Field, C.B., V.R. Barros, D.J. Dokken, K.J. Mach, M.D. Mastrandrea, T.E. Bilir, M. Chatterjee, K.L. Ebi, Y.O. Estrada, R.C. Genova, B. Girma, E.S. Kissel, A.N. Levy, S. MacCracken, P.R. Mastrandrea and L.L. White (eds.)]. Cambridge University Press, Cambridge, United Kingdom and New York, NY, USA, 97-100.
  311. Pörtner, H.O. et al., 2014: Ocean systems. In: Climate Change 2014: Impacts, Adaptation, and Vulnerability. Part A: Global and Sectoral Aspects. Contribution of Working Group II to the Fifth Assessment Report of the Intergovernmental Panel of Climate Change [Field, C.B., V.R. Barros, D.J. Dokken, K.J. Mach, M.D. Mastrandrea, T.E. Bilir, M. Chatterjee, K.L. Ebi, Y.O. Estrada, R.C. Genova, B. Girma, E.S. Kissel, A.N. Levy, S. MacCracken, P.R. Mastrandrea and L.L. White (eds.)]. Cambridge University Press, Cambridge, United Kingdom and New York, NY, USA, 411-484.
  312. Hobday, A.J. et al., 2016a: A hierarchical approach to defining marine heatwaves. Progress in Oceanography, 141, 227–238, doi:10.1016/j.pocean.2015.12.014.
  313. Scannell, H.A. et al., 2016: Frequency of marine heatwaves in the North Atlantic and North Pacific since 1950. Geophys. Res. Lett., 43(5), 2069–2076, doi:10.1002/2015GL067308.
  314. Benthuysen, J.A., E.C.J. Oliver, M. Feng and A.G. Marshall, 2018: Extreme Marine Warming Across Tropical Australia During Austral Summer 2015–2016. J. Geophys. Res.-Oceans, 123(2), 1301–1326, doi:10.1002/2017JC013326.
  315. Bond, N.A., M.F. Cronin, H. Freeland and N. Mantua, 2015: Causes and impacts of the 2014 warm anomaly in the NE Pacific. Geophys. Res. Lett., 42(9), 3414–3420, doi:10.1002/2015gl063306.
  316. Pearce, A.F. and M. Feng, 2013: The rise and fall of the “marine heat wave” off Western Australia during the summer of 2010/2011. J. Marine Syst., 111–112, 139–156, doi:10.1016/j.jmarsys.2012.10.009.
  317. Kataoka, T., T. Tozuka, S. Behera and T. Yamagata, 2014: On the Ningaloo Niño/Niña. Clim. Dynam., 43(5), 1463–1482, doi:10.1007/s00382-013-1961-z.
  318. Mills, K. et al., 2013: Fisheries Management in a Changing Climate: Lessons From the 2012 Ocean Heat Wave in the Northwest Atlantic. Oceanography, 26(2), 191–195, doi:10.5670/oceanog.2013.27.
  319. Oliver, E.C.J. et al., 2018a: Longer and more frequent marine heatwaves over the past century. Nat. Commun., 9(1), 1324, doi:10.1038/s41467-018-03732-9.
  320. Benthuysen, J.A., M. Feng and L. Zhong, 2014: Spatial patterns of warming off Western Australia during the 2011 Ningaloo Niño: Quantifying impacts of remote and local forcing. Cont. Shelf Res., 91(Supplement C), 232–246, doi:10.1016/j.csr.2014.09.014.
  321. Bond, N.A., M.F. Cronin, H. Freeland and N. Mantua, 2015: Causes and impacts of the 2014 warm anomaly in the NE Pacific. Geophys. Res. Lett., 42(9), 3414–3420, doi:10.1002/2015gl063306.
  322. Chen, K., G. Gawarkiewicz, Y.-O. Kwon and W.G. Zhang, 2015b: The role of atmospheric forcing versus ocean advection during the extreme warming of the Northeast U.S. continental shelf in 2012. J. Geophys. Res.-Oceans, 120(6), 4324-4339, doi:10.1002/2014JC010547.
  323. Pearce, A.F. and M. Feng, 2013: The rise and fall of the “marine heat wave” off Western Australia during the summer of 2010/2011. J. Marine Syst., 111–112, 139–156, doi:10.1016/j.jmarsys.2012.10.009.
  324. Kataoka, T., T. Tozuka, S. Behera and T. Yamagata, 2014: On the Ningaloo Niño/Niña. Clim. Dynam., 43(5), 1463–1482, doi:10.1007/s00382-013-1961-z.
  325. Bond, N.A., M.F. Cronin, H. Freeland and N. Mantua, 2015: Causes and impacts of the 2014 warm anomaly in the NE Pacific. Geophys. Res. Lett., 42(9), 3414–3420, doi:10.1002/2015gl063306.
  326. Lee, M.Y., C.C. Hong and H.H. Hsu, 2015a: Compounding effects of warm sea surface temperature and reduced sea ice on the extreme circulation over the extratropical North Pacific and North America during the 2013–2014 boreal winter. Geophys. Res. Lett., 42(5), 1612–1618, doi:10.1002/2014GL062956.
  327. Carrigan, A.D. and M. Puotinen, 2014: Tropical cyclone cooling combats region‐wide coral bleaching. Global Change Biol., 20(5), 1604–1613, doi:10.1111/gcb.12541.
  328. Schlegel, R.W. et al., 2017a: Predominant Atmospheric and Oceanic Patterns during Coastal Marine Heatwaves. Front. Mar. Sci., 4, 323, doi:10.3389/fmars.2017.00323.
  329. Schlegel, R.W., E.C.J. Oliver, T. Wernberg and A.J. Smit, 2017b: Nearshore and offshore co-occurrence of marine heatwaves and cold-spells. Progress in Oceanography, 151(Supplement C), 189–205, doi:10.1016/j.pocean.2017.01.004.
  330. Oliver, E.C.J. and N.J. Holbrook, 2014: Extending our understanding of South Pacific gyre “spin‐up”: Modeling the East Australian Current in a future climate. J. Geophys. Res.-Oceans, 119(5), 2788–2805, doi:10.1002/2013JC009591.
  331. Oliver, E.C.J. et al., 2017: The unprecedented 2015/16 Tasman Sea marine heatwave. Nat. Commun., 8, 16101, doi:10.1038/ncomms16101.
  332. Schaeffer, A. and M. Roughan, 2017: Subsurface intensification of marine heatwaves off southeastern Australia: The role of stratification and local winds. Geophys. Res. Lett., 44(10), 5025–5033, doi:10.1002/2017gl073714.
  333. Hughes, T.P. et al., 2017b: Global warming and recurrent mass bleaching of corals. Nature, 543(7645), 373–377, doi:10.1038/nature21707.
  334. Bindoff, N.L. et al., 2013: Detection and Attribution of Climate Change: from Global to Regional. In: Climate Change 2013: The Physical Science Basis. Contribution of Working Group I to the Fifth Assessment Report of the Intergovernmental Panel on Climate Change [Stocker, T.F., D. Qin, G.-K. Plattner, M. Tignor, S.K. Allen, J. Boschung, A. Nauels, Y. Xia, V. Bex and P.M. Midgley (eds.)]. Cambridge University Press, Cambridge, United Kingdom and New York, NY, USA, 867-952.
  335. Frölicher, T.L., E.M. Fischer and N. Gruber, 2018: Marine heat waves under global warming. Nature, 560(7718), 360-–364, doi:10.1038/s41586-018-0383-9.
  336. Oliver, E.C.J. et al., 2018a: Longer and more frequent marine heatwaves over the past century. Nat. Commun., 9(1), 1324, doi:10.1038/s41467-018-03732-9.
  337. Smale, D.A. et al., 2019: Marine heatwaves threaten global biodiversity and the provision of ecosystem services. Nat. Clim. Change, 9, 306–312, doi:10.1038/s41558-019-0412-1.
  338. Frölicher, T.L., E.M. Fischer and N. Gruber, 2018: Marine heat waves under global warming. Nature, 560(7718), 360-–364, doi:10.1038/s41586-018-0383-9.
  339. Oliver, E.C.J. et al., 2018a: Longer and more frequent marine heatwaves over the past century. Nat. Commun., 9(1), 1324, doi:10.1038/s41467-018-03732-9.
  340. Frölicher, T.L., E.M. Fischer and N. Gruber, 2018: Marine heat waves under global warming. Nature, 560(7718), 360-–364, doi:10.1038/s41586-018-0383-9.
  341. Hobday, A.J. et al., 2016a: A hierarchical approach to defining marine heatwaves. Progress in Oceanography, 141, 227–238, doi:10.1016/j.pocean.2015.12.014.
  342. Frölicher, T.L., E.M. Fischer and N. Gruber, 2018: Marine heat waves under global warming. Nature, 560(7718), 360-–364, doi:10.1038/s41586-018-0383-9.
  343. Oliver, E.C.J. et al., 2018a: Longer and more frequent marine heatwaves over the past century. Nat. Commun., 9(1), 1324, doi:10.1038/s41467-018-03732-9.
  344. Oliver, E. C., 2019: Mean warming not variability drives marine heatwave trends. Clim. Dynam., 53(3-4), 1653–1659, doi:10.1007/s00382-019-04707-2.
  345. Collins, M. et al., 2013: Long-term Climate Change: Projections, Commitments and Irreversibility. In: Climate Change 2013: The Physical Science Basis. Contribution of Working Group I to the Fifth Assessment Report of the Intergovernmental Panel on Climate Change [Stocker, T.F., D. Qin, G.-K. Plattner, M. Tignor, S.K. Allen, J. Boschung, A. Nauels, Y. Xia, V. Bex and P.M. Midgley (eds.)]. Cambridge University Press, Cambridge, United Kingdom and New York, NY, USA, 1029-1136.
  346. Lima, F.P. and D.S. Wethey, 2012: Three decades of high-resolution coastal sea surface temperatures reveal more than warming. Nat. Commun., 3, 704, doi:10.1038/ncomms1713.
  347. Hughes, T.P. et al., 2018a: Spatial and temporal patterns of mass bleaching of corals in the Anthropocene. Science, 359 (6371), 80-83, doi:10.1126/science.aan8048.
  348. Fischer, E.M. and R. Knutti, 2015: Anthropogenic contribution to global occurrence of heavy-precipitation and high-temperature extremes. Nat. Clim. Change, 5(6), 560–564, doi:10.1038/nclimate2617.
  349. Frölicher, T.L., E.M. Fischer and N. Gruber, 2018: Marine heat waves under global warming. Nature, 560(7718), 360-–364, doi:10.1038/s41586-018-0383-9.
  350. Weller, E. et al., 2015: Human Contribution to the 2014 Record High Sea Surface Temperatures Over the Western Tropical And Northeast Pacific Ocean. Bull. Am. Meterol. Soc., 96(12), S100–S104, doi:10.1175/bams-d-15-00055.1.
  351. Oliver, E.C.J., S.E. Perkins-Kirkpatrick, N. J. Holbrook and N. L. Bindoff, 2018b: Anthropogenic and natural influences on record 2016 marine heat waves. In “Explaining Extreme Events of 2016 from a Climate Perspective”. Bull. Am. Meterol. Soc., 99(1), S44–S48, doi:10.1175/BAMS-ExplainingExtremeEvents2016.1.
  352. Walsh, J.E. et al., 2018: The high latitude marine heat wave of 2016 and its impacts on Alaska. In “Explaining Extreme Events of 2016 from a Climate Perspective”. Bull. Am. Meterol. Soc., 99(1), S39–S43, doi:10.1175/bams-d-17-0105.1.
  353. Wang, S.-Y., L. Hipps, R.R. Gillies and J.H. Yoon, 2014a: Probable causes of the abnormal ridge accompanying the 2013–2014 California drought: ENSO precursor and anthropogenic warming footprint. Geophys. Res. Lett., 41(9), 3220–3226, doi:10.1002/2014GL059748.
  354. Kam, J., T.R. Knutson, F. Zeng and A.T. Wittenberg, 2015: Record Annual Mean Warmth Over Europe, the Northeast Pacific, and the Northwest Atlantic During 2014: Assessment of Anthropogenic Influence. Bull. Am. Meterol. Soc., 96(12), S61–S65, doi:10.1175/Bams-D-15-00101.1.
  355. Weller, E. et al., 2015: Human Contribution to the 2014 Record High Sea Surface Temperatures Over the Western Tropical And Northeast Pacific Ocean. Bull. Am. Meterol. Soc., 96(12), S100–S104, doi:10.1175/bams-d-15-00055.1.
  356. Oliver, E.C.J. et al., 2017: The unprecedented 2015/16 Tasman Sea marine heatwave. Nat. Commun., 8, 16101, doi:10.1038/ncomms16101.
  357. Weller, E. et al., 2015: Human Contribution to the 2014 Record High Sea Surface Temperatures Over the Western Tropical And Northeast Pacific Ocean. Bull. Am. Meterol. Soc., 96(12), S100–S104, doi:10.1175/bams-d-15-00055.1.
  358. King, A.D., D.J. Karoly and B.J. Henley, 2017: Australian climate extremes at 1.5 °C and 2 °C of global warming. Nat. Clim. Change, 7, 412, doi:10.1038/nclimate3296.
  359. Lewis, S.C. and J. Mallela, 2018: A multifactor risk analysis of the record 2016 Great Barrier Reef bleaching. In “Explaining Extreme Events of 2016 from a Climate Perspective”. Bull. Am. Meterol. Soc., 99(1), S144–S149, doi:10.1175/BAMS-D-17-0118.1.
  360. Newman, M. et al., 2018: The extreme 2015/16 El Nino, in the context of historical climate variability and change. In “Explaining Extreme Events of 2016 from a Climate Perspective”. Bull. Am. Meterol. Soc., 99(1), S15–S20, doi:10.1175/bams-d-17-0116.1.
  361. Oliver, E.C.J., S.E. Perkins-Kirkpatrick, N. J. Holbrook and N. L. Bindoff, 2018b: Anthropogenic and natural influences on record 2016 marine heat waves. In “Explaining Extreme Events of 2016 from a Climate Perspective”. Bull. Am. Meterol. Soc., 99(1), S44–S48, doi:10.1175/BAMS-ExplainingExtremeEvents2016.1.
  362. King, A.D., D.J. Karoly and B.J. Henley, 2017: Australian climate extremes at 1.5 °C and 2 °C of global warming. Nat. Clim. Change, 7, 412, doi:10.1038/nclimate3296.
  363. Lewis, S.C. and J. Mallela, 2018: A multifactor risk analysis of the record 2016 Great Barrier Reef bleaching. In “Explaining Extreme Events of 2016 from a Climate Perspective”. Bull. Am. Meterol. Soc., 99(1), S144–S149, doi:10.1175/BAMS-D-17-0118.1.
  364. Reynolds, R.W. et al., 2007: Daily high-resolution-blended analyses for sea surface temperaturee. J. Clim., 20(22), 5473–5496, doi:10.1175/2007jcli1824.1.
  365. Banzon, V. et al., 2016: A long-term record of blended satellite and in situ sea-surface temperature for climate monitoring, modeling and environmental studies. Earth Syst. Sci. Data, 8(1), 165–176, doi:10.5194/essd-8-165-2016.
  366. Frölicher, T.L., E.M. Fischer and N. Gruber, 2018: Marine heat waves under global warming. Nature, 560(7718), 360-–364, doi:10.1038/s41586-018-0383-9.
  367. Liu, G. et al., 2014a: Reef-Scale Thermal Stress Monitoring of Coral Ecosystems: New 5-km Global Products from NOAA Coral Reef Watch. Remote Sens., 6(11), 11579, doi:10.3390/rs61111579.
  368. Oliver, E.C.J. et al., 2017: The unprecedented 2015/16 Tasman Sea marine heatwave. Nat. Commun., 8, 16101, doi:10.1038/ncomms16101.
  369. Ramírez, I.J. and F. Briones, 2017: Understanding the El Niño Costero of 2017: The Definition Problem and Challenges of Climate Forecasting and Disaster Responses. Int. J. Disast. Risk Sci., 8(4), 489–492, doi:10.1007/s13753-017-0151-8.
  370. Alexander, M.A. et al., 2018: Projected sea surface temperatures over the 21st century: Changes in the mean, variability and extremes for large marine ecosystem regions of Northern Oceans. Elementa-Sci Anthrop., 6(1), 9, doi:10.1525/elementa.191.
  371. Frölicher, T.L., E.M. Fischer and N. Gruber, 2018: Marine heat waves under global warming. Nature, 560(7718), 360-–364, doi:10.1038/s41586-018-0383-9.
  372. Frölicher, T.L., E.M. Fischer and N. Gruber, 2018: Marine heat waves under global warming. Nature, 560(7718), 360-–364, doi:10.1038/s41586-018-0383-9.
  373. Darmaraki, S. et al., 2019: Future evolution of Marine Heat Waves in the Mediterranean Sea. Clim. Dynam., 53(3-4), 1371–1392, doi:10.1007/s00382-019-04661-z.
  374. Frölicher, T.L., E.M. Fischer and N. Gruber, 2018: Marine heat waves under global warming. Nature, 560(7718), 360-–364, doi:10.1038/s41586-018-0383-9.
  375. Frölicher, T.L., E.M. Fischer and N. Gruber, 2018: Marine heat waves under global warming. Nature, 560(7718), 360-–364, doi:10.1038/s41586-018-0383-9.
  376. Frölicher, T.L., E.M. Fischer and N. Gruber, 2018: Marine heat waves under global warming. Nature, 560(7718), 360-–364, doi:10.1038/s41586-018-0383-9.
  377. Frölicher, T.L., E.M. Fischer and N. Gruber, 2018: Marine heat waves under global warming. Nature, 560(7718), 360-–364, doi:10.1038/s41586-018-0383-9.
  378. Oliver, E. C., 2019: Mean warming not variability drives marine heatwave trends. Clim. Dynam., 53(3-4), 1653–1659, doi:10.1007/s00382-019-04707-2.
  379. Huang, B. et al., 2015a: Extended reconstructed sea surface temperature version 4 (ERSST. v4). Part I: upgrades and intercomparisons. J. Clim., 28(3), 911–930, doi:10.1175/JCLI-D-14-00006.1.
  380. Frölicher, T.L., E.M. Fischer and N. Gruber, 2018: Marine heat waves under global warming. Nature, 560(7718), 360-–364, doi:10.1038/s41586-018-0383-9.
  381. Alexander, M.A. et al., 2018: Projected sea surface temperatures over the 21st century: Changes in the mean, variability and extremes for large marine ecosystem regions of Northern Oceans. Elementa-Sci Anthrop., 6(1), 9, doi:10.1525/elementa.191.
  382. Frölicher, T.L., E.M. Fischer and N. Gruber, 2018: Marine heat waves under global warming. Nature, 560(7718), 360-–364, doi:10.1038/s41586-018-0383-9.
  383. King, A.D., D.J. Karoly and B.J. Henley, 2017: Australian climate extremes at 1.5 °C and 2 °C of global warming. Nat. Clim. Change, 7, 412, doi:10.1038/nclimate3296.
  384. Darmaraki, S. et al., 2019: Future evolution of Marine Heat Waves in the Mediterranean Sea. Clim. Dynam., 53(3-4), 1371–1392, doi:10.1007/s00382-019-04661-z.
  385. Oliver, E.C.J. and N.J. Holbrook, 2014: Extending our understanding of South Pacific gyre “spin‐up”: Modeling the East Australian Current in a future climate. J. Geophys. Res.-Oceans, 119(5), 2788–2805, doi:10.1002/2013JC009591.
  386. Oliver, E.C.J. et al., 2017: The unprecedented 2015/16 Tasman Sea marine heatwave. Nat. Commun., 8, 16101, doi:10.1038/ncomms16101.
  387. Oliver, E.C.J. et al., 2017: The unprecedented 2015/16 Tasman Sea marine heatwave. Nat. Commun., 8, 16101, doi:10.1038/ncomms16101.
  388. Alexander, M.A. et al., 2018: Projected sea surface temperatures over the 21st century: Changes in the mean, variability and extremes for large marine ecosystem regions of Northern Oceans. Elementa-Sci Anthrop., 6(1), 9, doi:10.1525/elementa.191.
  389. Frölicher, T.L., E.M. Fischer and N. Gruber, 2018: Marine heat waves under global warming. Nature, 560(7718), 360-–364, doi:10.1038/s41586-018-0383-9.
  390. Carton, J.A., Y. Ding and K.R. Arrigo, 2015: The seasonal cycle of the Arctic Ocean under climate change. Geophys. Res. Lett., 42(18), 7681–7686, doi:10.1002/2015gl064514.
  391. Alexander, M.A. et al., 2018: Projected sea surface temperatures over the 21st century: Changes in the mean, variability and extremes for large marine ecosystem regions of Northern Oceans. Elementa-Sci Anthrop., 6(1), 9, doi:10.1525/elementa.191.
  392. Fischer, E.M. and R. Knutti, 2015: Anthropogenic contribution to global occurrence of heavy-precipitation and high-temperature extremes. Nat. Clim. Change, 5(6), 560–564, doi:10.1038/nclimate2617.
  393. Frölicher, T.L., E.M. Fischer and N. Gruber, 2018: Marine heat waves under global warming. Nature, 560(7718), 360-–364, doi:10.1038/s41586-018-0383-9.
  394. Frölicher, T.L., E.M. Fischer and N. Gruber, 2018: Marine heat waves under global warming. Nature, 560(7718), 360-–364, doi:10.1038/s41586-018-0383-9.
  395. Frölicher, T.L., E.M. Fischer and N. Gruber, 2018: Marine heat waves under global warming. Nature, 560(7718), 360-–364, doi:10.1038/s41586-018-0383-9.
  396. Pörtner, H.O. and R. Knust, 2007: Climate change affects marine fishes through the oxygen limitation of thermal tolerance. Science, 315(5808), 95–97, doi:10.1126/science.1135471.
  397. Poloczanska, E.S. et al., 2013: Global imprint of climate change on marine life. Nat. Clim. Change, 3(10), 919–925, doi:10.1038/nclimate1958.
  398. Hoegh-Guldberg, O. et al., 2014: The Ocean. In: Climate Change 2014: Impacts, Adaptation, and Vulnerability. Part B: Regional Aspects. Contribution of Working Group II to the Fifth Assessment Report of the Intergovernmental Panel of Climate Change [Barros, V.R., C.B. Field, D.J. Dokken, M.D. Mastrandrea, K.J. Mach, T.E. Bilir, M. Chatterjee, K.L. Ebi, Y.O. Estrada, R.C. Genova, B. Girma, E.S. Kissel, A.N. Levy, S. MacCracken, P.R. Mastrandrea and L.L. White (eds.)]. Cambridge University Press, Cambridge, United Kingdom and New York, NY, USA, 1655-1731.
  399. Smale, D.A. et al., 2019: Marine heatwaves threaten global biodiversity and the provision of ecosystem services. Nat. Clim. Change, 9, 306–312, doi:10.1038/s41558-019-0412-1.
  400. Hughes, T.P. et al., 2017b: Global warming and recurrent mass bleaching of corals. Nature, 543(7645), 373–377, doi:10.1038/nature21707.
  401. Hughes, T.P. et al., 2018a: Spatial and temporal patterns of mass bleaching of corals in the Anthropocene. Science, 359 (6371), 80-83, doi:10.1126/science.aan8048.
  402. Hughes, T.P. et al., 2018b: Global warming transforms coral reef assemblages. Nature, 556, 492–496, doi:10.1038/s41586-018-0041-2.
  403. Smale, D.A. et al., 2019: Marine heatwaves threaten global biodiversity and the provision of ecosystem services. Nat. Clim. Change, 9, 306–312, doi:10.1038/s41558-019-0412-1.
  404. Smale, D.A. and T. Wernberg, 2013: Extreme climatic event drives range contraction of a habitat-forming species. Proc. Royal Soc. B., 280(1754), 20122829, doi:10.1098/rspb.2012.2829.
  405. Wernberg, T. et al., 2013: An extreme climatic event alters marine ecosystem structure in a global biodiversity hotspot. Nat. Clim. Change, 3(1), 78–82, doi:10.1038/Nclimate1627.
  406. Wernberg, T. et al., 2016: Climate-driven regime shift of a temperate marine ecosystem. Science, 353(6295), 169–172, doi:10.1126/science.aad8745.
  407. Brainard, R.E. et al., 2011: Status Review Report of 82 Candidate Coral Species Petitioned Under the U.S. Endangered Species Act. NOAA Technical Memorandum, Pacific Islands Fisheries Science Center, 530 pp. http://citeseerx.ist.psu.edu/viewdoc/download?doi=10.1.1.365.1819&rep=rep1&type=pdf. Accessed 2018/04/19.
  408. Heron, S.F., J.A. Maynard, R. van Hooidonk and C. . Eakin, 2016: Warming Trends and Bleaching Stress of the World’s Coral Reefs 1985–2012. Sci. Rep., 6, 38402, doi:10.1038/srep38402.
  409. Eakin, C.M. et al., 2017: Ding, dong, the witch is dead (?) – three years of global coral bleaching 2014-2017. Reef Encounter, 45(32), 33–38.
  410. Hughes, T.P. et al., 2017b: Global warming and recurrent mass bleaching of corals. Nature, 543(7645), 373–377, doi:10.1038/nature21707.
  411. Eakin, C.M. et al., 2018: Unprecedented three years of global coral bleaching 2014-2017 [Sidebar 3.1, in “State of the Climate in 2017”]. Bull. Am. Meterol. Soc., 99(8), S74–S75, doi:10.1175/2018BAMSStateoftheClimate.1.
  412. Hughes, T.P. et al., 2018a: Spatial and temporal patterns of mass bleaching of corals in the Anthropocene. Science, 359 (6371), 80-83, doi:10.1126/science.aan8048.
  413. Hughes, T.P. et al., 2018a: Spatial and temporal patterns of mass bleaching of corals in the Anthropocene. Science, 359 (6371), 80-83, doi:10.1126/science.aan8048.
  414. Eakin, C.M. et al., 2017: Ding, dong, the witch is dead (?) – three years of global coral bleaching 2014-2017. Reef Encounter, 45(32), 33–38.
  415. Brainard, R.E. et al., 2011: Status Review Report of 82 Candidate Coral Species Petitioned Under the U.S. Endangered Species Act. NOAA Technical Memorandum, Pacific Islands Fisheries Science Center, 530 pp. http://citeseerx.ist.psu.edu/viewdoc/download?doi=10.1.1.365.1819&rep=rep1&type=pdf. Accessed 2018/04/19.
  416. Stuart-Smith, R.D., C.J. Brown, D.M. Ceccarelli and G.J. Edgar, 2018: Ecosystem restructuring along the Great Barrier Reef following mass coral bleaching. Nature, 560(7716), 92–96, doi:10.1038/s41586-018-0359-9.
  417. Ummenhofer, C.C. and G.A. Meehl, 2017: Extreme weather and climate events with ecological relevance: a review. Philos. Trans. R. Soc. London. B., 372(1723), 20160135, doi:10.1098/rstb.2016.0135.
  418. Smale, D.A. et al., 2019: Marine heatwaves threaten global biodiversity and the provision of ecosystem services. Nat. Clim. Change, 9, 306–312, doi:10.1038/s41558-019-0412-1.
  419. Wernberg, T. et al., 2013: An extreme climatic event alters marine ecosystem structure in a global biodiversity hotspot. Nat. Clim. Change, 3(1), 78–82, doi:10.1038/Nclimate1627.
  420. Wernberg, T. et al., 2016: Climate-driven regime shift of a temperate marine ecosystem. Science, 353(6295), 169–172, doi:10.1126/science.aad8745.
  421. Fraser, M.W. et al., 2014: Extreme climate events lower resilience of foundation seagrass at edge of biogeographical range. J. Ecol., 102(6), 1528 doi:10.1098/rsta.2014.0170.1536, doi:10.1111/1365-2745.12300.
  422. Arias-Ortiz, A. et al., 2018: A marine heatwave drives massive losses from the world’s largest seagrass carbon stocks. Nat. Clim. Change, 8(4), 338–344, doi:10.1038/s41558-018-0096-y.
  423. Depczynski, M. et al., 2013: Bleaching, coral mortality and subsequent survivorship on a West Australian fringing reef. Coral Reefs, 32(1), 233–238, doi:10.1007/s00338-012-0974-0.
  424. Caputi, N. et al., 2016: Management adaptation of invertebrate fisheries to an extreme marine heat wave event at a global warming hot spot. Ecol. Evol., 6(11), 3583–3593, doi:10.1002/ece3.2137.
  425. Cavole, L. et al., 2016: Biological Impacts of the 2013–2015 Warm-Water Anomaly in the Northeast Pacific: Winners, Losers, and the Future. Oceanography, 29(2), 273–285, doi:10.5670/oceanog.2016.32.
  426. Jones, T. et al., 2018: Massive Mortality of a Planktivorous Seabird in Response to a Marine Heatwave. Geophys. Res. Lett., 45, 3193–3202, doi:10.1002/2017GL076164.
  427. Cavole, L. et al., 2016: Biological Impacts of the 2013–2015 Warm-Water Anomaly in the Northeast Pacific: Winners, Losers, and the Future. Oceanography, 29(2), 273–285, doi:10.5670/oceanog.2016.32.
  428. Whitney, F.A., 2015: Anomalous winter winds decrease 2014 transition zone productivity in the NE Pacific. Geophys. Res. Lett., 42(2), 428–431, doi:10.1002/2014gl062634.
  429. Jacox, M.G. et al., 2018: Forcing of Multiyear Extreme Ocean Temperatures that Impacted California Current Living Marine Resources in 2016. Bull. Am. Meterol. Soc., 99(1), S27–S33, doi:10.1175/bams-d-17-0119.1.
  430. Peterson, W.T. et al., 2017: The pelagic ecosystem in the Northern California Current off Oregon during the 2014–2016 warm anomalies within the context of the past 20 years. J. Geophys. Res.-Oceans, 122(9), 7267–7290, doi:10.1002/2017jc012952.
  431. McCabe, R.M. et al., 2016: An unprecedented coastwide toxic algal bloom linked to anomalous ocean conditions. Geophys. Res. Lett., 43(19), 10,366–10,376, doi:10.1002/2016gl070023.
  432. Mills, K. et al., 2013: Fisheries Management in a Changing Climate: Lessons From the 2012 Ocean Heat Wave in the Northwest Atlantic. Oceanography, 26(2), 191–195, doi:10.5670/oceanog.2013.27.
  433. Pershing, A.J. et al., 2015: Slow adaptation in the face of rapid warming leads to collapse of the Gulf of Maine cod fishery. Science, 350(6262), 809–812, doi:10.1126/science.aac9819.
  434. Garrabou, J. et al., 2009: Mass mortality in Northwestern Mediterranean rocky benthic communities: effects of the 2003 heat wave. Global Change Biol., 15(5), 1090–1103, doi:10.1111/j.1365-2486.2008.01823.x.
  435. Oliver, E.C.J. et al., 2017: The unprecedented 2015/16 Tasman Sea marine heatwave. Nat. Commun., 8, 16101, doi:10.1038/ncomms16101.
  436. Baker-Austin, C. et al., 2013: Emerging Vibrio risk at high latitudes in response to ocean warming. Nat. Clim. Change, 3(1), 73–77, doi:10.1038/nclimate1628.
  437. Walsh, J.E. et al., 2018: The high latitude marine heat wave of 2016 and its impacts on Alaska. In “Explaining Extreme Events of 2016 from a Climate Perspective”. Bull. Am. Meterol. Soc., 99(1), S39–S43, doi:10.1175/bams-d-17-0105.1.
  438. Zador, S. and E. Siddon, 2016: Ecosystem Considerations 2016, Status of the Eastern Bering Sea Marine Ecosystem. North Pacific Fishery Management Council, Anchorage, Alaska, USA, 210 pp. http://www.afsc.noaa.gov/REFM/Docs/2016/ecosysEBS.pdf. Accessed 2019/20/08.
  439. Kim, J.-Y. and I.-S. Han, 2017: Sea Surface Temperature Time Lag Due to the Extreme Heat Wave of August 2016. J. Korean Soc. Mar. Environ. Saf., 23(6), 677–683, doi:10.7837/kosomes.2017.23.6.677.
  440. Manta, G. et al., 2018: The 2017 Record Marine Heatwave in the Southwestern Atlantic Shelf. Geophys. Res. Lett., 45(22), 12,449–12,456, doi:10.1029/2018GL081070.
  441. IMPARPE, 2017: Informe integrado de la operación EUREKA LXIX Instituto del Mar del Perú, 23 pp [Available at: http://www.imarpe.pe/imarpe/archivos/informes/Informe_Operacion_EUREKA_LXIX%20_21_23feb_2017.pdf%5D. [publisher information: Instituto del Mar del Perú (IMPARPE). Peru. Accessed 2018/09/28.]
  442. Ñiquen, M. and M. Bouchon, 2004: Impact of El Niño events on pelagic fisheries in Peruvian waters. Deep-Sea Res. Pt. II., 51(6–9), 563–574, doi:10.1016/j.dsr2.2004.03.001.
  443. Seager, R. et al., 2015: Causes of the 2011–14 California Drought. J. Clim., 28(18), 6997–7024, doi:10.1175/jcli-d-14-00860.1.
  444. ENFEN, 2017: El Niño Costero 2017. Informe Técnico Extraordinario, N°001-2017/ENFEN, Estudio Nacional del Fenómeno “El Niño”, Estudio Nacional Del Fenómeno “El Niño” (ENFEN). Peru. 31 pp. http://www.imarpe.pe/imarpe/archivos/informes/imarpe_inftco_informe__tecnico_extraordinario_001_2017.pdf. Accessed 2018/09/28.
  445. Echevin, V.M. et al., 2018: Forcings and evolution of the 2017 coastal El Niño off Northern Peru and Ecuador. Front. Mar. Sci., 5, 367, doi:10.3389/fmars.2018.00367.
  446. Garreaud, R.D., 2018: A plausible atmospheric trigger for the 2017 coastal El Niño. Int. J. Climatol., 38, e1296-–e1302, doi:10.1002/joc.5426.
  447. Takahashi, K. et al., 2018: The 2017 coastal El Niño. In “State of the Climate in 2017”. Bull. Am. Meterol. Soc., 99(8), S210–S211, doi:10.1175/2018BAMSStateoftheClimate.1.
  448. Feudale, L. and J. Shukla, 2007: Role of Mediterranean SST in enhancing the European heat wave of summer 2003. Geophys. Res. Lett., 34(3), L03811, doi:10.1029/2006GL027991.
  449. García-Herrera, R. et al., 2010: A Review of the European Summer Heat Wave of 2003. Crit. Rev. Env. Sci. Tec., 40(4), 267–306, doi:10.1080/10643380802238137.
  450. Messmer, M., J.J. Gómez-Navarro and C.C. Raible, 2017: Sensitivity experiments on the response of Vb cyclones to sea surface temperature and soil moisture changes. Earth Syst. Dynam., 8(3), 477–493, doi:10.5194/esd-8-477-2017.
  451. González‐Alemán, J.J. et al., 2019: Potential increase in hazard from Mediterranean hurricane activity with global warming. Geophys. Res. Lett., 46(3), 1754–1764, doi:10.1029/2018GL081253.
  452. Reimer, J.J. et al., 2015: Sea surface temperature influence on terrestrial gross primary production along the Southern California current. PLoS ONE, 10(4), e0125177, doi:10.1371/journal.pone.0125177.
  453. Mills, K. et al., 2013: Fisheries Management in a Changing Climate: Lessons From the 2012 Ocean Heat Wave in the Northwest Atlantic. Oceanography, 26(2), 191–195, doi:10.5670/oceanog.2013.27.
  454. Mills, K. et al., 2013: Fisheries Management in a Changing Climate: Lessons From the 2012 Ocean Heat Wave in the Northwest Atlantic. Oceanography, 26(2), 191–195, doi:10.5670/oceanog.2013.27.
  455. Cavole, L. et al., 2016: Biological Impacts of the 2013–2015 Warm-Water Anomaly in the Northeast Pacific: Winners, Losers, and the Future. Oceanography, 29(2), 273–285, doi:10.5670/oceanog.2016.32.
  456. Berdalet, E. et al., 2016: Marine harmful algal blooms, human health and wellbeing: challenges and opportunities in the 21st century. J. Mar. Biol. Assoc. U.K., 96(1), 61–91, doi:10.1017/S0025315415001733.
  457. Du, X. et al., 2016: Initiation and development of a toxic and persistent Pseudo-nitzschia bloom off the Oregon coast in spring/summer 2015. PLoS ONE, 11(10), e0163977, doi:10.1371/journal.pone.0163977.
  458. McCabe, R.M. et al., 2016: An unprecedented coastwide toxic algal bloom linked to anomalous ocean conditions. Geophys. Res. Lett., 43(19), 10,366–10,376, doi:10.1002/2016gl070023.
  459. Perl, T.M. et al., 1990: An outbreak of toxic encephalopathy caused by eating mussels contaminated with domoic acid. N. Eng. J. Med., 322(25), 1775–1780, doi:10.1056/NEJM199006213222504.
  460. United Nations, 2017: North coast of Perú Flash Appeal. United Nations Office for the Coordination of Humanitarian Affairs, Geneva, Switzerland., 49 pp. https://reliefweb.int/report/peru/north-coast-peru-2017-flash-appeal-april. Accessed 2019/20/08.
  461. Liu, G. et al., 2014a: Reef-Scale Thermal Stress Monitoring of Coral Ecosystems: New 5-km Global Products from NOAA Coral Reef Watch. Remote Sens., 6(11), 11579, doi:10.3390/rs61111579.
  462. Liu, G. et al., 2018: Predicting Heat Stress to Inform Reef Management: NOAA Coral Reef Watch’s 4-Month Coral Bleaching Outlook. Front. Mar. Sci., 5, 57, doi:10.3389/fmars.2018.00057.
  463. Heron, S.F. et al., 2010: Summer Hot Snaps and Winter Conditions: Modelling White Syndrome Outbreaks on Great Barrier Reef Corals. PLoS ONE, 5(8), e12210, doi:10.1371/journal.pone.0012210.
  464. Tommasi, D. et al., 2017b: Managing living marine resources in a dynamic environment: The role of seasonal to decadal climate forecasts. Progress in Oceanography, 152, 15–49, doi:10.1016/j.pocean.2016.12.011.
  465. Eakin, C.M. et al., 2018: Unprecedented three years of global coral bleaching 2014-2017 [Sidebar 3.1, in “State of the Climate in 2017”]. Bull. Am. Meterol. Soc., 99(8), S74–S75, doi:10.1175/2018BAMSStateoftheClimate.1.
  466. Rosinski, A. et al., 2017: Coral bleaching recovery plan. University of Hawai’i, Social Science Research Institute, 47 pp. https://dlnr.hawaii.gov/dar/files/2017/04/Coral_Bleaching_Recovery_Plan_final.pdf. Accssed 2019/20/08.
  467. Eakin, C.M. et al., 2017: Ding, dong, the witch is dead (?) – three years of global coral bleaching 2014-2017. Reef Encounter, 45(32), 33–38.
  468. Tommasi, D. et al., 2017b: Managing living marine resources in a dynamic environment: The role of seasonal to decadal climate forecasts. Progress in Oceanography, 152, 15–49, doi:10.1016/j.pocean.2016.12.011.
  469. Hobday, A.J., C.M. Spillman, J.P. Eveson and J.R. Hartog, 2016b: Seasonal forecasting for decision support in marine fisheries and aquaculture. Fish. Oceanogr., 25(S1), 45–56, doi:10.1111/fog.12083.
  470. Payne, M.R. et al., 2017: Lessons from the First Generation of Marine Ecological Forecast Products. Front. Mar. Sci., 4, doi:10.3389/fmars.2017.00289.
  471. Tommasi, D. et al., 2017b: Managing living marine resources in a dynamic environment: The role of seasonal to decadal climate forecasts. Progress in Oceanography, 152, 15–49, doi:10.1016/j.pocean.2016.12.011.
  472. Spillman, C.M. and A.J. Hobday, 2014: Dynamical seasonal ocean forecasts to aid salmon farm management in a climate hotspot. Climate Risk Management, 1, 25–38, doi:10.1016/j.crm.2013.12.001.
  473. Hobday, A.J., C.M. Spillman, J.P. Eveson and J.R. Hartog, 2016b: Seasonal forecasting for decision support in marine fisheries and aquaculture. Fish. Oceanogr., 25(S1), 45–56, doi:10.1111/fog.12083.
  474. Tommasi, D. et al., 2017a: Multi-Annual Climate Predictions for Fisheries: An Assessment of Skill of Sea Surface Temperature Forecasts for Large Marine Ecosystems. Front. Mar. Sci., 4, 201, doi:10.3389/fmars.2017.00201.
  475. Tommasi, D. et al., 2017a: Multi-Annual Climate Predictions for Fisheries: An Assessment of Skill of Sea Surface Temperature Forecasts for Large Marine Ecosystems. Front. Mar. Sci., 4, 201, doi:10.3389/fmars.2017.00201.
  476. Tommasi, D. et al., 2017b: Managing living marine resources in a dynamic environment: The role of seasonal to decadal climate forecasts. Progress in Oceanography, 152, 15–49, doi:10.1016/j.pocean.2016.12.011.
  477. Payne, M.R. et al., 2017: Lessons from the First Generation of Marine Ecological Forecast Products. Front. Mar. Sci., 4, doi:10.3389/fmars.2017.00289.
  478. Ramírez, I.J. and F. Briones, 2017: Understanding the El Niño Costero of 2017: The Definition Problem and Challenges of Climate Forecasting and Disaster Responses. Int. J. Disast. Risk Sci., 8(4), 489–492, doi:10.1007/s13753-017-0151-8.
  479. Chang, Y., M.-A. Lee, K.-T. Lee and K.-T. Shao, 2013: Adaptation of fisheries and mariculture management to extreme oceanic environmental changes and climate variability in Taiwan. Mar. Policy, 38, 476–482, doi:10.1016/j.marpol.2012.08.002.
  480. Hobday, A.J. et al., 2018: Categorizing and naming marine heatwaves. Oceanography, 31(2), doi:10.5670/oceanog.2018.205.
  481. Christensen, J.H. et al., 2013: Climate Phenomena and their Relevance for Future Regional Climate Change. In: Climate Change 2013: The Physical Science Basis. Contribution of Working Group I to the Fifth Assessment Report of the Intergovernmental Panel on Climate Change [Stocker, T.F., D. Qin, G.-K. Plattner, M. Tignor, S.K. Allen, J. Boschung, A. Nauels, Y. Xia, V. Bex and P.M. Midgley (eds.)]. Cambridge University Press, Cambridge, United Kingdom and New York, NY, USA, 1217-1308.
  482. Cobb, K.M. et al., 2013: Highly variable El Niño–Southern Oscillation throughout the Holocene. Science, 339 (6115), 67–70, doi:10.1126/science.1228246.
  483. McGregor, S. et al., 2013: Inferred changes in El Niño-Southern Oscillation variance over the past six centuries. Clim. Past, 9 5), 2269, doi:10.5194/cp-9-2269-2013.
  484. Liu, Y. et al., 2017b: Recent enhancement of central Pacific El Niño variability relative to last eight centuries. Nat. Commun., 8, 15386, doi:10.1038/ncomms15386.
  485. Freund, M.B. et al., 2019: Higher frequency of Central Pacific El Niño events in recent decades relative to past centuries. Nat. Geosci., 12, 450–455, doi:10.1038/s41561-019-0353-3.
  486. Rustic, G.T., A. Koutavas, T.M. Marchitto and B.K. Linsley, 2015: Dynamical excitation of the tropical Pacific Ocean and ENSO variability by Little Ice Age cooling. Science, 350(6267), aac9937, doi:10.1126/science.aac9937.
  487. Henke, L.M.K., F.H. Lambert and D.J. Charman, 2017: Was the Little Ice Age more or less El Niño-like than the Medieval Climate Anomaly? Evidence from hydrological and temperature proxy data. Clim. Past, 13(3), 267–301, doi:10.5194/cp-13-267-2017.
  488. Keller, K.M., F. Joos, F. Lehner and C.C. Raible, 2015: Detecting changes in marine responses to ENSO from 850 to 2100 CE: Insights from the ocean carbon cycle. Geophys. Res. Lett., 42(2), 518–525, doi:10.1002/2014gl062398.
  489. Lee, T. and M.J. McPhaden, 2010: Increasing intensity of El Niño in the central‐equatorial Pacific. Geophys. Res. Lett., 37(14), L14603, doi:10.1029/2010GL044007.
  490. Kim, S.T. et al., 2014b: Response of El Niño sea surface temperature variability to greenhouse warming. Nat. Clim. Change, 4(9), 786–790, doi:10.1038/nclimate2326.
  491. Roxy, M.K., K. Ritika, P. Terray and S. Masson, 2014: The curious case of Indian Ocean warming. J. Clim., 27(22), 8501–8509, doi:10.1175/jcli-d-14-00471.1.
  492. Wittenberg, A.T., 2009: Are historical records sufficient to constrain ENSO simulations? Geophys. Res. Lett., 36(12), L12702, doi:10.1029/2009GL038710.
  493. Stevenson, S. et al., 2010: ENSO model validation using wavelet probability analysis. J. Clim., 23(20), 5540–5547, doi:10.1175/2010jcli3609.1.
  494. Ward, P.J. et al., 2014: Strong influence of El Nino Southern Oscillation on flood risk around the world. PNAS, 111(44), 15659–15664, doi:10.1073/pnas.1409822111.
  495. Ward, P.J., M. Kummu and U. Lall, 2016: Flood frequencies and durations and their response to El Nino. J. Hydrol., 539, 358–378, doi:10.1016/j.jhydrol.2016.05.045.
  496. Zhai, P. et al., 2016: The strong El Nino of 2015/16 and its dominant impacts on global and China’s climate. J. Meteorol. Res., 30(3), 283–297, doi:10.1007/s13351-016-6101-3.
  497. Scaife, A.A. et al., 2017: The predictability of European winter 2015/2016. Atmos. Sci. Lett., 18, 38–44, doi:10.1002/asl/721.
  498. Whan, K. and F. Zwiers, 2017: The impact of ENSO and the NAO on extreme winter precipitation in North America in observations and regional climate models. Clim. Dynam., 48, 1401–1411, doi:10.1007/s00382-016-3148-x.
  499. Sun, Q. and C. Miao, 2018: Extreme rainfall (R20mm, Rx5day) in Yangtze-Huai, China in June-July 2016: The role of ENSO and anthropogenic climate change. In “Explaining Extreme Events of 2016 from a Climate Perspective”. Bull. Am. Meterol. Soc., 99(1), S102–S106, doi:10.1175/BAMS-D-17-0118.1.
  500. Yuan, X., S. Wang and Z.Z. Hu, 2018: Do climate change and El Nino increase likelihood of Yangtze River extreme rainfall? In “Explaining Extreme Events of 2016 from a Climate Perspective”. Bull. Am. Meterol. Soc., 99(1), S113–S117, doi:10.1175/BAMS-D-17-0118.1.
  501. Cai, W. et al., 2014a: Increasing frequency of extreme El Nino events due to greenhouse warming. Nat. Clim. Change, 4(2), 111–116, doi:10.1038/NCLIMATE2100.
  502. Cai, W. et al., 2018: Increased variability of eastern Pacific El Niño under greenhouse warming. Nature, 564(7735), 201–206, doi:10.1038/s41586-018-0776-9.
  503. Cai, W. et al., 2014a: Increasing frequency of extreme El Nino events due to greenhouse warming. Nat. Clim. Change, 4(2), 111–116, doi:10.1038/NCLIMATE2100.
  504. Santoso, A., M.J. McPhaden and W. Cai, 2017: The defining characteristics of ENSO extremes and the strong 2015/2016 El Niño. Rev. Geophys., 55(4), 1079–1129, doi:10.1002/2017rg000560.
  505. Huang, B., M. L’Heureux, Z.Z. Hu and H.M. Zhang, 2016: Ranking the strongest ENSO events while incorporating SST uncertainty. Geophys. Res. Lett., 43(17), 9165–9172, doi:10.1002/2016gl070888.
  506. Santoso, A., M.J. McPhaden and W. Cai, 2017: The defining characteristics of ENSO extremes and the strong 2015/2016 El Niño. Rev. Geophys., 55(4), 1079–1129, doi:10.1002/2017rg000560.
  507. L’Heureux, M.L. et al., 2017: Observing and predicting the 2015/16 El Niño. Bull. Am. Meterol. Soc., 98(7), 1363–1382, doi:10.1175/BAMS-D-16-0009.1.
  508. Santoso, A., M.J. McPhaden and W. Cai, 2017: The defining characteristics of ENSO extremes and the strong 2015/2016 El Niño. Rev. Geophys., 55(4), 1079–1129, doi:10.1002/2017rg000560.
  509. Cai, W. et al., 2014a: Increasing frequency of extreme El Nino events due to greenhouse warming. Nat. Clim. Change, 4(2), 111–116, doi:10.1038/NCLIMATE2100.
  510. Wang, G. et al., 2017: Continued increase of extreme El Niño frequency long after 1.5°C warming stabilization. Nat. Clim. Change, 7(8), 568–572, doi:10.1038/Nclimate3351.
  511. Hoegh-Guldberg, O. et al., 2018: Impacts of 1.5 ºC global warming on natural and human systems. In: Global Warming of 1.5°C. An IPCC Special Report on the impacts of global warming of 1.5°C above pre-industrial levels and related global greenhouse gas emission pathways, in the context of strengthening the global response to the threat of climate change, sustainable development, and efforts to eradicate poverty [Masson-Delmotte, V., P. Zhai, H.-O. Pörtner, D. Roberts, J. Skea, P.R. Shukla, A. Pirani, W. Moufouma-Okia, C. Péan, R. Pidcock, S. Connors, J.B.R. Matthews, Y. Chen, X. Zhou, M.I. Gomis, E. Lonnoy, T. Maycock, M. Tignor, and T. Waterfield (eds.)], in press
  512. Cai, W. et al., 2015: Increased frequency of extreme La Niña events under greenhouse warming. Nat. Clim. Change, 5(2), 132–137, doi:10.1038/Nclimate2492.
  513. Wang, G. et al., 2017: Continued increase of extreme El Niño frequency long after 1.5°C warming stabilization. Nat. Clim. Change, 7(8), 568–572, doi:10.1038/Nclimate3351.
  514. Cai, W. et al., 2015: Increased frequency of extreme La Niña events under greenhouse warming. Nat. Clim. Change, 5(2), 132–137, doi:10.1038/Nclimate2492.
  515. Freund, M.B. et al., 2019: Higher frequency of Central Pacific El Niño events in recent decades relative to past centuries. Nat. Geosci., 12, 450–455, doi:10.1038/s41561-019-0353-3.
  516. Power, S. et al., 2013: Robust twenty-first-century projections of El Nino and related precipitation variability. Nature, 502(7472), 541–545, doi:10.1038/nature12580.
  517. Chung, C.T.Y. et al., 2014: Nonlinear precipitation response to El Nino and global warming in the Indo-Pacific. Clim. Dynam., 42(7–8), 1837-1856, doi:10.1007/s00382-013-1892-8.
  518. Huang, B. et al., 2015a: Extended reconstructed sea surface temperature version 4 (ERSST. v4). Part I: upgrades and intercomparisons. J. Clim., 28(3), 911–930, doi:10.1175/JCLI-D-14-00006.1.
  519. Cai, W. et al., 2018: Increased variability of eastern Pacific El Niño under greenhouse warming. Nature, 564(7735), 201–206, doi:10.1038/s41586-018-0776-9.
  520. Hu, S. and A.V. Fedorov, 2018: Cross-equatorial winds control El Niño diversity and change. Nat. Clim. Change, 8(9), 798–802, doi:10.1038/s41558-018-0248-0.
  521. Chen, D.K. et al., 2015a: Strong influence of westerly wind bursts on El Nino diversity. Nat. Geosci., 8(5), 339–345, doi:10.1038/NGEO2399.
  522. Nieves, V., J. Willis and W. Patzert, 2015: Recent hiatus caused by decadal shift in Indo-Pacific heating. Science, 349(6247), 532–535, doi:10.1126/science.aaa4521.
  523. Cheng, L. et al., 2017: Improved estimates of ocean heat content from 1960 to 2015. Sci. Adv., 3(3), e1601545, doi:10.1126/sciadv.1601545.
  524. Gnanaseelan, C., M.K. Roxy and A. Deshpande, 2017: Variability and Trends of Sea Surface Temperature and Circulation in the Indian Ocean. In: Observed climate variability and change over the Indian region [Rajeevan, M.N. and S. Nayak (eds.)]. Springer Singapore, Singapore, pp. 165–179. ISBN: 978-981-10-2530-3
  525. Cheng, L. et al., 2017: Improved estimates of ocean heat content from 1960 to 2015. Sci. Adv., 3(3), e1601545, doi:10.1126/sciadv.1601545.
  526. Makarim, S. et al., 2019: Previously unidentified Indonesian Throughflow pathways and freshening in the Indian Ocean during recent decades. Sci. Rep., 9(1), 7364, doi:10.1038/s41598-019-43841-z.
  527. Dong, L. and M.J. McPhaden, 2018: Unusually warm Indian Ocean sea surface temperatures help to arrest development of El Niño in 2014. Sci. Rep., 8(1), 2249, doi:10.1038/s41598-018-20294-4.
  528. Liu, W., J. Lu and S.-P. Xie, 2015b: Understanding the Indian Ocean response to double CO2 forcing in a coupled model. Ocean Dynam., 65(7), 1037–1046, doi:10.1007/s10236-015-0854-6.
  529. Susanto, R.D., A. Field, A.L. Gordon and T.R. Adi, 2012: Variability of Indonesian throughflow within Makassar Strait, 2004-2009. J. Geophys. Res.-Oceans, 117, C09013, doi:10.1029/2012JC008096.
  530. Sprintall, J. and A. Revelard, 2014: The Indonesian Throughflow response to Indo-Pacific climate variability. J. Geophys. Res.-Oceans, 119(2), 1161–1175, doi:10.1002/2013JC009533.
  531. Lee, S.-K. et al., 2015b: Pacific origin of the abrupt increase in Indian Ocean heat content during the warming hiatus. Nat. Geosci., 8(6), 445–449, doi:10.1038/ngeo2438.
  532. Susanto, R.D. and Y.T. Song, 2015: Indonesian throughflow proxy from satellite altimeters and gravimeters. J. Geophys. Res.-Oceans, 120(4), 2844–2855, doi:10.1002/2014JC010382.
  533. Zhang, Y. et al., 2018: Strengthened Indonesian throughflow drives decadal warming in the Southern Indian Ocean. Geophys. Res. Lett., 45(12), 6167–6175, doi:10.1029/2018gl078265.
  534. Roxy, M.K., K. Ritika, P. Terray and S. Masson, 2014: The curious case of Indian Ocean warming. J. Clim., 27(22), 8501–8509, doi:10.1175/jcli-d-14-00471.1.
  535. Abish, B., A. Cherchi and S.B. Ratna, 2018: ENSO and the recent warming of the Indian Ocean. Int. J. Climatol., 38(1), 203–214, doi:10.1002/joc.5170.
  536. Cai, W. et al., 2013: Projected response of the Indian Ocean Dipole to greenhouse warming. Nat. Geosci., 6(12), 999–1007, doi:10.1038/ngeo2009.
  537. Li, G., S.-P. Xie and Y. Du, 2016a: A Robust but Spurious Pattern of Climate Change in Model Projections over the Tropical Indian Ocean. J. Clim., 29(15), 5589–5608, doi:10.1175/jcli-d-15-0565.1.
  538. Hui, C. and X.-T. Zheng, 2018: Uncertainty in Indian Ocean Dipole response to global warming: the role of internal variability. Clim. Dynam., 51(9), 3597–3611, doi:10.1007/s00382-018-4098-2.
  539. Cai, W. et al., 2014b: Increased frequency of extreme Indian Ocean Dipole events due to greenhouse warming. Nature, 510(7504), 254–258, doi:10.1038/nature13327.
  540. Freitas, A.C.V., L. Aímola, T. Ambrizzi and C.P. de Oliveira, 2017: Extreme Intertropical Convergence Zone shifts over Southern Maritime Continent. Atmos. Sci. Lett., 18 (1), 2–10, doi:10.1002/asl.716.
  541. Yonekura, E. and T. Hall, 2014: ENSO Effect on East Asian Tropical Cyclone Landfall via Changes in Tracks and Genesis in a Statistical Model. J. Appl. Meteorol. Clim., 53(2), 406–420, doi:10.1175/JAMC-D-12-0240.1.
  542. Zhang, H. and Y. Guan, 2014: Impacts of four types of ENSO events on tropical cyclones making landfall over mainland china based on three best-track datasets. Adv. Atmos. Sci., 31(1), 154–164, doi:10.1007/s00376-013-2146-8.
  543. Wang, S. and R. Toumi, 2016: On the relationship between hurricane cost and the integrated wind profile. Environ. Res. Lett., 11(11), 114005, doi:10.1088/1748-9326/11/11/114005.
  544. Zhan, R., 2017: Intensified mega-ENSO has increased the proportion of intense tropical cyclones over the western northwest Pacific since the late 1970s. Geophys. Res. Lett., 44(23), 11,959–11,966, doi:10.1002/2017glo75916.
  545. Sanseverino, I. et al., 2016: Algal bloom and its economic impact, EUR 27905 EN Joint Research Centre, European Commission. 55 pp. http://www.matrixenvironment.com/2016_algae_bloom_and_economic_impact.pdf. Accessed 2019/20/08.
  546. Mogollon, R. and P. Calil, 2017: On the effects of ENSO on ocean biogeochemistry in the Northern Humboldt Current System (NHCS): A modeling study. J. Marine Syst., 172, 137–159, doi:10.1016/j.jmarsys.2017.03.011.
  547. Ohman, M.D., N. Mantua, J. Keister, M. Garcia-Reyes and S. McClatchie 2017: ENSO impacts on ecosystem indicators in the California Current System., Woods Hole Oceanographic Institution. 266 Woods Hole Rd, MS #25, Woods Hole, MA 02543 USA. Available at: https://www.us-ocb.org/enso-impacts-on-ecosystem-indicators-in-the-california-current-system/ Accessed 2018/03/30.
  548. Hughes, T.P. et al., 2017a: Coral reefs in the Anthropocene. Nature, 546(7656), 82–90, doi:10.1038/nature22901.
  549. Hughes, T.P. et al., 2017b: Global warming and recurrent mass bleaching of corals. Nature, 543(7645), 373–377, doi:10.1038/nature21707.
  550. Eakin, C.M. et al., 2018: Unprecedented three years of global coral bleaching 2014-2017 [Sidebar 3.1, in “State of the Climate in 2017”]. Bull. Am. Meterol. Soc., 99(8), S74–S75, doi:10.1175/2018BAMSStateoftheClimate.1.
  551. Thompson, L.G. et al., 2017: Impacts of recent warming and the 2015/16 El Niño on Tropical Peruvian ice fields. J. Geophys. Res.-Atmos., 122(23), 12,688–12,701, doi:10.1002/2017JD026592.
  552. Christidis, N., K. Manomaiphiboon, A. Ciavarella and P. A. Stott, 2018b: The hot and dry April of 2016 in Thailand [in “Explaining Extreme Events of 2016 from a Climate Perspective”]. Bull. Am. Meterol. Soc., 99(1), S128–S132, doi:10.1175/BAMS-ExplainingExtremeEvents2016.1.
  553. Tett, S.F.B. et al., 2018: Anthropogenic forcings and associated changes in fire risk in western North America and Australia during 2015/16. In “Explaining Extreme Events of 2016 from a Climate Perspective”. Bull. Am. Meterol. Soc., 99 1), S60–S64, doi:10.1175/BAMS-D-17-0118.1.
  554. Koplitz, S.N. et al., 2015: Public health impacts of the severe haze in Equatorial Asia in September–October 2015: demonstration of a new framework for informing fire management strategies to reduce downwind smoke exposure. Environ. Res. Lett., 11, 094023, doi:10.1088/1748-9326/11/9/094023.
  555. Chang, L.Y., J.M. Xu, X.X. Tie and J.B. Wu, 2016: Impact of the 2015 El Nino event on winter air quality in China. Sci. Rep., 6, 34275, doi:10.1038/srep34275.
  556. Zhai, P. et al., 2016: The strong El Nino of 2015/16 and its dominant impacts on global and China’s climate. J. Meteorol. Res., 30(3), 283–297, doi:10.1007/s13351-016-6101-3.
  557. Koplitz, S.N. et al., 2015: Public health impacts of the severe haze in Equatorial Asia in September–October 2015: demonstration of a new framework for informing fire management strategies to reduce downwind smoke exposure. Environ. Res. Lett., 11, 094023, doi:10.1088/1748-9326/11/9/094023.
  558. Christidis, N., K. Manomaiphiboon, A. Ciavarella and P. A. Stott, 2018b: The hot and dry April of 2016 in Thailand [in “Explaining Extreme Events of 2016 from a Climate Perspective”]. Bull. Am. Meterol. Soc., 99(1), S128–S132, doi:10.1175/BAMS-ExplainingExtremeEvents2016.1.
  559. Funk, C. et al., 2018: Anthropogenic enhancement of moderate-to-strong El Nino events likely contributed to drought and poor harvests in Southern Africa during 2016 [in “Explaining Extreme Events of 2016 from a Climate Perspective”]. Bull. Am. Meterol. Soc., 99(1), S91–S101, doi:10.1175/BAMS-ExplainingExtremeEvents2016.1.
  560. Anyamba, A. et al., 2019: Global Disease outbreaks Associated with the 2015–2016 El Niño event. Sci. Rep., 9(1), 1930, doi:10.1038/s41598-018-38034-z.
  561. Caminade, C. et al., 2017: Global risk model for vector-borne transmission of Zika virus reveals the role of El Niño 2015. PNAS, 114(1), 119–124, doi:10.1075/pnas.1614303114.
  562. Christidis, N., K. Manomaiphiboon, A. Ciavarella and P. A. Stott, 2018b: The hot and dry April of 2016 in Thailand [in “Explaining Extreme Events of 2016 from a Climate Perspective”]. Bull. Am. Meterol. Soc., 99(1), S128–S132, doi:10.1175/BAMS-ExplainingExtremeEvents2016.1.
  563. Sun, Q. and C. Miao, 2018: Extreme rainfall (R20mm, Rx5day) in Yangtze-Huai, China in June-July 2016: The role of ENSO and anthropogenic climate change. In “Explaining Extreme Events of 2016 from a Climate Perspective”. Bull. Am. Meterol. Soc., 99(1), S102–S106, doi:10.1175/BAMS-D-17-0118.1.
  564. Yuan, X., S. Wang and Z.Z. Hu, 2018: Do climate change and El Nino increase likelihood of Yangtze River extreme rainfall? In “Explaining Extreme Events of 2016 from a Climate Perspective”. Bull. Am. Meterol. Soc., 99(1), S113–S117, doi:10.1175/BAMS-D-17-0118.1.
  565. Christidis, N., K. Manomaiphiboon, A. Ciavarella and P. A. Stott, 2018b: The hot and dry April of 2016 in Thailand [in “Explaining Extreme Events of 2016 from a Climate Perspective”]. Bull. Am. Meterol. Soc., 99(1), S128–S132, doi:10.1175/BAMS-ExplainingExtremeEvents2016.1.
  566. Yonekura, E. and T. Hall, 2014: ENSO Effect on East Asian Tropical Cyclone Landfall via Changes in Tracks and Genesis in a Statistical Model. J. Appl. Meteorol. Clim., 53(2), 406–420, doi:10.1175/JAMC-D-12-0240.1.
  567. Zhang, H. and Y. Guan, 2014: Impacts of four types of ENSO events on tropical cyclones making landfall over mainland china based on three best-track datasets. Adv. Atmos. Sci., 31(1), 154–164, doi:10.1007/s00376-013-2146-8.
  568. Jin, F.-F., J. Boucharel and I.-I. Lin, 2014: Eastern Pacific tropical cyclones intensified by El Niño delivery of subsurface ocean heat. Nature, 516(7529), 82–85, doi:10.1038/nature13958.
  569. Moon, I.-J., S.-H. Kim and C. Wang, 2015b: El Niño and intense tropical cyclones. Nature, 526(7575), E4–E5, doi:10.1038/nature15546.
  570. Chand, S.S., K.J. Tory, H. Ye and K.J. Walsh, 2017: Projected increase in El Niño-driven tropical cyclone frequency in the Pacific. Nat. Clim. Change, 7, 123–127, doi:10.1038/nclimate3181.
  571. Rajeevan, M. et al., 2013: On the epochal variation of intensity of tropical cyclones in the Arabian Sea. Atmos. Sci. Lett., 14(4), 249–255, doi:10.1002/asl2.447.
  572. Chatterjee, A. et al., 2017: Influence of El Niño on atmospheric CO2 over the tropical Pacific Ocean: Findings from NASA’s OCO-2 mission. Science, 358 (6360), eaam5776, doi:10.1126/science.aam5776.
  573. Bastos, A. et al., 2018: Impact of the 2015/2016 El Niño on the terrestrial carbon cycle constrained by bottom-up and top-down approaches. Philos. Trans. R. Soc. London. B., 373(1760), 20170304, doi:10.1098/rstb.2017.0304.
  574. Bastos, A. et al., 2018: Impact of the 2015/2016 El Niño on the terrestrial carbon cycle constrained by bottom-up and top-down approaches. Philos. Trans. R. Soc. London. B., 373(1760), 20170304, doi:10.1098/rstb.2017.0304.
  575. Fasullo, J., B. Otto‐Bliesner and S. Stevenson, 2018: ENSO’s Changing Influence on Temperature, Precipitation, and Wildfire In a Warming Climate. Geophys. Res. Lett., 45 (17), 9216–9225, doi:10.1029/2018gl079022.
  576. Tedeschi, R.G. and M. Collins, 2017: The influence of ENSO on South American precipitation: simulation and projection in CMIP5 models. Int. J. Climatol., 37(8), 3319–3339, doi:10.1002/joc.4919.
  577. Yeh, S.W. et al., 2018: ENSO atmospheric teleconnections and their response to greenhouse gas forcing. Rev. Geophys., 56(1), 185–206, doi:10.1002/2017rg000568.
  578. Wang, B. et al., 2013: Northern Hemisphere summer monsoon intensified by mega-El Niño/southern oscillation and Atlantic multidecadal oscillation. PNAS, 110(14), 5347–5352, doi:10.1073/pnas.1219405110.
  579. Mishra, V., B.V. Smoliak, D.P. Lettenmaier and J.M. Wallace, 2012: A prominent pattern of year-to-year variability in Indian Summer Monsoon Rainfall. PNAS, 109(19), 7213–7217, doi:10.1073/pnas.1119150109.
  580. Roxy, M.K. et al., 2015: Drying of Indian subcontinent by rapid Indian Ocean warming and a weakening land-sea thermal gradient. Nat. Commun., 6, 7423, doi:10.1038/ncomms8423.
  581. Guo, L., A.G. Turner and E.J. Highwood, 2016: Local and remote impacts of aerosol species on Indian summer monsoon rainfall in a GCM. J. Clim., 29(19), 6937–6955, doi:10.1175/Jcli-D-15-0728.1.
  582. Paul, S. et al., 2016: Weakening of Indian Summer Monsoon Rainfall due to Changes in Land Use Land Cover. Sci. Rep., 6, 32177, doi:10.1038/srep32177.
  583. Roxy, M.K. et al., 2017: A threefold rise in widespread extreme rain events over central India. Nat. Commun., 8(1), 708, doi:10.1038/s41467-017-00744-9.
  584. Rohini, P., M. Rajeevan and A. Srivastava, 2016: On the variability and increasing trends of heat waves over India. Sci. Rep., 6, 26153, doi:10.1038/srep26153.
  585. Thirumalai, K., P.N. DiNezio, Y. Okumura and C. Deser, 2017: Extreme temperatures in Southeast Asia caused by El Nino and worsened by global warming. Nat. Commun., 8, 15531, doi:10.1038/ncomms15531.
  586. Puy, M. et al., 2017: Influence of Westerly Wind Events stochasticity on El Niño amplitude: the case of 2014 vs. 2015. Clim. Dynam., 52 12), 7435–7454, doi:10.1007/s00382-017-3938-9.
  587. Murphy, B.F., S.B. Power and S. McGree, 2014: The varied impacts of El Niño–Southern Oscillation on Pacific island climates. J. Clim., 27(11), 4015–4036, doi:10.1175/Jcli-D-13-00130.1.
  588. Fasullo, J., B. Otto‐Bliesner and S. Stevenson, 2018: ENSO’s Changing Influence on Temperature, Precipitation, and Wildfire In a Warming Climate. Geophys. Res. Lett., 45 (17), 9216–9225, doi:10.1029/2018gl079022.
  589. Power, S.B. and F.P. Delage, 2018: El Niño–Southern Oscillation and Associated Climatic Conditions around the World during the Latter Half of the Twenty-First Century. J. Clim., 31(15), 6189–6207, doi:10.1175/JCLI-D-18-0138.1.
  590. Lengaigne, M. et al., 2004: Westerly Wind Events in the Tropical Pacific and their Influence on the Coupled Ocean-Atmosphere System: A Review. In: Earth’s Climate: The Ocean-Atmosphere Interaction [Wang, C., S. Xie and J. Carton (eds.)], American Geophysical Union. Washington DC, USA, 49-69. ISBN: 9780875904122
  591. Chen, D.K. et al., 2015a: Strong influence of westerly wind bursts on El Nino diversity. Nat. Geosci., 8(5), 339–345, doi:10.1038/NGEO2399.
  592. Fedorov, A., S. Hu, M. Lengaigne and E. Guilyardi, 2015: The impact of westerly wind bursts and ocean initial state on the development, and diversity of El Nino events. Clim. Dynam., 44(5-6), 1381–1401, doi:10.1007/s00382-014-2126-4.
  593. Hu, S.N. and A.V. Fedorov, 2016: Exceptionally strong easterly wind burst stalling El Nino of 2014. PNAS, 113(8), 2005–2010, doi:10.1073/pnas.1514182113.
  594. Puy, M. et al., 2017: Influence of Westerly Wind Events stochasticity on El Niño amplitude: the case of 2014 vs. 2015. Clim. Dynam., 52 12), 7435–7454, doi:10.1007/s00382-017-3938-9.
  595. Bellenger, H. et al., 2014: ENSO representation in climate models: From CMIP3 to CMIP5. Clim. Dynam., 42(7–8), 1999–2018, doi:10.1007/s00382-013-1783-z.
  596. Takagi, H. and M. Esteban, 2016: Statistics of tropical cyclone landfalls in the Philippines: unusual characteristics of 2013 Typhoon Haiyan. Nat. Hazards, 80(1), 211–222, doi:10.1007/s11069-015-1965-6.
  597. Kim, H.S. et al., 2014a: Tropical Cyclone Simulation and Response to CO2 Doubling in the GFDL CM2.5 High-Resolution Coupled Climate Model. J. Clim., 27(21), 8034–8054, doi:10.1175/jcli-d-13-00475.1.
  598. Varotsos, C.A., C. Tzanis and A.P. Cracknell, 2016: Precursory signals of the major El Nino Southern Oscillation events. Theor. Appl. Climatol., 124(3–4), 903–912, doi:10.1007/s00704-015-1464-4.
  599. Liu, G. et al., 2018: Predicting Heat Stress to Inform Reef Management: NOAA Coral Reef Watch’s 4-Month Coral Bleaching Outlook. Front. Mar. Sci., 5, 57, doi:10.3389/fmars.2018.00057.
  600. Claar, D. et al., 2018: Global patterns and impacts of El Nino events on coral reefs: A meta-analysis. PLoS ONE, 13(2), e0190967, doi:10.1371/journal.pone.0190957.
  601. Claar, D. et al., 2018: Global patterns and impacts of El Nino events on coral reefs: A meta-analysis. PLoS ONE, 13(2), e0190967, doi:10.1371/journal.pone.0190957.
  602. Claar, D. et al., 2018: Global patterns and impacts of El Nino events on coral reefs: A meta-analysis. PLoS ONE, 13(2), e0190967, doi:10.1371/journal.pone.0190957.
  603. Claar, D. et al., 2018: Global patterns and impacts of El Nino events on coral reefs: A meta-analysis. PLoS ONE, 13(2), e0190967, doi:10.1371/journal.pone.0190957.
  604. Broad, K., A.S. Pfaff and M.H. Glantz, 2002: Effective and equitable dissemination of seasonal-to-interannual climate forecasts: policy implications from the Peruvian fishery during El Nino 1997–98. Clim. Change, 54(4), 415–438, doi:10.1023/A:1016164706290.
  605. Susanto, R.D., A. Field, A.L. Gordon and T.R. Adi, 2012: Variability of Indonesian throughflow within Makassar Strait, 2004-2009. J. Geophys. Res.-Oceans, 117, C09013, doi:10.1029/2012JC008096.
  606. Fang, G. et al., 2010: Volume, heat, and freshwater transports from the South China Sea to Indonesian seas in the boreal winter of 2007–2008. J. Geophys. Res.-Oceans, 115, C12020, doi:10.1029/2010jc006225.
  607. Susanto, R.D. et al., 2013: Observations of the Karimata Strait througflow from December 2007 to November 2008. Acta Oceanol. Sin., 32(5), 1–6, doi:10.1007/s13131-013-0307-3.
  608. Lee, T., S. Fournier, A.L. Gordon and J. Sprintall, 2019: Maritime Continent water cycle regulates low-latitude chokepoint of global ocean circulation. Nat. Commun., 10(1), 2103, doi:10.1038/s41467-019-10109-z.
  609. Wang, Y. et al., 2019: Seasonal variation of water transport through the Karimata Strait. Acta Oceanol. Sin., 38(4), 47–57, doi:10.1007/s13131-018-1224-2.
  610. Wei, Z. et al., 2019: An overview of 10-year observation of the South China Sea branch of the Pacific to Indian Ocean throughflow at the Karimata Strait. Acta Oceanol. Sin., 38(4), 1–11, doi:10.1007/s13131-019-1410-x.
  611. Sprintall, J. and A. Revelard, 2014: The Indonesian Throughflow response to Indo-Pacific climate variability. J. Geophys. Res.-Oceans, 119(2), 1161–1175, doi:10.1002/2013JC009533.
  612. Liu, Q.Y., M. Feng, D.X. Wang and S. Wijffels, 2015a: Interannual variability of the Indonesian Throughflow transport: A revisit based on 30 year expendable bathythermograph data. J. Geophys. Res.-Oceans, 120(12), 8270–8282, doi:10.1002/2015JC011351.
  613. Susanto, R.D. and Y.T. Song, 2015: Indonesian throughflow proxy from satellite altimeters and gravimeters. J. Geophys. Res.-Oceans, 120(4), 2844–2855, doi:10.1002/2014JC010382.
  614. Lee, S.-K. et al., 2015b: Pacific origin of the abrupt increase in Indian Ocean heat content during the warming hiatus. Nat. Geosci., 8(6), 445–449, doi:10.1038/ngeo2438.
  615. Flato, G. et al., 2013: Evaluation of Climate Models. In: Climate Change 2013: The Physical Science Basis. Contribution of Working Group I to the Fifth Assessment Report of the Intergovernmental Panel on Climate Change [Stocker, T.F., D. Qin, G.-K. Plattner, M. Tignor, S.K. Allen, J. Boschung, A. Nauels, Y. Xia, V. Bex and P.M. Midgley (eds.)]. Cambridge University Press, Cambridge, United Kingdom and New York, NY, USA, 741-866.
  616. Makarim, S. et al., 2019: Previously unidentified Indonesian Throughflow pathways and freshening in the Indian Ocean during recent decades. Sci. Rep., 9(1), 7364, doi:10.1038/s41598-019-43841-z.
  617. Lee, S.-K. et al., 2015b: Pacific origin of the abrupt increase in Indian Ocean heat content during the warming hiatus. Nat. Geosci., 8(6), 445–449, doi:10.1038/ngeo2438.
  618. Dong, L. and M.J. McPhaden, 2018: Unusually warm Indian Ocean sea surface temperatures help to arrest development of El Niño in 2014. Sci. Rep., 8(1), 2249, doi:10.1038/s41598-018-20294-4.
  619. Potemra, J.T. and N. Schneider, 2007: Interannual variations of the Indonesian throughflow. J. Geophys. Res.-Oceans, 112, C05035, doi:10.1029/2006jc003808.
  620. Pujiana, K., M.J. McPhaden, A.L. Gordon and A.M. Napitu, 2019: Unprecedented response of Indonesian throughflow to anomalous Indo‐Pacific climatic forcing in 2016. J. Geophys. Res.-Oceans, 124, 3737–3754, doi:10.1029/2018jc014574.
  621. Cai, W. et al., 2014b: Increased frequency of extreme Indian Ocean Dipole events due to greenhouse warming. Nature, 510(7504), 254–258, doi:10.1038/nature13327.
  622. Chung, E.-S. et al., 2019: Reconciling opposing Walker circulation trends in observations and model projections. Nat. Clim. Change, 9(5), 405–412, doi:10.1038/s41558-019-0446-4.
  623. Feng, M., X. Zhang, B. Sloyan and M. Chamberlain, 2017: Contribution of the deep ocean to the centennial changes of the Indonesian Throughflow. Geophys. Res. Lett., 44(6), 2859–2867, doi:10.1002/2017GL072577.
  624. Feng, M., N. Zhang, Q. Liu and S. Wijffels, 2018: The Indonesian throughflow, its variability and centennial change. Geoscience Letters, 5(1), 3, doi:10.1186/s40562-018-0102-2.
  625. England, M.H. et al., 2014: Recent intensification of wind-driven circulation in the Pacific and the ongoing warming
  626. Dee, D.P. et al., 2011: The ERA-Interim reanalysis: Configuration and performance of the data assimilation system. Q. R. Roy. Meteorol. Soc., 137(656), 553–597, doi:10.1002/qj.828.
  627. Poli, P. et al., 2016: ERA-20C: An atmospheric reanalysis of the 20th century. J. Clim., 29, 4083–4097, doi:10.1175/JCLI-D-15-0556.1.
  628. Compo, G.P. et al., 2011: The Twentieth Century Reanalysis Project. Q. R. Roy. Meteorol. Soc., 137(654), 1–28, doi:10.1002/qj.776.
  629. England, M.H. et al., 2014: Recent intensification of wind-driven circulation in the Pacific and the ongoing warming
  630. Kociuba, G. and S.B. Power, 2015: Inability of CMIP5 Models to Simulate Recent Strengthening of the Walker Circulation: Implications for Projections. J. Clim., 28(1), 20–35, doi:10.1175/JCLI-D-13-00752.1.
  631. Kosaka, Y. and S.P. Xie, 2013: Recent global-warming hiatus tied to equatorial Pacific surface cooling. Nature, 501(7467), 403–407, doi:10.1038/nature12534.
  632. Xie, S.-P., Y. Kosaka and Y. M. Okumura, 2016: Distinct energy budgets for anthropogenic and natural changes during global warming hiatus. Nat. Geosci., 9(1), 29–33, doi:10.1038/ngeo2581.
  633. Kucharski, F., I. Kang, R. Farneti and L. Feudale, 2011: Tropical Pacific response to 20th century Atlantic warming. Geophys. Res. Lett., 38, L03702, doi:10.1029/2010GL046248.
  634. Luo, J.-J., W. Sasaki and Y. Masumoto, 2012: Indian Ocean warming modulates Pacific climate change. PNAS, 109(46), 18701–18706, doi:10.1073/pnas.1210239109.
  635. McGregor, S. et al., 2014: Recent Walker circulation strengthening and Pacific cooling amplified by Atlantic warming. Nat. Clim. Change, 4(10), 888–892, doi:10.1038/NCLIMATE2330.
  636. Zhan, R., 2017: Intensified mega-ENSO has increased the proportion of intense tropical cyclones over the western northwest Pacific since the late 1970s. Geophys. Res. Lett., 44(23), 11,959–11,966, doi:10.1002/2017glo75916.
  637. Kucharski, F., I. Kang, R. Farneti and L. Feudale, 2011: Tropical Pacific response to 20th century Atlantic warming. Geophys. Res. Lett., 38, L03702, doi:10.1029/2010GL046248.
  638. McGregor, S. et al., 2014: Recent Walker circulation strengthening and Pacific cooling amplified by Atlantic warming. Nat. Clim. Change, 4(10), 888–892, doi:10.1038/NCLIMATE2330.
  639. Li, X.C., S.P. Xie, S.T. Gille and C. Yoo, 2016b: Atlantic-induced pan-tropical climate change over the past three decades. Nat. Clim. Change, 6(3), 275–279, doi:10.1038/NCLIMATE2840.
  640. Kajtar, J.B. et al., 2018: Model under-representation of decadal Pacific trade wind trends and its link to tropical Atlantic bias. Clim. Dynam., 50(3–4), 1471–1484, doi:10.1007/s00382-017-3699-5.
  641. McGregor, S. et al., 2018: Model tropical Atlantic biases underpin diminished Pacific decadal variability. Nat. Clim. Change, 8(6), 493–498, doi:10.1038/s41558-018-0163-4.
  642. Flato, G. et al., 2013: Evaluation of Climate Models. In: Climate Change 2013: The Physical Science Basis. Contribution of Working Group I to the Fifth Assessment Report of the Intergovernmental Panel on Climate Change [Stocker, T.F., D. Qin, G.-K. Plattner, M. Tignor, S.K. Allen, J. Boschung, A. Nauels, Y. Xia, V. Bex and P.M. Midgley (eds.)]. Cambridge University Press, Cambridge, United Kingdom and New York, NY, USA, 741-866.
  643. Marotzke, J. and P.M. Forster, 2015: Forcing, feedback and internal variability in global temperature trends. Nature, 517(7536), 565, doi:10.1038/nature14117.
  644. Ridderinkhof, H. et al., 2010: Seasonal and interannual variability in the Mozambique Channel from moored current observations. J. Geophys. Res.-Oceans, 115, C06010, doi:10.1029/2009JC005619.
  645. Beal, L.M. and S. Elipot, 2016: Broadening not strengthening of the Agulhas Current since the early 1990s. Nature, 540 (7634), 570–573, doi:10.1038/nature19853.
  646. Lübbecke, J.F., J.V. Durgadoo and A. Biastoch, 2015: Contribution of increased Agulhas leakage to tropical Atlantic warming. J. Clim., 28(24), 9697–9706, doi:10.1175/JCLI-D-15-0258.1.
  647. Biastoch, A. et al., 2015: Atlantic multi-decadal oscillation covaries with Agulhas leakage. Nat. Commun., 6, 10082, doi:10.1038/ncomms10082.
  648. Kelly, K.A. et al., 2016: Impact of slowdown of Atlantic overturning circulation on heat and freshwater transports. Geophys. Res. Lett., 43(14), 7625–7631, doi:10.1002/2016gl069789.
  649. Loveday, B.R., P. Penven and C.J.C. Reason, 2015: Southern Annular Mode and westerly‐wind‐driven changes in Indian‐Atlantic exchange mechanisms. Geophys. Res. Lett., 42(12), 4912–4921, doi:10.1002/2015GL064256.
  650. Ummenhofer, C.C., M. Kulüke and J.E. Tierney, 2018: Extremes in East African hydroclimate and links to Indo-Pacific variability on interannual to decadal timescales. Clim. Dynam., 50(7–8), 2971–2991, doi:10.1007/s00382-017-3786-7.
  651. Baek, S.H. et al., 2019: Pacific Ocean Forcing and Atmospheric Variability Are the Dominant Causes of Spatially Widespread Droughts in the Contiguous United States. J. Geophys. Res.-Atmos., 124(5), 2507–2524, doi:10.1029/2018JD029219.
  652. Coats, S. et al., 2016: Internal ocean‐atmosphere variability drives megadroughts in Western North America. Geophys. Res. Lett., 43(18), 9886–9894, doi:10.1002/ 2016GL070105.
  653. Diodato, N., L. de Guenni, M. Garcia and G. Bellocchi, 2019: Decadal Oscillation in the Predictability of Palmer Drought Severity Index in California. Climate, 7(1), 6, doi:10.3390/cli7010006.
  654. Vance, T. et al., 2015: Interdecadal Pacific variability and eastern Australian megadroughts over the last millennium. Geophys. Res. Lett., 42(1), 129–137, doi:10.1002/2014GL062447.
  655. Bao, G., Y. Liu, N. Liu and H.W. Linderholm, 2015: Drought variability in eastern Mongolian Plateau and its linkages to the large-scale climate forcing. Clim. Dynam., 44(3–4), 717–733, doi:10.1007/s00382-014-2273-7.
  656. Joshi, M.K. and A. Rai, 2015: Combined interplay of the Atlantic multidecadal oscillation and the interdecadal Pacific oscillation on rainfall and its extremes over Indian subcontinent. Clim. Dynam., 44(11–12), 3339–3359, doi:10.1007/s00382-014-2333-z.
  657. Kiem, A.S. et al., 2016: Natural hazards in Australia: droughts. Clim. Change, 139(1), 37–54, doi:10.1007/s10584-016-1798-7.
  658. Baek, S.H. et al., 2019: Pacific Ocean Forcing and Atmospheric Variability Are the Dominant Causes of Spatially Widespread Droughts in the Contiguous United States. J. Geophys. Res.-Atmos., 124(5), 2507–2524, doi:10.1029/2018JD029219.
  659. Ballantyne, A. et al., 2017: Accelerating net terrestrial carbon uptake during the warming hiatus due to reduced respiration. Nat. Clim. Change, 7, 148–152, doi:10.1038/nclimate3204.
  660. Keenan, T.F. et al., 2016: Recent pause in the growth rate of atmospheric CO2 due to enhanced terrestrial carbon uptake. Nat. Commun., 7, 13428, doi:10.1038/ncomms13428.
  661. Fay, A.R. and G.A. McKinley, 2013: Global trends in surface ocean pCO2 from in situ data. Global Biogeochem. Cy., 27(2), 541–557, doi:10.1002/gbc.20051.
  662. Landschützer, P., N. Gruber, D.C.E. Bakker and U. Schuster, 2014: Recent variability of the global ocean carbon sink. Global Biogeochem. Cy., 28(9), 927–949, doi:10.1002/2014gb004853.
  663. Majkut, J.D., J.L. Sarmiento and K.B. Rodgers, 2014: A growing oceanic carbon uptake: Results from an inversion study of surface pCO2 data. Global Biogeochem. Cy., 28(4), 335–351, doi:10.1002/2013gb004585.
  664. Landschützer, P. et al., 2015: The reinvigoration of the Southern Ocean carbon sink. Science, 349(6253), 1221–1224, doi:10.1126/science.aab2620.
  665. Munro, D.R. et al., 2015: Recent evidence for a strengthening CO2 sink in the Southern Ocean from carbonate system measurements in the Drake Passage (2002–2015). Geophys. Res. Lett., 42(18), 7623–7630, doi:10.1002/2015gl065194.
  666. Landschützer, P. et al., 2015: The reinvigoration of the Southern Ocean carbon sink. Science, 349(6253), 1221–1224, doi:10.1126/science.aab2620.
  667. DeVries, T., M. Holzer and F. Primeau, 2017: Recent increase in oceanic carbon uptake driven by weaker upper-ocean overturning. Nature, 542, 215, doi:10.1038/nature21068.
  668. IPCC, 2013: Climate Change 2013: The Physical Science Basis. Contribution of Working Group I to the Fifth Assessment Report of the Intergovernmental Panel on Climate Change [Stocker, T.F., D. Qin, G.-K. Plattner, M. Tignor, S.K. Allen, J. Boschung, A. Nauels, Y. Xia, V. Bex and P.M. Midgley (eds.)]. Cambridge University Press, Cambridge, United Kingdom and New York, NY, USA, 1535 pp.
  669. IPCC, 2013: Climate Change 2013: The Physical Science Basis. Contribution of Working Group I to the Fifth Assessment Report of the Intergovernmental Panel on Climate Change [Stocker, T.F., D. Qin, G.-K. Plattner, M. Tignor, S.K. Allen, J. Boschung, A. Nauels, Y. Xia, V. Bex and P.M. Midgley (eds.)]. Cambridge University Press, Cambridge, United Kingdom and New York, NY, USA, 1535 pp.
  670. McCarthy, G.D. et al., 2015b: Measuring the Atlantic Meridional Overturning Circulation at 26 degrees N. Progress in Oceanography, 130, 91–111, doi:10.1016/j.pocean.2014.10.006.
  671. Lozier, M.S. et al., 2017: Overturning in the Subpolar North Atlantic Program: A New International Ocean Observing System. Bull. Am. Meterol. Soc., 98(4), 737–752, doi:10.1175/bams-d-16-0057.1.
  672. Mercier, H. et al., 2015: Variability of the meridional overturning circulation at the Greenland-Portugal OVIDE section from 1993 to 2010. Progress in Oceanography, 132, 250–261, doi:10.1016/j.pocean.2013.11.001.
  673. Meinen, C.S. et al., 2013: Temporal variability of the meridional overturning circulation at 34.5 degrees S: Results from two pilot boundary arrays in the South Atlantic. J. Geophys. Res.-Oceans, 118(12), 6461–6478, doi:10.1002/2013jc009228.
  674. Smeed, D.A. et al., 2018: The North Atlantic Ocean Is in a State of Reduced Overturning. Geophys. Res. Lett., 45(3), 1527–1533, doi:10.1002/2017gl076350.
  675. Smeed, D.A. et al., 2018: The North Atlantic Ocean Is in a State of Reduced Overturning. Geophys. Res. Lett., 45(3), 1527–1533, doi:10.1002/2017gl076350.
  676. Blaker, A.T. et al., 2015: Historical analogues of the recent extreme minima observed in the Atlantic meridional overturning circulation at 26A degrees N. Clim. Dynam., 44(1-2), 457–473, doi:10.1007/s00382-014-2274-6.
  677. Meinen, C.S. et al., 2018: Meridional Overturning Circulation transport variability at 34.5° S during 2009–2017: Baroclinic and barotropic flows and the dueling influence of the boundaries. Geophys. Res. Lett., 45(9), 4180–4188, doi:10.1029/2018GL077408.
  678. Karspeck, A.R. et al., 2017: Comparison of the Atlantic meridional overturning circulation between 1960 and 2007 in six ocean reanalysis products. Clim. Dynam., 49(3), 957–982, doi:10.1007/s00382-015-2787-7.
  679. Menary, M.B. and L. Hermanson, 2018: Limits on determining the skill of North Atlantic Ocean decadal predictions. Nat. Commun., 9, 1694, doi:10.1038/s41467-018-04043-9.
  680. Jackson, L.C., K.A. Peterson, C.D. Roberts and R.A. Wood, 2016: Recent slowing of Atlantic overturning circulation as a recovery from earlier strengthening. Nat. Geosci., 9(7), 518–522, doi:10.1038/ngeo2715.
  681. Govin, A. et al., 2012: Persistent influence of ice sheet melting on high northern latitude climate during the early Last Interglacial. Clim. Past, 8(2), 483–507, doi:10.5194/cp-8-483-2012.
  682. Galaasen, E.V. et al., 2014: Rapid reductions in North Atlantic deep water during the peak of the last interglacial period. Science, 343(6175), 1129–1132, doi:10.1126/science.1248667.
  683. Caesar, L. et al., 2018: Observed fingerprint of a weakening Atlantic Ocean overturning circulation. Nature, 556 (7700), 191–196, doi:10.1038/s41586-018-0006-5.
  684. Dima, M. and G. Lohmann, 2010: Evidence for two distinct modes of large-scale ocean circulation changes over the last century. J. Clim., 23(1), 5–16, doi:10.1175/2009JCLI2867.1.
  685. Sherwood, O.A. et al., 2011: Nutrient regime shift in the western North Atlantic indicated by compound-specific δ15N of deep-sea gorgonian corals. PNAS, 108(3), 1011–1015, doi:10.1073/pnas.1004904108.
  686. Rahmstorf, S. et al., 2015: Exceptional twentieth-century slowdown in Atlantic Ocean overturning circulation. Nat. Clim. Change, 5(5), 475–480, doi:10.1038/nclimate2554.
  687. Thibodeau, B. et al., 2018: Last Century Warming Over the Canadian Atlantic Shelves Linked to Weak Atlantic Meridional Overturning Circulation. Geophys. Res. Lett., 45(22), 12376–12385, doi:10.1029/2018gl080083.
  688. Thornalley, D.J. et al., 2018: Anomalously weak Labrador Sea convection and Atlantic overturning during the past 150 years. Nature, 556(7700), 227–230, doi:10.1038/s41586-018-0007-4.
  689. IPCC, 2013: Climate Change 2013: The Physical Science Basis. Contribution of Working Group I to the Fifth Assessment Report of the Intergovernmental Panel on Climate Change [Stocker, T.F., D. Qin, G.-K. Plattner, M. Tignor, S.K. Allen, J. Boschung, A. Nauels, Y. Xia, V. Bex and P.M. Midgley (eds.)]. Cambridge University Press, Cambridge, United Kingdom and New York, NY, USA, 1535 pp.
  690. Menary, M.B. and L. Hermanson, 2018: Limits on determining the skill of North Atlantic Ocean decadal predictions. Nat. Commun., 9, 1694, doi:10.1038/s41467-018-04043-9.
  691. Sgubin, G. et al., 2017: Abrupt cooling over the North Atlantic in modern climate models. Nat. Commun., 8, 14375, doi:10.1038/ncomms14375.
  692. Menary, M.B. and L. Hermanson, 2018: Limits on determining the skill of North Atlantic Ocean decadal predictions. Nat. Commun., 9, 1694, doi:10.1038/s41467-018-04043-9.
  693. Drijfhout, S. et al., 2015: Catalogue of abrupt shifts in Intergovernmental Panel on Climate Change climate models. PNAS, 112(43), E5777-E5786, doi:10.1073/pnas.1511451112.
  694. Sgubin, G. et al., 2017: Abrupt cooling over the North Atlantic in modern climate models. Nat. Commun., 8, 14375, doi:10.1038/ncomms14375.
  695. Sgubin, G. et al., 2017: Abrupt cooling over the North Atlantic in modern climate models. Nat. Commun., 8, 14375, doi:10.1038/ncomms14375.
  696. Sgubin, G. et al., 2017: Abrupt cooling over the North Atlantic in modern climate models. Nat. Commun., 8, 14375, doi:10.1038/ncomms14375.
  697. Oltmanns, M., J. Karstensen and J. Fischer, 2018: Increased risk of a shutdown of ocean convection posed by warm North Atlantic summers. Nat. Clim. Change, 8(4), 300–304, doi:10.1038/s41558-018-0105-1.
  698. Mengel, M., A. Levermann, C.-F. Schleussner and A. Born, 2012: Enhanced Atlantic subpolar gyre variability through baroclinic threshold in a coarse resolution model. Earth Syst. Dynam., 3(2), 189–197, doi:10.5194/esd-3-189-2012.
  699. Born, A., T.F. Stocker, C.C. Raible and A. Levermann, 2013: Is the Atlantic subpolar gyre bistable in comprehensive coupled climate models? Clim. Dynam., 40(11–12), 2993–3007, doi:10.1007/s00382-012-1525-7.
  700. Born, A., T.F. Stocker and A.B. Sando, 2016: Transport of salt and freshwater in the Atlantic Subpolar Gyre. Ocean Dynam., 66(9), 1051–1064, doi:10.1007/s10236-016-0970-y.
  701. Lehner, F., A. Born, C.C. Raible and T.F. Stocker, 2013: Amplified Inception of European Little Ice Age by Sea Ice-Ocean-Atmosphere Feedbacks. J. Clim., 26(19), 7586–7602, doi:10.1175/jcli-d-12-00690.1.
  702. Schleussner, C.-F. et al., 2015: Indications for a North Atlantic ocean circulation regime shift at the onset of the Little Ice Age. Clim. Dynam., 45(11–12), 3623–3633, doi:10.1007/s00382-015-2561-x.
  703. Moreno-Chamarro, E. et al., 2017: Winter amplification of the European Little Ice Age cooling by the subpolar gyre. Sci. Rep., 7, 9981, doi:10.1038/s41598-017-07969-0.
  704. Schleussner, C.-F. and G. Feulner, 2013: A volcanically triggered regime shift in the subpolar North Atlantic Ocean as a possible origin of the Little Ice Age. Clim. Past, 9(3), 1321–1330, doi:10.5194/cpd-8-6199-2012.
  705. Bell, R. et al., 2017: Coastal hazards and climate change: Guidance for local government. Wellington, New Zealand. Published in December 2017 by the Ministry for the Environment, Manatū Mō Te Taiao, PO Box 10362, Wellington 6143, New Zealand ISBN: 978-1-98-852535-8
  706. Sgubin, G. et al., 2017: Abrupt cooling over the North Atlantic in modern climate models. Nat. Commun., 8, 14375, doi:10.1038/ncomms14375.
  707. IPCC, 2013: Climate Change 2013: The Physical Science Basis. Contribution of Working Group I to the Fifth Assessment Report of the Intergovernmental Panel on Climate Change [Stocker, T.F., D. Qin, G.-K. Plattner, M. Tignor, S.K. Allen, J. Boschung, A. Nauels, Y. Xia, V. Bex and P.M. Midgley (eds.)]. Cambridge University Press, Cambridge, United Kingdom and New York, NY, USA, 1535 pp.
  708. Schleussner, C.-F., A. Levermann and M. Meinshausen, 2014: Probabilistic projections of the Atlantic overturning. Clim. Change, 127(3–4), 579–586, doi:10.1007/s10584-014-1265-2.
  709. Reintges, A., M. Latif and W. Park, 2017: Sub-decadal North Atlantic Oscillation variability in observations and the Kiel Climate Model. Clim. Dynam., 48(11), 3475–3487, doi:10.1007/s00382-016-3279-0.
  710. McCarthy, G.D. et al., 2015b: Measuring the Atlantic Meridional Overturning Circulation at 26 degrees N. Progress in Oceanography, 130, 91–111, doi:10.1016/j.pocean.2014.10.006.
  711. Frölicher, T.L., K.B. Rodgers, C.A. Stock and W.W.L. Cheung, 2016: Sources of uncertainties in 21st century projections of potential ocean ecosystem stressors. Global Biogeochem. Cy., 30(8), 1224–1243, doi:10.1002/2015gb005338.
  712. Gregory, J.M. et al., 2016: The Flux-Anomaly-Forced Model Intercomparison Project (FAFMIP) contribution to CMIP6: investigation of sea level and ocean climate change in response to CO2 forcing. Geosci. Model. Dev., 9(11), 3993–4017, doi:10.5194/gmd-9-3993-2016.
  713. Sevellec, F., A.V. Fedorov and W. Liu, 2017: Arctic sea-ice decline weakens the Atlantic Meridional Overturning Circulation. Nat. Clim. Change, 7(8), 604–610, doi:10.1038/nclimate3353.
  714. Moore, G.W.K., K. Vage, R.S. Pickart and I.A. Renfrew, 2015: Decreasing intensity of open-ocean convection in the Greenland and Iceland seas. Nat. Clim. Change, 5(9), 877–882, doi:10.1038/nclimate2688.
  715. Lique, C. and M.D. Thomas, 2018: Latitudinal shift of the Atlantic Meridional Overturning Circulation source regions under a warming climate. Nat. Clim. Change, 8(11), 1013–1020, doi:10.1038/s41558-018-0316-5.
  716. Yang, Q. et al., 2016b: Recent increases in Arctic freshwater flux affects Labrador Sea convection and Atlantic overturning circulation. Nat. Commun., 7, 10525, doi:10.1038/ncomms10525.
  717. Bamber, J.L. et al., 2018: Land ice freshwater budget of the Arctic and North Atlantic Oceans: 1. Data, methods, and results. J. Geophys. Res.-Oceans, 123(3), 1827-–1837, doi:10.1002/2017JC013605.
  718. Trusel, L.D. et al., 2018: Nonlinear rise in Greenland runoff in response to post-industrial Arctic warming. Nature, 564 (7734), 104–108, doi:10.1038/s41586-018-0752-4.
  719. Yang, Q. et al., 2016b: Recent increases in Arctic freshwater flux affects Labrador Sea convection and Atlantic overturning circulation. Nat. Commun., 7, 10525, doi:10.1038/ncomms10525.
  720. Boning, C.W. et al., 2016: Emerging impact of Greenland meltwater on deepwater formation in the North Atlantic Ocean. Nat. Geosci., 9(7), 523–527, doi:10.1038/ngeo2740.
  721. Rahmstorf, S. et al., 2015: Exceptional twentieth-century slowdown in Atlantic Ocean overturning circulation. Nat. Clim. Change, 5(5), 475–480, doi:10.1038/nclimate2554.
  722. Yang, Q. et al., 2016b: Recent increases in Arctic freshwater flux affects Labrador Sea convection and Atlantic overturning circulation. Nat. Commun., 7, 10525, doi:10.1038/ncomms10525.
  723. Proshutinsky, A. et al., 2015: Arctic circulation regimes. Philos. Trans. Royal Soc. A., 373(2052), 20140160, doi:10.1098/rsta.2014.0160.
  724. Dukhovskoy, D.S. et al., 2016: Greenland freshwater pathways in the sub-Arctic Seas from model experiments with passive tracers. J. Geophys. Res.-Oceans, 121(1), 877–907, doi:10.1002/2015jc011290.
  725. Yashayaev, I. and J.W. Loder, 2017: Further intensification of deep convection in the Labrador Sea in 2016. Geophys. Res. Lett., 44(3), 1429–1438, doi:10.1002/2016gl071668.
  726. Swingedouw, D. et al., 2013: Decadal fingerprints of freshwater discharge around Greenland in a multi-model ensemble. Clim. Dynam., 41 (3-4), 695-720, doi:10.1007/s00382-012-1479-9.
  727. Bakker, P. et al., 2016: Fate of the Atlantic Meridional Overturning Circulation: Strong decline under continued warming and Greenland melting. Geophys. Res. Lett., 43(23), 12,252–12,260, doi:10.1002/2016gl070457.
  728. Lenaerts, J.T.M. et al., 2015: Representing Greenland ice sheet freshwater fluxes in climate models. Geophys. Res. Lett., 42(15), 6373–6381, doi:10.1002/2015gl064738.
  729. Bakker, P. et al., 2016: Fate of the Atlantic Meridional Overturning Circulation: Strong decline under continued warming and Greenland melting. Geophys. Res. Lett., 43(23), 12,252–12,260, doi:10.1002/2016gl070457.
  730. Caesar, L. et al., 2018: Observed fingerprint of a weakening Atlantic Ocean overturning circulation. Nature, 556 (7700), 191–196, doi:10.1038/s41586-018-0006-5.
  731. Bakker, P. et al., 2016: Fate of the Atlantic Meridional Overturning Circulation: Strong decline under continued warming and Greenland melting. Geophys. Res. Lett., 43(23), 12,252–12,260, doi:10.1002/2016gl070457.
  732. Jackson, L. C. et al., 2014: Response of the Atlantic meridional overturning circulation to a reversal of greenhouse gas increases. Clim. Dynam., 42(11–12), 3323–3336, doi:10.1007/s00382-013-1842-5.
  733. Sgubin, G. et al., 2015: Multimodel analysis on the response of the AMOC under an increase of radiative forcing and its symmetrical reversal. Clim. Dynam., 45(5–6), 1429–1450, doi:10.1007/s00382-014-2391-2.
  734. Palter, J.B., T.L. Frölicher, D. Paynter and J.G. John, 2018: Climate, ocean circulation, and sea level changes under stabilization and overshoot pathways to 1.5 K warming. Earth Syst. Dynam., 9, 817–828, doi:10.5194/esd-2017-105.
  735. Hawkins, E. et al., 2011: Bistability of the Atlantic overturning circulation in a global climate model and links to ocean freshwater transport. Geophys. Res. Lett., 38, L10605, doi:10.1029/2011GL048997.
  736. Jackson, L.C., R.S. Smith and R.A. Wood, 2017: Ocean and atmosphere feedbacks affecting AMOC hysteresis in a GCM. Clim. Dynam., 49(1–2), 173–191, doi:10.1007/s00382-016-3336-8.
  737. Mecking, J.V., S.S. Drijfhout, L.C. Jackson and T. Graham, 2016: Stable AMOC off state in an eddy-permitting coupled climate model. Clim. Dynam., 47(7–8), 2455–2470, doi:10.1007/s00382-016-2975-0.
  738. Jackson, L.C. and R.A. Wood, 2018: Hysteresis and Resilience of the AMOC in an Eddy-Permitting GCM. Geophys. Res. Lett., 45(16), 8547–8556, doi:10.1029/2018gl078104.
  739. Deshayes, J. et al., 2013: Oceanic hindcast simulations at high resolution suggest that the Atlantic MOC is bistable. Geophys. Res. Lett., 40(12), 3069–3073, doi:10.1002/grl.50534.
  740. Liu, W., S.P. Xie, Z.Y. Liu and J. Zhu, 2017a: Overlooked possibility of a collapsed Atlantic Meridional Overturning Circulation in warming climate. Sci. Adv., 3(1), e1601666, doi:10.1126/sciadv.1601666.
  741. Mecking, J.V., S.S. Drijfhout, L.C. Jackson and M.B. Andrews, 2017: The effect of model bias on Atlantic freshwater transport and implications for AMOC bi-stability. Tellus A: Dynamic Meteorology and Oceanography, 69, 1299910, doi:10.1080/16000870.2017.1299910.
  742. Liu, W., Z. Liu and E.C. Brady, 2014b: Why is the AMOC Monostable in Coupled General Circulation Models? J. Clim., 27(6), 2427–2443, doi:10.1175/jcli-d-13-00264.1.
  743. Robson, J.I., R.T. Sutton and D.M. Smith, 2012: Initialized decadal predictions of the rapid warming of the North Atlantic Ocean in the mid 1990s. Geophys. Res. Lett., 39(19), L19713, doi:10.1029/2012gl053370.
  744. Persechino, A. et al., 2013: Decadal predictability of the Atlantic meridional overturning circulation and climate in the IPSL-CM5A-LR model. Clim. Dynam., 40(9–10), 2359–2380, doi:10.1007/s00382-012-1466-1.
  745. Robson, J.I., R.T. Sutton and D.M. Smith, 2013: Predictable Climate Impacts of the Decadal Changes in the Ocean in the 1990s. J. Clim., 26(17), 6329–6339, doi:10.1175/jcli-d-12-00827.1.
  746. Wouters, B. et al., 2013: Multiyear predictability of the North Atlantic subpolar gyre. Geophys. Res. Lett., 40(12), 3080–3084, doi:10.1002/grl.50585.
  747. Msadek, R. et al., 2014: Predicting a Decadal Shift in North Atlantic Climate Variability Using the GFDL Forecast System. J. Clim., 27(17), 6472–6496, doi:10.1175/jcli-d-13-00476.1.
  748. Robson, J.I. et al., 2018: Decadal prediction of the North Atlantic subpolar gyre in the HiGEM high-resolution climate model. Clim. Dynam., 50(3–4), 921–937, doi:10.1007/s00382-017-3649-2.
  749. Smith, D.M. et al., 2013: Real-time multi-model decadal climate predictions. Clim. Dynam., 41(11–12), 2875–2888, doi:10.1007/s00382-012-1600-0.
  750. Hermanson, L. et al., 2014: Forecast cooling of the Atlantic subpolar gyre and associated impacts. Geophys. Res. Lett., 41(14), 5167–5174, doi:10.1002/2014GL060420.
  751. Yeager, S.G., A.R. Karspeck and G. Danabasoglu, 2015: Predicted slowdown in the rate of Atlantic sea ice loss. Geophys. Res. Lett., 42(24), 10704–10713, doi:10.1002/2015GL065364.
  752. Robson, J., P. Ortega and R. Sutton, 2016: A reversal of climatic trends in the North Atlantic since 2005. Nat. Geosci., 9(7), 513–517, doi:10.1038/ngeo2727.
  753. Yeager, S.G. et al., 2018: Predicting near-term changes in the Earth System: A large ensemble of initialized decadal prediction simulations using the Community Earth System Model. Bull. Am. Meterol. Soc., 99(9), 1867–1886, doi:10.1175/bams-d-17-0098.1.
  754. Sgubin, G. et al., 2017: Abrupt cooling over the North Atlantic in modern climate models. Nat. Commun., 8, 14375, doi:10.1038/ncomms14375.
  755. Masson-Delmotte, V. et al., 2013: Information from Paleoclimate Archives. In: Climate Change 2013: The Physical Science Basis. Contribution of Working Group I to the Fifth Assessment Report of the Intergovernmental Panel on Climate Change [Stocker, T.F., D. Qin, G.-K. Plattner, M. Tignor, S.K. Allen, J. Boschung, A. Nauels, Y. Xia, V. Bex and P.M. Midgley (eds.)]. Cambridge University Press, Cambridge, United Kingdom and New York, NY, USA, 383-464.
  756. Lynch-Stieglitz, J., 2017: The Atlantic Meridional Overturning Circulation and Abrupt Climate Change. Annu. Rev. Mar. Sci., 9, 83–104, doi:10.1146/annurev-marine-010816-060415.
  757. Clement, A. et al., 2015: The Atlantic Multidecadal Oscillation without a role for ocean circulation. Science, 350(6258), 320–324, doi:10.1126/science.aab3980.
  758. Zhan, R., 2017: Intensified mega-ENSO has increased the proportion of intense tropical cyclones over the western northwest Pacific since the late 1970s. Geophys. Res. Lett., 44(23), 11,959–11,966, doi:10.1002/2017glo75916.
  759. Gastineau, G., B. L’Heveder, F. Codron and C. Frankignoul, 2016: Mechanisms determining the winter atmospheric response to the Atlantic Overturning Circulation. J. Clim., 29(10), 3767–3785, doi:10.1175/jcli-d-15-0326.1.
  760. Woollings, T. et al., 2012: Response of the North Atlantic storm track to climate change shaped by ocean-atmosphere coupling. Nat. Geosci., 5(5), 313–317, doi:10.1038/ngeo1438.
  761. Jackson, L.C. et al., 2015: Global and European climate impacts of a slowdown of the AMOC in a high resolution GCM. Clim. Dynam., 45(11–12), 3299–3316, doi:10.1007/s00382-015-2540-2.
  762. Peings, Y., G. Simpkins and G. Magnusdottir, 2016: Multidecadal fluctuations of the North Atlantic Ocean and feedback on the winter climate in CMIP5 control simulations. J. Geophys. Res.-Atmos., 121(6), 2571–2592, doi:10.1002/2015jd024107.
  763. Yeager, S.G., A.R. Karspeck and G. Danabasoglu, 2015: Predicted slowdown in the rate of Atlantic sea ice loss. Geophys. Res. Lett., 42(24), 10704–10713, doi:10.1002/2015GL065364.
  764. Delworth, T.L. and F.R. Zeng, 2016: The impact of the North Atlantic Oscillation on climate through its influence on the Atlantic Meridional Overturning Circulation. J. Clim., 29(3), 941–962, doi:10.1175/jcli-d-15-0396.1.
  765. Jackson, L.C. et al., 2015: Global and European climate impacts of a slowdown of the AMOC in a high resolution GCM. Clim. Dynam., 45(11–12), 3299–3316, doi:10.1007/s00382-015-2540-2.
  766. Haarsma, R.J., F.M. Selten and S.S. Drijfhout, 2015: Decelerating Atlantic meridional overturning circulation main cause of future west European summer atmospheric circulation changes. Environ. Res. Lett., 10(9), 094007, doi:10.1088/1748-9326/10/9/094007.
  767. Yamamoto, A. and J.B. Palter, 2016: The absence of an Atlantic imprint on the multidecadal variability of wintertime European temperature. Nat. Commun., 7, 10930, doi:10.1038/ncomms10930.
  768. Jackson, L.C. et al., 2015: Global and European climate impacts of a slowdown of the AMOC in a high resolution GCM. Clim. Dynam., 45(11–12), 3299–3316, doi:10.1007/s00382-015-2540-2.
  769. Hansen, J. et al., 2016: Ice melt, sea level rise and superstorms: evidence from paleoclimate data, climate modeling, and modern observations that 2 A degrees C global warming could be dangerous. Atmos. Chem. Phys., 16(6), 3761–3812, doi:10.5194/acp-16-3761-2016.
  770. Cunningham, S. A. et al., 2013: Atlantic Meridional Overturning Circulation slowdown cooled the subtropical ocean. Geophys. Res. Lett., 40(23), 6202–6207, doi:10.1002/2013gl058464.
  771. Buchan, J., J.J. M. Hirschi, A.T. Blaker and B. Sinha, 2014: North Atlantic SST Anomalies and the Cold North European Weather Events of Winter 2009/10 and December 2010. Mon. Weather Rev., 142(2), 922–932, doi:10.1175/mwr-d-13-00104.1.
  772. Josey, S.A. et al., 2018: The Recent Atlantic Cold Anomaly: Causes, Consequences, and Related Phenomena. Annu. Rev. Mar. Sci., 10(1), 475–501, doi:10.1146/annurev-marine-121916-063102.
  773. Duchez, A. et al., 2016: Potential for seasonal prediction of Atlantic sea surface temperatures using the RAPID array at 26N. Clim. Dynam., 46 (9–10), 3351–3370, doi:10.1007/s00382-015-2918-1.
  774. Vanniere, B., A. Czaja and H.F. Dacre, 2017: Contribution of the cold sector of extratropical cyclones to mean state features over the Gulf Stream in winter. Q. R. Roy. Meteorol. Soc., 143(705), 1990–2000, doi:10.1002/qj.3058.
  775. Saba, V.S. et al., 2016: Enhanced warming of the Northwest Atlantic Ocean under climate change. J. Geophys. Res.-Oceans, 121(1), 118–132, doi:10.1002/2015jc011346.
  776. Saba, V.S. et al., 2016: Enhanced warming of the Northwest Atlantic Ocean under climate change. J. Geophys. Res.-Oceans, 121(1), 118–132, doi:10.1002/2015jc011346.
  777. Azuz-Adeath, I., C. Gonzalez-Campos and A. Cuevas-Corona, 2019: Predicting the Temporal Structure of the Atlantic Multidecadal Oscillation (AMO) for Agriculture Management in Mexico’s Coastal Zone. J. Coastal Res., 35(1), 210–226, doi:10.2112/jcoastres-d-18-00030.1.
  778. McCarthy, G.D. et al., 2015a: Ocean impact on decadal Atlantic climate variability revealed by sea level observations. Nature, 521(7553), 508–510, doi:10.1038/nature14491.
  779. Palter, J.B., T.L. Frölicher, D. Paynter and J.G. John, 2018: Climate, ocean circulation, and sea level changes under stabilization and overshoot pathways to 1.5 K warming. Earth Syst. Dynam., 9, 817–828, doi:10.5194/esd-2017-105.
  780. Ezer, T., L.P. Atkinson, W.B. Corlett and J.L. Blanco, 2013: Gulf Stream’s induced sea level rise and variability along the U.S. mid-Atlantic coast. J. Geophys. Res.-Oceans, 118(2), 685–697, doi:10.1002/jgrc.20091.
  781. Little, C.M., C.G. Piecuch and R.M. Ponte, 2017: On the relationship between the meridional overturning circulation, alongshore wind stress, and United States East Coast sea level in the Community Earth System Model Large Ensemble. J. Geophys. Res.-Oceans, 122(6), 4554–4568, doi:10.1002/2017jc012713.
  782. Ezer, T., 2015: Detecting changes in the transport of the Gulf Stream and the Atlantic overturning circulation from coastal sea level data: The extreme decline in 2009-2010 and estimated variations for 1935-2012. Glob. Planet. Change, 129, 23–36, doi:10.1016/j.gloplacha.2015.03.002.
  783. Goddard, P.B., J.J. Yin, S.M. Griffies and S.Q. Zhang, 2015: An extreme event of sea level rise along the Northeast coast of North America in 2009-2010. Nat. Commun., 6, 6346, doi:10.1038/ncomms7346.
  784. Collins, J.A. et al., 2017: Rapid termination of the African Humid Period triggered by northern high-latitude cooling. Nat. Commun., 8, 1372, doi:10.1038/s41467-017-01454-y.
  785. Mulitza, S. et al., 2017: Synchronous and proportional deglacial changes in Atlantic meridional overturning and northeast Brazilian precipitation. Paleoceanography, 32(6), 622–633, doi:10.1002/2017PA003084.
  786. Jackson, L.C. et al., 2015: Global and European climate impacts of a slowdown of the AMOC in a high resolution GCM. Clim. Dynam., 45(11–12), 3299–3316, doi:10.1007/s00382-015-2540-2.
  787. Delworth, T.L. and F.R. Zeng, 2016: The impact of the North Atlantic Oscillation on climate through its influence on the Atlantic Meridional Overturning Circulation. J. Clim., 29(3), 941–962, doi:10.1175/jcli-d-15-0396.1.
  788. Defrance, D. et al., 2017: Consequences of rapid ice sheet melting on the Sahelian population vulnerability. PNAS, 114(25), 6533–6538, doi:10.1073/pnas.1619358114.
  789. Gaetani, M. and E. Mohino, 2013: Decadal Prediction of the Sahelian Precipitation in CMIP5 Simulations. J. Clim., 26(19), 7708–7719, doi:10.1175/JCLI-D-12-00635.1.
  790. Mohino, E., N. Keenlyside and H. Pohlmann, 2016: Decadal prediction of Sahel rainfall: where does the skill (or lack thereof) come from? Clim. Dynam., 47(11), 3593–3612, doi:10.1007/s00382-016-3416-9.
  791. Sheen, K.L. et al., 2017: Skilful prediction of Sahel summer rainfall on inter-annual and multi-year timescales. Nat. Commun., 8, 14966, doi:10.1038/ncomms14966.
  792. Delworth, T.L. and F.R. Zeng, 2016: The impact of the North Atlantic Oscillation on climate through its influence on the Atlantic Meridional Overturning Circulation. J. Clim., 29(3), 941–962, doi:10.1175/jcli-d-15-0396.1.
  793. Yan, X., R. Zhang and T.R. Knutson, 2017: The role of Atlantic overturning circulation in the recent decline of Atlantic major hurricane frequency. Nat. Commun., 8(1), 1695, doi:10.1038/s41467-017-01377-8.
  794. Hermanson, L. et al., 2014: Forecast cooling of the Atlantic subpolar gyre and associated impacts. Geophys. Res. Lett., 41(14), 5167–5174, doi:10.1002/2014GL060420.
  795. Marzin, C. et al., 2013: Glacial fluctuations of the Indian monsoon and their relationship with North Atlantic climate: new data and modelling experiments. Clim. Past, 9(5), 2135–2151, doi:10.5194/cp-9-2135-2013.
  796. Jackson, L.C. et al., 2015: Global and European climate impacts of a slowdown of the AMOC in a high resolution GCM. Clim. Dynam., 45(11–12), 3299–3316, doi:10.1007/s00382-015-2540-2.
  797. Zhou, X. et al., 2016: Catastrophic drought in East Asian monsoon region during Heinrich event 1. Quaternary Sci. Rev., 141, 1–8, doi:10.1016/j.quascirev.2016.03.029.
  798. Monerie, P.-A. et al., 2019: Effect of the Atlantic Multidecadal Variability on the Global Monsoon. Geophys. Res. Lett., 46(3), 1765–1775, doi:10.1029/2018gl080903.
  799. McGregor, S. et al., 2014: Recent Walker circulation strengthening and Pacific cooling amplified by Atlantic warming. Nat. Clim. Change, 4(10), 888–892, doi:10.1038/NCLIMATE2330.
  800. Chafik, L. et al., 2016: Global linkages originating from decadal oceanic variability in the subpolar North Atlantic. Geophys. Res. Lett., 43(20), 10909–10919, doi:10.1002/2016GL071134.
  801. Li, X.C., S.P. Xie, S.T. Gille and C. Yoo, 2016b: Atlantic-induced pan-tropical climate change over the past three decades. Nat. Clim. Change, 6(3), 275–279, doi:10.1038/NCLIMATE2840.
  802. Swingedouw, D. et al., 2017: Tentative reconstruction of the 1998–2012 hiatus in global temperature warming using the IPSL–CM5A–LR climate model. C.R Geosci., 349(8), 369–379, doi:10.1016/j.crte.2017.09.014.
  803. Dekker, M.M., A.S. von der Heydt and H.A. Dijkstra, 2018: Cascading transitions in the climate system. Earth Syst. Dynam., 9(4), 1243–1260, doi:10.5194/esd-9-1243-2018.
  804. Kostov, Y., K.C. Armour and J. Marshall, 2014: Impact of the Atlantic meridional overturning circulation on ocean heat storage and transient climate change. Geophys. Res. Lett., 41(6), 2108–2116, doi:10.1002/2013gl058998.
  805. Romanou, A., J. Marshall, M. Kelley and J. Scott, 2017: Role of the ocean’s AMOC in setting the uptake efficiency of transient tracers. Geophys. Res. Lett., 44(11), 5590–5598, doi:10.1002/2017GL072972.
  806. Marshall, J. et al., 2014: The ocean’s role in polar climate change: asymmetric Arctic and Antarctic responses to greenhouse gas and ozone forcing. Philos. Trans. Royal Soc. A., 372(2019), 20130040, doi:10.1098/rsta.2013.0040.
  807. Rugenstein, M.A.A. et al., 2013: Northern High-Latitude Heat Budget Decomposition and Transient Warming. J. Clim., 26(2), 609–621, doi:10.1175/jcli-d-11-00695.1.
  808. Winton, M. et al., 2013: Connecting Changing Ocean Circulation with Changing Climate. J. Clim., 26(7), 2268–2278, doi:10.1175/jcli-d-12-00296.1.
  809. Trossman, D.S. et al., 2016: Large-scale ocean circulation-cloud interactions reduce the pace of transient climate change. Geophys. Res. Lett., 43(8), 3935–3943, doi:10.1002/2016GL067931.
  810. Winton, M. et al., 2013: Connecting Changing Ocean Circulation with Changing Climate. J. Clim., 26(7), 2268–2278, doi:10.1175/jcli-d-12-00296.1.
  811. Frölicher, T.L., K.B. Rodgers, C.A. Stock and W.W.L. Cheung, 2016: Sources of uncertainties in 21st century projections of potential ocean ecosystem stressors. Global Biogeochem. Cy., 30(8), 1224–1243, doi:10.1002/2015gb005338.
  812. Armour, K.C. et al., 2016: Southern Ocean warming delayed by circumpolar upwelling and equatorward transport. Nat. Geosci., 9, 549, doi:10.1038/ngeo2731.
  813. Rugenstein, M.A.A. et al., 2013: Northern High-Latitude Heat Budget Decomposition and Transient Warming. J. Clim., 26(2), 609–621, doi:10.1175/jcli-d-11-00695.1.
  814. Winton, M. et al., 2013: Connecting Changing Ocean Circulation with Changing Climate. J. Clim., 26(7), 2268–2278, doi:10.1175/jcli-d-12-00296.1.
  815. Winton, M., K. Takahashi and I.M. Held, 2010: Importance of Ocean Heat Uptake Efficacy to Transient Climate Change. J. Clim., 23(9), 2333–2344, doi:10.1175/2009jcli3139.1.
  816. Rose, B.E.J. et al., 2014: The dependence of transient climate sensitivity and radiative feedbacks on the spatial pattern of ocean heat uptake. Geophys. Res. Lett., 41(3), 1071–1078, doi:10.1002/2013gl058955.
  817. Rose, B.E.J. and L. Rayborn, 2016: The Effects of Ocean Heat Uptake on Transient Climate Sensitivity. Curr. Clim., 2(4), 190–201, doi:10.1007/s40641-016-0048-4.
  818. Rugenstein, M.A.A., K. Caldeira and R. Knutti, 2016: Dependence of global radiative feedbacks on evolving patterns of surface heat fluxes. Geophys. Res. Lett., 43(18), 9877–9885, doi:10.1002/2016gl070907.
  819. Zickfeld, K., M. Eby and A.J. Weaver, 2008: Carbon-cycle feedbacks of changes in the Atlantic meridional overturning circulation under future atmospheric CO2. Global Biogeochem. Cy., 22(3), GB3024, doi:10.1029/2007GB003118.
  820. Winton, M. et al., 2013: Connecting Changing Ocean Circulation with Changing Climate. J. Clim., 26(7), 2268–2278, doi:10.1175/jcli-d-12-00296.1.
  821. Randerson, J.T. et al., 2015: Multicentury changes in ocean and land contributions to the climate-carbon feedback. Global Biogeochem. Cy., 29(6), 744–759, doi:10.1002/2014gb005079.
  822. Rhein, M. et al., 2017: Ventilation variability of Labrador SeaWater and its impact on oxygen and anthropogenic carbon: a review. Philos. Trans. Royal Soc. A., 375(2102), 20160321, doi:10.1098/rsta.2016.0321.
  823. Rhodes, R.H. et al., 2015: Enhanced tropical methane production in response to iceberg discharge in the North Atlantic. Science, 348(6238), 1016–1019, doi:10.1126/science.1262005.
  824. Ringeval, B. et al., 2013: Response of methane emissions from wetlands to the Last Glacial Maximum and an idealized Dansgaard-Oeschger climate event: insights from two models of different complexity. Clim. Past, 9(1), 149–171, doi:10.5194/cp-9-149-2013.
  825. Zurcher, S. et al., 2013: Impact of an abrupt cooling event on interglacial methane emissions in northern peatlands. Biogeosciences, 10(3), 1963–1981, doi:10.5194/bg-10-1963-2013.
  826. Parsons, L. A. et al., 2014: Influence of the Atlantic Meridional Overturning Circulation on the monsoon rainfall and carbon balance of the American tropics. Geophys. Res. Lett., 41(1), 146–151, doi:10.1002/2013gl058454.
  827. Bozbiyik, A. et al., 2011: Fingerprints of changes in the terrestrial carbon cycle in response to large reorganizations in ocean circulation. Clim. Past, 7(1), 319–338, doi:10.5194/cp-7-319-2011.
  828. Hátún, H. et al., 2009: Large bio-geographical shifts in the north-eastern Atlantic Ocean: From the subpolar gyre, via plankton, to blue whiting and pilot whales. Progress in Oceanography, 80(3–4), 149–162, doi:10.1016/j.pocean.2009.03.001.
  829. Payne, M.R. et al., 2012: The rise and fall of the NE Atlantic blue whiting Micromesistus poutassou. Mar. Biol. Res., 8(5–6), 475–487, doi:10.1080/17451000.2011.639778.
  830. Miesner, A.K. and M.R. Payne, 2018: Oceanographic variability shapes the spawning distribution of blue whiting ( Micromesistius poutassou ). Fish. Oceanogr., 27(6), 623–638, doi:10.1111/fog.12382.
  831. Descamps, S., H. Strøm and H. Steen, 2013: Decline of an arctic top predator: synchrony in colony size fluctuations, risk of extinction and the subpolar gyre. Oecologia, 173(4), 1271–1282, doi:10.1007/s00442-013-2701-0.
  832. Hátún, H. et al., 2009: Large bio-geographical shifts in the north-eastern Atlantic Ocean: From the subpolar gyre, via plankton, to blue whiting and pilot whales. Progress in Oceanography, 80(3–4), 149–162, doi:10.1016/j.pocean.2009.03.001.
  833. MacKenzie, B.R. et al., 2014: A cascade of warming impacts brings bluefin tuna to Greenland waters. Global Change Biol., 20(8), 2484–2491, doi:10.1111/gcb.12597.
  834. Johnson, C., M. Inall and S. Hakkinen, 2013: Declining nutrient concentrations in the northeast Atlantic as a result of a weakening Subpolar Gyre. Deep-Sea Res. Pt. I., 82, 95–107, doi:10.1016/j.dsr.2013.08.007.
  835. Hátún, H. et al., 2016: An inflated subpolar gyre blows life toward the northeastern Atlantic. Progress in Oceanography, 147, 49–66, doi:10.1016/j.pocean.2016.07.009.
  836. Årthun, M. et al., 2017: Skillful prediction of northern climate provided by the ocean. Nat. Commun., 8(May), 15875–15875, doi:10.1038/ncomms15875.
  837. Årthun, M. et al., 2018: Climate based multi-year predictions of the Barents Sea cod stock. PLoS ONE, 13(10), e0206319–e0206319, doi:10.1371/journal.pone.0206319.
  838. Alheit, J. et al., 2014: Atlantic Multidecadal Oscillation (AMO) modulates dynamics of small pelagic fishes and ecosystem regime shifts in the eastern North and Central Atlantic. J. Marine Syst., 131, 21–35, doi:10.1016/j.jmarsys.2013.11.002.
  839. Nye, J.A. et al., 2014: Ecosystem effects of the Atlantic Multidecadal Oscillation. J. Marine Syst., 133, 103–116, doi:10.1016/j.jmarsys.2013.02.006.
  840. Claret, M. et al., 2018: Rapid coastal deoxygenation due to ocean circulation shift in the northwest Atlantic. Nat. Clim. Change, 8(10), 868–872, doi:10.1038/s41558-018-0263-1.
  841. Osman, M. B. et al., 2019: Industrial-era decline in subarctic Atlantic productivity. Nature, 569, 551–555, doi:10.1038/s41586-019-1181-8.
  842. John, J.G., C.A. Stock and J.P. Dunne, 2015: A more productive, but different, ocean after mitigation. Geophys. Res. Lett., 42(22), 9836–9845, doi:10.1002/2015gl066160.
  843. Rocha, J.C., G. Peterson, Ö. Bodin and S. Levin, 2018: Cascading regime shifts within and across scales. Science, 362(6421), 1379–1383, doi:10.1126/science.aat7850.
  844. Cai, Y.Y., T.M. Lenton and T.S. Lontzek, 2016: Risk of multiple interacting tipping points should encourage rapid CO2 emission reduction. Nat. Clim. Change, 6(5), 520–525, doi:10.1038/NCLIMATE2964.
  845. Kopits, E., A. Marten and A. Wolverton, 2014: Incorporating ‘catastrophic’ climate change into policy analysis. Climate Policy, 14(5), 637–664, doi:10.1080/14693062.2014.864947.
  846. Link, P.M. and R.S. Tol, 2011: Estimation of the economic impact of temperature changes induced by a shutdown of the thermohaline circulation: an application of FUND. Clim. Change, 104(2), 287–304, doi:10.1007/s10584-009-9796-7.
  847. Link, L.E., 2010: The anatomy of a disaster, an overview of Hurricane Katrina and New Orleans. Ocean Engineering, 37(1), 4–12, doi:10.1016/j.oceaneng.2009.09.002.
  848. Boulton, C.A., L.C. Allison and T.M. Lenton, 2014: Early warning signals of Atlantic Meridional Overturning Circulation collapse in a fully coupled climate model. Nat. Commun., 5, 5752, doi:10.1038/ncomms6752.
  849. Matei, D. et al., 2012: Multiyear prediction of monthly mean Atlantic meridional overturning circulation at 26.5 N. Science, 335(6064), 76–79, doi:10.1126/science.1210299.
  850. Wouters, B. et al., 2013: Multiyear predictability of the North Atlantic subpolar gyre. Geophys. Res. Lett., 40(12), 3080–3084, doi:10.1002/grl.50585.
  851. Msadek, R. et al., 2014: Predicting a Decadal Shift in North Atlantic Climate Variability Using the GFDL Forecast System. J. Clim., 27(17), 6472–6496, doi:10.1175/jcli-d-13-00476.1.
  852. Kushnir, Y. et al., 2019: Towards operational predictions of the near-term climate. Nat. Clim. Change, 9(February), 94–101, doi:10.1038/s41558-018-0359-7.
  853. Nyamwanza, A.M. et al., 2017: Contributions of decadal climate information in agriculture and food systems in east and southern Africa. Clim. Change, 143(1–2), 115–128, doi:10.1007/s10584-017-1990-4.
  854. Tommasi, D. et al., 2017b: Managing living marine resources in a dynamic environment: The role of seasonal to decadal climate forecasts. Progress in Oceanography, 152, 15–49, doi:10.1016/j.pocean.2016.12.011.
  855. Payne, M.R. et al., 2017: Lessons from the First Generation of Marine Ecological Forecast Products. Front. Mar. Sci., 4, doi:10.3389/fmars.2017.00289.
  856. Helbing, D., 2013: Globally networked risks and how to respond. Nature, 497(7447), 51, doi:10.1038/nature12047.
  857. Gallina, V. et al., 2016: A review of multi-risk methodologies for natural hazards: Consequences and challenges for a climate change impact assessment. J. Environ. Manage. 168, 123–132, doi:10.1016/j.jenvman.2015.11.011.
  858. Leonard, M. et al., 2014: A compound event framework for understanding extreme impacts. WiRes. Clim. Change, 5(1), 113–128, doi:10.1002/wcc.252.
  859. Oppenheimer, M. et al., 2014: Emergent risks and key vulnerabilities. In: Climate Change 2014: Impacts, Adaptation, and Vulnerability. Part A: Global and Sectoral Aspects. Contribution of Working Group II to the Fifth Assessment Report of the Intergovernmental Panel of Climate Change [Field, C.B., V.R. Barros, D.J. Dokken, K.J. Mach, M.D. Mastrandrea, T.E. Bilir, M. Chatterjee, K.L. Ebi, Y.O. Estrada, R.C. Genova, B. Girma, E.S. Kissel, A.N. Levy, S. MacCracken, P.R. Mastrandrea and L.L. White (eds.)]. Cambridge University Press, Cambridge, United Kingdom and New York, NY, USA, 1039-1099.
  860. Gallina, V. et al., 2016: A review of multi-risk methodologies for natural hazards: Consequences and challenges for a climate change impact assessment. J. Environ. Manage. 168, 123–132, doi:10.1016/j.jenvman.2015.11.011.
  861. Zscheischler, J. et al., 2018: Future climate risk from compound events. Nat. Clim. Change, 8, 469–477, doi:10.1038/s41558-018-0156-3.
  862. Scolobig, A., 2017: Understanding Institutional Deadlocks in Disaster Risk Reduction: The Financial and Legal Risk Root Causes in Genova, Italy. J. Extr. Even., 4(02), 1750010, doi:10.1142/S2345737617500105.
  863. Marzocchi, W. et al., 2012: Basic principles of multi-risk assessment: a case study in Italy. Nat. Hazards, 62(2), 551–573, doi:10.1007/s11069-012-0092-x.
  864. Komendantova, N. et al., 2014: Multi-hazard and multi-risk decision-support tools as a part of participatory risk governance: Feedback from civil protection stakeholders. Int. J. Disast. Risk Re., 8, 50–67, doi:10.1016/j.ijdrr.2013.12.006.
  865. Gallina, V. et al., 2016: A review of multi-risk methodologies for natural hazards: Consequences and challenges for a climate change impact assessment. J. Environ. Manage. 168, 123–132, doi:10.1016/j.jenvman.2015.11.011.
  866. Shimizu, M. and A.L. Clark, 2015: Interconnected risks, cascading disasters and disaster management policy: a gap analysis. Planet@ Risk, 3(2), Global Risk Forum GRF Davos, Promenade 35, CH-7270 Davos Platz, Switzerland 260–270. ISSN 2296-8172
  867. Yang, H. et al., 2016a: Intensification and poleward shift of subtropical western boundary currents in a warming climate. J. Geophys. Res.-Oceans, 121(7), 4928–4945, doi:10.1002/2015JC011513.
  868. Booth, J.F., L. Thompson, J. Patoux and K.A. Kelly, 2012: Sensitivity of midlatitude storm intensification to perturbations in the sea surface temperature near the Gulf Stream. Mon. Weather Rev., 140(4), 1241–1256, doi:10.1175/mwr-d-11-00195.1.
  869. Hirata, H., R. Kawamura, M. Kato and T. Shinoda, 2016: Response of rapidly developing extratropical cyclones to sea surface temperature variations over the western Kuroshio–Oyashio confluence region. J. Geophys. Res.-Atmos., 121(8), 3843–3858, doi:10.1002/2015JD024391.
  870. Pepler, A.S., L.V. Alexander, J.P. Evans and S.C. Sherwood, 2016a: The influence of local sea surface temperatures on Australian east coast cyclones. J. Geophys. Res.-Atmos., 121(22), 13,352–13,363, doi:10.1002/2016JD025495.
  871. Brunnabend, S.-E. et al., 2017: Changes in extreme regional sea level under global warming. Ocean Sci., 13(1), 47–60, doi:10.5194/os-13-47-2017.
  872. Zhang, X., J.A. Church, D. Monselesan and K.L. McInnes, 2017b: Sea level projections for the Australian region in the 21st century. Geophys. Res. Lett., 44(16), 8481–8491, doi:10.1002/2017gl074176.
  873. Thompson, P.R., G.T. Mitchum, C. Vonesch and J.K. Li, 2013: Variability of Winter Storminess in the Eastern United States during the Twentieth Century from Tide Gauges. J. Clim., 26(23), 9713–9726, doi:10.1175/jcli-d-12-00561.1.
  874. Oey, L.Y. and S. Chou, 2016: Evidence of rising and poleward shift of storm surge in western North Pacific in recent decades. J. Geophys. Res.-Oceans, 121(7), 5181–5192, doi:10.1002/2016JC011777.
  875. Pepler, A.S., L.V. Alexander, J.P. Evans and S.C. Sherwood, 2016a: The influence of local sea surface temperatures on Australian east coast cyclones. J. Geophys. Res.-Atmos., 121(22), 13,352–13,363, doi:10.1002/2016JD025495.
  876. Seager, R. and I.R. Simpson, 2016: Western boundary currents and climate change. J. Geophys. Res.-Oceans, 121(9), 7212–7214, doi:10.1002/2016JC012156.
  877. Yang, H. et al., 2016a: Intensification and poleward shift of subtropical western boundary currents in a warming climate. J. Geophys. Res.-Oceans, 121(7), 4928–4945, doi:10.1002/2015JC011513.
  878. Little, C.M. et al., 2015: Joint projections of US East Coast sea level and storm surge. Nat. Clim. Change, 5(12), 1114–1120, doi:10.1038/nclimate2801.
  879. Wahl, T., N.G. Plant and J.W. Long, 2016: Probabilistic assessment of erosion and flooding risk in the northern Gulf of Mexico. J. Geophys. Res.-Oceans, 121(5), 3029–3043, doi:10.1002/2015JC011482.
  880. Moftakhari, H.R., A. AghaKouchak, B.F. Sanders and R.A. Matthew, 2017: Cumulative hazard: The case of nuisance flooding. Earth’s Future, 5(2), 214–223, doi:10.1002/2016EF000494.
  881. Moreno-Chamarro, E. et al., 2017: Winter amplification of the European Little Ice Age cooling by the subpolar gyre. Sci. Rep., 7, 9981, doi:10.1038/s41598-017-07969-0.
  882. Moreno-Chamarro, E. et al., 2017: Winter amplification of the European Little Ice Age cooling by the subpolar gyre. Sci. Rep., 7, 9981, doi:10.1038/s41598-017-07969-0.
  883. Smith, M D., 2011: An ecological perspective on extreme climatic events: a synthetic definition and framework to guide future research. J. Ecol., 99(3), 656–663, doi:10.1111/j.1365-2745.2011.01798.x.
  884. Nielsen, U.N. et al., 2012: The ecology of pulse events: insights from an extreme climatic event in a polar desert ecosystem. Ecosphere, 3(2), 1–15, doi:10.1890/Es11-00325.1.
  885. Hilmi, N. et al., 2013: Towards improved socio-economic assessments of ocean acidification’s impacts. Mar. Biol., 160(8), 1773–1787, doi:10.1007/s00227-012-2031-5.
  886. Graham, N.A. et al., 2015: Predicting climate-driven regime shifts versus rebound potential in coral reefs. Nature, 518 (7537), 94–97, doi:10.1038/nature14140.
  887. Lenoir, J. and J.C. Svenning, 2015: Climate‐related range shifts–a global multidimensional synthesis and new research directions. Ecography, 38(1), 15–28, doi:10.1111/ecog.00967.
  888. Hughes, T.P. et al., 2017b: Global warming and recurrent mass bleaching of corals. Nature, 543(7645), 373–377, doi:10.1038/nature21707.
  889. Alvarez-Filip, L. et al., 2009: Flattening of Caribbean coral reefs: region-wide declines in architectural complexity. Proc. Royal Soc. B., 276(1669), 3019–3025, doi:10.1098/rspb.2009.0339.
  890. Speers, A.E., E.Y. Besedin, J.E. Palardy and C. Moore, 2016: Impacts of climate change and ocean acidification on coral reef fisheries: An integrated ecological–economic model. Ecol. Econ., 128, 33–43, doi:10.1016/j.ecolecon.2016.04.012.
  891. Pescaroli, G. and D. Alexander, 2018: Understanding compound, interconnected, interacting, and cascading risks: a holistic framework. Risk Anal., 38(11), 2245–2257, doi:10.1111/risa.13128.
  892. Kopp, R.E., R.L. Shwom, G. Wagner and J. Yuan, 2016: Tipping elements and climate–economic shocks: Pathways toward integrated assessment. Earth’s Future, 4(8), 346–372, doi:10.1002/2016ef000362.
  893. Hsiang, S. et al., 2017: Estimating economic damage from climate change in the United States. Science, 356(6345), 1362–1369, doi:10.1126/science.aal4369.
  894. Handmer, J. et al., 2012: Changes in Impacts of Climate Extremes: Human Systems and Ecosystems. In: Managing the Risks of Extreme Events and Disasters to Advance Climate Change Adaptation. A Special Report of Working Groups I and II of the Intergovernmental Panel on Climate Change (IPCC) [Field, C.B., V. Barros, T.F. Stocker, D. Qin, D.J. Dokken, K.L. Ebi, M.D. Mastrandrea, K.J. Mach, G.K. Plattner, S.K. Allen, M. Tignor and P.M. Midgley (eds.)]. Cambridge University Press, Cambridge, United Kingdom and New York, NY, USA, 231-290.
  895. Kreibich, H. et al., 2014: Costing natural hazards. Nat. Clim. Change, 4, 303, doi:10.1038/nclimate2182.
  896. Haynes, G.W., S.M. Danes and K. Stafford, 2011: Influence of federal disaster assistance on family business survival and success. J. Conting. Crisis Man., 19(2), 86–98, doi:10.1111/j.1468-5973.2011.00637.x.
  897. Marshall, M.I., L.S. Niehm, S.B. Sydnor and H.L. Schrank, 2015: Predicting small business demise after a natural disaster: an analysis of pre-existing conditions. Nat. Hazards, 79(1), 331–354, doi:10.1007/s11069-015-1845-0.
  898. Saha, S.K., 2017: Cyclone Aila, livelihood stress, and migration: empirical evidence from coastal Bangladesh. Disasters, 41(3), 505–526, doi:10.1111/disa.12214.
  899. Barrow, J., J. Ford, R. Day and J. Morrongiello, 2018: Environmental drivers of growth and predicted effects of climate change on a commercially important fish, Platycephalus laevigatus. Mar. Ecol. Prog. Ser., 598, 201–212, doi:10.3354/meps12234.
  900. Bronen, R., 2011: Case 1: Network, the first village in Alaska to relocate due to climate change. In: North by 2020: perspectives on Alaska’s changing social-ecological systems [Lovecraft, A. L. and H. Eicken (eds.)]. University of Alaska Press, pp. 257-260. ISBN: 978-1-602-23142-9
  901. Durrer, P. and E. Adams, 2011: Case 3: Finding Ways to Move: The Challenges of Relocation in Kivalina, Northwest Alaska. In: North by 2020: perspectives on Alaska’s changing social-ecological systems [Lovecraft, A. L. and H. Eicken (eds.)]. University of Alaska Press, 265-268. ISBN: 9781602231429
  902. Marino, E., 2011: Case 2: Flood Waters, Politics, and Relocating Home: One Story of Shishmaref, Alaska. In: North by 2020: perspectives on Alaska’s changing social-ecological systems [Lovecraft, A.L. and H. Eicken (eds.)]. The University of Chicago Press, 1427 East 60th Street, Chicago, IL 60637 U.S.A., pp. 261–264. ISBN: 9781602231429
  903. Marino, E., 2012: The long history of environmental migration: Assessing vulnerability construction and obstacles to successful relocation in Shishmaref, Alaska. Global Environ. Change, 22(2), 374–381, doi:10.1016/j.gloenvcha.2011.09.016.
  904. Bronen, R. and F.S. Chapin, 2013: Adaptive governance and institutional strategies for climate-induced community relocations in Alaska. PNAS, 110(23), 9320–9325, doi:10.1073/pnas.1210508110.
  905. Nunn, P.D. et al., 2016: Spirituality and attitudes towards Nature in the Pacific Islands: insights for enabling climate-change adaptation. Clim. Change, 136(3–4), 477–493, doi:10.1007/s10584-016-1646-9.
  906. Scolobig, A., 2017: Understanding Institutional Deadlocks in Disaster Risk Reduction: The Financial and Legal Risk Root Causes in Genova, Italy. J. Extr. Even., 4(02), 1750010, doi:10.1142/S2345737617500105.
  907. Krausmann, E., A.M. Cruz and E. Salzano, 2017: Reducing Natech Risk: Organizational Measures. In: Natech Risk Assessment and Management: Reducing the Risk of Natural-Hazard Impact on Hazardous Installations [Krausmann E., A.M. Cruz, E. Salzano (eds.)]. Elsevier, Amsterdam, The Netherlands, 243-252. ISBN: 978-0-12-803807-9]
  908. Lawrence, J. et al., 2018: National guidance for adapting to coastal hazards and sea level rise: Anticipating change, when and how to change pathway. Environ. Sci. Policy, 82, 100–107, doi:10.1016/j.envsci.2018.01.012.
  909. Gerkensmeier, B. and B.M.W. Ratter, 2018: Multi-risk, multi-scale and multi-stakeholder–the contribution of a bow-tie analysis for risk management in the trilateral Wadden Sea Region. J. Coast. Conserv., 22(1), 145–156, doi:10.1007/s11852-016-0454-8.
  910. Scolobig, A., 2017: Understanding Institutional Deadlocks in Disaster Risk Reduction: The Financial and Legal Risk Root Causes in Genova, Italy. J. Extr. Even., 4(02), 1750010, doi:10.1142/S2345737617500105.
  911. Hiwasaki, L., E. Luna and R. Shaw, 2014: Process for integrating local and indigenous knowledge with science for hydro-meteorological disaster risk reduction and climate change adaptation in coastal and small island communities. Int. J. Disast. Risk Re., 10, 15–27, doi:10.1016/j.ijdrr.2014.07.007.
  912. Hilhorst, D., J. Baart, G. van der Haar and F.M. Leeftink, 2015: Is disaster “normal” for indigenous people? Indigenous knowledge and coping practices. Disaster Prevention and Management: An International Journal, 24(4), 506–522, doi:10.1108/DPM-02-2015-0027.
  913. Audefroy, J.F. and B.N.C. Sánchez, 2017: Integrating local knowledge for climate change adaptation in Yucatán, Mexico. Int. J. Sustain. Built Environ., 6(1), 228–237, doi:10.1016/j.ijsbe.2017.03.007.
  914. Pearce, T., J. Ford, A.C. Willox and B. Smit, 2015: Inuit traditional ecological knowledge (TEK), subsistence hunting and adaptation to climate change in the Canadian Arctic. Arctic, 68(2), 233–245, doi:10.14430/arctic4475.
  915. Ikeda, N., C. Narama and S. Gyalson, 2016: Knowledge sharing for disaster risk reduction: Insights from a glacier lake workshop in the Ladakh region, Indian Himalayas. Mt. Res. Dev., 36(1), 31–40, doi:10.1659/Mrd-Journal-D-15-00035.1.
  916. Klerk, W.-J. et al., 2015: The co-incidence of storm surges and extreme discharges within the Rhine–Meuse Delta. Environ. Res. Lett., 10(3), 035005, doi:10.1088/1748-9326/10/3/035005.
  917. van den Hurk, B. et al., 2015: Analysis of a compounding surge and precipitation event in the Netherlands. Environ. Res. Lett., 10(3), 035001, doi:10.1088/1748-9326/10/3/035001.
  918. Wahl, T. et al., 2015: Increasing risk of compound flooding from storm surge and rainfall for major US cities. Nat. Clim. Change, 5(12), 1093–1097, doi:10.1038/Nclimate2736.
  919. Zscheischler, J. and S.I. Seneviratne, 2017: Dependence of drivers affects risks associated with compound events. Sci. Adv., 3(6), e1700263, doi:10.1126/sciadv.1700263.
  920. Wu, W. et al., 2018: Mapping Dependence Between Extreme Rainfall and Storm Surge. J. Geophys. Res.-Oceans, 123(4), 2461–2474, doi:10.1002/2017jc013472.
  921. Zscheischler, J. et al., 2018: Future climate risk from compound events. Nat. Clim. Change, 8, 469–477, doi:10.1038/s41558-018-0156-3.
  922. Lontzek, T.S., Y. Cai, K.L. Judd and T.M. Lenton, 2015: Stochastic integrated assessment of climate tipping points indicates the need for strict climate policy. Nat. Clim. Change, 5(5), 441, doi:10.1038/Nclimate2570.
  923. Cai, Y.Y., T.M. Lenton and T.S. Lontzek, 2016: Risk of multiple interacting tipping points should encourage rapid CO2 emission reduction. Nat. Clim. Change, 6(5), 520–525, doi:10.1038/NCLIMATE2964.
  924. Lemoine, D. and C.P. Traeger, 2016: Economics of tipping the climate dominoes. Nat. Clim. Change, 6(5), 514, doi:10.1038/Nclimate2902.
  925. Nordhaus, W.D., 1992: An optimal transition path for controlling greenhouse gases. Science, 258(5086), 1315–1319, doi:10.1126/science.258.5086.1315.
  926. Nordhaus, W.D., 2017: Revisiting the social cost of carbon. PNAS, 114(7), 201609244, doi:10.1073/pnas.1609244114.
  927. Cai, Y.Y., T.M. Lenton and T.S. Lontzek, 2016: Risk of multiple interacting tipping points should encourage rapid CO2 emission reduction. Nat. Clim. Change, 6(5), 520–525, doi:10.1038/NCLIMATE2964.
  928. Lemoine, D. and C.P. Traeger, 2016: Economics of tipping the climate dominoes. Nat. Clim. Change, 6(5), 514, doi:10.1038/Nclimate2902.
  929. Ceronsky, M., D. Anthoff, C. Hepburn and R.S. Tol, 2011: Checking the price tag on catastrophe: the social cost of carbon under non-linear climate response. ESRI working paper, Economic and Social Research Institute (ESRI), Dublin, Ireland, 34 pp. http://www.econstor.eu/bitstream/10419/50174/1/663372984.pdf. Accessed 2018/10/12.]
  930. Cai, Y.Y., T.M. Lenton and T.S. Lontzek, 2016: Risk of multiple interacting tipping points should encourage rapid CO2 emission reduction. Nat. Clim. Change, 6(5), 520–525, doi:10.1038/NCLIMATE2964.
  931. Cai, Y.Y., T.M. Lenton and T.S. Lontzek, 2016: Risk of multiple interacting tipping points should encourage rapid CO2 emission reduction. Nat. Clim. Change, 6(5), 520–525, doi:10.1038/NCLIMATE2964.
  932. Press, T., 2016: Tasmanian Wilderness World Heritage Area Bushfire and Climate Change Report. Department of Premier and Cabinet, Tasmanian Climate Change Office, GPO Box 123, Hobart TAS 7001, Australia, 156pp. ISBN: 978 0 7246 5715 0
  933. Oliver, E.C.J. et al., 2017: The unprecedented 2015/16 Tasman Sea marine heatwave. Nat. Commun., 8, 16101, doi:10.1038/ncomms16101.
  934. Karoly, D.J., M. Black, M.R. Grose and A.D. King, 2016: The roles of climate change and El Niño in the record low rainfall in October 2015 in Tasmania, Australia. Bull. Am. Meterol. Soc., 97(12), S18, doi:10.1175/Bams-D-16-0139.1.
  935. Oliver, E.C.J. et al., 2017: The unprecedented 2015/16 Tasman Sea marine heatwave. Nat. Commun., 8, 16101, doi:10.1038/ncomms16101.
  936. Hydro Tasmania, 2016: Annual Report. Hydro Tasmania, 128pp. URL: https://www.hydro.com.au/docs/default-source/about-us/our-governance/annual-reports/hydro-tasmania-annual-report-2016.pdf?sfvrsn=1c551328_2 Publisher: Hydro-Electric Corporation. 4 Elizabeth Street, Hobart, Tasmania, 7000, Australia
  937. Hydro Tasmania, 2016: Annual Report. Hydro Tasmania, 128pp. URL: https://www.hydro.com.au/docs/default-source/about-us/our-governance/annual-reports/hydro-tasmania-annual-report-2016.pdf?sfvrsn=1c551328_2 Publisher: Hydro-Electric Corporation. 4 Elizabeth Street, Hobart, Tasmania, 7000, Australia
  938. Eslake, S., 2016: Tasmania Report 2016. Tasmania Chamber of Commerce and Industry, Tasmanian Chamber of Commerce and Industry. Hobart, Tasmania, Australia.92pp. http://www.tcci.com.au/getattachment/Events/Tasmania-Report-2016/Tasmania-Report-2016-FINAL.pdf.aspx, Accessed 2018/04/01.
  939. Blake, E.S. and D.A. Zelinsky, 2018: Hurricane Harvey. Tropical Cyclone Report, National Hurricane Center, Miami, Florida, 76 pp. http://www.nhc.noaa.gov/data/tcr/AL092017_Harvey.pdf. Accessed 2019/08/20.
  940. Tasmanian Climate Change Office, 2017: Tasmanian Wilderness and World Heritage Area Bushfire and Climate Change Research Project: Tasmanian Government’s Response. Tasmanian Climate Change Office, Department of Premier and Cabinet, 49 pp. http://www.dpac.tas.gov.au/__data/assets/pdf_file/0015/361005/Tasmanian_Government_response_Final_Report_TWWHA_Bushfire_and_Climate_Change_Research_Project.pdf. Accessed 2019/20/08.
  941. Bureau of Meteorology and Australian CSIRO, 2007: Climate change in Australia: technical report 2007. CSIRO Marine and Atmospheric Research. Aspendale, Victoria, 148 pp. ISBN: 978-1-921-23293-0]
  942. Grose, M.R. et al., 2012: The simulation of cutoff lows in a regional climate model: reliability and future trends. Clim. Dynam., 39(1–2), 445–459, doi:10.1007/s00382-012-1368-2.
  943. Oliver, E.C.J. et al., 2017: The unprecedented 2015/16 Tasman Sea marine heatwave. Nat. Commun., 8, 16101, doi:10.1038/ncomms16101.
  944. Veron, J.C.E.N. et al., 2011: The Coral Triangle. In: Coral Reefs: An Ecosystem in Transition. Springer, pp. 47–55.
  945. Pomeroy, R. et al., 2015: Status and Priority Capacity Needs for Local Compliance and Community-Supported Enforcement of Marine Resource Rules and Regulations in the Coral Triangle Region. Coastal Management, 43(3), 301–328, doi:10.1080/08920753.2015.1030330.
  946. Ferrigno, F. et al., 2016: Corals in high diversity reefs resist human impact. Ecol. Indic., 70, 106–113, doi:10.1016/j.ecolind.2016.05.050.
  947. Huang, Y. and V.R. Coelho, 2017: Sustainability performance assessment focusing on coral reef protection by the tourism industry in the Coral Triangle region. Tourism Manage., 59, 510–527, doi:10.1016/j.tourman.2016.09.008.
  948. Hoegh-Guldberg, O. et al., 2009: The Coral Triangle and Climate Change Ecosystems, People and Societies at Risk. WWF Australia, Brisbane, 276pp. ISBN: 978-1-921031-35-9
  949. Kleypas, J.A., F.S. Castruccio, E.N. Curchitser and E. Mcleod, 2015: The impact of ENSO on coral heat stress in the western equatorial Pacific. Global Change Biol., 21(7), 2525–2539, doi:10.1111/gcb.12881.
  950. Penaflor, E.L. et al., 2009: Sea-surface temperature and thermal stress in the Coral Triangle’s over the past two decades. Coral Reefs, 28, 841–850, doi:10.1007/s00338-009-0522-8.
  951. Zuo, X.L. et al., 2015: Spatial and temporal variability of thermal stress to China’s coral reefs in South China Sea. Chinese Ge., 25(2), 159–173, doi:10.1007/s11769-015-0741-6.
  952. Kleypas, J.A., F.S. Castruccio, E.N. Curchitser and E. Mcleod, 2015: The impact of ENSO on coral heat stress in the western equatorial Pacific. Global Change Biol., 21(7), 2525–2539, doi:10.1111/gcb.12881.
  953. Penaflor, E.L. et al., 2009: Sea-surface temperature and thermal stress in the Coral Triangle’s over the past two decades. Coral Reefs, 28, 841–850, doi:10.1007/s00338-009-0522-8.
  954. Kayanne, H., 2017: Validation of degree heating weeks as a coral bleaching index in the northwestern Pacific. Coral Reefs, 36(1), 63–70, doi:10.1007/s00338-016-1524-y.
  955. Ampou, E.E. et al., 2017: Coral mortality induced by the 2015-2016 El Nino in Indonesia: the effect of rapid sea level fall. Biogeosciences, 14, 817–826, doi:10.5194/bg-14-817-2017.
  956. van Hooidonk, R., J.A. Maynard and S. Planes, 2013: Temporary refugia for coral reefs in a warming world. Nat. Clim. Change, 3, 508, doi:10.1038/nclimate1829.
  957. DeCarlo, T.M. et al., 2017: Community production modulates coral reef pH and the sensitivity of ecosystem calcification to ocean acidification. J. Geophys. Res.-Oceans, 122(1), 745–761, doi:10.1002/2016jc012326.
  958. Speers, A.E., E.Y. Besedin, J.E. Palardy and C. Moore, 2016: Impacts of climate change and ocean acidification on coral reef fisheries: An integrated ecological–economic model. Ecol. Econ., 128, 33–43, doi:10.1016/j.ecolecon.2016.04.012.
  959. White, A.T. et al., 2014: Marine Protected Areas in the Coral Triangle: Progress, Issues, and Options. Coast. Manage., 42(2), 87–106, doi:10.1080/08920753.2014.878177.
  960. Beger, M. et al., 2015: Integrating regional conservation priorities for multiple objectives into national policy. Nat. Commun., 6, 8208, doi:10.1038/ncomms9208.
  961. dela Cruz, D.W. and P.L. Harrison, 2017: Enhanced larval supply and recruitment can replenish reef corals on degraded reefs. Sci. Rep., 7(1), 13985, doi:10.1038/s41598-017-14546-y.
  962. Mellin, C. et al., 2016: Marine protected areas increase resilience among coral reef communities. Ecol. Lett., 19(6), 629–637, doi:10.1111/ele.12598.
  963. Mori, A.S., 2016: Resilience in the Studies of Biodiversity–Ecosystem Functioning. Trends Ecol. Evol., 35(2), 87–90, doi:10.1016/j.tree.2015.12.010.
  964. White, A.T. et al., 2014: Marine Protected Areas in the Coral Triangle: Progress, Issues, and Options. Coast. Manage., 42(2), 87–106, doi:10.1080/08920753.2014.878177.
  965. Christidis, N., K. Manomaiphiboon, A. Ciavarella and P. A. Stott, 2018b: The hot and dry April of 2016 in Thailand [in “Explaining Extreme Events of 2016 from a Climate Perspective”]. Bull. Am. Meterol. Soc., 99(1), S128–S132, doi:10.1175/BAMS-ExplainingExtremeEvents2016.1.
  966. Weijerman, M. et al., 2015: An Integrated Coral Reef Ecosystem Model to Support Resource Management under a Changing Climate. PLoS ONE, 10(12), e0144165, doi:10.1371/journal.pone.0144165.
  967. Weijerman, M. et al., 2016: Atlantis Ecosystem Model Summit: Report from a workshop. Ecol. Model., 335, 35–38, doi:10.1016/j.ecolmodel.2016.05.007.
  968. Anthony, K.R.N. et al., 2015: Operationalizing resilience for adaptive coral reef management under global environmental change. Global Change Biol., 21, 48–61, doi:10.1111/gcb.12700.
  969. Mora, C., N.A.J. Graham and N. Nyström, 2016: Ecological limitations to the resilience of coral reefs. Coral Reefs, 35(4), 1271–1280, doi:10.1007/s00338-016-1479-z.
  970. Klotzbach, P.J. and M.M. Bell, 2017: Summary of 2017 Atlantic Tropical Cyclone Activity and Verification of Authors’ Seasonal and Two-Week Forecasts. Colorado State University, Department of Atmospheric Science, Fort Collins, USA, 37 pp. https://tropical.colostate.edu/media/sites/111/2017/11/2017-11.pdf. Accessed 2019/20/08.
  971. Blake, E.S., C.W. Landsea and E.J. Gibney, 2011: The deadliest, costliest, and most intense United States tropical cyclones from 1851 to 2010 (and other frequently requested hurricane facts). NOAA/National Weather Service, National Centers for Environmental Prediction, National Hurricane Center Miami, Florida, 47 pp. http://www.census.gov/history/pdf/nws-nhc-6.pdf. Accessed 2019/08/20.
  972. Blake, E.S. and D.A. Zelinsky, 2018: Hurricane Harvey. Tropical Cyclone Report, National Hurricane Center, Miami, Florida, 76 pp. http://www.nhc.noaa.gov/data/tcr/AL092017_Harvey.pdf. Accessed 2019/08/20.
  973. Sobel, A.H. et al., 2016: Human influence on tropical cyclone intensity. Science, 353(6296), 242–246, doi:10.1126/science.aaf6574.
  974. Shuckburgh, E., D. Mitchell and P. Stott, 2017: Hurricanes Harvey, Irma and Maria: how natural were these ‘natural disasters’? Weather, 72(11), 353–354, doi:10.1002/wea.3190.
  975. Risser, M.D. and M.F. Wehner, 2017: Attributable Human‐Induced Changes in the Likelihood and Magnitude of the Observed Extreme Precipitation during Hurricane Harvey. Geophys. Res. Lett., 44(24), 12,457–12,464, doi:10.1002/2017GL075888.
  976. van Oldenborgh, G.J. et al., 2017: Attribution of extreme rainfall from Hurricane Harvey, August 2017. Environ. Res. Lett., 12(12), 124009, doi:10.1088/1748-9326/aa9ef2.
  977. Risser, M.D. and M.F. Wehner, 2017: Attributable Human‐Induced Changes in the Likelihood and Magnitude of the Observed Extreme Precipitation during Hurricane Harvey. Geophys. Res. Lett., 44(24), 12,457–12,464, doi:10.1002/2017GL075888.
  978. Blake, E.S. and D.A. Zelinsky, 2018: Hurricane Harvey. Tropical Cyclone Report, National Hurricane Center, Miami, Florida, 76 pp. http://www.nhc.noaa.gov/data/tcr/AL092017_Harvey.pdf. Accessed 2019/08/20.
  979. Cangialosi, J.P., A.S. Latto and R. Berg, 2018: Hurricane Irma. Tropical Cyclone Report, National Hurricane Center, Center, N. H., Miami, FL, 111 pp. http://www.nhc.noaa.gov/data/tcr/AL112017_Irma.pdf. Accessed: 2019/20/08.
  980. ACAPS, OCHA and UNDP, 2017: Regional Overview: Impact of Hurricanes Irma and Maria. Conference Supporting Document, UN Development Programme. New York, New York, USA, 39pp. Available at: https://reliefweb.int/sites/reliefweb.int/files/resources/UNDP%20%20Regional%20Overview%20Impact%20of%20Hurricanes%20Irma%20and%20Maria.pdf Accessed 2018/04/19.
  981. Pasch, R.J., A.B. Penny and R. Berg, 2018: Hurricane Maria. Tropical Cyclone Report, National Hurricane Center, Miami, USA., 48 pp. http://www.nhc.noaa.gov/data/tcr/AL152017_Maria.pdf. Accessed 20/08/2019.
  982. Rexach, M. et al., 2017: Hurricane Maria’s Aftermath: Highlights of Available Government Assistance for Puerto Rico Residents, Littler Mendelson. San Francisco, California, USA.. http://www.littler.com/files/hurricane_marias_aftermath_-_highlights_of_available_government_assistance_for_puerto_rico_residents.pdf Accessed 2018/04/19.
  983. Rosselló, R., 2017: Build Back Better Puerto Rico. Request for Federal Assistance for Disaster Recovery, Puerto Rico, 94 pp. http://nlihc.org/sites/default/files/Build_Back_Better_PR_Request_94B.pdf. Accessed 2019/20/08.
  984. Sacks, C.A., A.S. Kesselheim and M. Fralick, 2018: The shortage of normal saline in the wake of Hurricane Maria. JAMA Intern. Med., 178(7), 885–886, doi:10.1001/jamainternmed.2018.1936.
  985. ACAPS, OCHA and UNDP, 2017: Regional Overview: Impact of Hurricanes Irma and Maria. Conference Supporting Document, UN Development Programme. New York, New York, USA, 39pp. Available at: https://reliefweb.int/sites/reliefweb.int/files/resources/UNDP%20%20Regional%20Overview%20Impact%20of%20Hurricanes%20Irma%20and%20Maria.pdf Accessed 2018/04/19.
  986. Rosselló, R., 2017: Build Back Better Puerto Rico. Request for Federal Assistance for Disaster Recovery, Puerto Rico, 94 pp. http://nlihc.org/sites/default/files/Build_Back_Better_PR_Request_94B.pdf. Accessed 2019/20/08.
  987. Rosselló, R., 2017: Build Back Better Puerto Rico. Request for Federal Assistance for Disaster Recovery, Puerto Rico, 94 pp. http://nlihc.org/sites/default/files/Build_Back_Better_PR_Request_94B.pdf. Accessed 2019/20/08.
  988. Moloney, S., H. Fünfgeld and M. Granberg, 2017: Local Action on Climate Change: Opportunities and Constraints. Routledge, 2 Park Square, Milton Park, Abingdon, Oxon OX14 4RN, UK. ISBN: 9781138681521
  989. IPCC, 2018: Global Warming of 1.5° C: An IPCC Special Report on the Impacts of Global Warming of 1.5° C Above Pre-industrial Levels and Related Global Greenhouse Gas Emission Pathways, in the Context of Strengthening the Global Response to the Threat of Climate Change, Sustainable Development, and Efforts to Eradicate Poverty [Masson-Delmotte, V., P. Zhai, H.-O. Pörtner, D. Roberts, J. Skea, P.R. Shukla, A. Pirani, W. Moufouma-Okia, C. Péan, R. Pidcock, S. Connors, J.B.R. Matthews, Y. Chen, X. Zhou, M.I. Gomis, E. Lonnoy, T. Maycock, M. Tignor, and T. Waterfield (eds.)], in press
  990. Morchain, D., 2018: Rethinking the framing of climate change adaptation: knowledge, power, and politics. In: A Critical Approach to Climate Change Adaptation. Routledge, pp. 77–96. ISBN: 9781138056299
  991. Tozier de la Poterie, A. and M.-A. Baudoin, 2015: From Yokohama to Sendai: Approaches to Participation in International Disaster Risk Reduction Frameworks. Int. J. Disast. Risk Sci., 6(2), 128–139, doi:10.1007/s13753-015-0053-6.
  992. Mal, S., R.B. Singh, C. Huggel and A. Grover, 2018: Introducing Linkages Between Climate Change, Extreme Events, and Disaster Risk Reduction. In: Climate Change, Extreme Events and Disaster Risk Reduction: Towards Sustainable Development Goals [Mal, S., R.B. Singh and C. Huggel (eds.)]. Springer International Publishing, Cham, pp. 1–14. ISBN: 978-3-319-56468-5
  993. Field, C.B., V. Barros, T.F. Stocker and Q. Dahe, 2012: Managing the risks of extreme events and disasters to advance climate change adaptation: special report of the intergovernmental panel on climate change. Cambridge University Press. ISBN 978-1-107-02506-6.
  994. IPCC, 2012: Managing the Risks of Extreme Events and Disasters to Advance Climate Change Adaptation. A Special Report of Working Groups I and II of the Intergovernmental Panel on Climate Change. Cambridge University Press, Cambridge, UK, and New York, NY, USA, 582 pp. [Field, C.B., V. Barros, T.F. Stocker, D. Qin, D.J. Dokken, K.L. Ebi, M.D. Mastrandrea, K.J. Mach, G.-K. Plattner, S.K. Allen, M. Tignor, and P.M. Midgley (Eds.)]
  995. Devine-Wright, P., 2013: Think global, act local? The relevance of place attachments and place identities in a climate changed world. Global Environ. Change, 23(1), 61–69, doi:10.1016/j.gloenvcha.2012.08.003.
  996. Barnett, J. et al., 2014: A local coastal adaptation pathway. Nat. Clim. Change, 4(12), 1103–1108, doi:10.1038/Nclimate2383.
  997. Lyth, A., A. Harwood, A.J. Hobday and J. McDonald, 2016: Place influences in framing and understanding climate change adaptation challenges. Local Environment, 21(6), 730–751, doi:10.1080/13549839.2015.1015974.
  998. Barange, M. et al., 2018: Impacts of Climate Change on fisheries and aquaculture: Synthesis of current knowledge, adaptation and mitigation options. 627, FAO Fisheries Technical Paper, 654 pp. http://www.fao.org/3/I9705EN/i9705en.pdf. Accessed 2019/08/20.
  999. Field, C.B., V. Barros, T.F. Stocker and Q. Dahe, 2012: Managing the risks of extreme events and disasters to advance climate change adaptation: special report of the intergovernmental panel on climate change. Cambridge University Press. ISBN 978-1-107-02506-6.
  1000. IPCC, 2012: Managing the Risks of Extreme Events and Disasters to Advance Climate Change Adaptation. A Special Report of Working Groups I and II of the Intergovernmental Panel on Climate Change. Cambridge University Press, Cambridge, UK, and New York, NY, USA, 582 pp. [Field, C.B., V. Barros, T.F. Stocker, D. Qin, D.J. Dokken, K.L. Ebi, M.D. Mastrandrea, K.J. Mach, G.-K. Plattner, S.K. Allen, M. Tignor, and P.M. Midgley (Eds.)]
  1001. Tol, R.S.J. et al., 2006: Adaptation to five metres of sea level rise. J. Risk Res., 9(5), 467–482, doi:10.1080/13669870600717632.
  1002. Anthoff, D., R.J. Nicholls and R.S. Tol, 2010: The economic impact of substantial sea level rise. Mit. Adapt. Strat. Gl., 15(4), 321–335, doi:10.1007/s11027-010-9220-7.
  1003. Anthoff, D., F. Estrada and R.S.J. Tol, 2016: Shutting Down the Thermohaline Circulation. Am. Econ. Rev., 106(5), 602–606, doi:10.1257/aer.p20161102.
  1004. Weaver, C.P. et al., 2013: Improving the contribution of climate model information to decision making: the value and demands of robust decision frameworks. WiRes. Clim. Change, 4(1), 39–60, doi:10.1002/wcc.202.
  1005. Weaver, C.P. et al., 2013: Improving the contribution of climate model information to decision making: the value and demands of robust decision frameworks. WiRes. Clim. Change, 4(1), 39–60, doi:10.1002/wcc.202.
  1006. Ranger, N., T. Reeder and J. Lowe, 2013: Addressing ‘deep’uncertainty over long-term climate in major infrastructure projects: four innovations of the Thames Estuary 2100 Project. EURO Journal on Decision Processes, 1(3-4), 233–262, doi:10.1007/s40070-013-0014-5.
  1007. Haasnoot, M. et al., 2018: Mogelijke gevolgen van versnelde zeespiegelstijging voor het Deltaprogramma: een verkenning, Detares. Delft, Netherlands, 43 pp. http://www.deltacommissaris.nl/binaries/deltacommissaris/documenten/publicaties/2018/09/18/dp2019-b-rapport-deltares/DP2019+B+Rapport+Deltares.pdf. Accessed 2018/10/05.
  1008. Weaver, C.P. et al., 2013: Improving the contribution of climate model information to decision making: the value and demands of robust decision frameworks. WiRes. Clim. Change, 4(1), 39–60, doi:10.1002/wcc.202.
  1009. Haasnoot, M. et al., 2015: Transient scenarios for robust climate change adaptation illustrated for water management in The Netherlands. Environ. Res. Lett., 10(10), 105008, doi:10.1088/1748-9326/10/10/105008.
  1010. McNie, E.C., 2007: Reconciling the supply of scientific information with user demands: an analysis of the problem and review of the literature. Environ. Sci. Policy, 10(1), 17–38, doi:10.1016/j.envsci.2006.10.004.
  1011. Moser, S.C. and M.T. Boykoff, 2013: Successful adaptation to climate change: Linking science and policy in a rapidly changing world. Routledge, 2 Park Square, Milton Park, Abingdon, Oxon OX14 4RN, UK. ISBN: 9780415524995
  1012. Paton, D., 2007: Preparing for natural hazards: the role of community trust. Disaster Prevention and Management: An International Journal, 16(3), 370–379, doi:10.1108/09653560710758323.
  1013. Paton, D., 2008: Risk communication and natural hazard mitigation: how trust influences its effectiveness. IJGEnvI, 8(1–2), 2–16, doi:10.1504/IJGENVI.2008.017256.
  1014. Dilling, L. et al., 2015: The dynamics of vulnerability: why adapting to climate variability will not always prepare us for climate change. WiRes. Clim. Change, 6(4), 413–425, doi:10.1002/wcc.341.
  1015. IPCC, 2012: Managing the Risks of Extreme Events and Disasters to Advance Climate Change Adaptation. A Special Report of Working Groups I and II of the Intergovernmental Panel on Climate Change. Cambridge University Press, Cambridge, UK, and New York, NY, USA, 582 pp. [Field, C.B., V. Barros, T.F. Stocker, D. Qin, D.J. Dokken, K.L. Ebi, M.D. Mastrandrea, K.J. Mach, G.-K. Plattner, S.K. Allen, M. Tignor, and P.M. Midgley (Eds.)]
  1016. Hardin, R., 2002: Trust and trustworthiness. Russell Sage Foundation, New York, NY. ISBN: 978-1-61044-271-8
  1017. Townley, C. and J.L. Garfield, 2013: Public Trust. In: Trust: analytic and applied perspectives. Rodopi, Amsterdam, Netherlands, 263, 95-107. ISBN: 978-94-012-0941-0
  1018. Malka, A., J.A. Krosnick and G. Langer, 2009: The association of knowledge with concern about global warming: Trusted information sources shape public thinking. Risk Anal., 29(5), 633–647, doi:10.1111/j.1539-6924.2009.01220.x.
  1019. Birkmann, J., D.C. Seng and D.-C. Suarez, 2011: Adaptive Disaster Risk Reduction: Enhancing Methods and Tools of Disaster Risk Reduction in the light of Climate Change. DKKV, 52 pp. http://www.dkkv.org/fileadmin/user_upload/Veroeffentlichungen/Publikationen/DKKV_43_Adaptive_Disaster_Risk_Reduction.pdf. Accessed 2019/08/20.
  1020. Schoenefeld, J.J. and M.R. McCauley, 2016: Local is not always better: the impact of climate information on values, behavior and policy support. Journal of Environmental Studies and Sciences, 6(4), 724–732, doi:10.1007/s13412-015-0288-y.
  1021. Moser, S.C. and M.T. Boykoff, 2013: Successful adaptation to climate change: Linking science and policy in a rapidly changing world. Routledge, 2 Park Square, Milton Park, Abingdon, Oxon OX14 4RN, UK. ISBN: 9780415524995
  1022. Bråten, I., H.I. Strømsø and L. Salmerón, 2011: Trust and mistrust when students read multiple information sources about climate change. Learning and Instruction, 21(2), 180–192, doi:10.1016/j.learninstruc.2010.02.002.
  1023. Simpson, T.W., 2012: What is trust? Pac. Philos. Q., 93(4), 550–569, doi:10.1111/j.1468-0114.2012.01438.x.
  1024. Edmondson, B. and S. Levy, 2019: Transformative Climates and Accountable Governance. Palgrave Macmillan, Cham. ISBN: 978-3-319-97399-9
  1025. Edmondson, B. and S. Levy, 2019: Transformative Climates and Accountable Governance. Palgrave Macmillan, Cham. ISBN: 978-3-319-97399-9
  1026. Paton, D., 2007: Preparing for natural hazards: the role of community trust. Disaster Prevention and Management: An International Journal, 16(3), 370–379, doi:10.1108/09653560710758323.
  1027. Wallimann-Helmer, I., 2015: Justice for climate loss and damage. Clim. Change, 133(3), 469–480, doi:10.1007/s10584-015-1483-2.
  1028. Wallimann-Helmer, I., 2016: Differentiating responsibilities for climate change adaptation. Archiv für Rechts- und Sozialphilosphie (ARSP), 149, 119–132, doi:10.5167/uzh-112531.
  1029. Wallimann-Helmer, I. et al., 2019: The ethical challenges in the context of climate loss and damage. In: Loss and Damage from Climate Change. Springer Nature Switzerland AG. Gewerbestrasse 11, 6330 Cham, Switzerland, pp. 39-62. ISBN: 978-3-319-72025-8
  1030. Huggel, C. et al., 2019: Loss and Damage in the mountain cryosphere. Reg. Environ. Change, 19(5), 1387–1399, doi:10.1007/s10113-018-1385-8.
  1031. Mechler, R. et al., 2019: Loss and Damage from Climate Change: Concepts, Principles and Policy Options. Springer, Heidelberg, Germany. ISBN: 978-3-319-72025-8
  1032. Birkmann, J. and T. Welle, 2015: Assessing the risk of loss and damage: exposure, vulnerability and risk to climate-related hazards for different country classifications. Int. J. Global Warm., 8(2), 191–212, doi:10.1504/Ijgw.2015.071963.
  1033. Harrould-Kolieb, E.R. and O. Hoegh-Guldberg, 2019: A governing framework for international ocean acidification policy. Mar. Policy, 102, 10–20, doi:10.1016/j.marpol.2019.02.004.
  1034. Huggel, C. et al., 2019: Loss and Damage in the mountain cryosphere. Reg. Environ. Change, 19(5), 1387–1399, doi:10.1007/s10113-018-1385-8.
  1035. Surminski, S., L.M. Bouwer and J. Linnerooth-Bayer, 2016: How insurance can support climate resilience. Nat. Clim. Change, 6(4), 333–334, doi:10.1038/nclimate2979.
  1036. Linnerooth-Bayer, J. et al., 2019: Insurance as a response to Loss and Damage? In: Loss and Damage from Climate Change: Concepts, Principles and Policy Options [Mechler, R., L. Bower, J. Linnerooth-Bayer, T. Schinko and S. Surmiski (eds.)]. Springer, Heidelberg, Germany. [ISBN: 978-3-319-72025-8
  1037. Adelman, S., 2016: Climate justice, loss and damage and compensation for small island developing states. Journal of Human Rights and the Environment, 7(1), 32–53, doi:10.4337/jhre.2016.01.02.
  1038. Linnerooth-Bayer, J. et al., 2019: Insurance as a response to Loss and Damage? In: Loss and Damage from Climate Change: Concepts, Principles and Policy Options [Mechler, R., L. Bower, J. Linnerooth-Bayer, T. Schinko and S. Surmiski (eds.)]. Springer, Heidelberg, Germany. [ISBN: 978-3-319-72025-8
  1039. Botzen, W.J.W., 2013: Managing extreme climate change risks through insurance. Cambridge University Press, Cambridge CB2 8RU, UK ISBN: 978-1-107-03327-6
  1040. Kull, D., R. Mechler and S. Hochrainer‐Stigler, 2013: Probabilistic cost‐benefit analysis of disaster risk management in a development context. Disasters, 37(3), 374–400, doi:10.1111/disa.12002.
  1041. Mechler, R., 2016: Reviewing estimates of the economic efficiency of disaster risk management: opportunities and limitations of using risk-based cost–benefit analysis. Nat. Hazards, 81(3), 2121–2147, doi:10.1007/s11069-016-2170-y.
  1042. Pappenberger, F. et al., 2015: The monetary benefit of early flood warnings in Europe. Environ. Sci. Policy, 51, 278–291, doi:10.1016/j.envsci.2015.04.016.
  1043. Davlasheridze, M., K. Fisher-Vanden and H. A. Klaiber, 2017: The effects of adaptation measures on hurricane induced property losses: Which FEMA investments have the highest returns? Journal of Environmental Economics and Management, 81, 93–114, doi: 10.1016/j.jeem.2016.09.005.
  1044. Watson, K.B. et al., 2016: Quantifying flood mitigation services: The economic value of Otter Creek wetlands and floodplains to Middlebury, VT. Ecol. Econ., 130, 16–24, doi:10.1016/j.ecolecon.2016.05.015.
  1045. Costanza, R. et al., 2008: The value of coastal wetlands for hurricane protection. AMBIO, 37(4), 241–248, doi:10.1579/0044-7447(2008)37[241:TVOCWF]2.0.CO;2.
  1046. Vousdoukas, M.I. et al., 2018: Climatic and socioeconomic controls of future coastal flood risk in Europe. Nat. Clim. Change, 8(9), 776–780, doi:10.1038/s41558-018-0260-4.
  1047. Mechler, R., 2016: Reviewing estimates of the economic efficiency of disaster risk management: opportunities and limitations of using risk-based cost–benefit analysis. Nat. Hazards, 81(3), 2121–2147, doi:10.1007/s11069-016-2170-y.
  1048. Smit, B. et al., 2001: Adaptation to climate change in the context of sustainable development and equity. In: Climate Change 2001: Impacts, Adaptation and Vulnerability. Contribution of Working Group II to the Third Assessment Report of the Intergovernmental Panel on Climate Change [McCarthy, J.J., O.F. Canziani, N.A. Leary, D.J. Dokken, and K.S. White, (eds)]. Cambridge University Press, UK, Cambridge, 877-912.
  1049. Patterson, J.J. et al., 2018: Political feasibility of 1.5° C societal transformations: the role of social justice. Curr. Opin. Env. Sust., 31, 1–9, doi:10.1016/j.cosust.2017.11.002.
  1050. Young, O.R., 2002: The institutional dimensions of environmental change: fit, interplay, and scale. The MIT Press. One Rogers Street, Cambridge, MA, USA. ISBN: 9780262240437
  1051. Plummer, R. et al., 2017: Is adaptive co-management delivering? Examining relationships between collaboration, learning and outcomes in UNESCO biosphere reserves. Ecol. Econ., 140, 79–88, doi:10.1016/j.ecolecon.2017.04.028.
  1052. IPCC, 2013: Climate Change 2013: The Physical Science Basis. Contribution of Working Group I to the Fifth Assessment Report of the Intergovernmental Panel on Climate Change [Stocker, T.F., D. Qin, G.-K. Plattner, M. Tignor, S.K. Allen, J. Boschung, A. Nauels, Y. Xia, V. Bex and P.M. Midgley (eds.)]. Cambridge University Press, Cambridge, United Kingdom and New York, NY, USA, 1535 pp.
  1053. Patterson, J.J. et al., 2018: Political feasibility of 1.5° C societal transformations: the role of social justice. Curr. Opin. Env. Sust., 31, 1–9, doi:10.1016/j.cosust.2017.11.002.
  1054. Fleurbaey, M. et al., 2014: Sustainable development and equity. In: Climate Change 2014: Mitigation of climate change. Contribution of Working Group III to the Fifth Assessment Report of the Intergovernmental Panel on Climate Change [Edenhofer, O., R. Pichs-Madruga, Y. Sokona, E. Farahani, S. Kadner, K. Seyboth, A. Adler, I. Baum, S. Brunner, P. Eickemeier, B. Kriemann, J. Savolainen, S. Schlömer, C. von Stechow, T. Zwickel and J.C. Minx (eds.)]. Cambridge University Press, Cambridge, United Kingdom and New York, NY, USA, 283-350.
  1055. Tàbara, J.D., J. Jäger, D. Mangalagiu and M. Grasso, 2019: Defining transformative climate science to address high-end climate change. Reg. Environ. Change, 19(3), 807–818, doi:10.1007/s10113-018-1288-8.
  1056. Kates, R.W., W.R. Travis and T.J. Wilbanks, 2012: Transformational adaptation when incremental adaptations to climate change are insufficient. PNAS, 109(19), 7156–7161, doi:10.1073/pnas.1115521109.
  1057. McAdam, J., 2011: Swimming against the tide: why a climate change displacement treaty is not the answer. Int. J. Refug. Law, 23(1), 2–27, doi:10.1093/ijrl/eeq045.
  1058. Matthews, T. and R. Potts, 2018: Planning for climigration: a framework for effective action. Clim. Change, 148(4), 607–621, doi:10.1007/s10584-018-2205-3.
  1059. Hino, M., C.B. Field and K.J. Mach, 2017: Managed retreat as a response to natural hazard risk. Nat. Clim. Change, 7(5), 364–370, doi:10.1038/Nclimate3252.
  1060. Gemenne, F., 2015: One good reason to speak of ‘climate refugees’. Forced Migration Review, 49, 70–71.
  1061. Farbotko, C. and H. Lazrus, 2012: The first climate refugees? Contesting global narratives of climate change in Tuvalu. Global Environ. Change, 22 (2), 382–390, doi:10.1016/j.gloenvcha.2011.11.014.
  1062. Hilhorst, D., J. Baart, G. van der Haar and F.M. Leeftink, 2015: Is disaster “normal” for indigenous people? Indigenous knowledge and coping practices. Disaster Prevention and Management: An International Journal, 24(4), 506–522, doi:10.1108/DPM-02-2015-0027.
  1063. Tharakan, J., 2015: Indigenous knowledge systems–A rich appropriate technology resource. African journal of science, technology, innovation and development, 7(1), 52–57, doi:10.1080/20421338.2014.987987.
  1064. Iloka, N.G., 2016: Indigenous knowledge for disaster risk reduction: An African perspective. Jàmbá: Journal of Disaster Risk Studies, 8(1), 1–7, doi:10.4102/jamba.v8i1.272.
  1065. Nunn, P.D. et al., 2016: Spirituality and attitudes towards Nature in the Pacific Islands: insights for enabling climate-change adaptation. Clim. Change, 136(3–4), 477–493, doi:10.1007/s10584-016-1646-9.
  1066. Edmondson, B. and S. Levy, 2019: Transformative Climates and Accountable Governance. Palgrave Macmillan, Cham. ISBN: 978-3-319-97399-9
  1067. Burch, S., A. Shaw, A. Dale and J. Robinson, 2014: Triggering transformative change: a development path approach to climate change response in communities. Climate Policy, 14(4), 467–487, doi:10.1080/14693062.2014.876342.
  1068. Mayhorn, C.B. and A.C. McLaughlin, 2014: Warning the world of extreme events: A global perspective on risk communication for natural and technological disaster. Saf. Sci., 61, 43–50, doi:10.1016/j.ssci.2012.04.014.
  1069. Zommers, Z. et al., 2017: Early Warning Systems for Disaster Risk Reduction Including Climate Change Adaptation. In: The Routledge Handbook of Disaster Risk Reduction Including Climate Change Adaptation [Kelman, I., J. Mercer and J.C. Gaillard (eds.)], London, pp. 428–443. ISBN: 9781315684260
  1070. Nalau, J. et al., 2016: The practice of integrating adaptation and disaster risk reduction in the south-west Pacific. Clim. Dev., 8(4), 365–375, doi:10.1080/17565529.2015.1064809.
  1071. Banwell, N., S. Rutherford, B. Mackey and C. Chu, 2018: Towards Improved Linkage of Disaster Risk Reduction and Climate Change Adaptation in Health: A Review. Int. J. Environ. Res. Public Health, 15(4), 793, doi:10.3390/ijerph15040793.
  1072. Shimizu, M. and A.L. Clark, 2015: Interconnected risks, cascading disasters and disaster management policy: a gap analysis. Planet@ Risk, 3(2), Global Risk Forum GRF Davos, Promenade 35, CH-7270 Davos Platz, Switzerland 260–270. ISSN 2296-8172
  1073. Ulrichs, M., R. Slater and C. Costella, 2019: Building resilience to climate risks through social protection: from individualised models to systemic transformation. Disasters, 43(S3), S368–S387, doi:10.1111/disa.12339.
  1074. Seidler, R. et al., 2018: Progress on integrating climate change adaptation and disaster risk reduction for sustainable development pathways in South Asia: Evidence from six research projects. Int. J. Disast. Risk Re., 31, 92–101, doi:10.1016/j.ijdrr.2018.04.023.
  1075. Jones, L. et al., 2017: Constraining and enabling factors to using long-term climate information in decision-making. Climate Policy, 17(5), 551–572, doi:10.1080/14693062.2016.1191008.
  1076. Putra, M.I.S., W. Widodo, B. Jatmiko and M. Mundilarto, 2018: The effectiveness of project based learning model to improve vocational skills on the vocational high school students. Unnes Science Education Journal, 7(1), 35–49, doi:10.15294/usej.v7i1.19536.
  1077. Forino, G., J. von Meding, G. Brewer and D. van Niekerk, 2017: Climate Change Adaptation and Disaster Risk reduction integration: Strategies, Policies, and Plans in three Australian Local Governments. Int. J. Disast. Risk Re., 24, 100–108, doi:10.1016/j.ijdrr.2017.05.021.
  1078. Rivera, C. and C. Wamsler, 2014: Integrating climate change adaptation, disaster risk reduction and urban planning: A review of Nicaraguan policies and regulations. Int. J. Disast. Risk Re., 7, 78–90, doi:10.1016/j.ijdrr.2013.12.008.
  1079. Hemstock, S.L. et al., 2017: A case for formal education in the Technical, Vocational Education and Training (TVET) sector for climate change adaptation and disaster risk reduction in the Pacific Islands region. In: Climate Change Adaptation in Pacific Countries. Springer Nature. Gewerbestrasse 11, 6330 Cham, Switzerland, 309-324. ISBN: 978-3-319-50093-5
  1080. Nemakonde, L.D. and D. Van Niekerk, 2017: A normative model for integrating organisations for disaster risk reduction and climate change adaptation within SADC member states. Disaster Prevention and Management: An International Journal, 26(3), 361–376, doi:10.1108/Dpm-03-2017-0066.
  1081. Nalau, J., J. Handmer and M. Dalesa, 2017: The Role and Capacity of Government in a Climate Crisis: Cyclone Pam in Vanuatu. In: Climate Change Adaptation in Pacific Countries. Springer Nature. Gewerbestrasse 11, 6330 Cham, Switzerland, pp. 151–161. ISBN: 978-3-319-50093-5
  1082. Schipper, E.L.F. et al., 2016: Linking disaster risk reduction, climate change and development. International Journal of Disaster Resilience in the Built Environment, 7(2), 216–228, doi:10.1108/Ijdrbe-03-2015-0014.
  1083. Organization of American States, 2014: Mainstreaming disaster risk reduction and adaptation to climate change. Department of Sustainable Development, Executive Secretariat for Integral Development, Washington, D.C., 39pp [Available at: http://www.oas.org/legal/english/gensec/exor1604_annex_a.pdf%5D.
  1084. APEC, 2016: Disaster Risk Reduction Action Plan. 10th Senior Disaster Management Officials Forum, Iquitos, Peru, Asia-Pacific Economic Cooperation. Singapore, 15pp. Available at: http://www.apec-epwg.org/public/uploadfile/act/d20829852d84ae1cb0aba86b475e8f82.pdf Accessed 2018/10/13.
  1085. Bell, R. et al., 2017: Coastal hazards and climate change: Guidance for local government. Wellington, New Zealand. Published in December 2017 by the Ministry for the Environment, Manatū Mō Te Taiao, PO Box 10362, Wellington 6143, New Zealand ISBN: 978-1-98-852535-8
  1086. Hilhorst, D., J. Baart, G. van der Haar and F.M. Leeftink, 2015: Is disaster “normal” for indigenous people? Indigenous knowledge and coping practices. Disaster Prevention and Management: An International Journal, 24(4), 506–522, doi:10.1108/DPM-02-2015-0027.
  1087. Tharakan, J., 2015: Indigenous knowledge systems–A rich appropriate technology resource. African journal of science, technology, innovation and development, 7(1), 52–57, doi:10.1080/20421338.2014.987987.
  1088. Iloka, N.G., 2016: Indigenous knowledge for disaster risk reduction: An African perspective. Jàmbá: Journal of Disaster Risk Studies, 8(1), 1–7, doi:10.4102/jamba.v8i1.272.
  1089. Nunn, P.D. et al., 2016: Spirituality and attitudes towards Nature in the Pacific Islands: insights for enabling climate-change adaptation. Clim. Change, 136(3–4), 477–493, doi:10.1007/s10584-016-1646-9.
  1090. UNISDR, 2015: Sendai framework for disaster risk reduction 2015-2030. World Conference on Disaster Risk Reduction, Sendai, Japan, 37 pp. http://www.unisdr.org/we/inform/publications/43291. Accessed 2019/20/08.
  1091. González-Riancho, P., B. Gerkensmeier and B.M. Ratter, 2017: Storm surge resilience and the Sendai Framework: Risk perception, intention to prepare and enhanced collaboration along the German North Sea coast. Ocean. Coast. Manage., 141, 118–131, doi:10.1016/j.ocecoaman.2017.03.006.
  1092. Pal, I., T. Ghosh and C. Ghosh, 2017: Institutional framework and administrative systems for effective disaster risk governance – Perspectives of 2013 Cyclone Phailin in India. Int. J. Disast. Risk Re., 21, 350–359, doi:10.1016/j.ijdrr.2017.01.002.

Integrative Cross-Chapter Box on Low-lying Islands and Coasts