This Special Report on the Ocean and Cryosphere1 in a Changing Climate (SROCC) was prepared following an IPCC Panel decision in 2016 to prepare three Special Reports during the Sixth Assessment Cycle2. By assessing new scientific literature3, the SROCC4 responds to government and observer organization proposals. The SROCC follows the other two Special Reports on Global Warming of 1.5°C (SR1.5) and on Climate Change and Land (SRCCL)5 and the Intergovernmental Science Policy Platform on Biodiversity and Ecosystem Services (IPBES) Global Assessment Report on Biodiversity and Ecosystem Services.
This Summary for Policymakers (SPM) compiles key findings of the report and is structured in three parts: SPM.A: Observed Changes and Impacts, SPM.B: Projected Changes and Risks, and SPM.C: Implementing Responses to Ocean and Cryosphere Change. To assist navigation of the SPM, icons indicate where content can be found. Confidence in key findings is reported using IPCC calibrated language6 and the underlying scientific basis for each key finding is indicated by references to sections of the underlying report.
Key of icons to indicate content
A
Observed changes and impacts
Share
Observed Physical Changes
A.1. Over the last decades, global warming has led to widespread shrinking of the cryosphere, with mass loss from ice sheets and glaciers (veryhighconfidence), reductions in snow cover (high confidence) and Arctic sea ice extent and thickness (veryhighconfidence), and increased permafrost temperature (very high confidence). {2.2, 3.2, 3.3, 3.4, Figures SPM.1, SPM.2}
A.1.1 Ice sheets and glaciers worldwide have lost mass (very high confidence). Between 2006 and 2015, the Greenland Ice Sheet9 lost ice mass at an average rate of 278 ± 11 Gt yr–1 (equivalent to 0.77 ± 0.03 mm yr–1 of global sea level rise)10, mostly due to surface melting (high confidence). In 2006–2015, the Antarctic Ice Sheet lost mass at an average rate of 155 ± 19 Gt yr–1 (0.43 ± 0.05 mm yr–1), mostly due to rapid thinning and retreat of major outlet glaciers draining the West Antarctic Ice Sheet (very high confidence). Glaciers worldwide outside Greenland and Antarctica lost mass at an average rate of 220 ± 30 Gt yr–1 (equivalent to 0.61 ± 0.08 mm yr–1 sea level rise) in 2006–2015. {3.3.1, 4.2.3, Appendix 2.A, Figure SPM.1}
A.1.2 Arctic June snow cover extent on land declined by 13.4 ± 5.4% per decade from 1967 to 2018, a total loss of approximately 2.5 million km2, predominantly due to surface air temperature increase (high confidence). In nearly all high mountain areas, the depth, extent and duration of snow cover have declined over recent decades, especially at lower elevation (high confidence). {2.2.2, 3.4.1, Figure SPM.1}
A.1.3 Permafrost temperatures have increased to record high levels (1980s-present) (very high confidence) including the recent increase by 0.29°C ± 0.12°C from 2007 to 2016 averaged across polar and high-mountain regions globally. Arctic and boreal permafrost contain 1460–1600 Gt organic carbon, almost twice the carbon in the atmosphere (medium confidence). There is mediumevidence with lowagreement whether northern permafrost regions are currently releasing additional net methane and CO2 due to thaw. Permafrost thaw and glacier retreat have decreased the stability of high-mountain slopes (high confidence). {2.2.4, 2.3.2, 3.4.1, 3.4.3, Figure SPM.1}
A.1.4 Between 1979 and 2018, Arctic sea ice extent has very likely decreased for all months of the year. September sea ice reductions are very likely 12.8 ± 2.3% per decade. These sea ice changes in September are likely unprecedented for at least 1000 years. Arctic sea ice has thinned, concurrent with a transition to younger ice: between 1979 and 2018, the areal proportion of multi-year ice at least five years old has declined by approximately 90% (very high confidence). Feedbacks from the loss of summer sea ice and spring snow cover on land have contributed to amplified warming in the Arctic (high confidence) where surface air temperature likely increased by more than double the global average over the last two decades. Changes in Arctic sea ice have the potential to influence mid-latitude weather (medium confidence), but there is lowconfidence in the detection of this influence for specific weather types. Antarctic sea ice extent overall has had no statistically significant trend (1979–2018) due to contrasting regional signals and large interannual variability (high confidence). {3.2.1, 6.3.1, Box 3.1, Box 3.2, SPM A.1.2, Figures SPM.1, SPM.2}
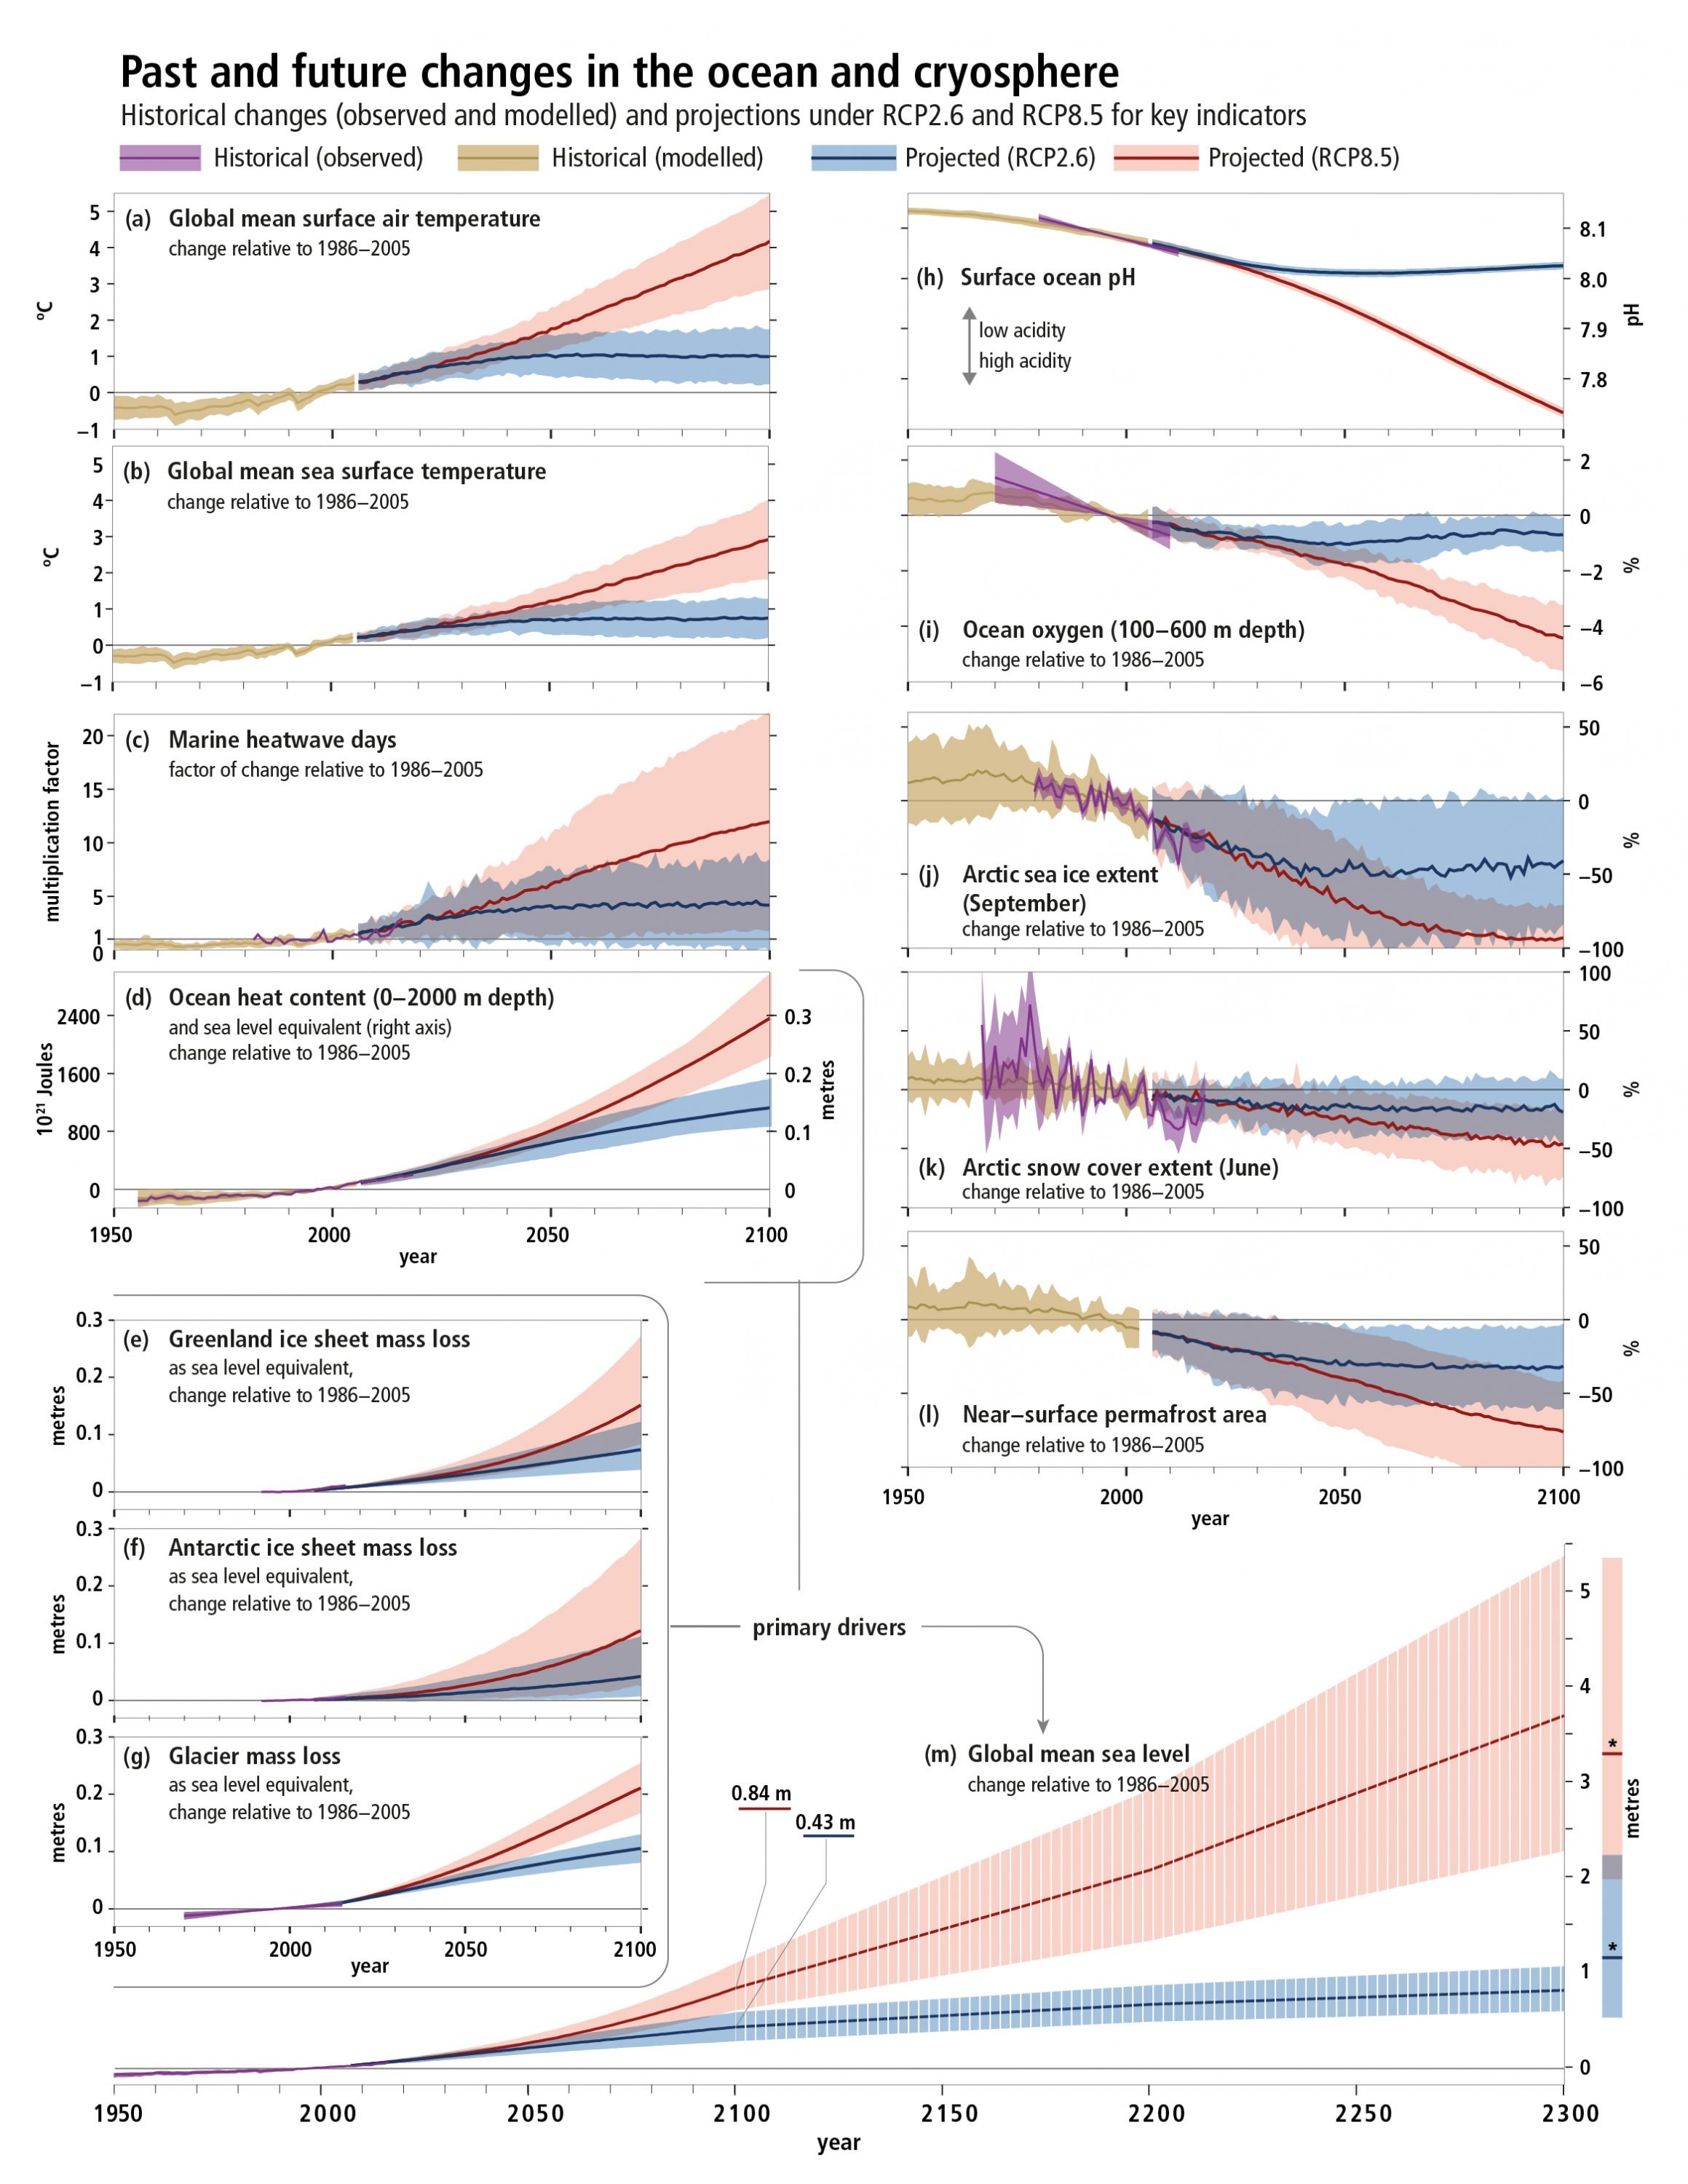
Figure SPM.1 | Observed and modelled historical changes in the ocean and cryosphere since 1950, and projected future changes under low (RCP2.6) and high (RCP8.5) greenhouse gas emissions scenarios. {Box SPM.1} Changes are shown for: (a) Global mean surface air temperature change with likely range. {Box SPM.1, Cross-Chapter Box 1 in Chapter 1} Ocean-related changes […]
Figure SPM.1 | Observed and modelled historical changes in the ocean and cryosphere since 195011, and projected future changes under low (RCP2.6) and high (RCP8.5) greenhouse gas emissions scenarios. {Box SPM.1} Changes are shown for: (a) Global mean surface air temperature change with likely range. {Box SPM.1, Cross-Chapter Box 1 in Chapter 1} Ocean-related changes with very likely ranges for (b) Global mean sea surface temperature change {Box 5.1, 5.2.2}; (c) Change factor in surface ocean marine heatwave days {6.4.1}; (d) Global ocean heat content change (0–2000 m depth). An approximate steric sea level equivalent is shown with the right axis by multiplying the ocean heat content by the global-mean thermal expansion coefficient (ε ≈ 0.125 m per 1024 Joules)12 for observed warming since 1970 {Figure 5.1}; (h) Global mean surface pH (on the total scale). Assessed observational trends are compiled from open ocean time series sites longer than 15 years {Box 5.1, Figure 5.6, 5.2.2}; and (i) Global mean ocean oxygen change (100–600 m depth). Assessed observational trends span 1970–2010 centered on 1996 {Figure 5.8, 5.2.2}. Sea level changes with likely ranges for (m) Global mean sea level change. Hashed shading reflects low confidence in sea level projections beyond 2100 and bars at 2300 reflect expert elicitation on the range of possible sea level change {4.2.3, Figure 4.2}; and components from (e,f) Greenland and Antarctic ice sheet mass loss {3.3.1}; and (g) Glacier mass loss {Cross-Chapter Box 6 in Chapter 2, Table 4.1}. Further cryosphere-related changes with very likely ranges for (j) Arctic sea ice extent change for September13 {3.2.1, 3.2.2 Figure 3.3}; (k) Arctic snow cover change for June (land areas north of 60oN) {3.4.1, 3.4.2, Figure 3.10}; and (l) Change in near-surface (within 3–4 m) permafrost area in the Northern Hemisphere {3.4.1, 3.4.2, Figure 3.10}. Assessments of projected changes under the intermediate RCP4.5 and RCP6.0 scenarios are not available for all variables considered here, but where available can be found in the underlying report. {For RCP4.5 see: 2.2.2, Cross-Chapter Box 6 in Chapter 2, 3.2.2, 3.4.2, 4.2.3, for RCP6.0 see Cross-Chapter Box 1 in Chapter 1}
A.2. It is virtually certain that the global ocean has warmed unabated since 1970 and has taken up more than 90% of the excess heat in the climate system (high confidence). Since 1993, the rate of ocean warming has more than doubled (likely). Marine heatwaves have very likely doubled in frequency since 1982 and are increasing in intensity (very high confidence). By absorbing more CO2, the ocean has undergone increasing surface acidification (virtually certain). A loss of oxygen has occurred from the surface to 1000 m (medium confidence). {1.4, 3.2, 5.2, 6.4, 6.7, Figures SPM.1, SPM.2}
A.2.1The ocean warming trend documented in the IPCC Fifth Assessment Report (AR5) has continued. Since 1993 the rate of ocean warming and thus heat uptake has more than doubled (likely) from 3.22 ± 1.61 ZJ yr–1 (0–700 m depth) and 0.97 ± 0.64 ZJ yr–1 (700–2000 m) between 1969 and 1993, to 6.28 ± 0.48 ZJ yr–1 (0–700 m) and 3.86 ± 2.09 ZJ yr–1 (700–2000 m) between 1993 and 201717, and is attributed to anthropogenic forcing (very likely). {1.4.1, 5.2.2, Table 5.1, Figure SPM.1}
A.2.2 The Southern Ocean accounted for 35–43% of the total heat gain in the upper 2000 m global ocean between 1970 and 2017 (high confidence). Its share increased to 45–62% between 2005 and 2017 (high confidence). The deep ocean below 2000 m has warmed since 1992 (likely), especially in the Southern Ocean. {1.4, 3.2.1, 5.2.2, Table 5.1, Figure SPM.2}
A.2.3 Globally, marine heat-related events have increased; marine heatwaves18, defined when the daily sea surface temperature exceeds the local 99th percentile over the period 1982 to 2016, have doubled in frequency and have become longer-lasting, more intense and more extensive (very likely). It is very likely that between 84–90% of marine heatwaves that occurred between 2006 and 2015 are attributable to the anthropogenic temperature increase. {Table 6.2, 6.4, Figures SPM.1, SPM.2}
A.2.4Density stratification19 has increased in the upper 200 m of the ocean since 1970 (very likely). Observed surface ocean warming and high latitude addition of freshwater are making the surface ocean less dense relative to deeper parts of the ocean (high confidence) and inhibiting mixing between surface and deeper waters (high confidence). The mean stratification of the upper 200 m has increased by 2.3 ± 0.1% (very likely range) from the 1971–1990 average to the 1998–2017 average. {5.2.2}
A.2.5 The ocean has taken up between 20–30% (very likely) of total anthropogenic CO2 emissions since the 1980s causing further ocean acidification. Open ocean surface pH has declined by avery likelyrange of0.017–0.027 pH units per decade since the late 1980s20, with the decline in surface ocean pH very likely to have already emerged from background natural variability for more than 95% of the ocean surface area. {3.2.1, 5.2.2, Box 5.1, Figures SPM.1, SPM.2}
A.2.6 Datasets spanning 1970–2010 show that the open ocean has lost oxygen by a very likely range of 0.5–3.3% over the upper 1000 m, alongside a likely expansion of the volume of oxygen minimum zones by 3–8% (medium confidence). Oxygen loss is primarily due to increasing ocean stratification, changing ventilation and biogeochemistry (high confidence). {5.2.2, Figures SPM.1, SPM.2}
A.2.7 Observations, both in situ (2004–2017) and based on sea surface temperature reconstructions, indicate that the Atlantic Meridional Overturning Circulation (AMOC)21 has weakened relative to 1850–1900 (medium confidence). There is insufficient data to quantify the magnitude of the weakening, or to properly attribute it to anthropogenic forcing due to the limited length of the observational record. Although attribution is currently not possible, CMIP5 model simulations of the period 1850–2015, on average, exhibit a weakening AMOC when driven by anthropogenic forcing. {6.7}
A.3. Global mean sea level (GMSL) is rising, with acceleration in recent decades due to increasing rates of ice loss from the Greenland and Antarctic ice sheets (veryhigh confidence), as well as continued glacier mass loss and ocean thermal expansion. Increases in tropical cyclone winds and rainfall, and increases in extreme waves, combined with relative sea level rise, exacerbate extreme sea level events and coastal hazards (high confidence). {3.3, 4.2, 6.2, 6.3, 6.8, Figures SPM.1, SPM.2, SPM.4, SPM.5}
A.3.1 Total GMSL rise for 1902–2015 is 0.16 m (likely range 0.12–0.21 m). The rate of GMSL rise for 2006–2015 of 3.6 mm yr–1 (3.1–4.1 mm yr–1, very likely range), is unprecedented over the last century (high confidence), and about 2.5 times the rate for 1901–1990 of 1.4 mm yr–1 (0.8– 2.0 mm yr–1, very likely range). The sum of ice sheet and glacier contributions over the period 2006–2015 is the dominant source of sea level rise (1.8 mm yr–1, very likely range 1.7–1.9 mm yr–1), exceeding the effect of thermal expansion of ocean water (1.4 mm yr–1, very likely range 1.1–1.7 mm yr–1)22(very high confidence). The dominant cause of global mean sea level rise since 1970 is anthropogenic forcing (high confidence). {4.2.1, 4.2.2, Figure SPM.1}
A.3.2 Sea level rise has accelerated (extremely likely) due to the combined increased ice loss from the Greenland and Antarctic ice sheets (very high confidence). Mass loss from the Antarctic ice sheet over the period 2007–2016 tripled relative to 1997–2006. For Greenland, mass loss doubled over the same period (likely, medium confidence). {3.3.1, Figures SPM.1, SPM.2, SPM A1.1}
A.3.3 Acceleration of ice flow and retreat in Antarctica, which has the potential to lead to sea level rise of several metres within a few centuries, is observed in the Amundsen Sea Embayment of West Antarctica and in Wilkes Land, East Antarctica (very high confidence). These changes may be the onset of an irreversible23 ice sheet instability. Uncertainty related to the onset of ice sheet instability arises from limited observations, inadequate model representation of ice sheet processes, and limited understanding of the complex interactions between the atmosphere, ocean and the ice sheet. {3.3.1, Cross-Chapter Box 8 in Chapter 3, 4.2.3}
A.3.4 Sea level rise is not globally uniform and varies regionally. Regional differences, within ±30% of the global mean sea level rise, result from land ice loss and variations in ocean warming and circulation. Differences from the global mean can be greater in areas of rapid vertical land movement including from local human activities (e.g. extraction of groundwater). (high confidence) {4.2.2, 5.2.2, 6.2.2, 6.3.1, 6.8.2, Figure SPM.2}
A.3.5 Extreme wave heights, which contribute to extreme sea level events, coastal erosion and flooding, have increased in the Southern and North Atlantic Oceans by around 1.0 cm yr–1 and 0.8 cm yr–1 over the period 1985–2018 (medium confidence). Sea ice loss in the Arctic has also increased wave heights over the period 1992–2014 (medium confidence). {4.2.2, 6.2, 6.3, 6.8, Box 6.1}
A.3.6 Anthropogenic climate change has increased observed precipitation (medium confidence), winds (low confidence), and extreme sea level events (high confidence) associated with some tropical cyclones, which has increased intensity of multiple extreme events and associated cascading impacts (high confidence). Anthropogenic climate change may have contributed to a poleward migration of maximum tropical cyclone intensity in the western North Pacific in recent decades related to anthropogenically-forced tropical expansion (low confidence). There is emerging evidence for an increase in annual global proportion of Category 4 or 5 tropical cyclones in recent decades (low confidence). {6.2, Table 6.2, 6.3, 6.8, Box 6.1}
Observed Impacts on Ecosystems
A.4. Cryospheric and associated hydrological changes have impacted terrestrial and freshwater species and ecosystems in high mountain and polar regions through the appearance of land previously covered by ice, changes in snow cover, and thawing permafrost. These changes have contributed to changing the seasonal activities, abundance and distribution of ecologically, culturally, and economically important plant and animal species, ecological disturbances, and ecosystem functioning. (high confidence) {2.3.2, 2.3.3, 3.4.1, 3.4.3, Box 3.4, Figure SPM.2}
A.4.1 Over the last century some species of plants and animals have increased in abundance, shifted their range, and established in new areas as glaciers receded and the snow-free season lengthened (high confidence). Together with warming, these changes have increased locally the number of species in high mountains, as lower-elevation species migrate upslope (very high confidence). Some cold-adapted or snow-dependent species have declined in abundance, increasing their risk of extinction, notably on mountain summits (high confidence). In polar and mountain regions, many species have altered seasonal activities especially in late winter and spring (high confidence). {2.3.3, Box 3.4}
A.4.2 Increased wildfire and abrupt permafrost thaw, as well as changes in Arctic and mountain hydrology have altered frequency and intensity of ecosystem disturbances (high confidence). This has included positive and negative impacts on vegetation and wildlife such as reindeer and salmon (high confidence). {2.3.3, 3.4.1, 3.4.3}
A.4.3 Across tundra, satellite observations show an overall greening, often indicative of increased plant productivity (high confidence). Some browning areas in tundra and boreal forest are indicative that productivity has decreased (high confidence). These changes have negatively affected provisioning, regulating and cultural ecosystem services, with also some transient positive impacts for provisioning services, in both high mountains (medium confidence) and polar regions (high confidence). {2.3.1, 2.3.3, 3.4.1, 3.4.3, Annex I: Glossary}
A.5. Since about 1950 many marine species across various groups have undergone shifts in geographical range and seasonal activities in response to ocean warming, sea ice change and biogeochemical changes, such as oxygen loss, to their habitats (high confidence). This has resulted in shifts in species composition, abundance and biomass production of ecosystems, from the equator to the poles. Altered interactions between species have caused cascading impacts on ecosystem structure and functioning (medium confidence). In some marine ecosystems species are impacted by both the effects of fishing and climate changes (medium confidence). {3.2.3, 3.2.4, Box 3.4, 5.2.3, 5.3, 5.4.1, Figure SPM.2}
A.5.1 Rates of poleward shifts in distributions across different marine species since the 1950s are 52 ± 33 km per decade and 29 ± 16 km per decade (very likely ranges) for organisms in the epipelagic (upper 200 m from sea surface) and seafloor ecosystems, respectively. The rate and direction of observed shifts in distributions are shaped by local temperature, oxygen, and ocean currents across depth, latitudinal and longitudinal gradients (high confidence). Warming-induced species range expansions have led to altered ecosystem structure and functioning such as in the North Atlantic, Northeast Pacific and Arctic (medium confidence). {5.2.3, 5.3.2, 5.3.6, Box 3.4, Figure SPM.2}
A.5.2 In recent decades, Arctic net primary production has increased in ice-free waters (high confidence) and spring phytoplankton blooms are occurring earlier in the year in response to sea ice change and nutrient availability with spatially variable positive and negative consequences for marine ecosystems (medium confidence). In the Antarctic, such changes are spatially heterogeneous and have been associated with rapid local environmental change, including retreating glaciers and sea ice change (medium confidence). Changes in the seasonal activities, production and distribution of some Arctic zooplankton and a southward shift in the distribution of the Antarctic krill population in the South Atlantic are associated with climate-linked environmental changes (medium confidence). In polar regions, ice associated marine mammals and seabirds have experienced habitat contraction linked to sea ice changes (high confidence) and impacts on foraging success due to climate impacts on prey distributions (medium confidence).Cascading effects of multiple climate-related drivers on polar zooplankton have affected food web structure and function, biodiversity as well as fisheries (high confidence). {3.2.3, 3.2.4, Box 3.4, 5.2.3, Figure SPM.2}
A.5.3 Eastern Boundary Upwelling Systems (EBUS) are amongst the most productive ocean ecosystems. Increasing ocean acidification and oxygen loss are negatively impacting two of the four major upwelling systems: the California Current and Humboldt Current (high confidence). Ocean acidification and decrease in oxygen level in the California Current upwelling system have altered ecosystem structure, with direct negative impacts on biomass production and species composition (medium confidence). {Box 5.3, Figure SPM.2}
A.5.4 Ocean warming in the 20th century and beyond has contributed to an overall decrease in maximum catch potential (medium confidence), compounding the impacts from overfishing for some fish stocks (high confidence). In many regions, declines in the abundance of fish and shellfish stocks due to direct and indirect effects of global warming and biogeochemical changes have already contributed to reduced fisheries catches (high confidence). In some areas, changing ocean conditions have contributed to the expansion of suitable habitat and/or increases in the abundance of some species (high confidence). These changes have been accompanied by changes in species composition of fisheries catches since the 1970s in many ecosystems (medium confidence). {3.2.3, 5.4.1, Figure SPM.2}
A.6. Coastal ecosystems are affected by ocean warming, including intensified marine heatwaves, acidification, loss of oxygen, salinity intrusion and sea level rise, in combination with adverse effects from human activities on ocean and land (high confidence). Impacts are already observed on habitat area and biodiversity, as well as ecosystem functioning and services (high confidence). {4.3.2, 4.3.3, 5.3, 5.4.1, 6.4.2, Figure SPM.2}
A.6.1 Vegetated coastal ecosystems protect the coastline from storms and erosion and help buffer the impacts of sea level rise. Nearly 50% of coastal wetlands have been lost over the last 100 years, as a result of the combined effects of localised human pressures, sea level rise, warming and extreme climate events (high confidence). Vegetated coastal ecosystems are important carbon stores; their loss is responsible for the current release of 0.04–1.46 GtC yr–1 (mediumconfidence). In response to warming, distribution ranges of seagrass meadows and kelp forests are expanding at high latitudes and contracting at low latitudes since the late 1970s (high confidence), and in some areas episodic losses occur following heatwaves (medium confidence). Large-scale mangrove mortality that is related to warming since the 1960s has been partially offset by their encroachment into subtropical saltmarshes as a result of increase in temperature, causing the loss of open areas with herbaceous plants that provide food and habitat for dependent fauna (high confidence). {4.3.3, 5.3.2, 5.3.6, 5.4.1, 5.5.1, Figure SPM.2}
A.6.2 Increased sea water intrusion in estuaries due to sea level rise has driven upstream redistribution of marine species (medium confidence) and caused a reduction of suitable habitats for estuarine communities (medium confidence). Increased nutrient and organic matter loads in estuaries since the 1970s from intensive human development and riverine loads have exacerbated the stimulating effects of ocean warming on bacterial respiration, leading to expansion of low oxygen areas (high confidence). {5.3.1}
A.6.3 The impacts of sea level rise on coastal ecosystems include habitat contraction, geographical shift of associated species, and loss of biodiversity and ecosystem functionality. Impacts are exacerbated by direct human disturbances, and where anthropogenic barriers prevent landward shift of marshes and mangroves (termed coastal squeeze) (high confidence). Depending on local geomorphology and sediment supply, marshes and mangroves can grow vertically at rates equal to or greater than current mean sea level rise (high confidence). {4.3.2, 4.3.3, 5.3.2, 5.3.7, 5.4.1}
A.6.4 Warm-water coral reefs and rocky shores dominated by immobile, calcifying (e.g., shell and skeleton producing) organisms such as corals, barnacles and mussels, are currently impacted by extreme temperatures and ocean acidification (high confidence). Marine heatwaves have already resulted in large-scale coral bleaching events at increasing frequency (very high confidence) causing worldwide reef degradation since 1997, and recovery is slow (more than 15 years) if it occurs (high confidence). Prolonged periods of high environmental temperature and dehydration of the organisms pose high risk to rocky shore ecosystems (high confidence). {SR1.5, 5.3.4, 5.3.5, 6.4.2, Figure SPM.2}
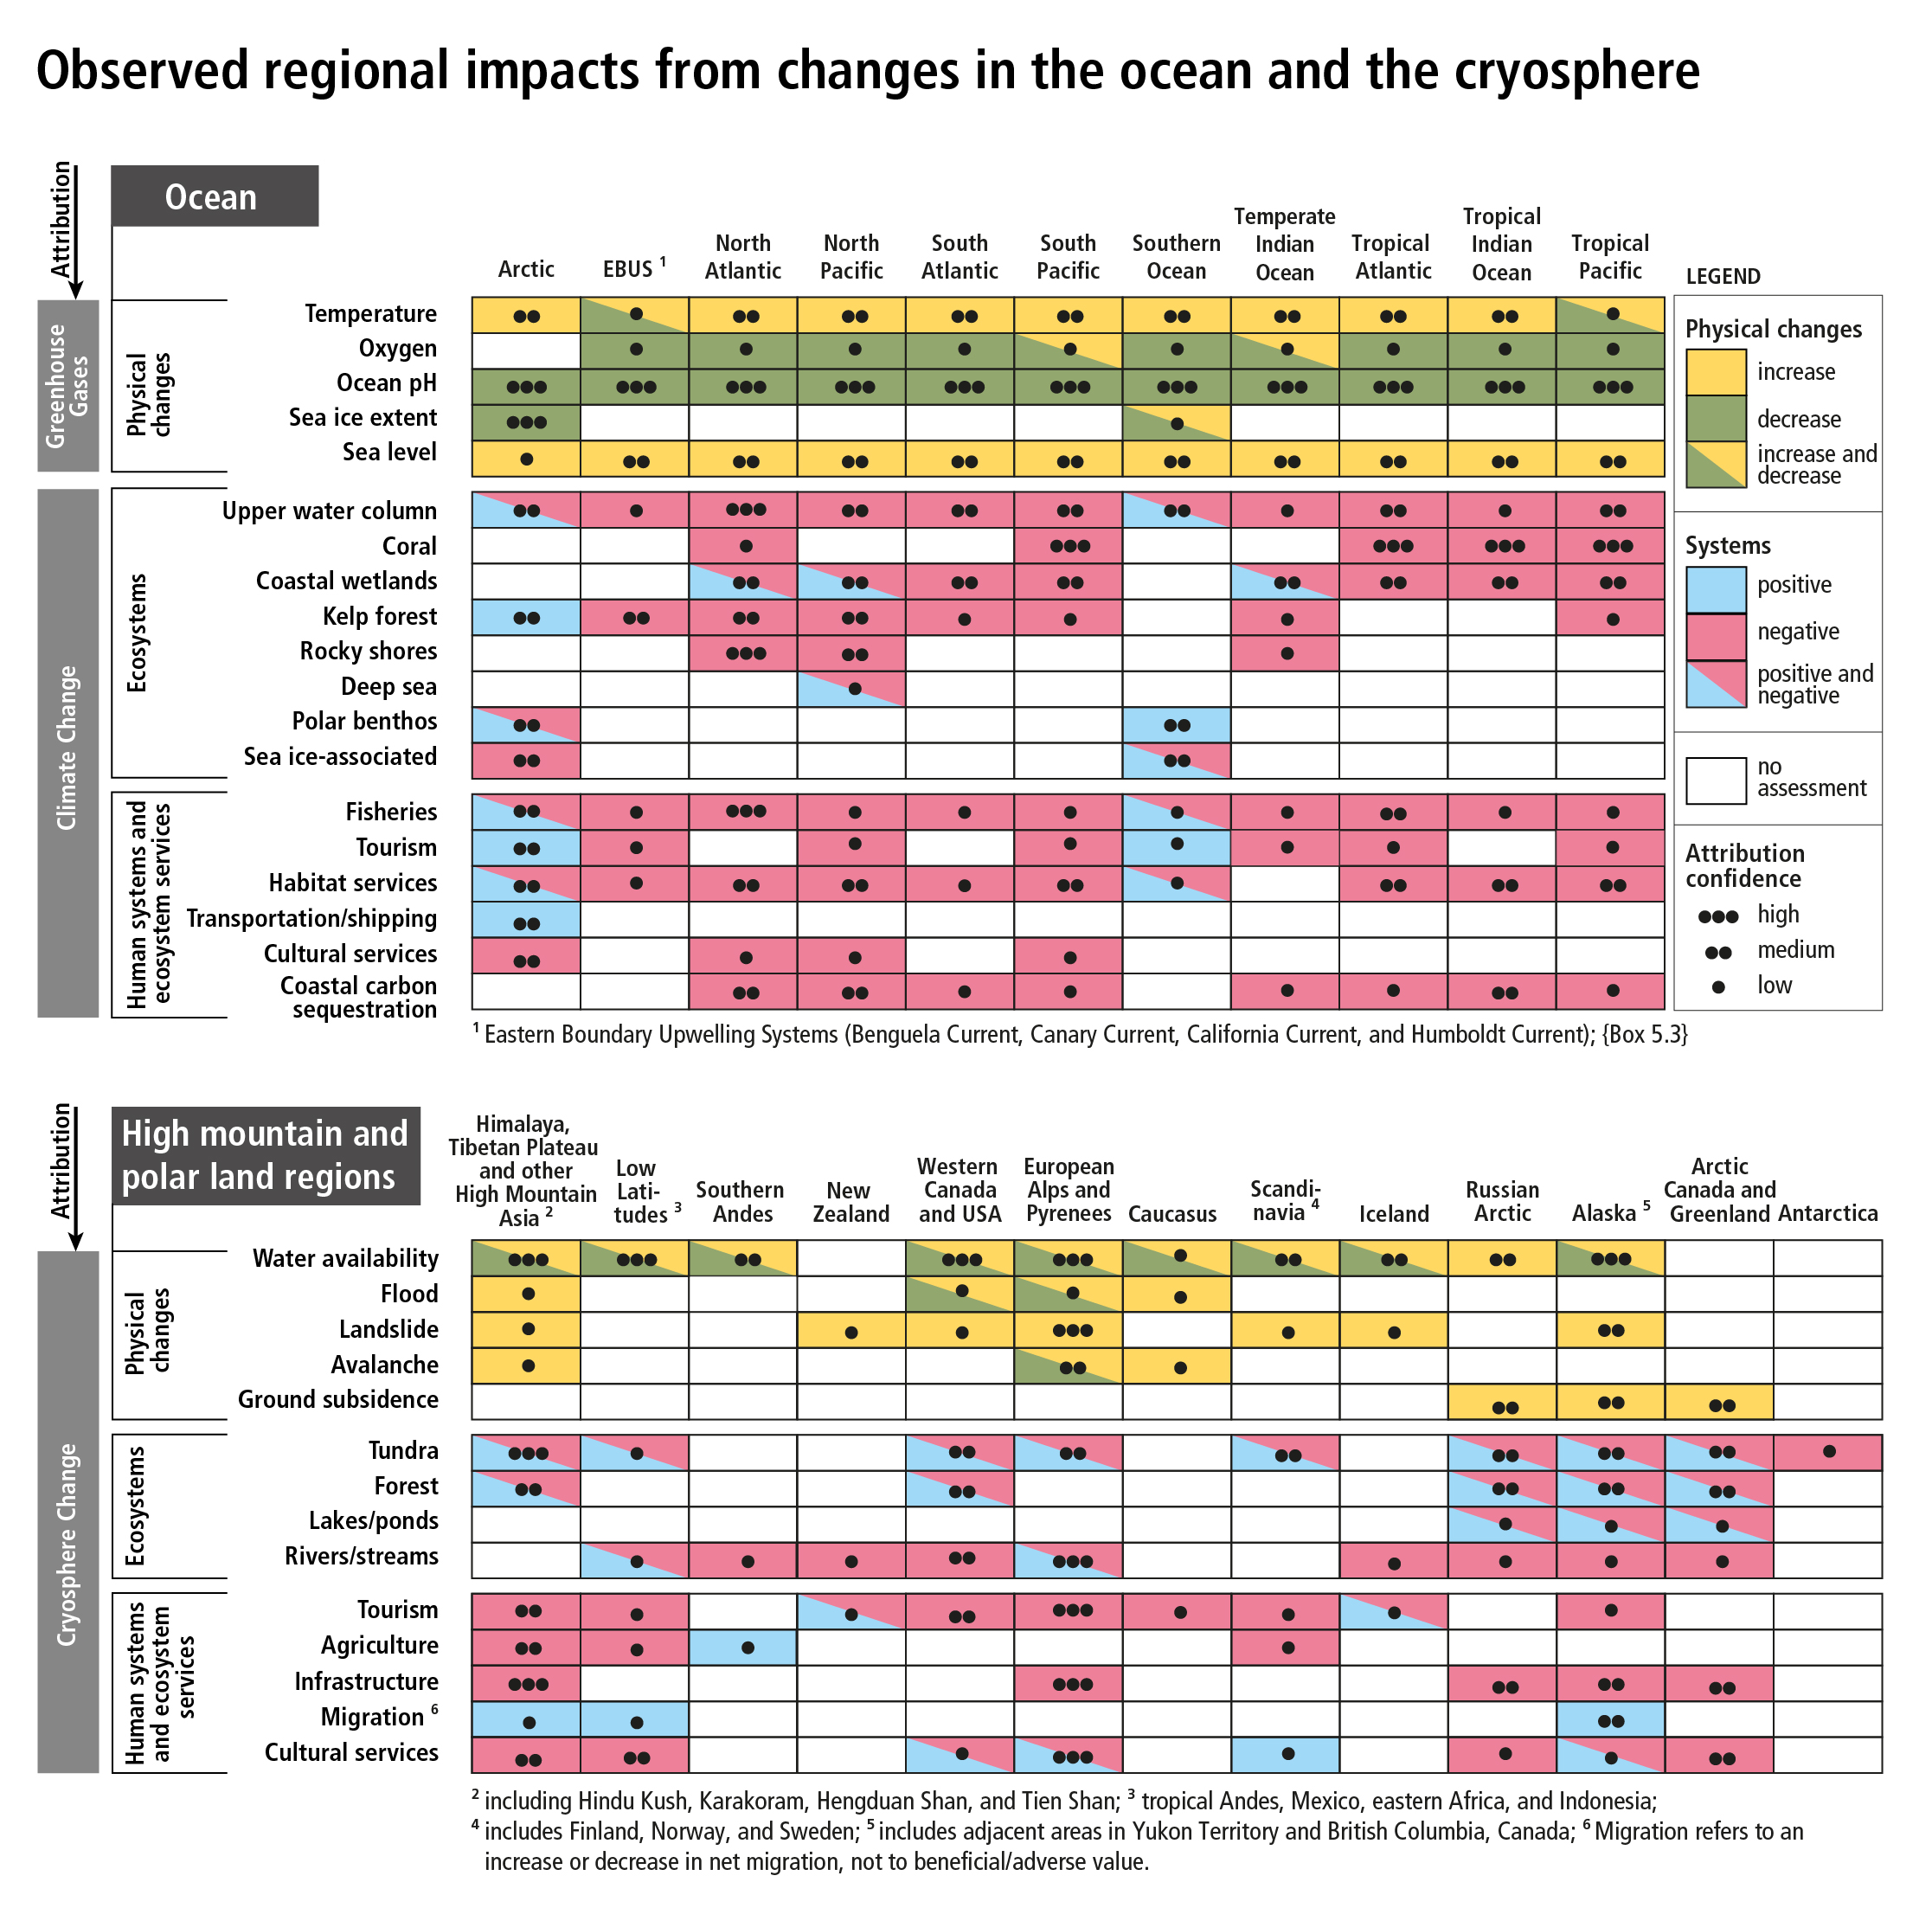
Figure SPM.2 | Synthesis of observed regional hazards and impacts in ocean (top) and high mountain and polar land regions (bottom) assessed in SROCC. For each region, physical changes, impacts on key ecosystems, and impacts on human systems and ecosystem function and services are shown. For physical changes, yellow/green refers to an increase/decrease, respectively, in […]
Figure SPM.2 | Synthesis of observed regional hazards and impacts in ocean24 (top) and high mountain and polar land regions (bottom) assessed in SROCC. For each region, physical changes, impacts on key ecosystems, and impacts on human systems and ecosystem function and services are shown. For physical changes, yellow/green refers to an increase/decrease, respectively, in amount or frequency of the measured variable. For impacts on ecosystems, human systems and ecosystems services blue or red depicts whether an observed impact is positive (beneficial) or negative (adverse), respectively, to the given system or service. Cells assigned ‘increase and decrease’ indicate that within that region, both increase and decrease of physical changes are found, but are not necessarily equal; the same holds for cells showing ‘positive and negative’ attributable impacts. For ocean regions, the confidence level refers to the confidence in attributing observed changes to changes in greenhouse gas forcing for physical changes and to climate change for ecosystem, human systems, and ecosystem services. For high mountain and polar land regions, the level of confidence in attributing physical changes and impacts at least partly to a change in the cryosphere is shown. No assessment means: not applicable, not assessed at regional scale, or the evidence is insufficient for assessment. The physical changes in the ocean are defined as: Temperature change in 0–700 m layer of the ocean except for Southern Ocean (0–2000 m) and Arctic Ocean (upper mixed layer and major inflowing branches); Oxygen in the 0–1200 m layer or oxygen minimum layer; Ocean pH as surface pH (decreasing pH corresponds to increasing ocean acidification). Ecosystems in the ocean: Coral refers to warm-water coral reefs and cold-water corals. The ‘upper water column’ category refers to epipelagic zone for all ocean regions except Polar Regions, where the impacts on some pelagic organisms in open water deeper than the upper 200 m were included. Coastal wetland includes salt marshes, mangroves and seagrasses. Kelp forests are habitats of a specific group of macroalgae. Rocky shores are coastal habitats dominated by immobile calcified organisms such as mussels and barnacles. Deep sea is seafloor ecosystems that are 3000–6000 m deep. Sea-ice associated includes ecosystems in, on and below sea ice. Habitat services refer to supporting structures and services (e.g., habitat, biodiversity, primary production). Coastal Carbon Sequestration refers to the uptake and storage of carbon by coastal blue carbon ecosystems. Ecosystems on Land: Tundra refers to tundra and alpine meadows, and includes terrestrial Antarctic ecosystems.
Observed Impacts on People and Ecosystem Services
A.7. Since the mid-20th century, the shrinking cryosphere in the Arctic and high-mountain areas has led to predominantly negative impacts on food security, water resources, water quality, livelihoods, health and well-being, infrastructure, transportation, tourism and recreation, as well as culture of human societies, particularly for Indigenous peoples (high confidence). Costs and benefits have been unequally distributed across populations and regions. Adaptation efforts have benefited from the inclusion of Indigenous knowledge and local knowledge (high confidence). {1.1, 1.5, 1.6.2, 2.3, 2.4, 3.4, 3.5, Figure SPM.2}
A.7.1 Food and water security have been negatively impacted by changes in snow cover, lake and river ice, and permafrost in many Arctic regions (high confidence). These changes have disrupted access to, and food availability within, herding, hunting, fishing, and gathering areas, harming the livelihoods and cultural identity of Arctic residents including Indigenous populations (high confidence). Glacier retreat and snow cover changes have contributed to localized declines in agricultural yields in some high mountain regions, including Hindu Kush Himalaya and the tropical Andes (medium confidence). {2.3.1, 2.3.7, Box 2.4, 3.4.1, 3.4.2, 3.4.3, 3.5.2, Figure SPM.2}
A.7.2 In the Arctic, negative impacts of cryosphere change on human health have included increased risk of food- and waterborne diseases, malnutrition, injury, and mental health challenges especially among Indigenous peoples (high confidence). In some high-mountain areas, water quality has been affected by contaminants, particularly mercury, released from melting glaciers and thawing permafrost (medium confidence). Health-related adaptation efforts in the Arctic range from local to international in scale, and successes have been underpinned by Indigenous knowledge (high confidence). {1.8, Cross-Chapter Box 4 in Chapter 1, 2.3.1, 3.4.3}
A.7.3 Arctic residents, especially Indigenous peoples, have adjusted the timing of activities to respond to changes in seasonality and safety of land, ice, and snow travel conditions. Municipalities and industry are beginning to address infrastructure failures associated with flooding and thawing permafrost and some coastal communities have planned for relocation (high confidence). Limited funding, skills, capacity, and institutional support to engage meaningfully in planning processes have challenged adaptation (high confidence). {3.5.2, 3.5.4, Cross-Chapter Box 9}
A.7.4 Summertime Arctic ship-based transportation (including tourism) increased over the past two decades concurrent with sea ice reductions (high confidence). This has implications for global trade and economies linked to traditional shipping corridors, and poses risks to Arctic marine ecosystems and coastal communities (high confidence), such as from invasive species and local pollution. {3.2.1, 3.2.4, 3.5.4, 5.4.2, Figure SPM.2}
A.7.5 In past decades, exposure of people and infrastructure to natural hazards has increased due to growing population, tourism and socioeconomic development (high confidence). Some disasters have been linked to changes in the cryosphere, for example in the Andes, high mountain Asia, Caucasus and European Alps (medium confidence). {2.3.2, Figure SPM.2}
A.7.6 Changes in snow and glaciers have changed the amount and seasonality of runoff and water resources in snow dominated and glacier-fed river basins (very high confidence). Hydropower facilities have experienced changes in seasonality and both increases and decreases in water input from high mountain areas, for example, in central Europe, Iceland, Western USA/Canada, and tropical Andes (medium confidence). However, there is only limited evidence of resulting impacts on operations and energy production. {SPM B.1.4, 2.3.1}
A.7.7 High mountain aesthetic and cultural aspects have been negatively impacted by glacier and snow cover decline (e.g. in the Himalaya, East Africa, the tropical Andes) (medium confidence). Tourism and recreation, including ski and glacier tourism, hiking, and mountaineering, have also been negatively impacted in many mountain regions (medium confidence). In some places, artificial snowmaking has reduced negative impacts on ski tourism (medium confidence). {2.3.5, 2.3.6, Figure SPM.2}
A.8. Changes in the ocean have impacted marine ecosystems and ecosystem services with regionally diverse outcomes, challenging their governance (high confidence). Both positive and negative impacts result for food security through fisheries (medium confidence), local cultures and livelihoods (medium confidence), and tourism and recreation (medium confidence). The impacts on ecosystem services have negative consequences for health and well-being (medium confidence), and for Indigenous peoples and local communities dependent on fisheries (high confidence). {1.1, 1.5, 3.2.1, 5.4.1, 5.4.2, Figure SPM.2}
A.8.1 Warming-induced changes in the spatial distribution and abundance of some fish and shellfish stocks have had positive and negative impacts on catches, economic benefits, livelihoods, and local culture (high confidence). There are negative consequences for Indigenous peoples and local communities that are dependent on fisheries (high confidence). Shifts in species distributions and abundance has challenged international and national ocean and fisheries governance, including in the Arctic, North Atlantic and Pacific, in terms of regulating fishing to secure ecosystem integrity and sharing of resources between fishing entities (high confidence). {3.2.4, 3.5.3, 5.4.2, 5.5.2, Figure SPM.2}
A.8.2 Harmful algal blooms display range expansion and increased frequency in coastal areas since the 1980s in response to both climatic and non-climatic drivers such as increased riverine nutrients run-off (high confidence). The observed trends in harmful algal blooms are attributed partly to the effects of ocean warming, marine heatwaves, oxygen loss, eutrophication and pollution (high confidence). Harmful algal blooms have had negative impacts on food security, tourism, local economy, and human health (high confidence). The human communities who are more vulnerable to these biological hazards are those in areas without sustained monitoring programs and dedicated early warning systems for harmful algal blooms (medium confidence). {Box 5.4, 5.4.2, 6.4.2}
A.9. Coastal communities are exposed to multiple climate-related hazards, including tropical cyclones, extreme sea levels and flooding, marine heatwaves, sea ice loss, and permafrost thaw (high confidence). A diversity of responses has been implemented worldwide, mostly after extreme events, but also some in anticipation of future sea level rise, e.g., in the case of large infrastructure. {3.2.4, 3.4.3, 4.3.2, 4.3.3, 4.3.4, 4.4.2, 5.4.2, 6.2, 6.4.2, 6.8, Box 6.1, Cross Chapter Box 9, Figure SPM.5}
A.9.1 Attribution of current coastal impacts on people to sea level rise remains difficult in most locations since impacts were exacerbated by human-induced non-climatic drivers, such as land subsidence (e.g., groundwater extraction), pollution, habitat degradation, reef and sand mining (high confidence). {4.3.2, 4.3.3}
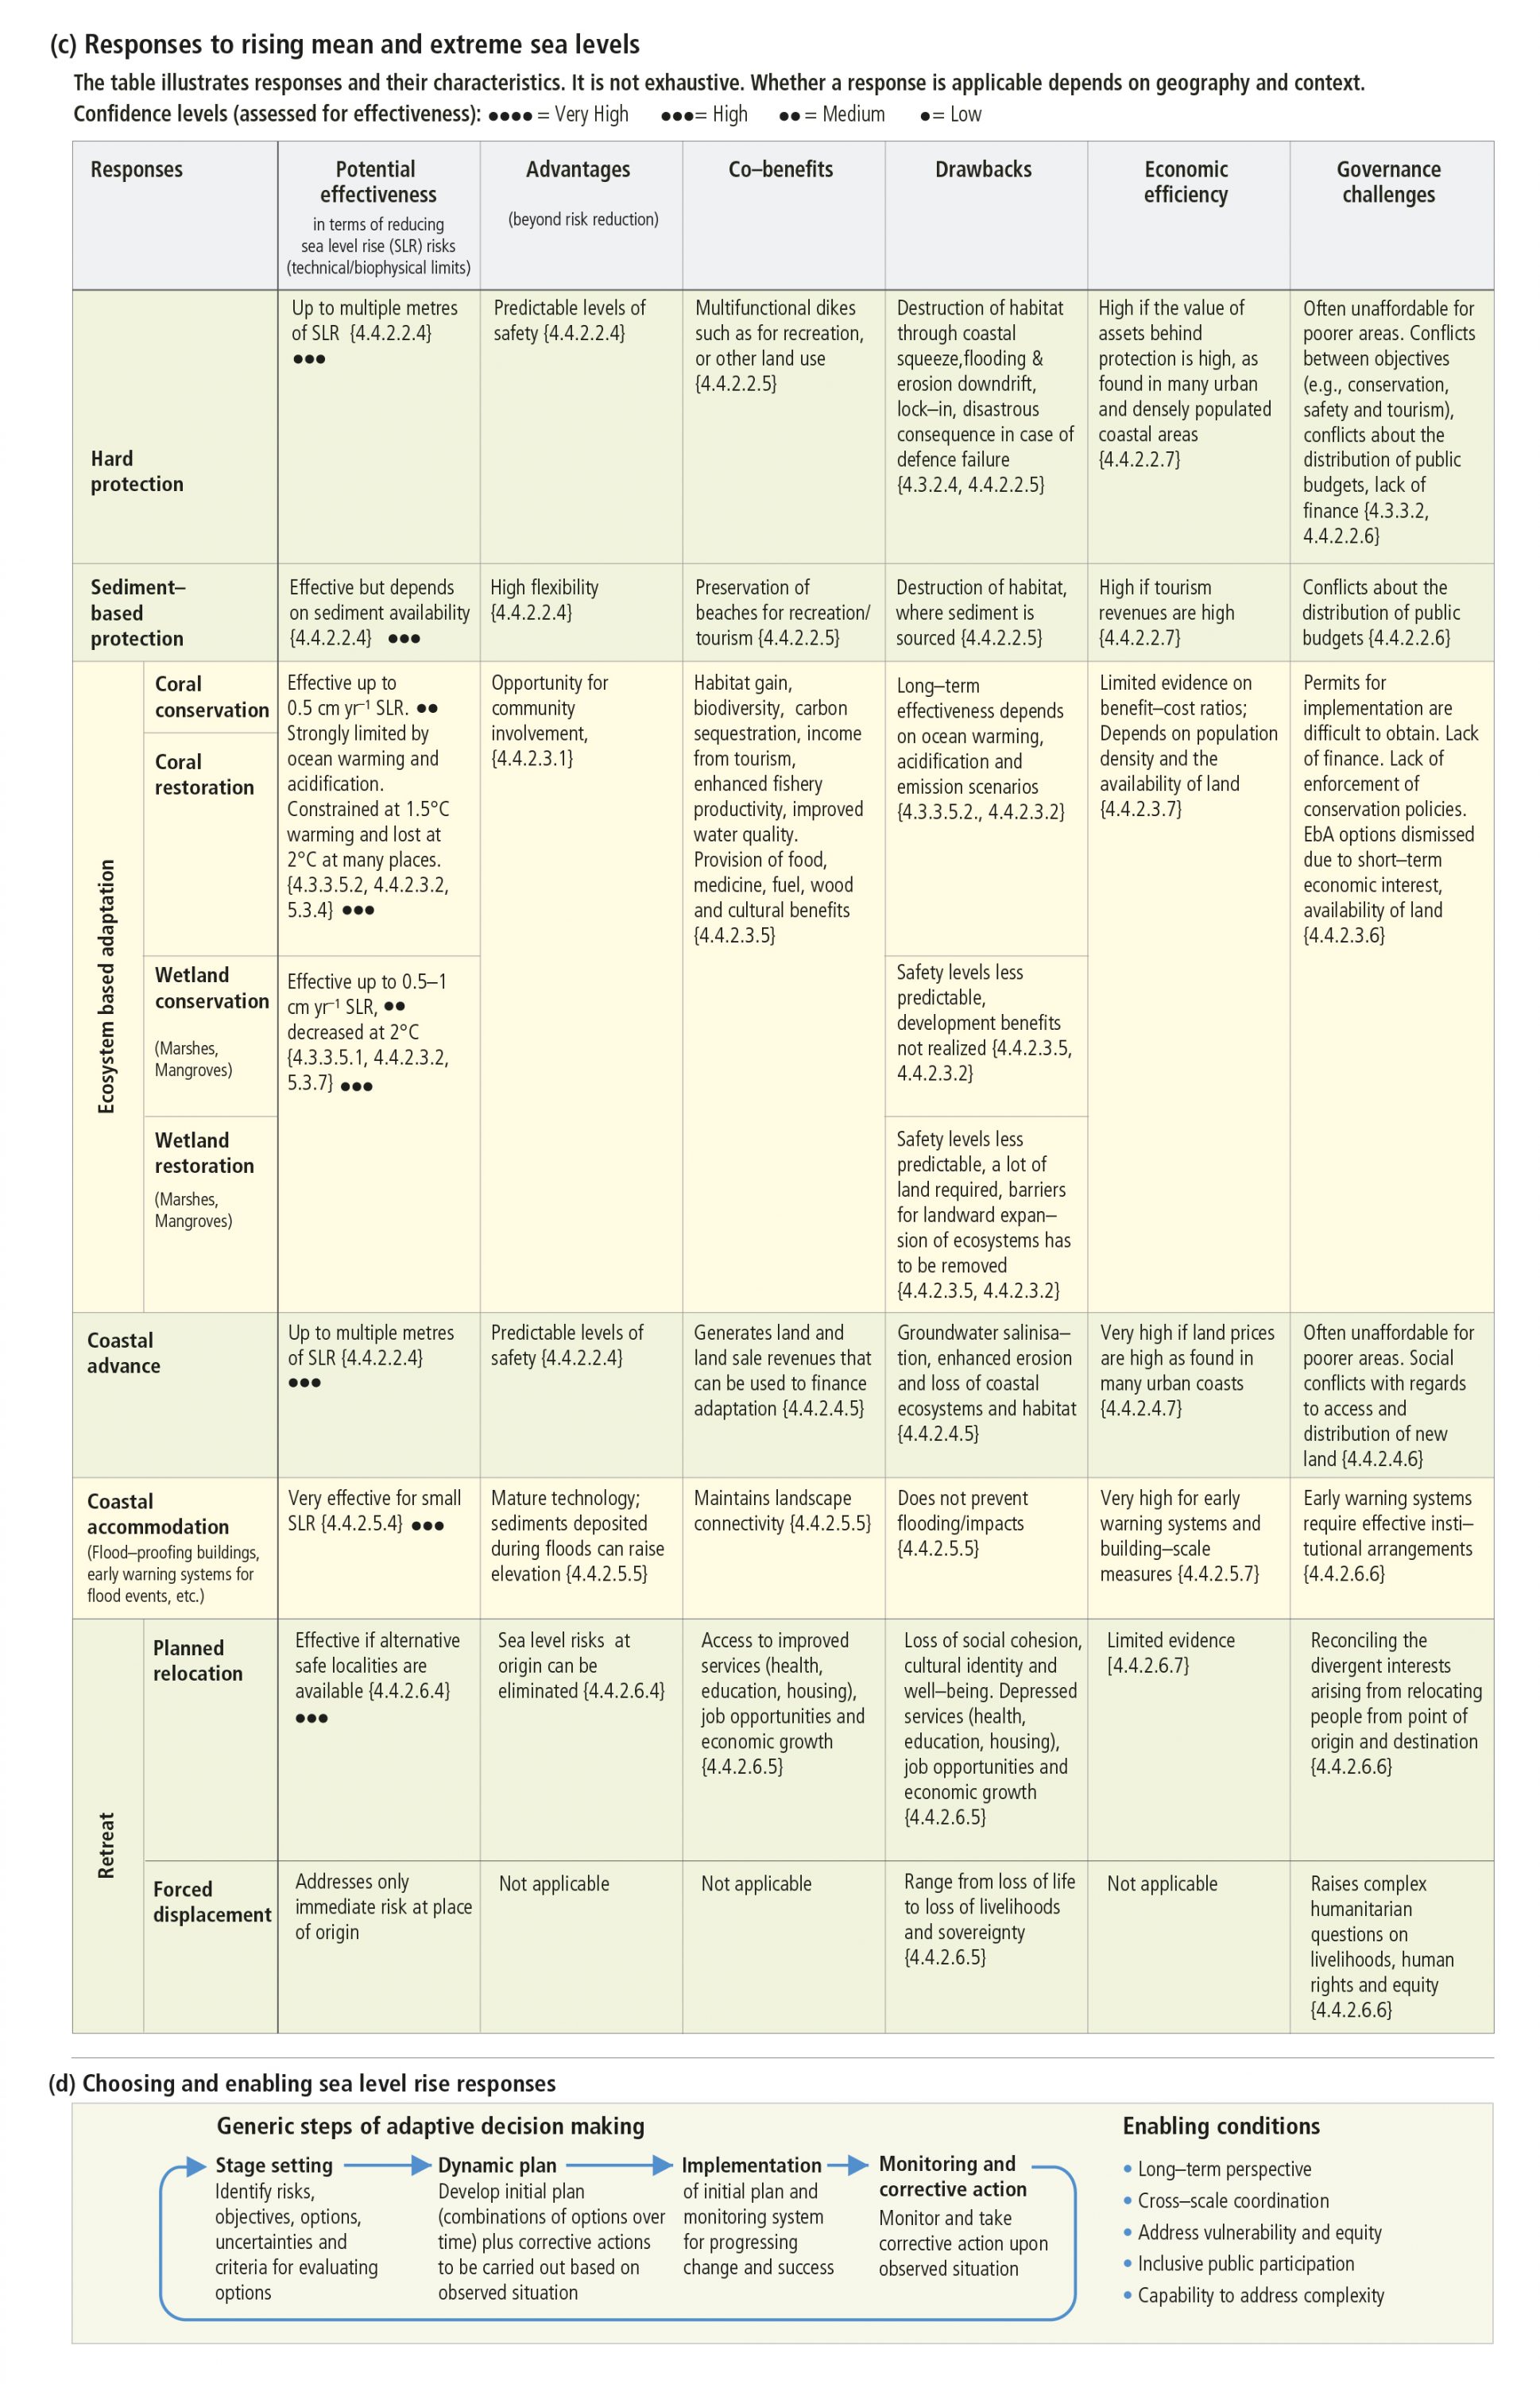
A.9.2 Coastal protection through hard measures, such as dikes, seawalls, and surge barriers, is widespread in many coastal cities and deltas. Ecosystem-based and hybrid approaches combining ecosystems and built infrastructure are becoming more popular worldwide. Coastal advance, which refers to the creation of new land by building seawards (e.g., land reclamation), has a long history in most areas where there are dense coastal populations and a shortage of land. Coastal retreat, which refers to the removal of human occupation of coastal areas, is also observed, but is generally restricted to small human communities or occurs to create coastal wetland habitat. The effectiveness of the responses to sea level rise are assessed in Figure SPM.5. {3.5.3, 4.3.3, 4.4.2, 6.3.3, 6.9.1, Cross-Chapter Box 9}
B.1. Global-scale glacier mass loss, permafrost thaw, and decline in snow cover and Arctic sea ice extent are projected to continue in the near-term (2031–2050) due to surface air temperature increases (high confidence), with unavoidable consequences for river runoff and local hazards (high confidence). The Greenland and Antarctic Ice Sheets are projected to lose mass at an increasing rate throughout the 21st century and beyond (high confidence). The rates and magnitudes of these cryospheric changes are projected to increase further in the second half of the 21st century in a high greenhouse gas emissions scenario (high confidence). Strong reductions in greenhouse gas emissions in the coming decades are projected to reduce further changes after 2050 (high confidence). {2.2, 2.3, Cross-Chapter Box 6 in Chapter 2, 3.3, 3.4, Figure SPM.1, SPM Box SPM.1}
B.1.1 Projected glacier mass reductions between 2015 and 2100 (excluding the ice sheets) range from 18 ± 7% (likely range) for RCP2.6 to 36 ± 11% (likely range) for RCP8.5, corresponding to a sea level contribution of 94 ± 25 mm (likely range) sea level equivalent for RCP2.6, and 200 ± 44 mm (likely range) for RCP8.5 (medium confidence). Regions with mostly smaller glaciers (e.g., Central Europe, Caucasus, North Asia, Scandinavia, tropical Andes, Mexico, eastern Africa and Indonesia), are projected to lose more than 80% of their current ice mass by 2100 under RCP8.5 (medium confidence), and many glaciers are projected to disappear regardless of future emissions (very high confidence). {Cross-Chapter Box 6 in Chapter 2, Figure SPM.1}
B.1.2 In 2100, the Greenland Ice Sheet’s projected contribution to GMSL rise is 0.07 m (0.04–0.12 m, likely range) under RCP2.6, and 0.15 m (0.08–0.27 m, likely range) under RCP8.5. In 2100, the Antarctic Ice Sheet is projected to contribute 0.04 m (0.01–0.11 m, likely range) under RCP2.6, and 0.12 m (0.03–0.28 m, likely range) under RCP8.5. The Greenland Ice Sheet is currently contributing more to sea level rise than the Antarctic Ice Sheet (high confidence), but Antarctica could become a larger contributor by the end of the 21st century as a consequence of rapid retreat (low confidence). Beyond 2100, increasing divergence between Greenland and Antarctica’s relative contributions to GMSL rise under RCP8.5 has important consequences for the pace of relative sea level rise in the Northern Hemisphere. {3.3.1, 4.2.3, 4.2.5, 4.3.3, Cross-Chapter Box 8 in Chapter 3, Figure SPM.1}
B.1.3 Arctic autumn and spring snow cover are projected to decrease by 5–10%, relative to 1986–2005, in the near-term (2031–2050), followed by no further losses under RCP2.6, but an additional 15–25% loss by the end of century under RCP8.5 (high confidence). In high mountain areas, projected decreases in low elevation mean winter snow depth, compared to 1986–2005, are likely 10–40% by 2031–2050, regardless of emissions scenario (high confidence). For 2081–2100, this projected decrease is likely 10–40 % for RCP2.6 and 50–90% for RCP8.5. {2.2.2, 3.3.2, 3.4.2, Figure SPM.1}
B.1.4 Widespread permafrost thaw is projected for this century (very high confidence) and beyond. By 2100, projected near-surface (within 3–4 m) permafrost area shows a decrease of 24 ± 16% (likely range) for RCP2.6 and 69 ± 20% (likely range) for RCP8.5. The RCP8.5 scenario leads to the cumulative release of tens to hundreds of billions of tons (GtC) of permafrost carbon as CO226 and methane to the atmosphere by 2100 with the potential to exacerbate climate change (medium confidence). Lower emissions scenarios dampen the response of carbon emissions from the permafrost region (high confidence). Methane contributes a small fraction of the total additional carbon release but is significant because of its higher warming potential. Increased plant growth is projected to replenish soil carbon in part, but will not match carbon releases over the long term (medium confidence). {2.2.4, 3.4.2, 3.4.3, Figure SPM.1, Cross-Chapter Box 5 in Chapter 1}
B.1.5 In many high mountain areas, glacier retreat and permafrost thaw are projected to further decrease the stability of slopes, and the number and area of glacier lakes will continue to increase (high confidence). Floods due to glacier lake outburst or rain-on-snow, landslides and snow avalanches, are projected to occur also in new locations or different seasons (high confidence). {2.3.2}
B.1.6 River runoff in snow-dominated or glacier-fed high mountain basins is projected to change regardless of emissions scenario (very high confidence), with increases in average winter runoff (high confidence) and earlier spring peaks (very high confidence). In all emissions scenarios, average annual and summer runoff from glaciers are projected to peak at or before the end of the 21st century (high confidence), e.g., around mid-century in High Mountain Asia, followed by a decline in glacier runoff. In regions with little glacier cover (e.g., tropical Andes, European Alps) most glaciers have already passed this peak (high confidence). Projected declines in glacier runoff by 2100 (RCP8.5) can reduce basin runoff by 10% or more in at least one month of the melt season in several large river basins, especially in High Mountain Asia during the dry season (low confidence). {2.3.1}
B.1.7 Arctic sea ice loss is projected to continue through mid-century, with differences thereafter depending on the magnitude of global warming: for stabilised global warming of 1.5°C the annual probability of a sea ice-free September by the end of century is approximately 1%, which rises to 10–35% for stabilised global warming of 2°C (high confidence). There is low confidence in projections for Antarctic sea ice. {3.2.2, Figure SPM.1}
B.2. Over the 21st century, the ocean is projected to transition to unprecedented conditions with increased temperatures (virtually certain), greater upper ocean stratification (very likely), further acidification (virtually certain), oxygen decline (medium confidence), and altered net primary production (low confidence). Marine heatwaves (very high confidence) and extreme El Niño and La Niña events (medium confidence) are projected to become more frequent. The Atlantic Meridional Overturning Circulation (AMOC) is projected to weaken (very likely). The rates and magnitudes of these changes will be smaller under scenarios with low greenhouse gas emissions (very likely). {3.2, 5.2, 6.4, 6.5, 6.7, Box 5.1, Figures SPM.1, SPM.3}
B.2.1 The ocean will continue to warm throughout the 21st century (virtually certain). By 2100, the top 2000 m of the ocean are projected to take up 5–7 times more heat under RCP8.5 (or 2–4 times more under RCP2.6) than the observed accumulated ocean heat uptake since 1970 (very likely). The annual mean density stratification14 of the top 200 m, averaged between 60°S and 60°N, is projected to increase by 12–30% for RCP8.5 and 1–9% for RCP2.6, for 2081–2100 relative to 1986–2005 (very likely), inhibiting vertical nutrient, carbon and oxygen fluxes. {5.2.2, Figure SPM.1}
B.2.2 By 2081–2100 under RCP8.5, ocean oxygen content (medium confidence), upper ocean nitrate content (medium confidence), net primary production (low confidence) and carbon export (medium confidence) are projected to decline globally by very likely ranges of 3–4%, 9–14%, 4–11% and 9-16% respectively, relative to 2006–2015. Under RCP2.6, globally projected changes by 2081–2100 are smaller compared to RCP8.5 for oxygen loss (very likely), nutrient availability (about aslikely as not) and net primary production (high confidence).{5.2.2, Box 5.1, Figures SPM.1, SPM.3}
B.2.3 Continued carbon uptake by the ocean by 2100 is virtually certain to exacerbate ocean acidification. Open ocean surface pH is projected to decrease by around 0.3 pH units by 2081–2100, relative to 2006–2015, under RCP8.5 (virtually certain). For RCP8.5, there are elevated risks for keystone aragonite shell-forming species due to crossing an aragonite stability threshold year-round in the Polar and sub-Polar Oceans by 2081–2100 (very likely). For RCP2.6, these conditions will be avoided this century (very likely), but some eastern boundary upwelling systems are projected to remain vulnerable (high confidence). {3.2.3, 5.2.2, Box 5.1, Box 5.3, Figure SPM.1}
B.2.4 Climate conditions, unprecedented since the preindustrial period, are developing in the ocean, elevating risks for open ocean ecosystems. Surface acidification and warming have already emerged in the historical period (very likely). Oxygen loss between 100 and 600 m depth is projected to emerge over 59–80% of the ocean area by 2031–2050 under RCP8.5 (very likely). The projected time of emergence for five primary drivers of marine ecosystem change (surface warming and acidification, oxygen loss, nitrate content and net primary production change) are all prior to 2100 for over 60% of the ocean area under RCP8.5 and over 30% under RCP2.6 (very likely). {Annex I: Glossary, Box 5.1, Box 5.1 Figure 1}
B.2.5 Marine heatwaves are projected to further increase in frequency, duration, spatial extent and intensity (maximum temperature) (very high confidence). Climate models project increases in the frequency of marine heatwaves by 2081–2100, relative to 1850–1900, by approximately 50 times under RCP8.5 and 20 times under RCP2.6 (medium confidence). The largest increases in frequency are projected for the Arctic and the tropical oceans (medium confidence). The intensity of marine heatwaves is projected to increase about 10-fold under RCP8.5 by 2081–2100, relative to 1850–1900 (medium confidence). {6.4, Figure SPM.1}
B.2.6 Extreme El Niño and La Niña events are projected to likely increase in frequency in the 21st century and to likely intensify existing hazards, with drier or wetter responses in several regions across the globe. Extreme El Niño events are projected to occur about as twice as often under both RCP2.6 and RCP8.5 in the 21st century when compared to the 20th century (medium confidence). Projections indicate that extreme Indian Ocean Dipole events also increase in frequency (low confidence). {6.5, Figures 6.5, 6.6}
B.2.7 The AMOC is projected to weaken in the 21st century under all RCPs(very likely), although a collapse is very unlikely (medium confidence). Based on CMIP5 projections, by 2300, an AMOC collapse is aboutas likely as not for high emissions scenarios and very unlikely for lower ones (medium confidence). Any substantial weakening of the AMOC is projected to cause a decrease in marine productivity in the North Atlantic (medium confidence), more storms in Northern Europe (medium confidence), less Sahelian summer rainfall (high confidence) and South Asian summer rainfall (medium confidence), a reduced number of tropical cyclones in the Atlantic (medium confidence), and an increase in regional sea level along the northeast coast of North America (medium confidence). Such changes would be in addition to the global warming signal. {6.7, Figures 6.8–6.10}
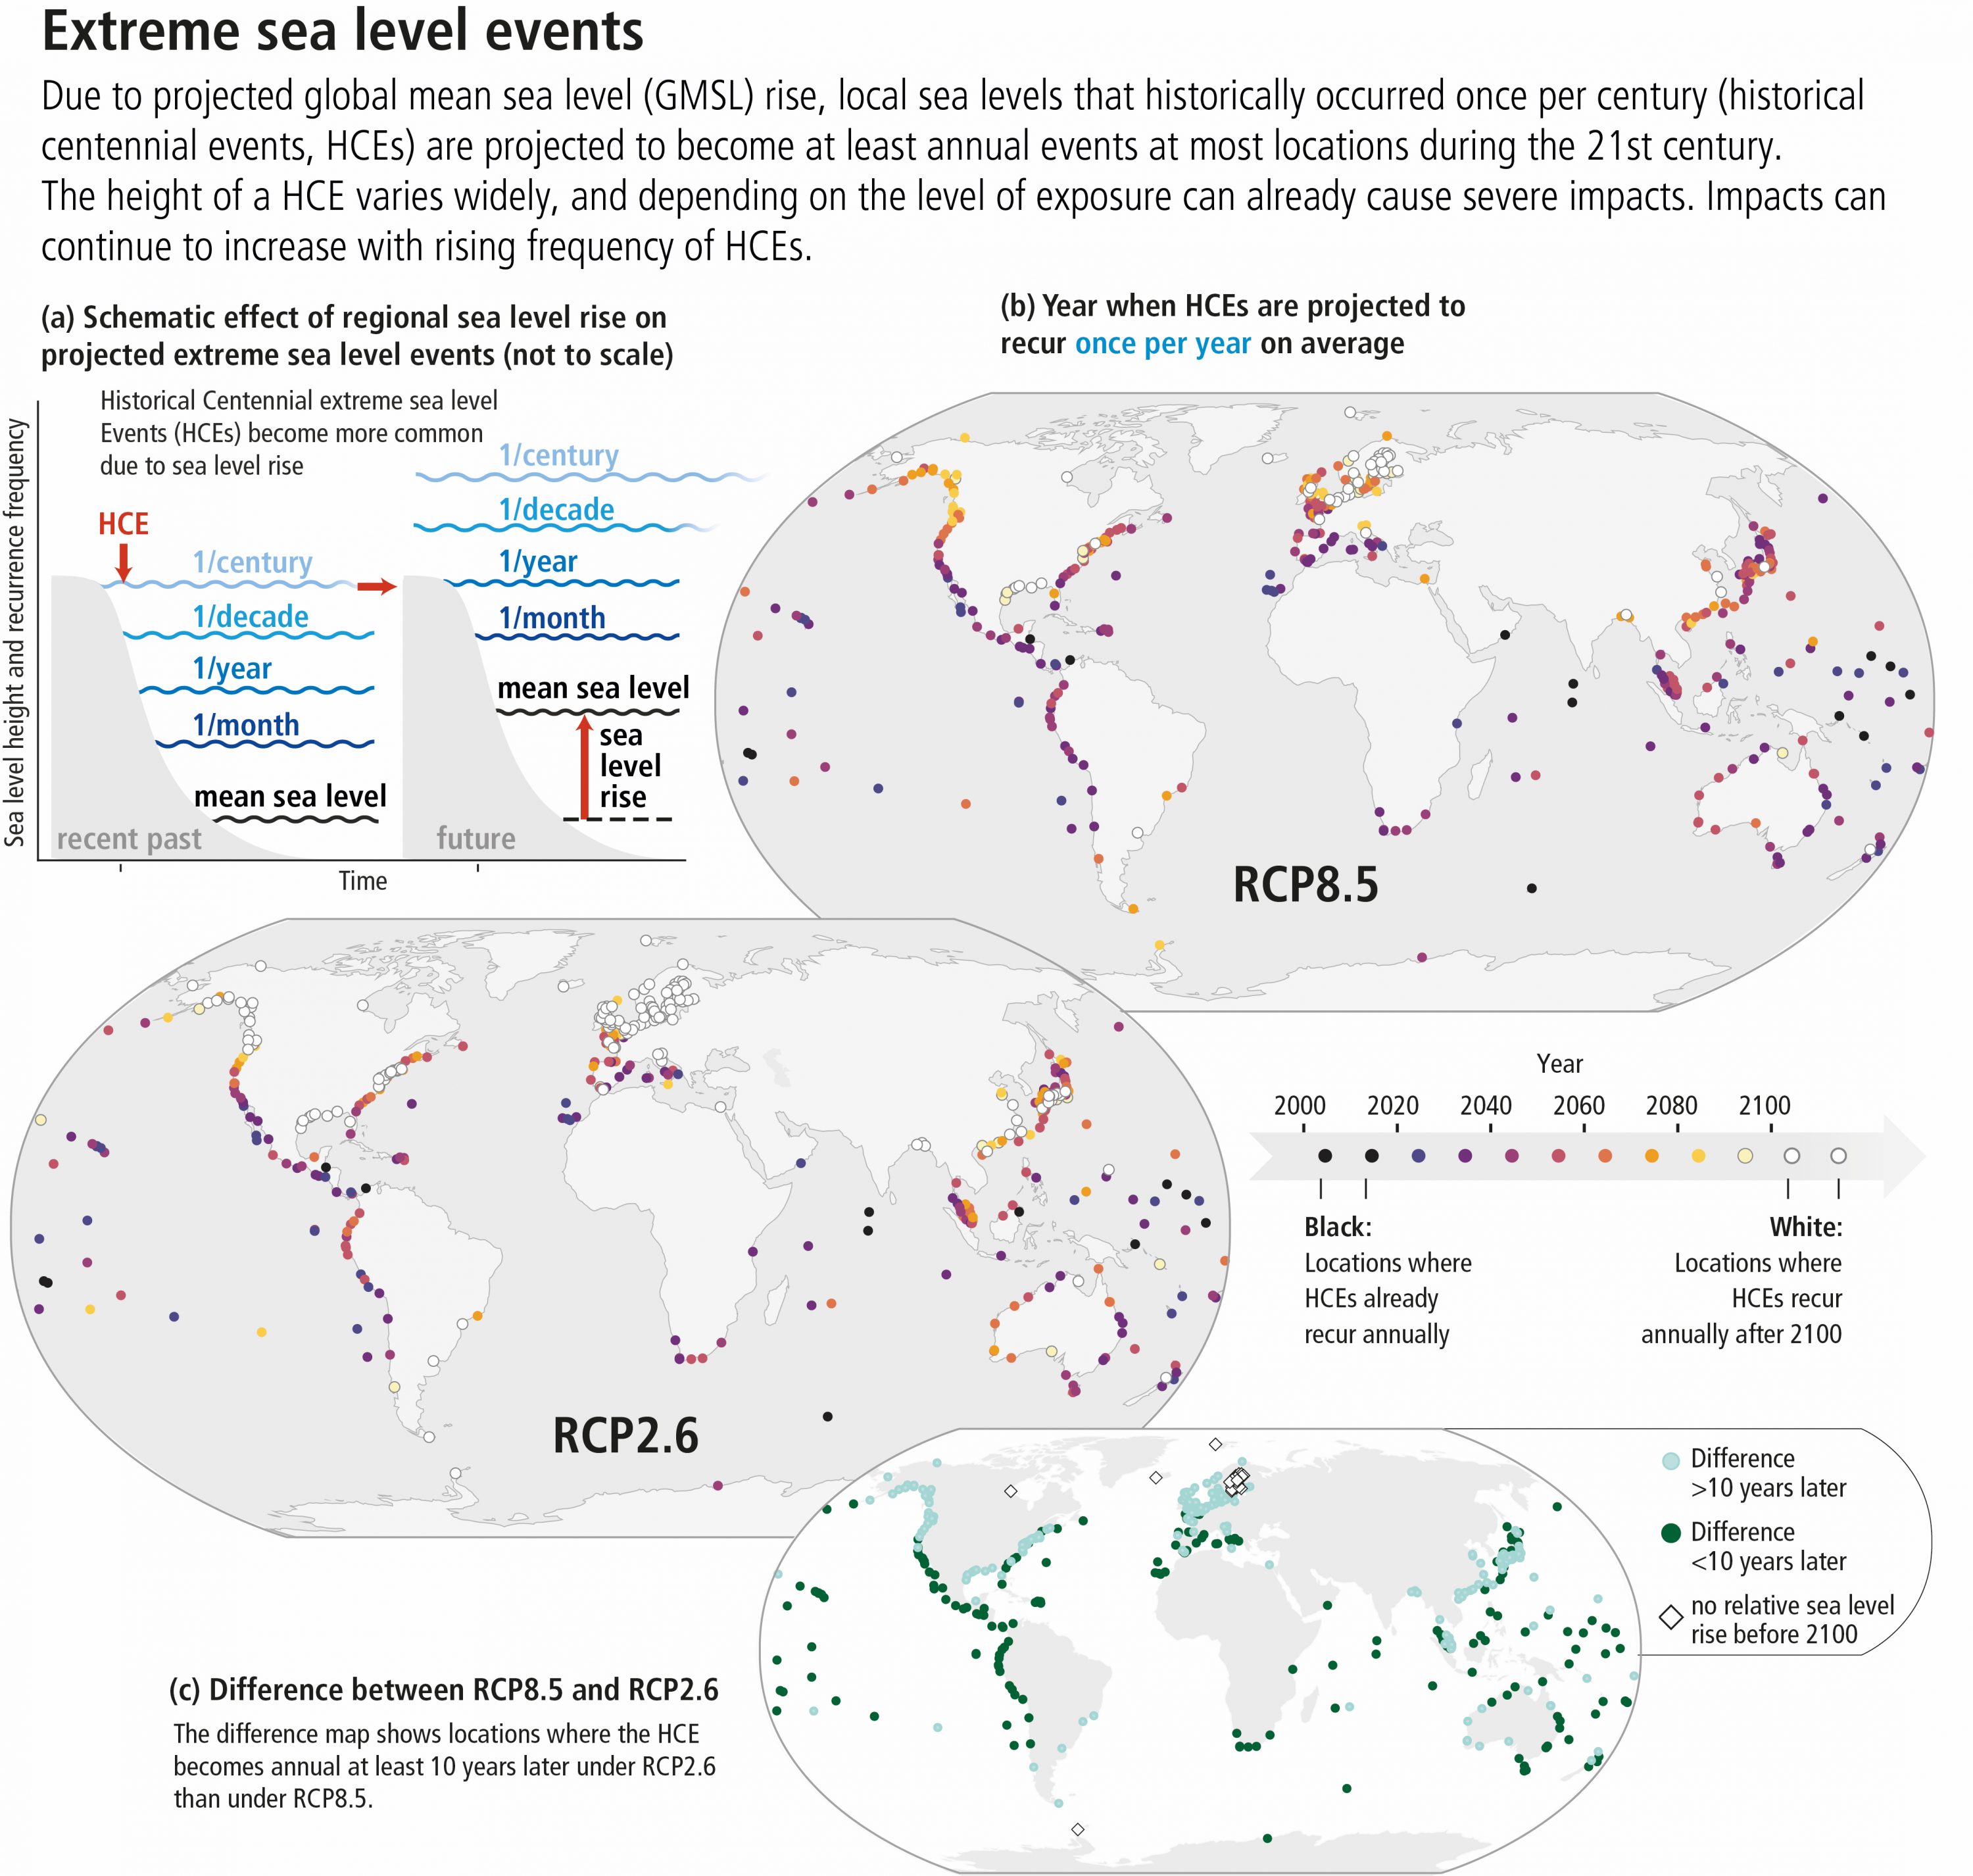
B.3. Sea level continues to rise at an increasing rate. Extreme sea level events that are historically rare (once per century in the recent past) are projected to occur frequently (at least once per year) at many locations by 2050 in all RCP scenarios, especially in tropical regions (high confidence). The increasing frequency of high water levels can have severe impacts in many locations depending on exposure (high confidence). Sea level rise is projected to continue beyond 2100 in all RCP scenarios. For a high emissions scenario (RCP8.5), projections of global sea level rise by 2100 are greater than in AR5 due to a larger contribution from the Antarctic Ice Sheet (medium confidence). In coming centuries under RCP8.5, sea level rise is projected to exceed rates of several centimetres per year resulting in multi-metre rise (medium confidence), while for RCP2.6 sea level rise is projected to be limited to around 1 m in 2300 (low confidence). Extreme sea levels and coastal hazards will be exacerbated by projected increases in tropical cyclone intensity and precipitation (high confidence). Projected changes in waves and tides vary locally in whether they amplify or ameliorate these hazards (medium confidence). {Cross-Chapter Box 5 in Chapter 1, Cross-Chapter Box 8 in Chapter 3, 4.1, 4.2, 5.2.2, 6.3.1, Figures SPM.1, SPM.4, SPM.5}
B.3.1 The global mean sea level (GMSL) rise under RCP2.6 is projected to be 0.39 m (0.26–0.53 m, likely range) for the period 2081–2100, and 0.43 m (0.29–0.59 m, likely range) in 2100 with respect to 1986–2005. For RCP8.5, the corresponding GMSL rise is 0.71 m (0.51–0.92 m, likely range) for 2081–2100 and 0.84 m (0.61–1.10 m, likely range) in 2100. Mean sea level rise projections are higher by 0.1 m compared to AR5 under RCP8.5 in 2100, and the likely range extends beyond 1 m in 2100 due to a larger projected ice loss from the Antarctic Ice Sheet (medium confidence). The uncertainty at the end of the century is mainly determined by the ice sheets, especially in Antarctica. {4.2.3, Figures SPM.1, SPM.5}
B.3.2 Sea level projections show regional differences around GMSL. Processes not driven by recent climate change, such as local subsidence caused by natural processes and human activities, are important to relative sea level changes at the coast (high confidence). While the relative importance of climate-driven sea level rise is projected to increase over time, local processes need to be considered for projections and impacts of sea level (high confidence). {SPM A3.4, 4.2.1, 4.2.2, Figure SPM.5}
B.3.3 The rate of global mean sea level rise is projected to reach 15 mm yr–1 (10–20 mm yr–1, likely range) under RCP8.5 in 2100, and to exceed several centimetres per year in the 22nd century. Under RCP2.6, the rate is projected to reach 4 mm yr-1 (2–6 mm yr–1, likely range) in 2100. Model studies indicate multi-meter rise in sea level by 2300 (2.3–5.4 m for RCP8.5 and 0.6–1.07 m under RCP2.6) (low confidence), indicating the importance of reduced emissions for limiting sea level rise. Processes controlling the timing of future ice-shelf loss and the extent of ice sheet instabilities could increase Antarctica’s contribution to sea level rise to values substantially higher than the likely range on century and longer time-scales (low confidence). Considering the consequences of sea level rise that a collapse of parts of the Antarctic Ice Sheet entails, this high impact risk merits attention. {Cross-Chapter Box 5 in Chapter 1, Cross-Chapter Box 8 in Chapter 3, 4.1, 4.2.3}
B.3.4 Global mean sea level rise will cause the frequency of extreme sea level events at most locations to increase. Local sea levels that historically occurred once per century (historical centennial events) are projected to occur at least annually at most locations by 2100 under all RCP scenarios (high confidence). Many low-lying megacities and small islands (including SIDS) are projected to experience historical centennial events at least annually by 2050 under RCP2.6, RCP4.5 and RCP8.5. The year when the historical centennial event becomes an annual event in the mid-latitudes occurs soonest in RCP8.5, next in RCP4.5 and latest in RCP2.6. The increasing frequency of high water levels can have severe impacts in many locations depending on the level of exposure (high confidence). {4.2.3, 6.3, Figures SPM.4, SPM.5}
B.3.5 Significant wave heights (the average height from trough to crest of the highest one-third of waves) are projected to increase across the Southern Ocean and tropical eastern Pacific (high confidence) and Baltic Sea (medium confidence) and decrease over the North Atlantic and Mediterranean Sea under RCP8.5 (high confidence). Coastal tidal amplitudes and patterns are projected to change due to sea level rise and coastal adaptation measures (very likely).Projected changes in waves arising from changes in weather patterns, and changes in tides due to sea level rise, can locally enhance or ameliorate coastal hazards (medium confidence). {6.3.1, 5.2.2}
B.3.6 The average intensity of tropical cyclones, the proportion of Category 4 and 5 tropical cyclones and the associated average precipitation rates are projected to increase for a 2°C global temperature rise above any baseline period (medium confidence). Rising mean sea levels will contribute to higher extreme sea levels associated with tropical cyclones (very high confidence). Coastal hazards will be exacerbated by an increase in the average intensity, magnitude of storm surge and precipitation rates of tropical cyclones. There are greater increases projected under RCP8.5 than under RCP2.6 from around mid-century to 2100 (medium confidence). There is low confidence in changes in the future frequency of tropical cyclones at the global scale. {6.3.1}
Projected Risks for Ecosystems
B.4 Future land cryosphere changes will continue to alter terrestrial and freshwater ecosystems in high mountain and polar regions with major shifts in species distributions resulting in changes in ecosystem structure and functioning, and eventual loss of globally unique biodiversity (medium confidence). Wildfire is projected to increase significantly for the rest of this century across most tundra and boreal regions, and also in some mountain regions (medium confidence). {2.3.3, Box 3.4, 3.4.3}
B.4.1 In high mountain regions, further upslope migration by lower-elevation species, range contractions, and increased mortality will lead to population declines of many alpine species, especially glacier- or snow-dependent species (high confidence), with local and eventual global species loss (medium confidence). The persistence of alpine species and sustaining ecosystem services depends on appropriate conservation and adaptation measures (high confidence). {2.3.3}
B.4.2 On Arctic land, a loss of globally unique biodiversity is projected as limited refugia exist for some High-Arctic species and hence they are outcompeted by more temperate species (medium confidence). Woody shrubs and trees are projected to expand to cover 24–52% of Arctic tundra by 2050 (medium confidence). The boreal forest is projected to expand at its northern edge, while diminishing at its southern edge where it is replaced by lower biomass woodland/shrublands (medium confidence). {3.4.3, Box 3.4}
B.4.3 Permafrost thaw and decrease in snow will affect Arctic and mountain hydrology and wildfire, with impacts on vegetation and wildlife (medium confidence). About 20% of Arctic land permafrost is vulnerable to abrupt permafrost thaw and ground subsidence, which is projected to increase small lake area by over 50% by 2100 for RCP8.5 (medium confidence). Even as the overall regional water cycle is projected to intensify, including increased precipitation, evapotranspiration, and river discharge to the Arctic Ocean, decreases in snow and permafrost may lead to soil drying with consequences for ecosystem productivity and disturbances (medium confidence). Wildfire is projected to increase for the rest of this century across most tundra and boreal regions, and also in some mountain regions, while interactions between climate and shifting vegetation will influence future fire intensity and frequency (medium confidence). {2.3.3, 3.4.1, 3.4.2, 3.4.3, SPM B.1}
B.5. A decrease in global biomass of marine animal communities, their production, and fisheries catch potential, and a shift in species composition are projected over the 21st century in ocean ecosystems from the surface to the deep seafloor under all emission scenarios (medium confidence). The rate and magnitude of decline are projected to be highest in the tropics (high confidence), whereas impacts remain diverse in polar regions (medium confidence) and increase for high emission scenarios. Ocean acidification (medium confidence), oxygen loss (medium confidence) and reduced sea ice extent (medium confidence) as well as non-climatic human activities (medium confidence) have the potential to exacerbate these warming-induced ecosystem impacts. {3.2.3, 3.3.3, 5.2.2, 5.2.3, 5.2.4, 5.4.1, Figure SPM.3}
B.5.1 Projected ocean warming and changes in net primary production alter biomass, production and community structure of marine ecosystems. The global-scale biomass of marine animals across the foodweb is projected to decrease by 15.0 ± 5.9% (very likely range) and the maximum catch potential of fisheries by 20.5–24.1% by the end of the 21st century relative to 1986–2005 under RCP8.5 (medium confidence). These changes are projected to be very likely three to four times larger under RCP8.5 than RCP2.6. {3.2.3, 3.3.3, 5.2.2, 5.2.3, 5.4.1, Figure SPM.3}
B.5.2 Under enhanced stratification reduced nutrient supply is projected to cause tropical ocean net primary production to decline by 7–16% (very likely range) for RCP8.5 by 2081–2100 (medium confidence). In tropical regions, marine animal biomass and production are projected to decrease more than the global average under all emissions scenarios in the 21st century (high confidence). Warming and sea ice changes are projected to increase marine net primary production in the Arctic (medium confidence) and around Antarctica (low confidence), modified by changing nutrient supply due to shifts in upwelling and stratification. Globally, the sinking flux of organic matter from the upper ocean is projected to decrease, linked largely due to changes in net primary production (high confidence). As a result, 95% or more of the deep sea (3000–6000 m depth) seafloor area and cold-water coral ecosystems are projected to experience declines in benthic biomass under RCP8.5 (medium confidence). {3.2.3, 5.2.2. 5.2.4, Figure SPM.1}
B.5.3 Warming, ocean acidification, reduced seasonal sea ice extent and continued loss of multi-year sea ice are projected to impact polar marine ecosystems through direct and indirect effects on habitats, populations and their viability (medium confidence). The geographical range of Arctic marine species, including marine mammals, birds and fish is projected to contract, while the range of some sub-Arctic fish communities is projected to expand, further increasing pressure on high-Arctic species (medium confidence). In the Southern Ocean, the habitat of Antarctic krill, a key prey species for penguins, seals and whales, is projected to contract southwards under both RCP2.6 and RCP8.5 (medium confidence). {3.2.2, 3.2.3, 5.2.3}
B.5.4 Ocean warming, oxygen loss, acidification and a decrease in flux of organic carbon from the surface to the deep ocean are projected to harm habitat-forming cold-water corals, which support high biodiversity, partly through decreased calcification, increased dissolution of skeletons, and bioerosion (medium confidence). Vulnerability and risks are highest where and when temperature and oxygen conditions both reach values outside species’ tolerance ranges (medium confidence). {Box 5.2, Figure SPM.3}
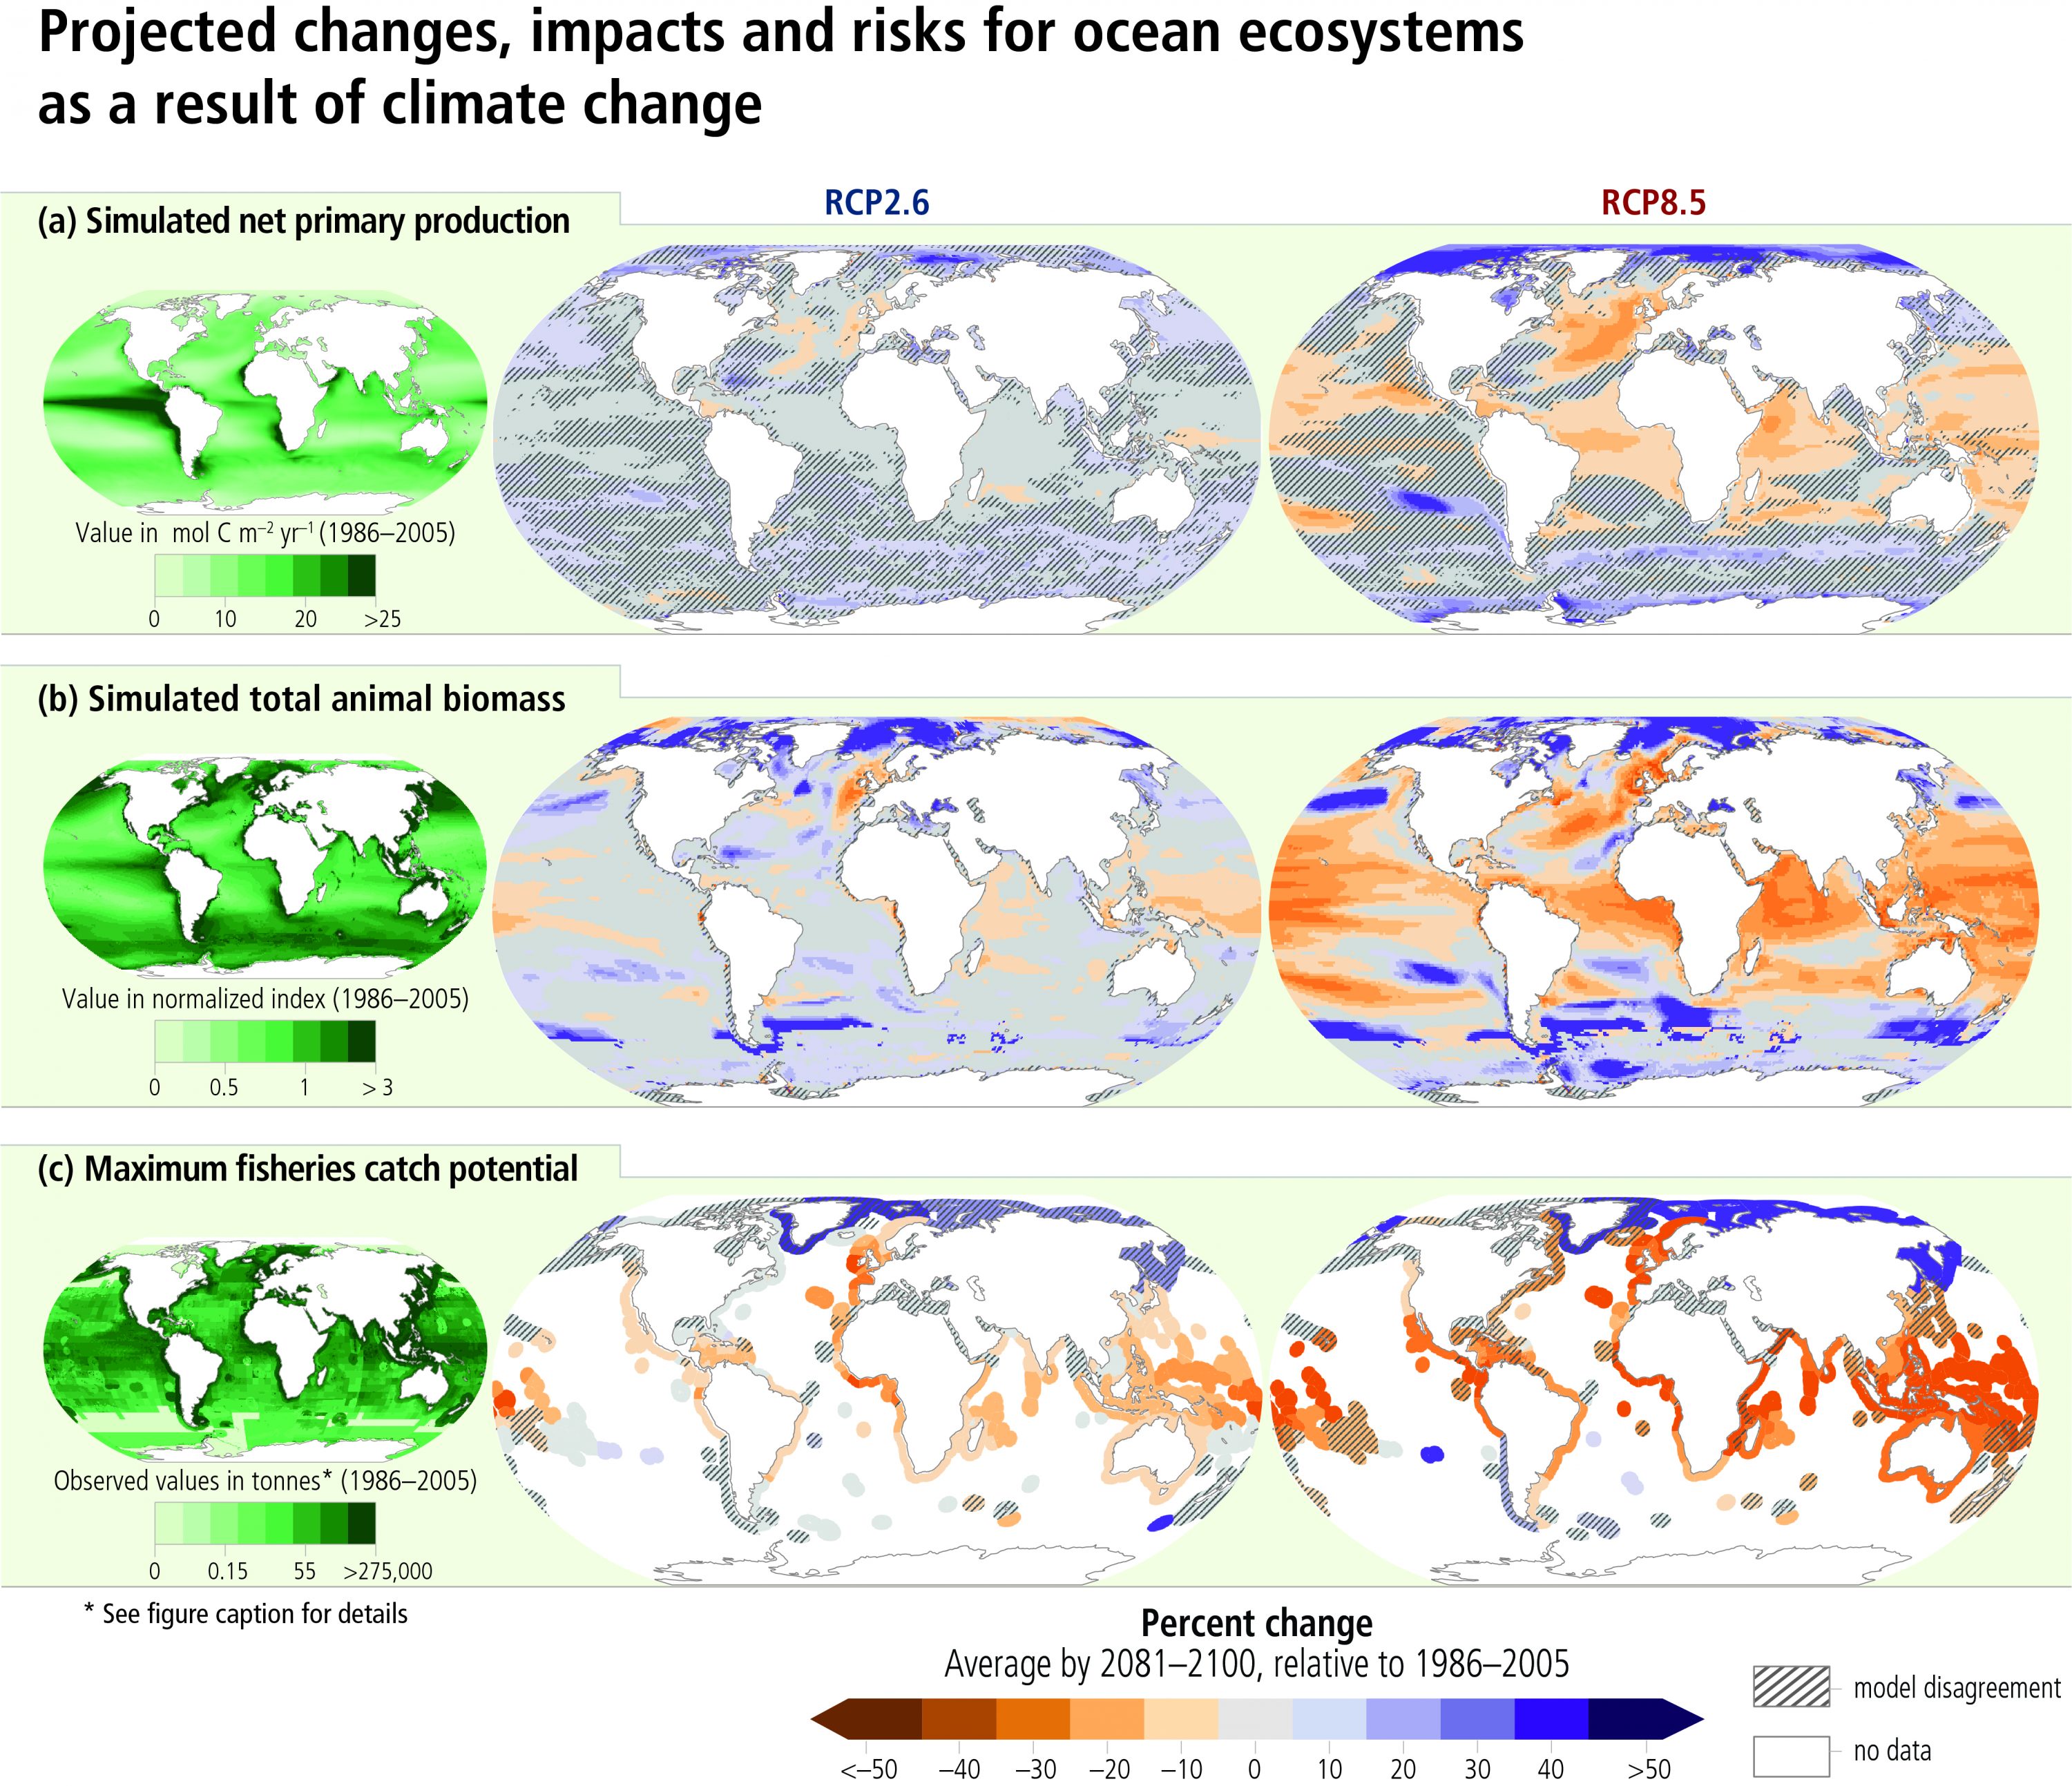
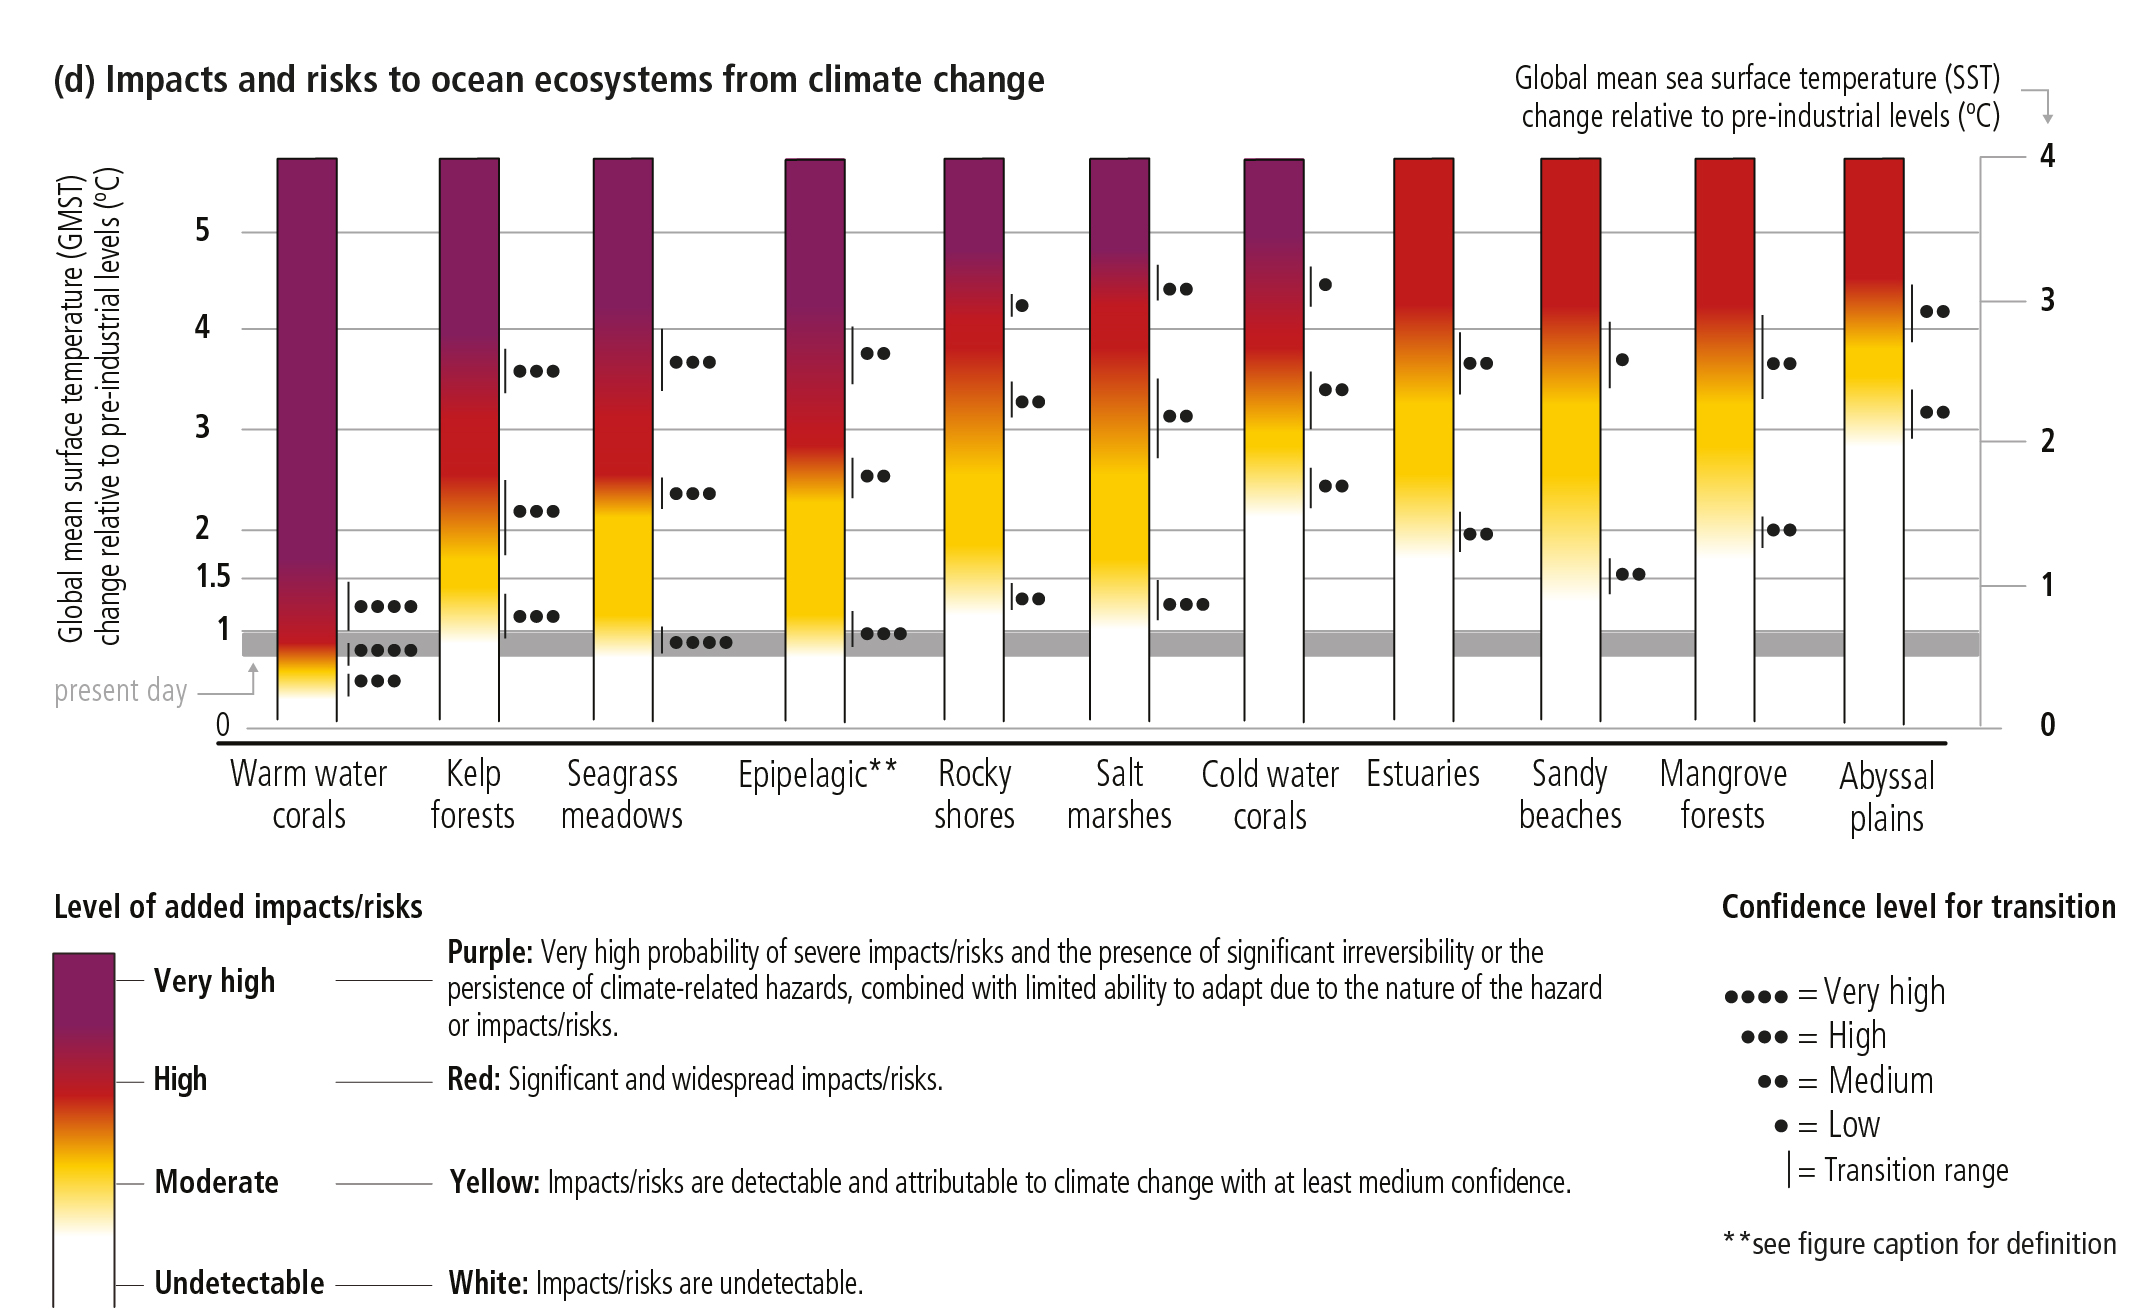
Figure SPM.3 | Projected changes, impacts and risks for ocean regions and ecosystems. (a) depth integrated net primary production (NPP from CMIP5), (b) total animal biomass (depth integrated, including fishes and invertebrates from FISHMIP), (c) maximum fisheries catch potential and (d) impacts and risks for coastal and open ocean ecosystems. The three left panels represent […]
Figure SPM.3 | Projected changes, impacts and risks for ocean regions and ecosystems. (a) depth integrated net primary production (NPP from CMIP527), (b) total animal biomass (depth integrated, including fishes and invertebrates from FISHMIP28), (c) maximum fisheries catch potential and (d) impacts and risks for coastal and open ocean ecosystems. The three left panels represent the simulated (a,b) and observed (c) mean values for the recent past (1986–2005), the middle and right panels represent projected changes (%) by 2081–2100 relative to recent past under low (RCP2.6) and high (RCP8.5) greenhouse gas emissions scenario {Box SPM.1}, respectively. Total animal biomass in the recent past (b, left panel) represents the projected total animal biomass by each spatial pixel relative to the global average. (c) *Average observed fisheries catch in the recent past (based on data from the Sea Around Us global fisheries database); projected changes in maximum fisheries catch potential in shelf seas are based on the average outputs from two fisheries and marine ecosystem models. To indicate areas of model inconsistency, shaded areas represent regions where models disagree in the direction of change for more than: (a) and (b) 3 out of 10 model projections, and (c) one out of two models. Although unshaded, the projected change in the Arctic and Antarctic regions in (b) total animal biomass and (c) fisheries catch potential have low confidence due to uncertainties associated with modelling multiple interacting drivers and ecosystem responses. Projections presented in (b) and (c) are driven by changes in ocean physical and biogeochemical conditions e.g., temperature, oxygen level, and net primary production projected from CMIP5 Earth system models. **The epipelagic refers to the uppermost part of the ocean with depth <200 m from the surface where there is enough sunlight to allow photosynthesis. (d) Assessment of risks for coastal and open ocean ecosystems based on observed and projected climate impacts on ecosystem structure, functioning and biodiversity. Impacts and risks are shown in relation to changes in Global Mean Surface Temperature (GMST) relative to pre-industrial level. Since assessments of risks and impacts are based on global mean Sea Surface Temperature (SST), the corresponding SST levels are shown29. The assessment of risk transitions is described in Chapter 5 Sections 5.2, 5.3, 5.2.5 and 5.3.7 and Supplementary Materials SM5.3, Table SM5.6, Table SM5.8 and other parts of the underlying report. The figure indicates assessed risks at approximate warming levels and increasing climate-related hazards in the ocean: ocean warming, acidification, deoxygenation, increased density stratification, changes in carbon fluxes, sea level rise, and increased frequency and/or intensity of extreme events. The assessment considers the natural adaptive capacity of the ecosystems, their exposure and vulnerability. Impact and risk levels do not consider risk reduction strategies such as human interventions, or future changes in non-climatic drivers. Risks for ecosystems were assessed by considering biological, biogeochemical, geomorphological and physical aspects. Higher risks associated with compound effects of climate hazards include habitat and biodiversity loss, changes in species composition and distribution ranges, and impacts/risks on ecosystem structure and functioning, including changes in animal/plant biomass and density, productivity, carbon fluxes, and sediment transport. As part of the assessment, literature was compiled and data extracted into a summary table. A multi-round expert elicitation process was undertaken with independent evaluation of threshold judgement, and a final consensus discussion. Further information on methods and underlying literature can be found in Chapter 5, Sections 5.2 and 5.3 and Supplementary Material. {3.2.3, 3.2.4, 5.2, 5.3, 5.2.5, 5.3.7, SM5.6, SM5.8, Figure 5.16, Cross Chapter Box 1 in Chapter 1 Table CCB1}
B.6. Risks of severe impacts on biodiversity, structure and function of coastal ecosystems are projected to be higher for elevated temperatures under high compared to low emissions scenarios in the 21st century and beyond. Projected ecosystem responses include losses of species habitat and diversity, and degradation of ecosystem functions. The capacity of organisms and ecosystems to adjust and adapt is higher at lower emissions scenarios (high confidence). For sensitive ecosystems such as seagrass meadows and kelp forests, high risks are projected if global warming exceeds 2°C above pre-industrial temperature, combined with other climate-related hazards (high confidence). Warm-water corals are at high risk already and are projected to transition to very high risk even if global warming is limited to 1.5°C (very high confidence). {4.3.3, 5.3, 5.5, Figure SPM.3}
B.6.1 All coastal ecosystems assessed are projected to face increasing risk level, from moderate to high risk under RCP2.6 to high to very high risk under RCP8.5 by 2100. Intertidal rocky shore ecosystems are projected to be at very high risk by 2100 under RCP8.5 (medium confidence) due to exposure to warming, especially during marine heatwaves, as well as to acidification, sea level rise, loss of calcifying species and biodiversity (high confidence). Ocean acidification challenges these ecosystems and further limits their habitat suitability (medium confidence) by inhibiting recovery through reduced calcification and enhanced bioerosion. The decline of kelp forests is projected to continue in temperate regions due to warming, particularly under the projected intensification of marine heatwaves, with high risk of local extinctions under RCP8.5 (medium confidence). {5.3, 5.3.5, 5.3.6, 5.3.7, 6.4.2, Figure SPM.3}
B.6.2 Seagrass meadows and saltmarshes and associated carbon stores are at moderate risk at 1.5°C global warming and increase with further warming (medium confidence). Globally, 20–90% of current coastal wetlands are projected to be lost by 2100, depending on projected sea level rise, regional differences and wetland types, especially where vertical growth is already constrained by reduced sediment supply and landward migration is constrained by steep topography or human modification of shorelines (high confidence). {4.3.3, 5.3.2, Figure SPM.3, SPM A6.1}
B.6.3 Ocean warming, sea level rise and tidal changes are projected to expand salinization and hypoxia in estuaries (high confidence) with high risks for some biota leading to migration, reduced survival, and local extinction under high emission scenarios (medium confidence). These impacts are projected to be more pronounced in more vulnerable eutrophic and shallow estuaries with low tidal range in temperate and high latitude regions (medium confidence). {5.2.2, 5.3.1, Figure SPM.3}
B.6.4 Almost all warm-water coral reefs are projected to suffer significant losses of area and local extinctions, even if global warming is limited to 1.5°C (high confidence). The species composition and diversity of remaining reef communities is projected to differ from present-day reefs (very high confidence). {5.3.4, 5.4.1, Figure SPM.3}
Projected Risks for People and Ecosystem Services
B.7. Future cryosphere changes on land are projected to affect water resources and their uses, such as hydropower (high confidence) and irrigated agriculture in and downstream of high mountain areas (medium confidence), as well as livelihoods in the Arctic (medium confidence). Changes in floods, avalanches, landslides, and ground destabilization are projected to increase risk for infrastructure, cultural, tourism, and recreational assets (medium confidence). {2.3, 2.3.1, 3.4.3}
B.7.1 Disaster risks to human settlements and livelihood options in high mountain areas and the Arctic are expected to increase (medium confidence), due to future changes in hazards such as floods, fires, landslides, avalanches, unreliable ice and snow conditions, and increased exposure of people and infrastructure (high confidence). Current engineered risk reduction approaches are projected to be less effective as hazards change in character (medium confidence). Significant risk reduction and adaptation strategies help avoid increased impacts from mountain flood and landslide hazards as exposure and vulnerability are increasing in many mountain regions during this century (high confidence). {2.3.2, 3.4.3, 3.5.2}
B.7.2 Permafrost thaw-induced subsidence of the land surface is projected to impact overlying urban and rural communication and transportation infrastructure in the Arctic and in high mountain areas (medium confidence). The majority of Arctic infrastructure is located in regions where permafrost thaw is projected to intensify by mid-century. Retrofitting and redesigning infrastructure has the potential to halve the costs arising from permafrost thaw and related climate-change impacts by 2100 (medium confidence). {2.3.4, 3.4.1, 3.4.3}
B.7.3 High mountain tourism, recreation and cultural assets are projected to be negatively affected by future cryospheric changes (high confidence). Current snowmaking technologies are projected to be less effective in reducing risks to ski tourism in a warmer climate in most parts of Europe, North America, and Japan, in particular at 2°C global warming and beyond (high confidence). {2.3.5, 2.3.6}
B.8. Future shifts in fish distribution and decreases in their abundance and fisheries catch potential due to climate change are projected to affect income, livelihoods, and food security of marine resource-dependent communities (medium confidence). Long-term loss and degradation of marine ecosystems compromises the ocean’s role in cultural, recreational, and intrinsic values important for human identity and well-being (medium confidence). {3.2.4, 3.4.3, 5.4.1, 5.4.2, 6.4}
B.8.1 Projected geographical shifts and decreases of global marine animal biomass and fish catch potential are more pronounced under RCP8.5 relative to RCP2.6 elevating the risk for income and livelihoods of dependent human communities, particularly in areas that are economically vulnerable (medium confidence). The projected redistribution of resources and abundance increases the risk of conflicts among fisheries, authorities or communities (medium confidence). Challenges to fisheries governance are widespread under RCP8.5 with regional hotspots such as the Arctic and tropical Pacific Ocean (medium confidence). {3.5.2, 5.4.1, 5.4.2, 5.5.2, 5.5.3, 6.4.2, Figure SPM.3}
B.8.2 The decline in warm-water coral reefs is projected to greatly compromise the services they provide to society, such as food provision (high confidence), coastal protection (high confidence) and tourism (medium confidence). Increases in the risks for seafood security (medium confidence) associated with decreases in seafood availability are projected to elevate the risk to nutritional health in some communities highly dependent on seafood (medium confidence), such as those in the Arctic, West Africa, and Small Island Developing States. Such impacts compound any risks from other shifts in diets and food systems caused by social and economic changes and climate change over land (medium confidence). {3.4.3, 5.4.2, 6.4.2}
B.8.3 Global warming compromises seafood safety (medium confidence) through human exposure to elevated bioaccumulation of persistent organic pollutants and mercury in marine plants and animals (medium confidence), increasing prevalence of waterborne Vibrio pathogens (medium confidence), and heightened likelihood of harmful algal blooms (medium confidence). These risks are projected to be particularly large for human communities with high consumption of seafood, including coastal Indigenous communities (medium confidence), and for economic sectors such as fisheries, aquaculture, and tourism (high confidence). {3.4.3, 5.4.2, Box 5.3}
B.8.4 Climate change impacts on marine ecosystems and their services put key cultural dimensions of lives and livelihoods at risk (medium confidence), including through shifts in the distribution or abundance of harvested species and diminished access to fishing or hunting areas. This includes potentially rapid and irreversible loss of culture and local knowledge and Indigenous knowledge, and negative impacts on traditional diets and food security, aesthetic aspects, and marine recreational activities (medium confidence). {3.4.3, 3.5.3, 5.4.2}
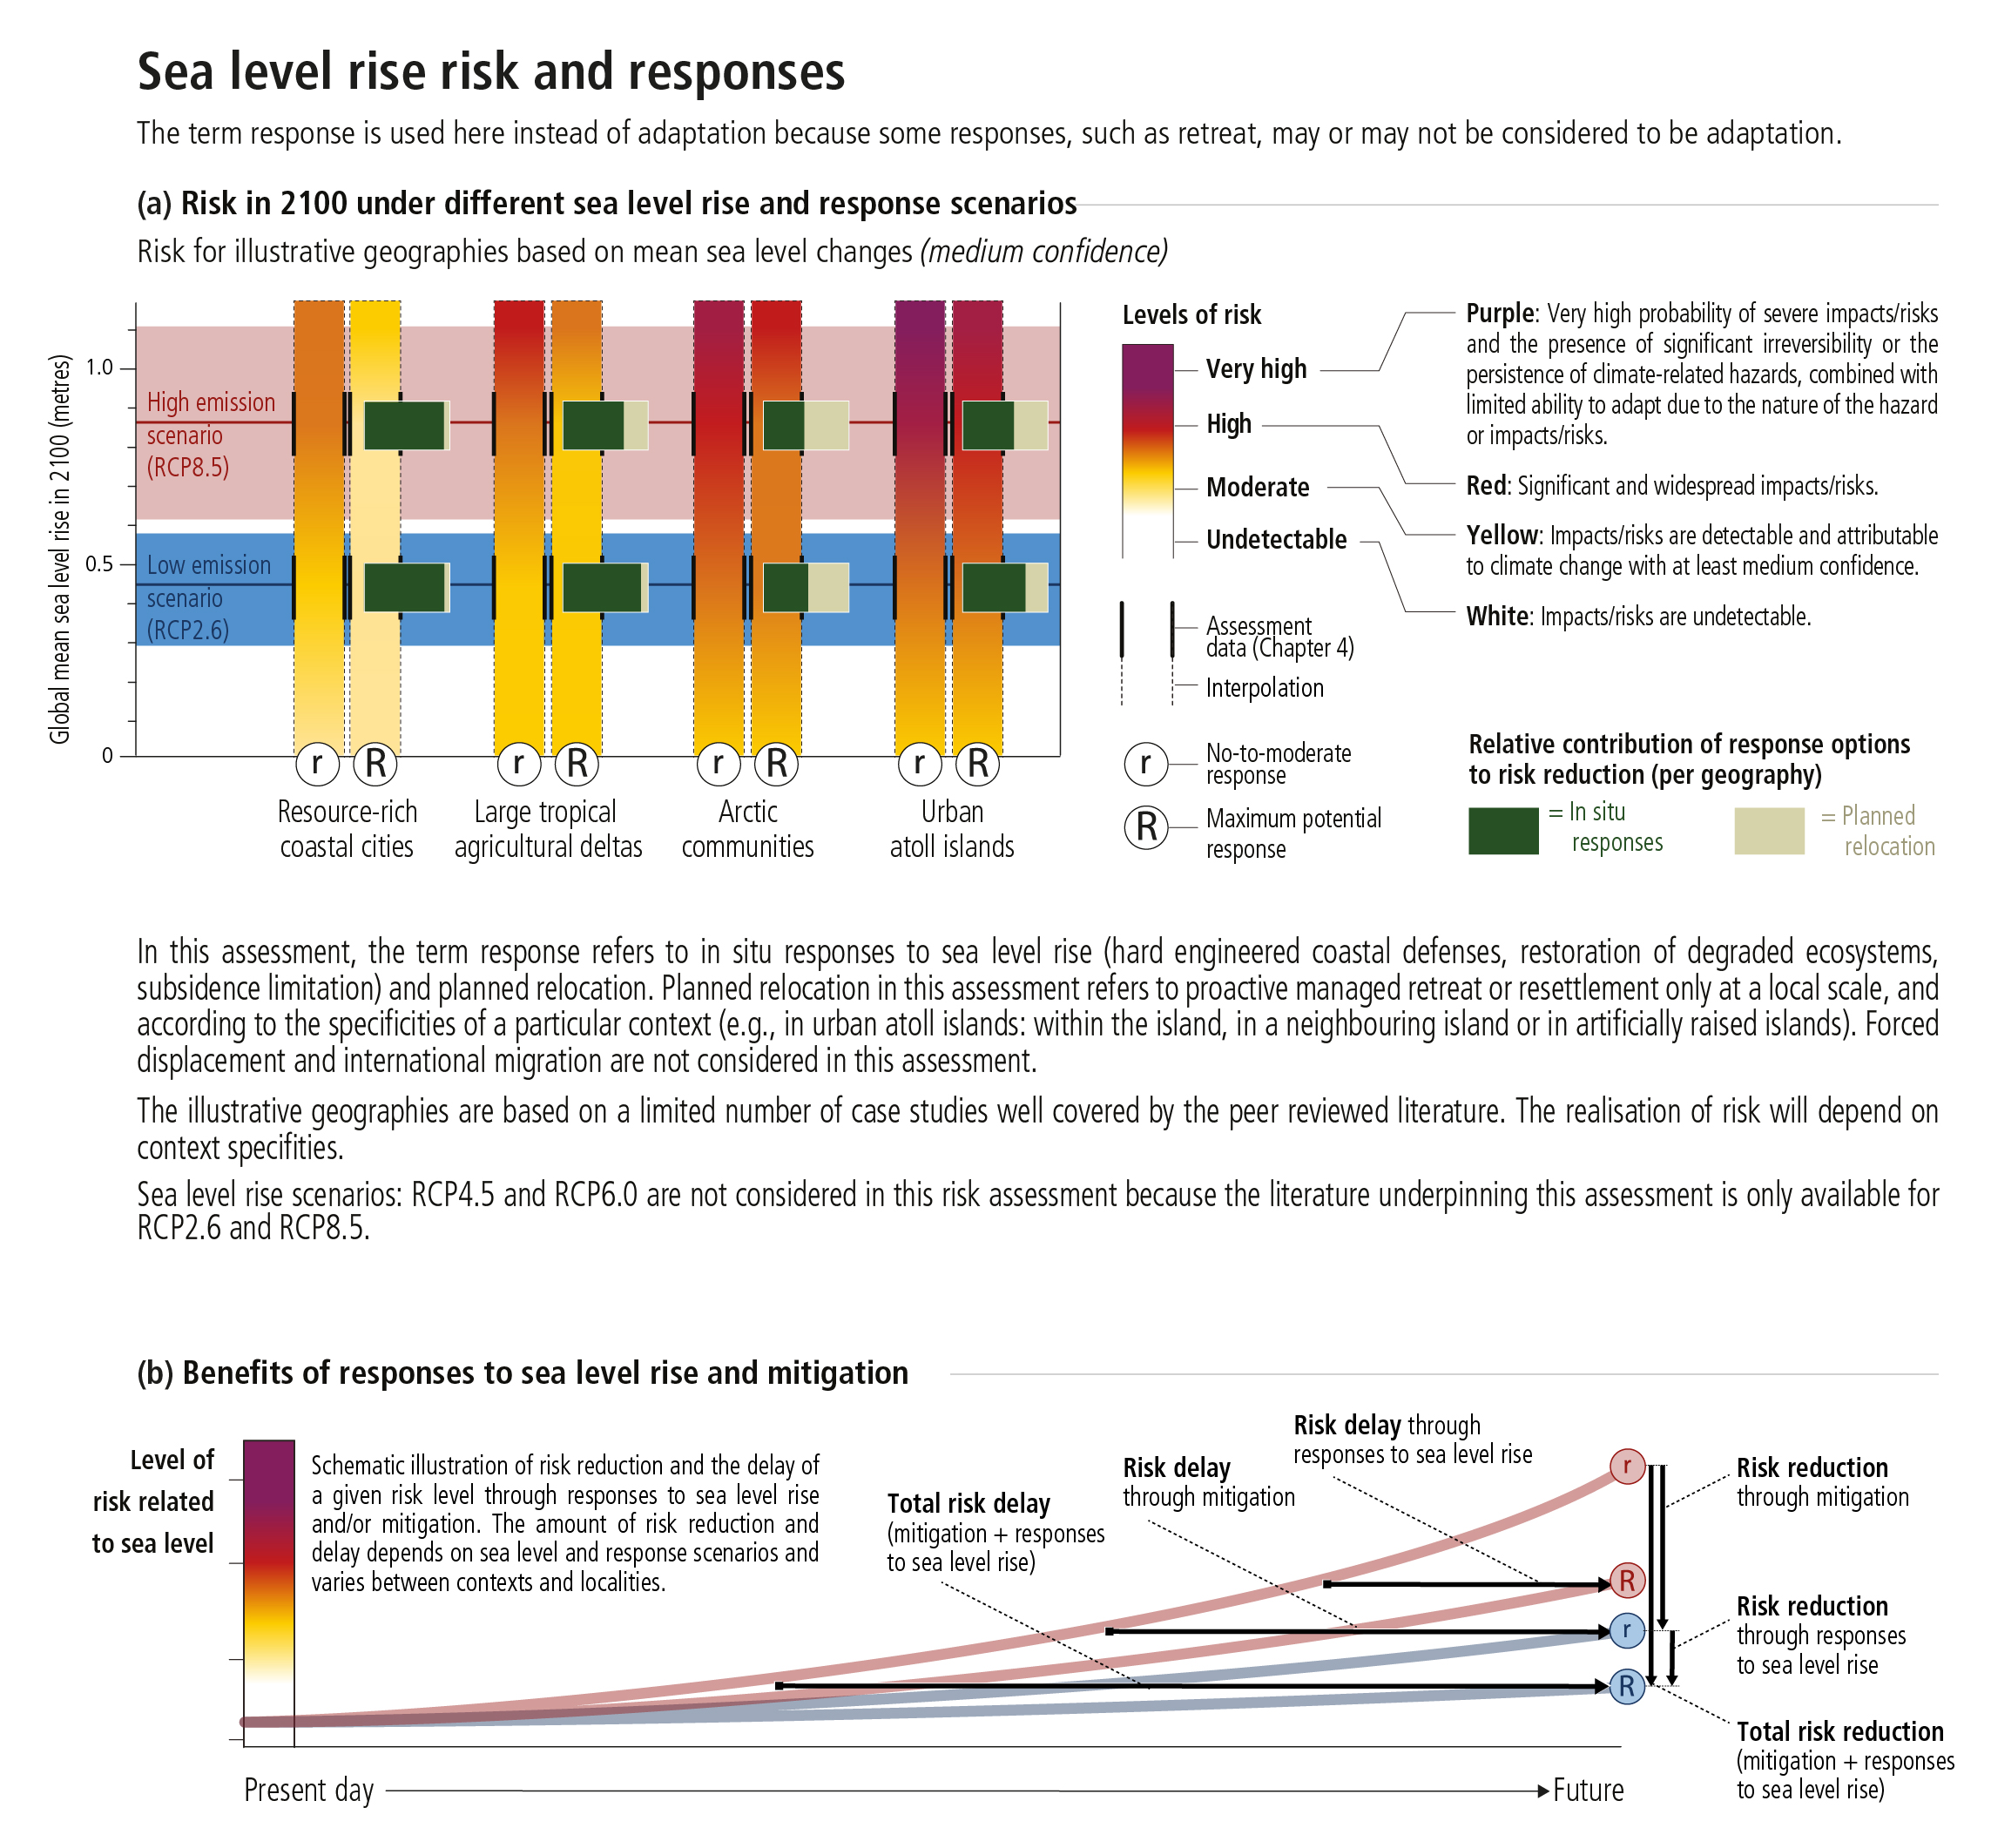
B.9. Increased mean and extreme sea level, alongside ocean warming and acidification, are projected to exacerbate risks for human communities in low-lying coastal areas (high confidence). In Arctic human communities without rapid land uplift, and in urban atoll islands, risks are projected to be moderate to high even under a low emissions scenario (RCP2.6) (medium confidence), including reaching adaptation limits (high confidence). Under a high emissions scenario (RCP8.5), delta regions and resource rich coastal cities are projected to experience moderate to high risk levels after 2050 under current adaptation (medium confidence). Ambitious adaptation including transformative governance is expected to reduce risk (high confidence), but with context-specific benefits. {4.3.3, 4.3.4, SM4.3, 6.9.2, Cross-chapter Box 9, Figure SPM.5}
B.9.1 In the absence of more ambitious adaptation efforts compared to today, and under current trends of increasing exposure and vulnerability of coastal communities, risks, such as erosion and land loss, flooding, salinization, and cascading impacts due to mean sea level rise and extreme events are projected to significantly increase throughout this century under all greenhouse gas emissions scenarios (very high confidence). Under the same assumptions, annual coastal flood damages are projected to increase by 2–3 orders of magnitude by 2100 compared to today (high confidence). {4.3.3, 4.3.4, Box 6.1, 6.8, SM4.3, Figures SPM.4, SPM.5}
B.9.2 High to very high risks are approached for vulnerable communities in coral reef environments, urban atoll islands and low-lying Arctic locations from sea level rise well before the end of this century in case of high emissions scenarios. This entails adaptation limits being reached, which are the points at which an actor’s objectives (or system needs) cannot be secured from intolerable risks through adaptive actions (high confidence). Reaching adaptation limits (e.g., biophysical, geographical, financial, technical, social, political, and institutional) depends on the emissions scenario and context-specific risk tolerance, and is projected to expand to more areas beyond 2100, due to the long-term commitment of sea level rise (medium confidence). Some island nations are likely to become uninhabitable due to climate-related ocean and cryosphere change (medium confidence), but habitability thresholds remain extremely difficult to assess. {4.3.4, 4.4.2, 4.4.3, 5.5.2, Cross-Chapter Box 9, SM4.3, SPM C.1, Glossary, Figure SPM.5}
B.9.3 Globally, a slower rate of climate-related ocean and cryosphere change provides greater adaptation opportunities (high confidence). While there is high confidence that ambitious adaptation, including governance for transformative change, has the potential to reduce risks in many locations, such benefits can vary between locations. At global scale, coastal protection can reduce flood risk by 2–3 orders of magnitude during the 21st century, but depends on investments on the order of tens to several hundreds of billions of US$ per year (high confidence). While such investments are generally cost efficient for densely populated urban areas, rural and poorer areas may be challenged to afford such investments with relative annual costs for some small island states amounting to several percent of GDP (high confidence). Even with major adaptation efforts, residual risks and associated losses are projected to occur (medium confidence), but context-specific limits to adaptation and residual risks remain difficult to assess. {4.1.3, 4.2.2.4, 4.3.1, 4.3.2, 4.3.4, 4.4.3, 6.9.1, 6.9.2, Cross-Chapter Boxes 1–2 in Chapter 1, SM4.3, Figure SPM.5}
Figure SPM.4 | The effect of regional sea level rise on extreme sea level events at coastal locations. (a) Schematic illustration of extreme sea level events and their average recurrence in the recent past (1986–2005) and the future. As a consequence of mean sea level rise, local sea levels that historically occurred once per century […]
Figure SPM.4 | The effect of regional sea level rise on extreme sea level events at coastal locations. (a) Schematic illustration of extreme sea level events and their average recurrence in the recent past (1986–2005) and the future. As a consequence of mean sea level rise, local sea levels that historically occurred once per century (historical centennial events, HCEs) are projected to recur more frequently in the future. (b) The year in which HCEs are expected to recur once per year on average under RCP8.5 and RCP2.6, at the 439 individual coastal locations where the observational record is sufficient. The absence of a circle indicates an inability to perform an assessment due to a lack of data but does not indicate absence of exposure and risk. The darker the circle, the earlier this transition is expected. The likely range is ±10 years for locations where this transition is expected before 2100. White circles (33% of locations under RCP2.6 and 10% under RCP8.5) indicate that HCEs are not expected to recur once per year before 2100. (c) An indication at which locations this transition of HCEs to annual events is projected to occur more than 10 years later under RCP2.6 compared to RCP8.5. As the scenarios lead to small differences by 2050 in many locations results are not shown here for RCP4.5 but they are available in Chapter 4. {4.2.3, Figure 4.10, Figure 4.12}
C
Implementing responses to ocean and cryosphere change
Share
Challenges
C.1. Impacts of climate-related changes in the ocean and cryosphere increasingly challenge current governance efforts to develop and implement adaptation responses from local to global scales, and in some cases pushing them to their limits. People with the highest exposure and vulnerability are often those with lowest capacity to respond (high confidence). {1.5, 1.7, Cross-Chapter Boxes 2–3 in Chapter 1, 2.3.1, 2.3.2, 2.3.3, 2.4, 3.2.4, 3.4.3, 3.5.2, 3.5.3, 4.1, 4.3.3, 4.4.3, 5.5.2, 5.5.3, 6.9}
C.1.1 The temporal scales of climate change impacts in ocean and cryosphere and their societal consequences operate on time horizons which are longer than those of governance arrangements (e.g., planning cycles, public and corporate decision making cycles, and financial instruments). Such temporal differences challenge the ability of societies to adequately prepare for and respond to long-term changes including shifts in the frequency and intensity of extreme events (high confidence). Examples include changing landslides and floods in high mountain regions and risks to important species and ecosystems in the Arctic, as well as to low-lying nations and islands, small island nations, other coastal regions and to coral reef ecosystems. {2.3.2, 3.5.2, 3.5.4, 4.4.3, 5.2, 5.3, 5.4, 5.5.1, 5.5.2, 5.5.3, 6.9}
C.1.2 Governance arrangements (e.g., marine protected areas, spatial plans and water management systems) are, in many contexts, too fragmented across administrative boundaries and sectors to provide integrated responses to the increasing and cascading risks from climate-related changes in the ocean and/or cryosphere (high confidence). The capacity of governance systems in polar and ocean regions to respond to climate change impacts has strengthened recently, but this development is not sufficiently rapid or robust to adequately address the scale of increasing projected risks (high confidence). In high mountains, coastal regions and small islands, there are also difficulties in coordinating climate adaptation responses, due to the many interactions of climatic and non-climatic risk drivers (such as inaccessibility, demographic and settlement trends, or land subsidence caused by local activities) across scales, sectors and policy domains (high confidence). {2.3.1, 3.5.3, 4.4.3, 5.4.2, 5.5.2, 5.5.3, Box 5.6, 6.9, Cross-Chapter Box 3 in Chapter 1}
C.1.3 There are a broad range of identified barriers and limits for adaptation to climate change in ecosystems (high confidence). Limitations include the space that ecosystems require, non-climatic drivers and human impacts that need to be addressed as part of the adaptation response, the lowering of adaptive capacity of ecosystems because of climate change, and the slower ecosystem recovery rates relative to the recurrence of climate impacts, availability of technology, knowledge and financial support, and existing governance arrangements (medium confidence). {3.5.4, 5.5.2}
C.1.4 Financial, technological, institutional and other barriers exist for implementing responses to current and projected negative impacts of climate-related changes in the ocean and cryosphere, impeding resilience building and risk reduction measures (high confidence). Whether such barriers reduce adaptation effectiveness or correspond to adaptation limits depends on context specific circumstances, the rate and scale of climate changes and on the ability of societies to turn their adaptive capacity into effective adaptation responses. Adaptive capacity continues to differ between as well as within communities and societies (high confidence). People with highest exposure and vulnerability to current and future hazards from ocean and cryosphere changes are often also those with lowest adaptive capacity, particularly in low-lying islands and coasts, Arctic and high mountain regions with development challenges (high confidence). {2.3.1, 2.3.2, 2.3.7, Box 2.4, 3.5.2, 4.3.4, 4.4.2, 4.4.3, 5.5.2, 6.9, Cross-Chapter Boxes 2 and 3 in Chapter 1, Cross-Chapter Box 9}
Strengthening Response Options
C.2. The far-reaching services and options provided by ocean and cryosphere-related ecosystems can be supported by protection, restoration, precautionary ecosystem-based management of renewable resource use, and the reduction of pollution and other stressors (high confidence). Integrated water management (medium confidence) and ecosystem-based adaptation (high confidence) approaches lower climate risks locally and provide multiple societal benefits. However, ecological, financial, institutional and governance constraints for such actions exist (high confidence), and in many contexts ecosystem-based adaptation will only be effective under the lowest levels of warming (high confidence). {2.3.1, 2.3.3, 3.2.4, 3.5.2, 3.5.4, 4.4.2, 5.2.2, 5.4.2, 5.5.1, 5.5.2, Figure SPM.5}
C.2.1 Networks of protected areas help maintain ecosystem services, including carbon uptake and storage, and enable future ecosystem-based adaptation options by facilitating the poleward and altitudinal movements of species, populations, and ecosystems that occur in response to warming and sea level rise (medium confidence). Geographic barriers, ecosystem degradation, habitat fragmentation and barriers to regional cooperation limit the potential for such networks to support future species range shifts in marine, high mountain and polar land regions. (high confidence). {2.3.3, 3.2.3, 3.3.2, 3.5.4, 5.5.2, Box 3.4}
C.2.2 Terrestrial and marine habitat restoration, and ecosystem management tools such as assisted species relocation and coral gardening, can be locally effective in enhancing ecosystem-based adaptation (high confidence). Such actions are most successful when they are community-supported, are science-based whilst also using local knowledge and Indigenous knowledge, have long-term support that includes the reduction or removal of non-climatic stressors, and under the lowest levels of warming (high confidence). For example, coral reef restoration options may be ineffective if global warming exceeds 1.5°C, because corals are already at high risk (very high confidence) at current levels of warming. {2.3.3, 4.4.2, 5.3.7, 5.5.1, 5.5.2, Box 5.5, Figure SPM.3}
C.2.3 Strengthening precautionary approaches, such as rebuilding overexploited or depleted fisheries, and responsiveness of existing fisheries management strategies reduces negative climate change impacts on fisheries, with benefits for regional economies and livelihoods (medium confidence). Fisheries management that regularly assesses and updates measures over time, informed by assessments of future ecosystem trends, reduces risks for fisheries (medium confidence) but has limited ability to address ecosystem change. {3.2.4, 3.5.2, 5.4.2, 5.5.2, 5.5.3, Figure SPM.5}
C.2.4 Restoration of vegetated coastal ecosystems, such as mangroves, tidal marshes and seagrass meadows (coastal ‘blue carbon’ ecosystems), could provide climate change mitigation through increased carbon uptake and storage of around 0.5% of current global emissions annually (medium confidence). Improved protection and management can reduce carbon emissions from these ecosystems. Together, these actions also have multiple other benefits, such as providing storm protection, improving water quality, and benefiting biodiversity and fisheries (high confidence). Improving the quantification of carbon storage and greenhouse gas fluxes of these coastal ecosystems will reduce current uncertainties around measurement, reporting and verification (high confidence). {Box 4.3, 5.4, 5.5.1, 5.5.2, Annex I: Glossary}
C.2.5 Ocean renewable energy can support climate change mitigation, and can comprise energy extraction from offshore winds, tides, waves, thermal and salinity gradient and algal biofuels. The emerging demand for alternative energy sources is expected to generate economic opportunities for the ocean renewable energy sector (high confidence), although their potential may also be affected by climate change (low confidence). {5.4.2, 5.5.1, Figure 5.23}
C.2.6 Integrated water management approaches across multiple scales can be effective at addressing impacts and leveraging opportunities from cryosphere changes in high mountain areas. These approaches also support water resource management through the development and optimization of multi-purpose storage and release of water from reservoirs (medium confidence), with consideration of potentially negative impacts to ecosystems and communities. Diversification of tourism activities throughout the year supports adaptation in high mountain economies (medium confidence). {2.3.1, 2.3.5}
C.3. Coastal communities face challenging choices in crafting context-specific and integrated responses to sea level rise that balance costs, benefits and trade-offs of available options and that can be adjusted over time (high confidence). All types of options, including protection, accommodation, ecosystem-based adaptation, coastal advance and retreat, wherever possible, can play important roles in such integrated responses (high confidence). {4.4.2, 4.4.3, 4.4.4, 6.9.1, Cross-Chapter Box 9, Figure SPM.5}
C.3.1. The higher the sea levels rise, the more challenging is coastal protection, mainly due to economic, financial and social barriers rather than due to technical limits (high confidence). In the coming decades, reducing local drivers of exposure and vulnerability such as coastal urbanization and human-induced subsidence constitute effective responses (high confidence). Where space is limited, and the value of exposed assets is high (e.g., in cities), hard protection (e.g., dikes) is likely to be a cost-efficient response option during the 21st century taking into account the specifics of the context (high confidence), but resource-limited areas may not be able to afford such investments. Where space is available, ecosystem-based adaptation can reduce coastal risk and provide multiple other benefits such as carbon storage, improved water quality, biodiversity conservation and livelihood support (medium confidence). {4.3.2, 4.4.2, Box 4.1, Cross-Chapter Box 9, Figure SPM.5}
C.3.2 Some coastal accommodation measures, such as early warning systems and flood-proofing of buildings, are often both low cost and highly cost-efficient under current sea levels (high confidence). Under projected sea level rise and increase in coastal hazards some of these measures become less effective unless combined with other measures (high confidence). All types of options, including protection, accommodation, ecosystem-based adaptation, coastal advance and planned relocation, if alternative localities are available, can play important roles in such integrated responses (high confidence). Where the community affected is small, or in the aftermath of a disaster, reducing risk by coastal planned relocations is worth considering if safe alternative localities are available. Such planned relocation can be socially, culturally, financially and politically constrained (very high confidence). {4.4.2, Box 4.1, Cross-Chapter Box 9, SPM B3}
C.3.3 Responses to sea level rise and associated risk reduction present society with profound governance challenges, resulting from the uncertainty about the magnitude and rate of future sea level rise, vexing trade-offs between societal goals (e.g., safety, conservation, economic development, intra- and inter-generational equity), limited resources, and conflicting interests and values among diverse stakeholders (high confidence). These challenges can be eased using locally appropriate combinations of decision analysis, land-use planning, public participation, diverse knowledge systems and conflict resolution approaches that are adjusted over time as circumstances change (high confidence). {Cross-Chapter Box 5 in Chapter 1, 4.4.3, 4.4.4, 6.9}
C.3.4 Despite the large uncertainties about the magnitude and rate of post 2050 sea level rise, many coastal decisions with time horizons of decades to over a century are being made now (e.g., critical infrastructure, coastal protection works, city planning) and can be improved by taking relative sea level rise into account, favouring flexible responses (i.e., those that can be adapted over time) supported by monitoring systems for early warning signals, periodically adjusting decisions (i.e., adaptive decision making), using robust decision-making approaches, expert judgement, scenario-building, and multiple knowledge systems (high confidence). The sea level rise range that needs to be considered for planning and implementing coastal responses depends on the risk tolerance of stakeholders. Stakeholders with higher risk tolerance (e.g., those planning for investments that can be very easily adapted to unforeseen conditions) often prefer to use the likely range of projections, while stakeholders with a lower risk tolerance (e.g., those deciding on critical infrastructure) also consider global and local mean sea level above the upper end of the likely range (globally 1.1 m under RCP8.5 by 2100) and from methods characterised by lower confidence such as from expert elicitation. {1.8.1, 1.9.2, 4.2.3, 4.4.4, Figure 4.2, Cross-Chapter Box 5 in Chapter 1, Figure SPM.5, SPM B3}
Figure SPM.5 | Sea level rise risks and responses. The term response is used here instead of adaptation because some responses, such as retreat, may or may not be considered to be adaptation. (a) shows the combined risk of coastal flooding, erosion and salinization for illustrative geographies in 2100, due to changing mean and extreme […]
Figure SPM.5 | Sea level rise risks and responses. The term response is used here instead of adaptation because some responses, such as retreat, may or may not be considered to be adaptation. (a) shows the combined risk of coastal flooding, erosion and salinization for illustrative geographies in 2100, due to changing mean and extreme sea levels under RCP2.6 and RCP8.5 and under two response scenarios. Risks under RCPs 4.5 and 6.0 were not assessed due to a lack of literature for the assessed geographies. The assessment does not account for changes in extreme sea level beyond those directly induced by mean sea level rise; risk levels could increase if other changes in extreme sea levels were considered (e.g., due to changes in cyclone intensity). Panel a) considers a socioeconomic scenario with relatively stable coastal population density over the century. {SM4.3.2} Risks to illustrative geographies have been assessed based on relative sea level changes projected for a set of specific examples: New York City, Shanghai and Rotterdam for resource-rich coastal cities covering a wide range of response experiences; South Tarawa, Fongafale and Male’ for urban atoll islands; Mekong and Ganges-Brahmaputra-Meghna for large tropical agricultural deltas; and Bykovskiy, Shishmaref, Kivalina, Tuktoyaktuk and Shingle Point for Arctic communities located in regions remote from rapid glacio-isostatic adjustment. {4.2, 4.3.4, SM4.2} The assessment distinguishes between two contrasting response scenarios. “No-to-moderate response” describes efforts as of today (i.e., no further significant action or new types of actions). “Maximum potential response” represents a combination of responses implemented to their full extent and thus significant additional efforts compared to today, assuming minimal financial, social and political barriers. The assessment has been conducted for each sea level rise and response scenario, as indicated by the burning embers in the figure; in-between risk levels are interpolated. {4.3.3} The assessment criteria include exposure and vulnerability (density of assets, level of degradation of terrestrial and marine buffer ecosystems), coastal hazards (flooding, shoreline erosion, salinization), in-situ responses (hard engineered coastal defenses, ecosystem restoration or creation of new natural buffers areas, and subsidence management) and planned relocation. Planned relocation refers to managed retreat or resettlement as described in Chapter 4, i.e., proactive and local-scale measures to reduce risk by relocating people, assets and infrastructure. Forced displacement is not considered in this assessment. Panel a) also highlights the relative contributions of in-situ responses and planned relocation to the total risk reduction. (b) schematically illustrates the risk reduction (vertical arrows) and risk delay (horizontal arrows) through mitigation and/or responses to sea level rise. (c) summarizes and assesses responses to sea level rise in terms of their effectiveness, costs, co-benefits, drawbacks, economic efficiency and associated governance challenges. {4.4.2} (d) presents generic steps of an adaptive decision-making approach, as well as key enabling conditions for responses to sea level rise. {4.4.4, 4.4.5}
Enabling Conditions
C.4. Enabling climate resilience and sustainable development depends critically on urgent and ambitious emissions reductions coupled with coordinated sustained and increasingly ambitious adaptation actions (very high confidence). Key enablers for implementing effective responses to climate-related changes in the ocean and cryosphere include intensifying cooperation and coordination among governing authorities across spatial scales and planning horizons. Education and climate literacy, monitoring and forecasting, use of all available knowledge sources, sharing of data, information and knowledge, finance, addressing social vulnerability and equity, and institutional support are also essential. Such investments enable capacity-building, social learning, and participation in context-specific adaptation, as well as the negotiation of trade-offs and realisation of co-benefits in reducing short-term risks and building long-term resilience and sustainability (high confidence). This report reflects the state of science for ocean and cryosphere for low levels of global warming (1.5°C), as also assessed in earlier IPCC and IPBES reports. {1.1, 1.5, 1.8.3, 2.3.1, 2.3.2, 2.4, Figure 2.7, 2.5, 3.5.2, 3.5.4, 4.4, 5.2.2, Box 5.3, 5.4.2, 5.5.2, 6.4.3, 6.5.3, 6.8, 6.9, Cross-Chapter Box 9, Figure SPM.5}
C.4.1 In light of observed and projected changes in the ocean and cryosphere, many nations will face challenges to adapt, even with ambitious mitigation (very high confidence). In a high emissions scenario, many ocean- and cryosphere-dependent communities are projected to face adaptation limits (e.g. biophysical, geographical, financial, technical, social, political and institutional) during the second half of the 21st century. Low emission pathways, for comparison, limit the risks from ocean and cryosphere changes in this century and beyond and enable more effective responses (high confidence), whilst also creating co-benefits. Profound economic and institutional transformative change will enable Climate Resilient Development Pathways in the ocean and cryosphere context (high confidence). {1.1, 1.4–1.7, Cross-Chapter Boxes 1–3 in Chapter 1, 2.3.1, 2.4, Box 3.2, Figure 3.4, Cross-Chapter Box 7 in Chapter 3, 3.4.3, 4.2.2, 4.2.3, 4.3.4, 4.4.2, 4.4.3, 4.4.6, 5.4.2, 5.5.3, 6.9.2, Cross-Chapter Box 9, Figure SPM.5}
C.4.2 Intensifying cooperation and coordination among governing authorities across scales, jurisdictions, sectors, policy domains and planning horizons can enable effective responses to changes in the ocean, cryosphere and to sea level rise (high confidence). Regional cooperation, including treaties and conventions, can support adaptation action; however, the extent to which responding to impacts and losses arising from changes in the ocean and cryosphere is enabled through regional policy frameworks is currently limited (high confidence). Institutional arrangements that provide strong multiscale linkages with local and Indigenous communities benefit adaptation (high confidence). Coordination and complementarity between national and transboundary regional policies can support efforts to address risks to resource security and management, such as water and fisheries (medium confidence). {2.3.1, 2.3.2, 2.4, Box 2.4, 2.5, 3.5.2, 3.5.3, 3.5.4, 4.4.4, 4.4.5, Table 4.9, 5.5.2, 6.9.2}
C.4.3 Experience to date – for example, in responding to sea level rise, water-related risks in some high mountains, and climate change risks in the Arctic – also reveal the enabling influence of taking a long-term perspective when making short-term decisions, explicitly accounting for uncertainty of context-specific risks beyond 2050 (high confidence), and building governance capabilities to tackle complex risks (medium confidence). {2.3.1, 3.5.4, 4.4.4, 4.4.5, Table 4.9, 5.5.2, 6.9, Figure SPM.5}
C.4.4 Investments in education and capacity building at various levels and scales facilitates social learning and long-term capability for context-specific responses to reduce risk and enhance resilience (high confidence). Specific activities include utilization of multiple knowledge systems and regional climate information into decision making, and the engagement of local communities, Indigenous peoples, and relevant stakeholders in adaptive governance arrangements and planning frameworks (medium confidence). Promotion of climate literacy and drawing on local, Indigenous and scientific knowledge systems enables public awareness, understanding and social learning about locality-specific risk and response potential (high confidence). Such investments can develop, and in many cases transform existing institutions and enable informed, interactive and adaptive governance arrangements (high confidence). {1.8.3, 2.3.2, Figure 2.7, Box 2.4, 2.4, 3.5.2, 3.5.4, 4.4.4, 4.4.5, Table 4.9, 5.5.2, 6.9}
C.4.5 Context-specific monitoring and forecasting of changes in the ocean and the cryosphere informs adaptation planning and implementation, and facilitates robust decisions on trade-offs between short- and long-term gains (medium confidence). Sustained long-term monitoring, sharing of data, information and knowledge and improved context-specific forecasts, including early warning systems to predict more extreme El Niño/La Niña events, tropical cyclones, and marine heatwaves, help to manage negative impacts from ocean changes such as losses in fisheries, and adverse impacts on human health, food security, agriculture, coral reefs, aquaculture, wildfire, tourism, conservation, drought and flood (high confidence). {2.4, 2.5, 3.5.2, 4.4.4, 5.5.2, 6.3.1, 6.3.3, 6.4.3, 6.5.3, 6.9}
C.4.6 Prioritising measures to address social vulnerability and equity underpins efforts to promote fair and just climate resilience and sustainable development (high confidence), and can be helped by creating safe community settings for meaningful public participation, deliberation and conflict resolution (medium confidence). {Box 2.4, 4.4.4, 4.4.5, Table 4.9, Figure SPM.5}
C.4.7 This assessment of the ocean and cryosphere in a changing climate reveals the benefits of ambitious mitigation and effective adaptation for sustainable development and, conversely, the escalating costs and risks of delayed action. The potential to chart Climate Resilient Development Pathways varies within and among ocean, high mountain and polar land regions. Realising this potential depends on transformative change. This highlights the urgency of prioritising timely, ambitious, coordinated and enduring action. (very high confidence) {1.1, 1.8, Cross-Chapter Box 1 in Chapter 1, 2.3, 2.4, 3.5, 4.2.1, 4.2.2, 4.3.4, 4.4, Table 4.9, 5.5, 6.9, Cross-Chapter Box 9, Figure SPM.5}
+
Citation
Share
This Summary for Policymakers should be cited as:
IPCC, 2019: Summary for Policymakers. In: IPCC Special Report on the Ocean and Cryosphere in a Changing Climate [H.-O. Pörtner, D.C. Roberts, V. Masson-Delmotte, P. Zhai, M. Tignor, E. Poloczanska, K. Mintenbeck, A. Alegría, M. Nicolai, A. Okem, J. Petzold, B. Rama, N.M. Weyer (eds.)]. In press.
Footnotes
The cryosphere is defined in this report (Annex I: Glossary) as the components of the Earth System at and below the land and ocean surface that are frozen, including snow cover, glaciers, ice sheets, ice shelves, icebergs, sea ice, lake ice, river ice, permafrost, and seasonally frozen ground.
↩
The decision to prepare a Special Report on Climate Change and Oceans and the Cryosphere was made at the Forty-Third Session of the IPCC in Nairobi, Kenya, 11-13 April 2016.
↩
Cut-off dates: 15 October 2018 for manuscript submission, 15 May 2019 for acceptance for publication.
↩
The SROCC is produced under the scientific leadership of Working Group I and Working Group II. In line with the approved outline, mitigation options (Working Group III) are not assessed with the exception of the mitigation potential of blue carbon (coastal ecosystems).
↩
The full titles of these two Special Reports are: “Global Warming of 1.5°C. An IPCC special report on the impacts of global warming of 1.5°C above pre-industrial levels and related global greenhouse gas emission pathways, in the context of strengthening the global response to the threat of climate change, sustainable development, and efforts to eradicate poverty”; “Climate Change and Land: an IPCC special report on climate change, desertification, land degradation, sustainable land management, food security, and greenhouse gas fluxes in terrestrial ecosystems”.
↩
Each finding is grounded in an evaluation of underlying evidence and agreement. A level of confidence is expressed using five qualifiers: very low, low, medium, high and very high, and typeset in italics, e.g., medium confidence. The following terms have been used to indicate the assessed likelihood of an outcome or a result: virtually certain 99–100% probability, very likely 90–100%, likely 66–100%, about as likely as not 33–66%, unlikely 0–33%, very unlikely 0–10%, exceptionally unlikely 0–1%. Assessed likelihood is typeset in italics, e.g., very likely. This is consistent with AR5 and the other AR6 Special Reports. Additional terms (extremely likely 95–100%, more likely than not >50–100%, more unlikely than likely 0–<50%, extremely unlikely 0–5%) are used when appropriate. This Report also uses the term ‘likely range’ or ‘very likely range’ to indicate that the assessed likelihood of an outcome lies within the 17-83% or 5-95% probability range. {1.9.2, Figure 1.4}
↩
High mountain areas include all mountain regions where glaciers, snow or permafrost are prominent features of the landscape. For a list of high mountain regions covered in this report, see Chapter 2. Population in high mountain regions is calculated for areas less than 100 kilometres from glaciers or permafrost in high mountain areas assessed in this report. {2.1} Projections for 2050 give the range of population in these regions across all five of the Shared Socioeconomic Pathways. {Cross-Chapter Box 1 in Chapter 1}
↩
Population in the low elevation coastal zone is calculated for land areas connected to the coast, including small island states, that are less than 10 metres above sea level. {Cross-Chapter Box 9} Projections for 2050 give the range of population in these regions across all five of the Shared Socioeconomic Pathways. {Cross-Chapter Box 1 in Chapter 1}
↩
360 Gt ice corresponds to 1 mm of global mean sea level
↩
This does not imply that the changes started in 1950. Changes in some variables have occurred since the pre-industrial period.
↩
This scaling factor (global-mean ocean expansion as sea level rise in metres per unit heat) varies by about 10% between different models, and it will systematically increase by about 10% by 2100 under RCP8.5 forcing due to ocean warming increasing the average thermal expansion coefficient. {4.2.1, 4.2.2, 5.2.2}
↩
Antarctic sea ice is not shown here due to low confidence in future projections. {3.2.2}
↩
CMIP5 is Phase 5 of the Coupled Model Intercomparison Project (Annex I: Glossary).
↩
A pathway with lower emissions (RCP1.9), which would correspond to a lower level of projected warming than RCP2.6, was not part of CMIP5.
↩
In some instances this report assesses changes relative to 2006–2015. The warming from the 1850–1900 period until 2006–2015 has been assessed as 0.87°C (0.75 to 0.99°C likely range). {Cross-Chapter Box 1 in Chapter 1}
↩
ZJ is Zettajoule and is equal to 1021 Joules. Warming the entire ocean by 1°C requires about 5500 ZJ; 144 ZJ would warm the top 100 m by about 1°C.
↩
A marine heatwave is a period of extreme warm near-sea surface temperature that persists for days to months and can extend up to thousands of kilometres (Annex I: Glossary).
↩
In this report density stratification is defined as the density contrast between shallower and deeper layers. Increased stratification reduces the vertical exchange of heat, salinity, oxygen, carbon, and nutrients.
↩
Based on in-situ records longer than fifteen years.
↩
The Atlantic Meridional Overturning Circulation (AMOC) is the main current system in the South and North Atlantic Oceans (Annex I: Glossary).
↩
The total rate of sea level rise is greater than the sum of cryosphere and ocean contributions due to uncertainties in the estimate of landwater storage change.
↩
The recovery time scale is hundreds to thousands of years (Annex I: Glossary).
↩
Marginal seas are not assessed individually as ocean regions in this report.
↩
This report primarily uses RCP2.6 and RCP8.5 for the following reasons: These scenarios largely represent the assessed range for the topics covered in this report; they largely represent what is covered in the assessed literature, based on CMIP5; and they allow a consistent narrative about projected changes. RCP4.5 and RCP6.0 are not available for all topics addressed in the report. {Box SPM.1}
↩
For context, total annual anthropogenic CO2 emissions were 10.8 ± 0.8 GtC yr–1 (39.6 ± 2.9 GtCO2 yr–1) on average over the period 2008–2017. Total annual anthropogenic methane emissions were 0.35 ± 0.01 GtCH4 yr–1, on average over the period 2003–2012. {5.5.1}
↩
NPP is estimated from the Coupled Models Intercomparison Project 5 (CMIP5).
↩
Total animal biomass is from the Fisheries and Marine Ecosystem Models Intercomparison Project (FISHMIP).
↩
The conversion between GMST and SST is based on a scaling factor of 1.44 derived from changes in an ensemble of RCP8.5 simulations; this scaling factor has an uncertainty of about 4 % due to differences between the RCP2.6 and RCP8.5 scenarios. {Table SPM.1}
↩