SROCC_SPM3(d)_Final_RGB
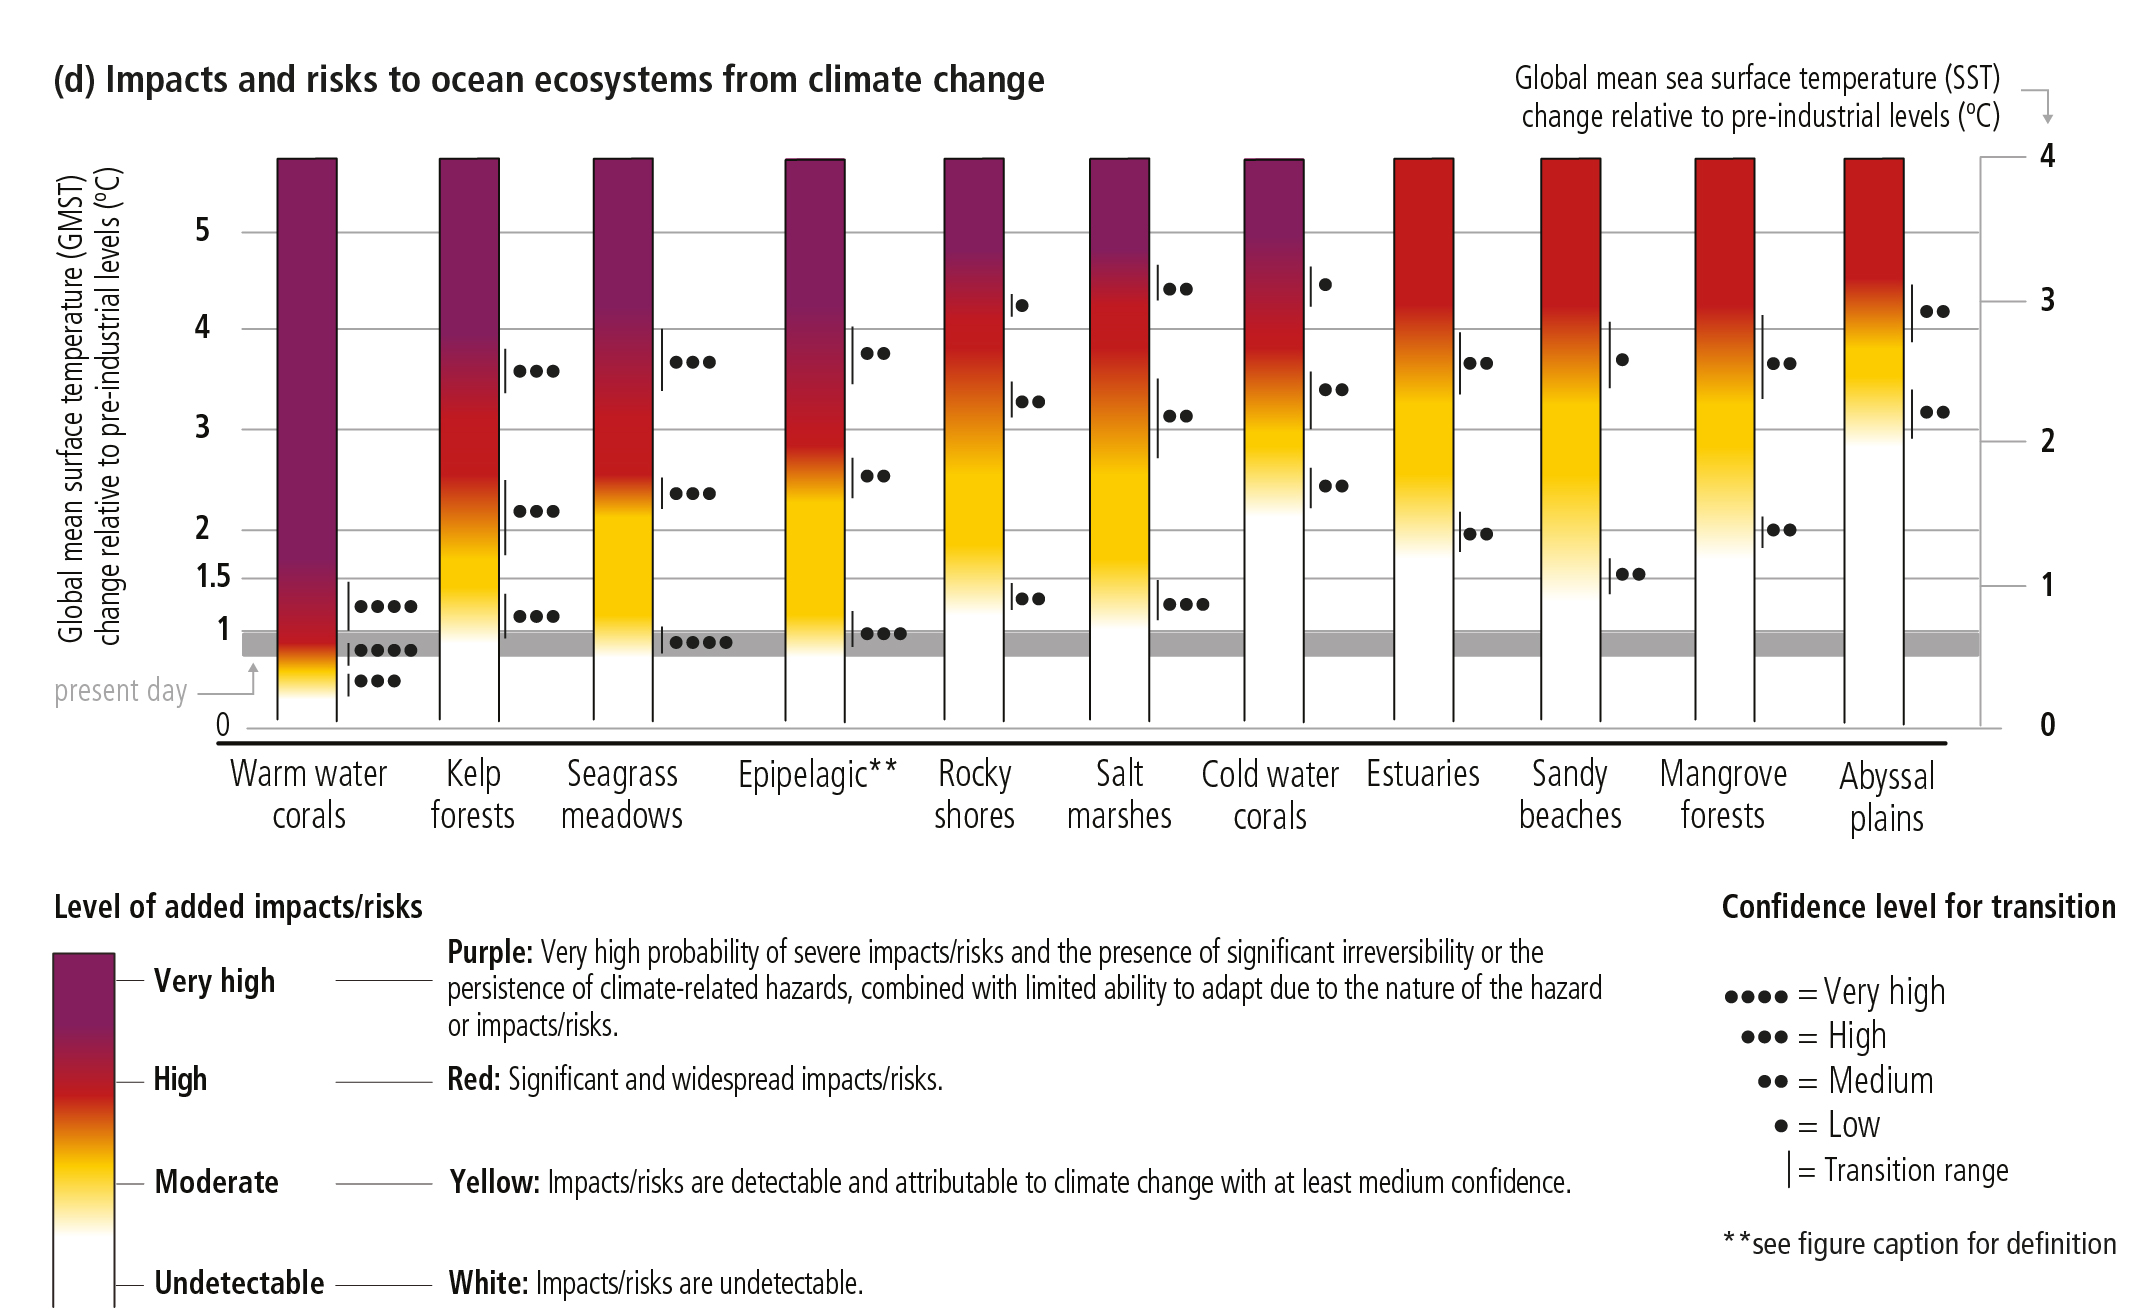
Figure SPM.3 | Projected changes, impacts and risks for ocean regions and ecosystems. (a) depth integrated net primary production (NPP from CMIP5), (b) total animal biomass (depth integrated, including fishes and invertebrates from FISHMIP), (c) maximum fisheries catch potential and (d) impacts and risks for coastal and open ocean ecosystems. The three left panels represent the simulated (a,b) and observed (c) mean values for the recent past (1986–2005), the middle and right panels represent projected changes (%) by 2081–2100 relative to recent past under low (RCP2.6) and high (RCP8.5) greenhouse gas emissions scenario {Box SPM.1}, respectively. Total animal biomass in the recent past (b, left panel) represents the projected total animal biomass by each spatial pixel relative to the global average. (c) *Average observed fisheries catch in the recent past (based on data from the Sea Around Us global fisheries database); projected changes in maximum fisheries catch potential in shelf seas are based on the average outputs from two fisheries and marine ecosystem models. To indicate areas of model inconsistency, shaded areas represent regions where models disagree in the direction of change for more than: (a) and (b) 3 out of 10 model projections, and (c) one out of two models. Although unshaded, the projected change in the Arctic and Antarctic regions in (b) total animal biomass and (c) fisheries catch potential have low confidence due to uncertainties associated with modelling multiple interacting drivers and ecosystem responses. Projections presented in (b) and (c) are driven by changes in ocean physical and biogeochemical conditions e.g., temperature, oxygen level, and net primary production projected from CMIP5 Earth system models. **The epipelagic refers to the uppermost part of the ocean with depth <200 m from the surface where there is enough sunlight to allow photosynthesis. (d) Assessment of risks for coastal and open ocean ecosystems based on observed and projected climate impacts on ecosystem structure, functioning and biodiversity. Impacts and risks are shown in relation to changes in Global Mean Surface Temperature (GMST) relative to pre-industrial level. Since assessments of risks and impacts are based on global mean Sea Surface Temperature (SST), the corresponding SST levels are shown. The assessment of risk transitions is described in Chapter 5 Sections 5.2, 5.3, 5.2.5 and 5.3.7 and Supplementary Materials SM5.3, Table SM5.6, Table SM5.8 and other parts of the underlying report. The figure indicates assessed risks at approximate warming levels and increasing climate-related hazards in the ocean: ocean warming, acidification, deoxygenation, increased density stratification, changes in carbon fluxes, sea level rise, and increased frequency and/or intensity of extreme events. The assessment considers the natural adaptive capacity of the ecosystems, their exposure and vulnerability. Impact and risk levels do not consider risk reduction strategies such as human interventions, or future changes in non-climatic drivers. Risks for ecosystems were assessed by considering biological, biogeochemical, geomorphological and physical aspects. Higher risks associated with compound effects of climate hazards include habitat and biodiversity loss, changes in species composition and distribution ranges, and impacts/risks on ecosystem structure and functioning, including changes in animal/plant biomass and density, productivity, carbon fluxes, and sediment transport. As part of the assessment, literature was compiled and data extracted into a summary table. A multi-round expert elicitation process was undertaken with independent evaluation of threshold judgement, and a final consensus discussion. Further information on methods and underlying literature can be found in Chapter 5, Sections 5.2 and 5.3 and Supplementary Material. {3.2.3, 3.2.4, 5.2, 5.3, 5.2.5, 5.3.7, SM5.6, SM5.8, Figure 5.16, Cross Chapter Box 1 in Chapter 1 Table CCB1}