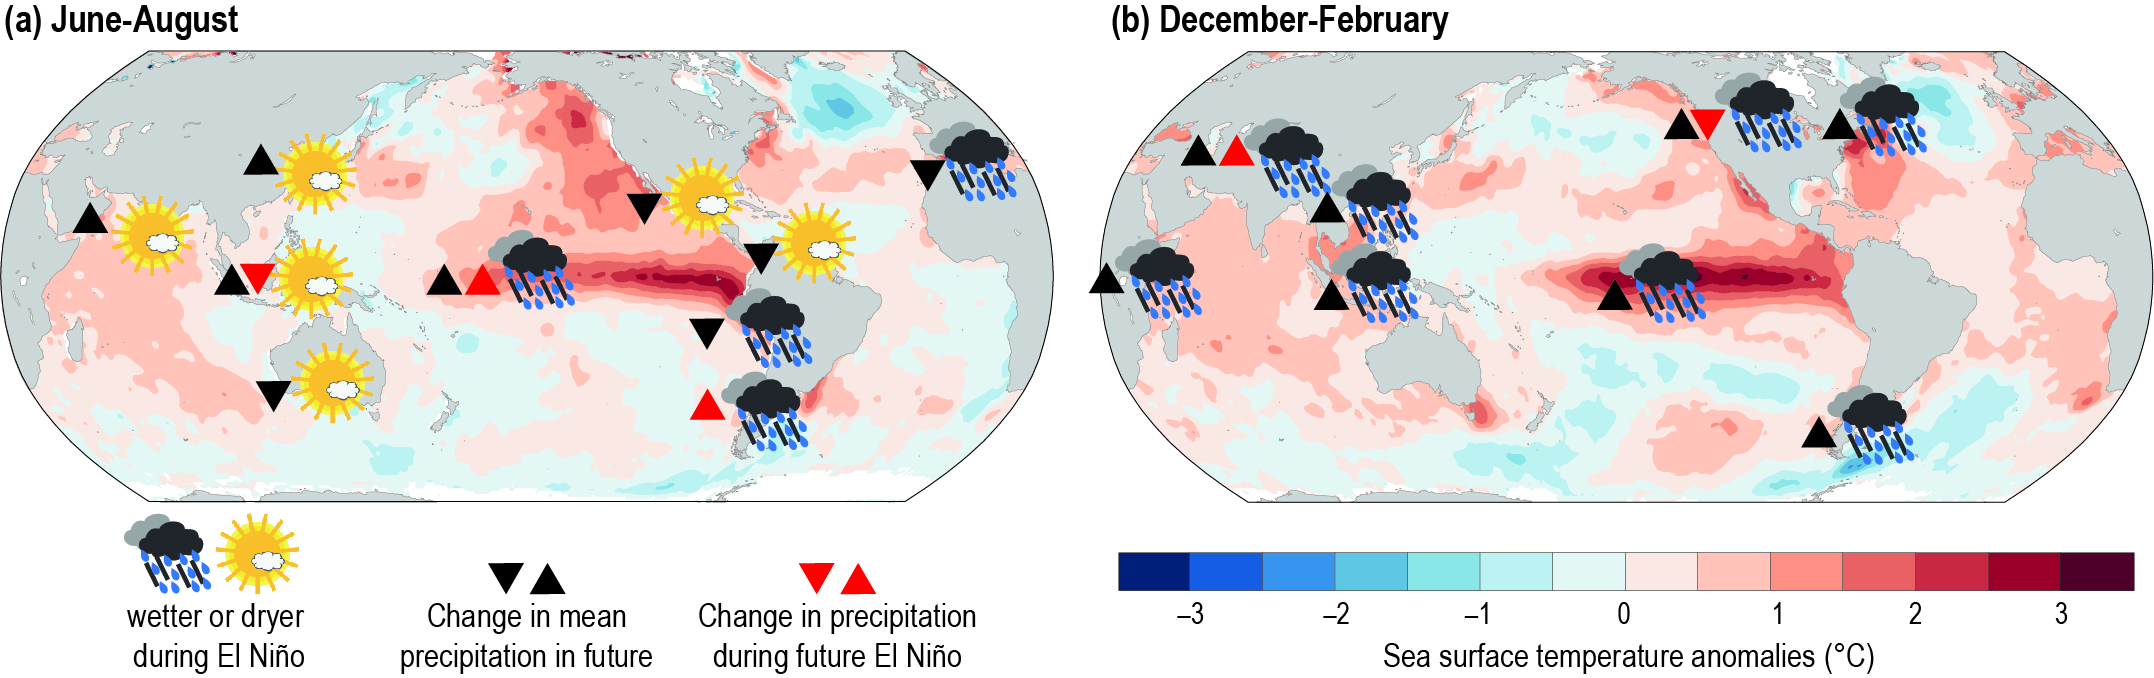
Figure 6.6 | Schematic figure indicating future changes in El Niño teleconnections based on the study of Power and Delage (2018). The background pattern of sea surface temperature (SST) anomalies (oC) are averaged from June 2015 to August 2015 (panel a) and December 2015 to February 2016 (panel b), during the most recent extreme El Niño event (anomalies computed with respect to 1986–2005). Symbols indicate present day teleconnections for El Niño events. Black arrows indicate if there is a model consensus on change in mean rainfall in the region. Red arrows indicate if there is a model consensus on change in the rainfall anomaly under a future El Niño event. Direction of the arrow indicates whether the response in precipitation is increasing (up) or decreasing (down). Significance is determined when two-thirds or more of the models agree on the sign.