Chapter 15: Investment and finance


This chapter should be cited as:
Kreibiehl, S., T. Yong Jung, S. Battiston, P. E. Carvajal, C. Clapp, D. Dasgupta, N. Dube, R. Jachnik, K. Morita, N. Samargandi, M. Williams, 2022: Investment and finance. In IPCC, 2022: Climate Change 2022: Mitigation of Climate Change. Contribution of Working Group III to the Sixth Assessment Report of the Intergovernmental Panel on Climate Change[P.R. Shukla, J. Skea, R. Slade, A. Al Khourdajie, R. van Diemen, D. McCollum, M. Pathak, S. Some, P. Vyas, R. Fradera, M. Belkacemi, A. Hasija, G. Lisboa, S. Luz, J. Malley, (eds.)]. Cambridge University Press, Cambridge, UK and New York, NY, USA. doi: 10.1017/9781009157926.017
Executive Summary 
Finance to reduce net greenhouse gas (GHG) emissions and enhance resilience to climate impacts represents a critical enabling factor for the low carbon transition. Fundamental inequities in access to finance as well as its terms and conditions, and countries’ exposure to physical impacts of climate change overall result in a worsening outlook for a global just transition (high confidence) . Decarbonising the economy requires global action to address fundamental economic inequities and overcome the climate investment trap that exists for many developing countries. For these countries the costs and risks of financing often represent a significant challenge for stakeholders at all levels. This challenge is exacerbated by these countries’ general economic vulnerability and indebtedness. The rising public fiscal costs of mitigation, and of adapting to climate shocks, are affecting many countries and worsening public indebtedness and country credit ratings at a time when there were already significant stresses on public finances. The COVID-19 pandemic has made these stresses worse and tightened public finances still further. Other major challenges for commercial climate finance include: the mismatch between capital and investment needs, 1 home bias 2 considerations, differences in risk perceptions for regions, as well as limited institutional capacity to ensure safeguards represent. {15.2, 15.6.3}
Investors, central banks, and financial regulators are driving increased awareness of climate risk. This increased awareness can support climate policy development and implementation (high confidence) . Climate-related financial risks arise from physical impacts of climate change (already relevant in the short term), and from a disorderly transition to a low-carbon economy. Awareness of these risks is increasing leading also to concerns about financial stability. Financial regulators and institutions have responded with multiple regulatory and voluntary initiatives by to assess and address these risks. Yet despite these initiatives, climate-related financial risks remain greatly underestimated by financial institutions and markets limiting the capital reallocation needed for the low-carbon transition. Moreover, risks relating to national and international inequity – which act as a barrier to the transformation – are not yet reflected in decisions by the financial community. Stronger steering by regulators and policy makers has the potential to close this gap. Despite the increasing attention of investors to climate change, there is limited evidence that this attention has directly impacted emission reductions. This leaves high uncertainty, both near-term (2021–30) and longer-term (2021–50), on the feasibility of an alignment of financial flows with the Paris Agreement ( high confidence). {15.2, 15.6}
Progress on the alignment of financial flows with low GHG emissions pathways remains slow. There is a climate financing gap which reflects a persistent misallocation of global capital (high confidence) . Persistently high levels of both public and private fossil-fuel related financing continue to be of major concern despite recent commitments. This reflects policy misalignment, the current perceived risk-return profile of fossil fuel-related investments, and political economy constraints ( high conf idence). {15.3}
Estimates of climate finance flows – which refers to local, national, or transnational financing from public, private,multilateral, bilateral and alternative sources, to support mitigation and adaptation actions addressing climate change – exhibit highly divergent patterns across regions and sectors and a slowing growth. {15.3}
When the perceived risks are too high the misallocation of abundant savings persists. Investors refrain from investing in infrastructure and industry in search of safer financial assets, even earning low or negative real returns. {15.2, 15.3}
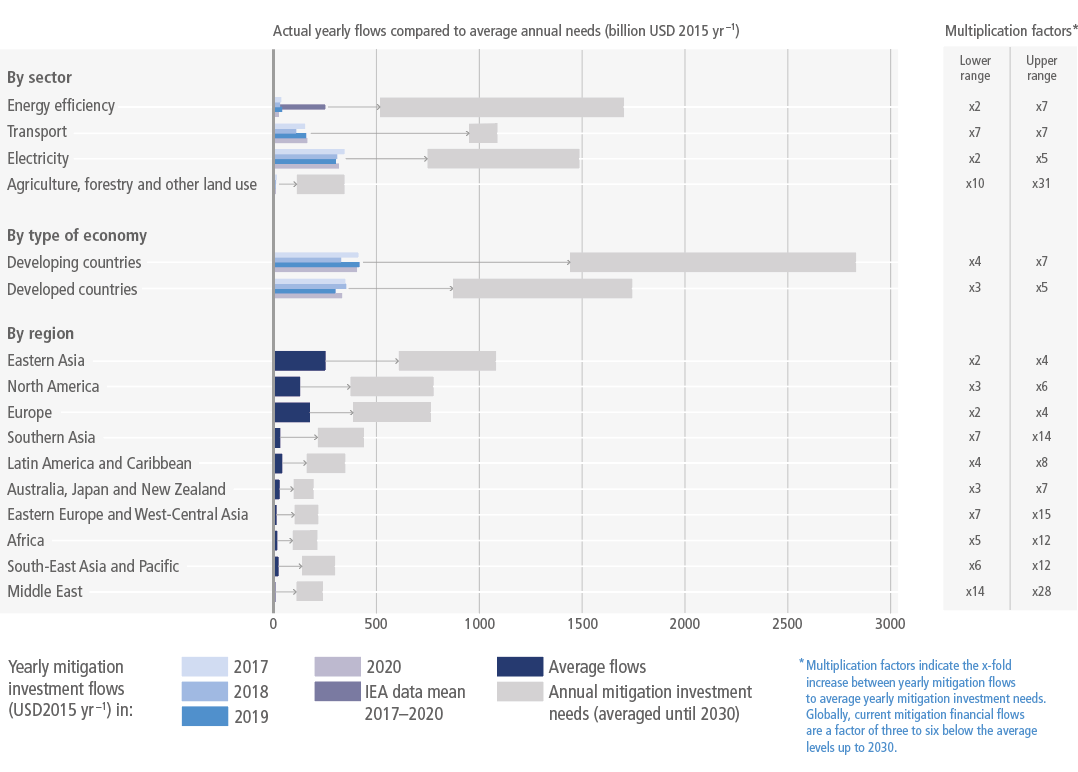
Global climate finance is heavily focused on mitigation (more than 90% on average between 2017–2020). This is despite the significant economic effects of climate change’s expected physical impacts, and the increasing awareness of these effects on financial stability. To meet the needs for rapid deployment of mitigation options, global mitigation investments are expected to need to increase by the factor of 3 to 6 (medium confidence). The gaps are wide for all sectors and represent a major challenge for developing countries, 3 especially Least-Developed Countries (LDCs), where flows have to increase by factor 4 to 7, for specific sectors like agriculture, forestry and other land use (AFOLU) in relative terms, and for specific groups with limited access to, and high costs of, climate finance ( high confidence). {15.4, 15.5}
The actual size of sectoral and regional climate financing gaps is only one component driving the magnitude of the challenge, with financial and economic viability, access to capital markets, investment requirements for adaptation, reduction of losses and damages, climate-responsive social protection, appropriate regulatory frameworks and institutional capacity to attract and facilitate investments and ensure safeguards being decisive to scale-up financing. Financing needs for the creation and strengthening of regulatory environment and institutional capacity, upstream financing needs as well as R&D and venture capital for development of new technologies and business models are often overlooked despite their critical role to facilitate the deployment of scaled-up climate finance ( high confidence). {15.4.1, 15.5.2}
The relatively slow implementation of commitments by countries and stakeholders in the financial system to scale up climate finance reflects neither the urgent need for ambitious climate action, nor the economic rationale for ambitious climate action (high confidence) . Delayed climate investments and financing – and limited alignment of investment activity with the Paris Agreement – will result in significant carbon lock-ins, stranded assets, and other additional costs. This will particularly impact urban infrastructure and the energy and transport sectors ( high confidence). A common understanding of debt sustainability and debt transparency, including negative implications of deferred climate investments on future GDP, and how stranded assets and resources may be compensated, has not yet been developed (medium conf idence). {15.6}
The greater the urgency of action to remain on a 1.5°C pathway the greater need for parallel investment decisions in upstream and downstream parts of the value chain. Greater urgency also reduces the lead times to build trust in regulatory frameworks. Consequently, many investment decisions will need to be made based on the long-term global goals. This highlights the importance of trust in political leadership which, in turn, affects risk perception and ultimately financing costs ( high confidence). {15.6.1, 15.6.2}
There is a mismatch between capital availability in the developed world and the future emissions expected in developing countries. This emphasises the need to recognise the explicit and positive social value of global cross-border mitigation financing. A significant push for international climate finance access for vulnerable and poor countries is particularly important given these countries’ high costs of financing, debt stress and the impacts of ongoing climate change ( high confidence). {15.2, 15.3.2.3, 15.5.2, 15.6.1, 15.6.7}
Ambitious global climate policy coordination and stepped-up (public) climate financing over the next decade (2021–2030) can help address macroeconomic uncertainty and alleviate developing countries’ debt burden post-COVID-19. It can also help redirect capital markets and overcome challenges relating to the need for parallel investments in mitigation and the up-front risks that deter economically sound low carbon projects. (high confidence). Providing strong climate policy signals helps guide investment decisions. Credible and clear signalling by governments and the international community reduce uncertainty for financial decision-makers and help reduce transition risk. In addition to indirect and direct subsidies, the public sector’s role in addressing market failures, barriers, provision of information, and risk sharing (equity, various forms of public guarantees) can encourage the efficient mobilisation of private sector finance ( high confidence). {15.2, 15.6.1, 15.6.2}
The mutual benefits of coordinated support for climate mitigation and adaptation in the next decade for both developed and developing regions could potentially be very high in the post-COVID-19 era. Climate compatible stimulus packages could significantly reduce the macro-financial uncertainty generated by the pandemic and increase the sustainability of the world economic recovery. {15.2, 15.3.2.3, 15.5.2, 15.6.1, 15.6.7}
Political leadership and intervention remain central to addressing uncertainty as a fundamental barrier for a redirection of financial flows. Existing policy misalignments – for example in fossil fuel subsidies – undermine the credibility of public commitments, reduce perceived transition risks and limit financial sector action ( high confidence). {15.2, 15.3.3, 15.6.1, 15.6.2, 15.6.3}
Innovative financing approaches could help reduce the systemic underpricing of climate risk in markets and foster demand for Paris-aligned investment opportunities. Approaches include de-risking investments, robust ‘green’ labelling and disclosure schemes, in addition to a regulatory focus on transparency and reforming international monetary system financial sector regulations (medium confidence) . Markets for green bonds, ESG (environmental, social, and governance), and sustainable finance products have grown significantly since the Fifth Assessment Report of the Intergovernmental Panel on Climate Change (IPCC AR5) and the landscape continues to evolve. Underpinning this evolution is investors’ preference for scalable and identifiable low-carbon investment opportunities. These relatively new labelled financial products will help by allowing a smooth integration into existing asset allocation models ( high confidence). Markets for green bonds, ESG (environmental, social, and governance), and sustainable finance products have also increased significantly since AR5, but challenges nevertheless remain, in particular there are concerns about ‘greenwashing’ and the limited application of these markets to developing countries. New business models (e.g., pay-as-you-go) can facilitate the aggregation of small-scale financing needs and provide scalable investment opportunities with more attractive risk-return profiles. Support and guidance for enhancing transparency can promote capital markets’ climate financing by providing quality information to price climate risks and opportunities. Examples include Sustainable Development Goals (SDG) and environmental, social and governance (ESG) disclosure, scenario analysis and climate risk assessments, including the Task Force on Climate-Related Financial Disclosures (TCFD). The outcome of these market-correcting approaches on capital flows cannot be taken for granted, however, without appropriate fiscal, monetary and financial policies. Mitigation policies will be required to enhance the risk-weighted return of low-emission and climate-resilient options, and – supported by progress in transparent and scientifically based projects’ assessment methods – to accelerate the emergence and support for financial products based on real projects, such as green bonds, and phase out fossil fuel subsidies. Greater public-private cooperation can also encourage the private sector to increase and broaden investments, within a context of safeguards and standards, and this can be integrated into national climate change policies and plans. {15.1, 15.2.4, 15.3.1, 15.3.2, 15.3.3, 15.5.2, 15.6.1, 15.6.2, 15.6.6, 15.6.7, 15.6.8}.
The following policy options can have important long-term catalytic benefits (high confidence) . (i) Stepped-up both the quantum and composition of financial, technical support and partnership in low-income and vulnerable countries alongside low-carbon energy access in low-income countries, such as in sub-Saharan Africa, which currently receives less than 5% of global climate financing flows; (ii) continued strong role of international and national financial institutions, including multilateral, especially location-based regional, and national development banks; (iii) de-risking cross-border investments in low-carbon infrastructure, development of local green bond markets, and the alignment of climate and non-climate policies, including direct and indirect supports on fossil fuels, consistent with the climate goals; (iv) lowering financing costs including transaction costs and addressing risks through funds and risk-sharing mechanisms for under-served groups; (v) accelerated finance for nature-based solutions, including mitigation in the forest sector (REDD+), and climate-responsive social protection; (vi) improved financing instruments for loss and damage events, including risk-pooling-transfer-sharing for climate risk insurance; (vii) economic instruments, such as phasing in carbon pricing and phasing out fossil fuel subsidies in a way that addresses equity and access; and (viii) gender-responsive and women-empowered programmes. {15.2.3, 15.2.4, 15.3.1, 15.3.2.2, 15.3.3, 15.4.1, 15.4.2, 15.4.3, 15.5.2, 15.6, 15.6.2, 15.6.4, 15.6.5, 15.6.6, 15.6.7, 15.6.8.2}
15.1Climate Finance – Key Concepts and Scope
Finance for climate action (or climate finance), environmental finance (which also covers other environmental priorities such as water, air pollution and biodiversity), and sustainable finance (which encompasses issues relating to socio-economic impacts, poverty alleviation and empowerment) are interrelated rather than mutually exclusive concepts (UNEP Inquiry 2016a; ICMA 2020a). Their combination is needed to align mitigation investments with multiple SDGs, and at a minimum, minimise the conflicts between climate targets and SDGs not being targeted. From a climate policy perspective, climate finance refers to finance ‘whose expected effect is to reduce net GHG emissions and/or enhance resilience to the impacts of climate variability and projected climate change’ (UNFCCC 2018a). However, as pinpointed in the AR5, significant room for interpretation and context-specific considerations remains. Further, such definition needs to be put in perspective with the expectations of investors and financiers (see Box 15.2).
Specifying the scope of climate finance requires defining two terms: what qualifies as ‘finance’ and as ‘climate’ respectively. In terms of what type of finance to consider, options include considering investments or total costs (Box 15.1), stocks or flows, gross or net (the latter taking into account reflows and/or depreciation), and domestic or cross-border, public or private (Box 15.2). In terms of what may be considered as ‘climate’, a key difference relates to measuring climate-specific finance (only accounts for the portion of finance resulting in climate benefits) or climate-related finance (captures total project costs and aims to measure the mainstreaming of climate considerations). One should even consider the investments decided for reasons unrelated with climate objectives but which contribute to these objectives (hydroelectricity, rail transportation).
In many cases, the scope of what may be considered as ‘climate finance’ will also depend on the context of implementation such as priorities and activities listed in countries’ Nationally Determined Contributions (NDCs) under the Paris Agreement (UNFCCC 2019a) as well as national development plans more broadly targeting the achievement of SDGs. Hence, rather than opposing the different options listed above, the choice of one or the other depends on the desired scope of measurement, which in turn depends on the policy objective being pursued. The increasingly diverse initiatives and body of grey literature address a range of different information needs. They provide analyses at the levels of domestic finance flows (e.g., UNDP 2015; Hainaut and Cochran 2018), international flows (e.g. OECD 2016; AfDB et al. 2018), global flows (UNFCCC 2018a; Buchner et al. 2019), the financial system (e.g., UNEP Inquiry 2016a) or specific financial instruments such as bonds (e.g., CBI 2018). Common frameworks, reporting transparency are, however, necessary in order to identify overlaps, commonalities and differences between these different measurements in terms of scope and underlying definitions. In that regard, the developments of national and international taxonomies, definitions and standards can help, as further discussed in Section 15.6, and Chapter 17 in AR6 WGII report.
Beyond the need to scale up levels of climate finance, the Paris Agreement provides a broad policy environment and momentum for a more systemic and transformational change in investment and financing strategies and patterns. Article 2.1c, which calls for ‘making finance flows consistent with a pathway towards low greenhouse gas emissions and climate-resilient development’, positions finance as one of the Agreement’s three overarching goals (UNFCCC 2015). This formulation is a recognition that the mitigation and resilience goals cannot be achieved without finance, both in the real economy and in the financial system, being made consistent with these goals (Zamarioli et al. 2021). It has in turn contributed to the development of the concept of alignment (with the Paris Agreement) used in the financial sector (banks, institutional investors), businesses, and public institutions (development banks, public budgets). As a result, since AR5, in addition to measuring and analysing climate finance, an increasing focus has been placed on assessing the consistency or alignment, as well as respectively the inconsistency or misalignment, of finance with climate policy objectives, as for instance illustrated by the multilateral development banks’ joint framework for aligning their activities with the goals of the Paris Agreements (MDBs 2018).
Assessing climate consistency or alignment implies looking at all investment and financing activities, whether they target, contribute to, undermine or have no particular impact on climate objectives. This all-encompassing scope notably includes remaining investments and financing for high-GHG emission activities that may be incompatible with remaining carbon budgets, but also activities that may play a transition role in climate mitigation pathways and scenarios (Section 15.3.2.3). As a result, any meaningful assessment of progress requires the use of different shades to assess activities based on their negative, neutral (‘do no harm’) or positive contributions, (e.g., CICERO 2015; Cochran and Pauthier 2019; Natixis 2019). Doing so in practice requires the development of robust definitions, assessment methods and metrics, an area of work and research that remained under development at the time of writing. A range of financial sector coalitions and civil society organisations as well as commercial services providers to the financial industry have developed frameworks, approaches and metrics, mainly focusing on investment portfolios (Institut Louis Bachelier et al.. 2020; IIGCC 2021; TCFD Portfolio Alignment Team 2021; UN-Convened Net-Zero Asset Owner Alliance 2021), and, to a lesser extent for real economy investments (Micale et al. 2020; Jachnik and Dobrinevski 2021).
Key findings from AR5 and other IPCC publications. For the first time the IPCC in AR5 (Clarke et al. 2014) elaborated on the role of finance in a dedicated chapter. In the following year, the Paris Agreement (UNFCCC 2015) recognised the transformative role of finance, as a means to achieving climate outcomes, and the need to align financial flows with the long-term global goals even as implementation issues were left unresolved (Bodle and Noens 2018). AR5 noted the absence of a clear definition and measurement of climate finance flows, a difficulty that continues (Weikmans and Roberts 2019) (Sections 15.2 and 15.3). The approach taken in AR5 was to report ranges of available information on climate finance flows from diverse sources, using a broad definition of climate finance, as in the Biennial Assessments in 2014 and again in 2018 (UNFCCC 2014a, 2018a) of the Standing Committee under the UNFCCC: Climate finance is taken to refer to local, national or transnational financing – drawn from public, private and alternative sources of financing – that seeks to support mitigation and adaptation actions that address climate change (UNFCCC 2014b). For this chapter, while the focus is primarily on mitigation, adaptation, resilience and loss and damage financing needs cannot be entirely separated because of structural relationships, synergies, trade-offs and policy coherence requirements between these sub-categories of climate finance (Box 15.1).
The AR5 concluded that published assessments of financial flows whose expected effect was to reduce net greenhouse gas (GHG) emissions and/or to enhance resilience to climate change aggregated USD343–385 billion 4 yr –1 globally between 2010 and 2012 (medium confidence). Most (95% of total) went towards mitigation, which was nevertheless underfinanced and adaptation even more so. Measurement of progress towards the commitment by developed countries to provide USD100 billion yr –1 by 2020 to developing countries, for both mitigation and adaptation (Bhattacharya et al. 2020) – a narrower goal than overall levels of climate finance – continued to be a challenge, given the lack of clear definition of such finance, although there remain divergent perspectives (Section 15.2.4). As against these flows, annual need for global aggregate mitigation finance between 2020 and 2030 was cited briefly in the AR5 to be about USD635 billion (mean annual), both public and private, implying that the reported ‘gap’ in mitigation financing of estimated flows during 2010 to 2012 was slightly under one-half of that required (IPCC 2014).
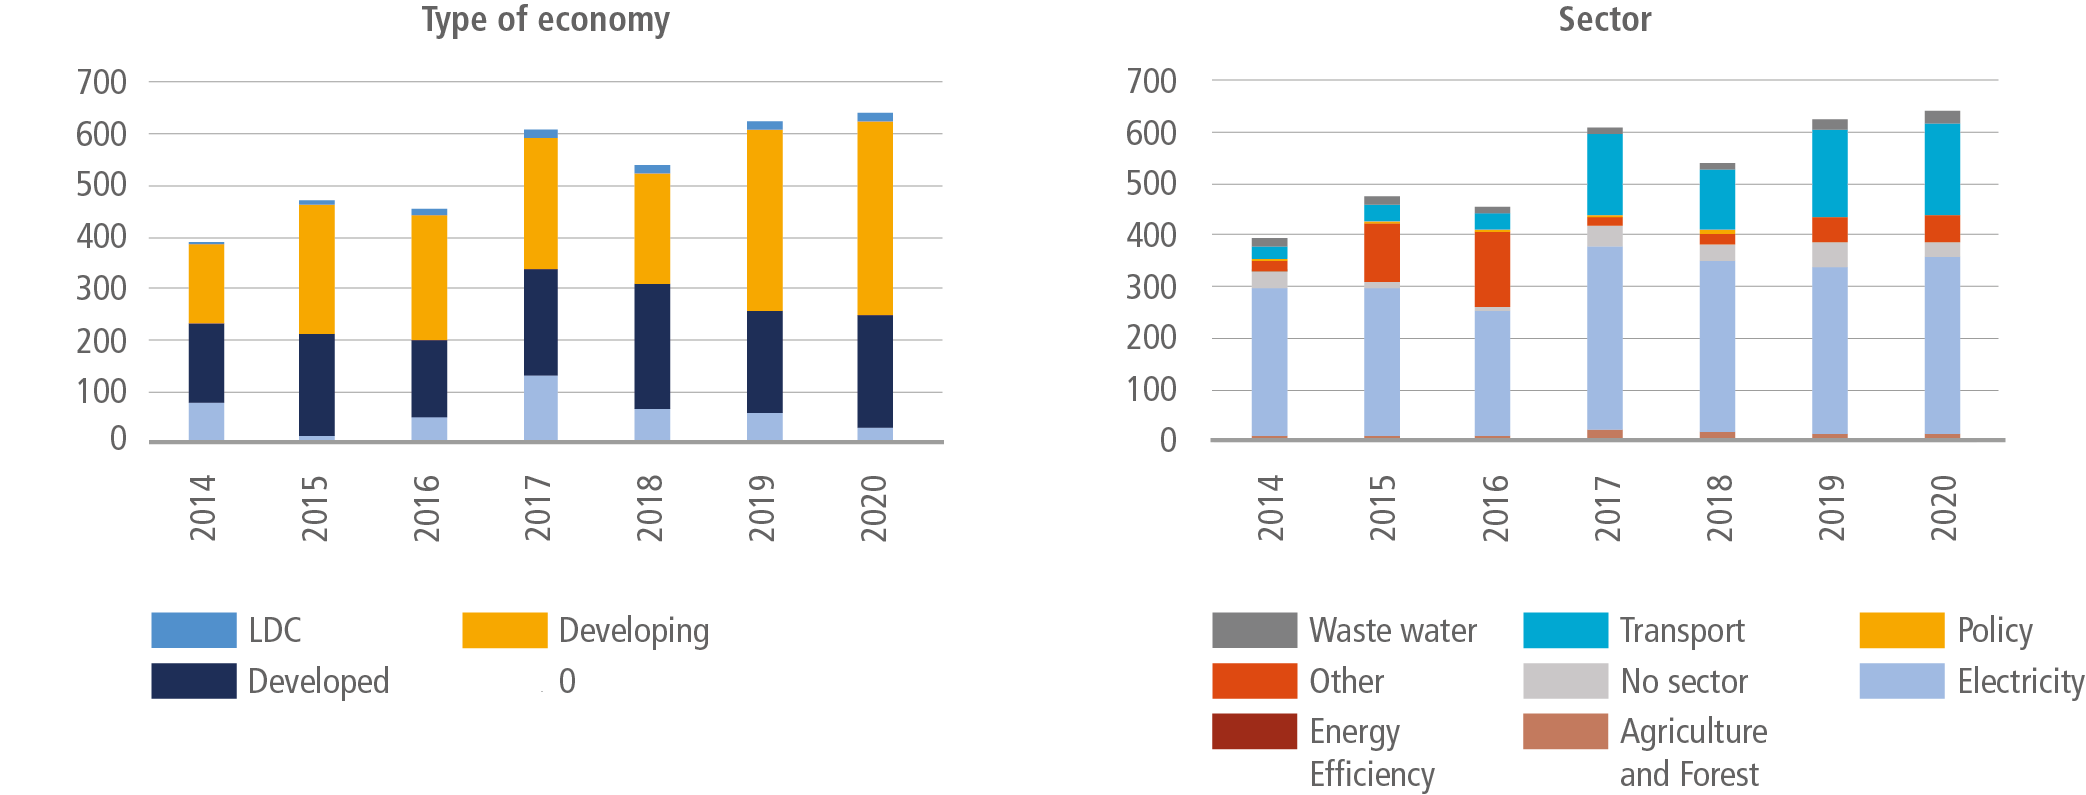
More recent published data from the Biennial Assessments (UNFCCC 2018a) and the Special Report on Global Warming of 1.5°C (IPCC 2018) have revised upwards the needs of financing between 2020 and 2030 to 2035 to contain global temperature rise to below 2°C and 1.5°C respectively by 2100: USD1.7 trillion yr –1 (mean) in the Biennial Assessment 2018 for the former, and for the latter, USD2.4 trillion yr –1 (mean) for the energy sector alone (and three times higher if transport and other sectors were to be included). The resulting estimated gaps in annual mitigation financing during 2014 to 2017, using reporting of climate financing from published sources, was about 67% for 2015, and 76% for the energy sector alone in 2017 (medium confidence), and greater if other sectors were to be included. While the annual reported flows of climate financing showed some moderate progress (Section 15.3), from earlier USD364 billion (mean 2010/2011) to about USD600 billion (mean 2017/2020), with a slowing in the most recent period 2014 to 2017, the gap in financing was reported to have widened considerably (Sections 15.4 and 15.5). In the context of policy coherence, it is also important to note that reported annual investments going into the fossil fuel sectors, oil and gas upstream and coal mining, during the same period were about the same size as global climate finance, although the absence of alternative financing and access to low-carbon energy is a complicating factor.
Adaptation financing needs, meanwhile, were rising rapidly. The Adaption Gap Report 2020 (UNEP 2021) reported that the current efforts are insufficient to narrow the adaptation finance gap, and additional adaptation finance is necessary, particularly in developing countries. The gap is expected to be aggravated by COVID-19 ( high confidence). It reaffirmed earlier assessments that by 2030 (2050) the estimated costs of adaptation ranges between USD140 and 300 billion yr –1 (USD280 and 500 billion yr –1). Against this, the reported actual global public finance flows for adaptation in 2019/2020 were estimated at 46 billion (Naran et al. 2021). The costs of climate disasters meanwhile continued to rise, affecting low-income developing countries the most. Climate natural disasters – not all necessarily attributable to climate change – caused some USD300 billion yr –1 economic losses and well-being losses of about USD520 billion yr –1 (Hallegatte et al. 2017).
Box 15.2 | Box 15.1 | Core Terms
This box defines some core terms used in this chapter as well as in other chapters addressing finance issues: cost, investment, financing, public and private. The chapter makes broad use of the term finance to refer to all types of transactions involving monetary amounts. It avoids the use of the terms funds and funding to the extent possible, which should otherwise be understood as synonyms for money and money provided.
Cost, investment and financing: different but intertwined concepts. Cost encompasses capital expenditures (CAPEX or upfront investment value leveraged over the lifetime of a project) operating and maintenance expenditures (OPEX), as well as financing costs. Note that some projects e.g., related to technical assistance may only involve OPEX (e.g., staff costs) but no CAPEX, or may not incur direct financing costs (e.g., if fully financed via own funds and grants).
Investment , in an economic sense, is the purchase of (or CAPEX for) a physical asset (notably infrastructure or equipment) or intangible asset (e.g., patents, IT solutions) not consumed immediately but used over time. For financial investors, physical and intangible assets take the form of financial assets such as bonds or stocks which are expected to provide income or be sold at a higher price later. In practice, investment decisions are motivated by a calculation of risk-weighted expected returns that takes into account all expected costs, as well as the different types of risks, discussed in Section 15.6.1, that may impact the returns of the investment and even turn them into losses.
Incremental cost (or investment ) accounts for the difference between the cost (or investment value) of a climate project compared to the cost (or investment value) of a counterfactual reference project (or investment). In cases where climate projects and investments are more cost effective than the counterfactual, the incremental cost will be negative.
Financing refers to the process of securing the money needed to cover an investment or project cost. Financing can rely on debt (e.g., through bond issuance or loan subscription), equity issuances (listed or unlisted shares), own funds (typically savings or auto-financing through retained earnings), as well as on grants and subsidies
Public and private: statistical standard and grey zones. International statistics classify economic actors as pertaining to the public or private sectors. Households always qualify as private and governmental bodies and agencies as public. Criteria are needed for other types of actors such as enterprises and financial institutions. Most statistics rely on the majority ownership and control principle. This is the case for the Balance of Payment, which records transactions between residents of a country and the rest of the world (IMF 2009).
Such a strict boundary between public and private sectors may not always be suitable for mapping and assessing investment and financing activities. On the one hand, some publicly owned entities may have a mandate to operate on a fully- or semi-commercial basis, for example state-owned enterprises, commercial banks, and pension funds, as well as sovereign wealth funds. On the other hand, some privately owned or controlled entities can pursue not-for-profit objectives, e.g., philanthropies and charities. The present chapter considers these nuances to the extent made possible by available data and information.
Box 15.2 | International Climate Finance Architecture
International climate finance can flow through different bilateral, multilateral, and other channels, involving a range of different types of institutions both public (official) and private (commercial) with different mandates and focuses. In practice, the architecture of international public climate finance is rapidly evolving, with the creation by traditional donors of new public sources and channels over the years (Watson and Schalatek 2019), as well as emergence of new providers of development co-operation, both bilateral (Benn and Luijkx 2017) and multilateral (e.g., Asian Infrastructure Investment Bank), as well as of non-governmental actors such as philanthropies (OECD 2018a).
The operationalisation of the Green Climate Fund (GCF), which channels the majority of its funds via accredited entities, has notably attracted particular attention since AR5. Section 14.3.2 (in Chapter 14) provides a further assessment of progress and challenges of financial mechanisms under the United Nations Framework Convention on Climate Change (UNFCCC), such as the GCF, the Global Environment Facility (GEF) and the Adaptation Fund (AF).
The multiplication of sources and channels of international climate finance can help address growing climate-related needs, and partly results from increased decentralisation as well financial innovation, which in turn can increase the effectiveness of finance provided. There is, however, also evidence that increased complexity implies transaction costs (Brunner and Enting 2014), in part due to bureaucracy and intra-governmental factors (Peterson and Skovgaard 2019), which constitutes a barrier to low-carbon projects and are often not accounted for in assessments of international climate finance. On the ground, activities by international providers operating in the same countries may overlap, with sub-optimal coordination and hence duplication of efforts, both on the bilateral and multilateral sides (Ahluwalia et al. 2016; Gallagher et al. 2018; Humphrey and Michaelowa 2019), as well as risks of fragmentation of efforts (Watson and Schalatek 2020) which slows down coordination with international providers, national development banks and other domestic institutions.
Box 15.3 | Mitigation, Adaptation and Other Related Climate Finance Merit Joint Examination
Mitigation finance deals with investments that aim to reduce global carbon emissions, while adaptation finance deals with the consequences of climate change (Lindenberg and Pauw 2013). Mitigation affects the scale of adaptation needs and adaptation may have strong synergies and co-benefits as well as trade-offs with mitigation (Grafakos et al. 2019). If mitigation investments are inadequate to reducing global warming (as in the last decade) with asymmetric adverse impacts in lower latitudes and low-lying geographies, the scale of adaptation investments has to rise and the benefits of stronger adaptation responses may be high (Markandya and González-Eguino 2019). If adaptation investments build greater resilience, they might even moderate mitigation financing costs. Similar policy coherence considerations apply to disaster risk reduction financing, the scale of which depends on success with both adaptation and mitigation (Mysiak et al. 2018). The same financial actors, especially governments and the private sector, decide at any given time on their relative allocations of available financing for mitigation, adaptation and disaster-risk reduction from a constrained common pool of resources. The trade-offs and substitutability between closely-linked alternative uses of funds, therefore, make it essential for a simultaneous assessment of needs – as in parts of this chapter. Climate finance versus the financing of other Sustainable Development Goals (SDGs) faces a similar issue. A key agreement was that climate financing should be ‘new and additional’ and not at the cost of SDGs. Resources prioritising climate at the cost of non-climate development finance increase the vulnerability of a population for any given level of climate shocks, and additionality of climate financing is thus essential (Brown et al. 2010). Policy coherence is also the reason why mitigation finance cannot be separated from consideration of spending and subsidies on fossil fuels. Climate change may additionally cause the breaching of physical and social adaptation limits, resulting in climate-related residual risks (i.e., potential impacts after all feasible mitigation, adaptation, and disaster risk reduction measures have been implemented) (Mechler et al. 2020). Because these residual losses and damages from climate-related risks are related to overall mitigation and adaptation efforts, the magnitude of potential impacts is related to the overall quantum of mitigation, adaptation, and disaster risk reduction finance available (Frame et al. 2020). All categories of climate finance thus need to be considered together in discussions around climate finance.
15.2Background Considerations
The institutions under climate finance in this chapter refer to the set of financial actors, instruments and markets that are recognised to play a key role in financing decisions on climate mitigation and adaptation. For a definition of climate financial stock and flows see further Section 15.3 and the Glossary. The issue of climate finance is closely related to the conversation on international cooperation and the question of how cross-border investments can support climate mitigation and adaptation in developing countries. However, the issue is also related to more general questions of how financial institutions, both public and private, can assess climate risks and opportunities from all investments, and what roles states, policymakers, regulators and markets can play in making them more sustainable. In particular, the question of the respective roles of the public and private financial actors has become important in deliberations on climate finance in recent years. The broader macroeconomic context is an important starting point. Four major events and macro trends mark the developments in climate finance in the previous five years and likely developments in the near term.
•First, the 2015 Paris Agreement, with the engagement of the financial sector institutions in the climate agenda, has been followed by a series of related developments in financial regulation in relation to climate change and in particular to the disclosure of climate-related financial risk ( high confidence) (Section 15.2.1).
• Second, the last five years have been characterised by a series of interconnected ‘headwinds’ (Section 15.2.2), including rising private and public debt and policy uncertainty which work against the objective of filling the climate investment gap ( high confidence).
•Third, the 2020 COVID-19 pandemic crisis has put enormous additional strain on the global economy, debt and the availability of finance, which will be longer lasting (Section 15.2.3). At the same time, while it is still too early to draw positive conclusions, this crisis highlights opportunities in terms of political and policy feasibility and behavioural change in respect of realigning climate finance (medium confidence).
•Fourth, the sharp rise in global inequality and the effects of the pandemic have brought into renewed sharp focus the need for a Just Transition (Section 15.2.4) and a realignment of climate finance and policies that would be beneficial for a new social compact towards a more sustainable world that addresses energy equity and environmental justice ( high confidence).
15.2.1Paris Agreement and the Engagement of the Financial Sector in the Climate Agenda
This is the first IPCC Assessment Report chapter on investment and finance since the 2015 Paris Agreement, which represented a landmark event for climate finance because for the first time the key role of aligning financial flows to climate goals was spelled out. Since then, the financial sector has recognised the opportunity and has stepped up to centre-stage in the global policy conversation on climate change. While before the Paris Agreement, only few financial professionals and regulators were acquainted with climate change, today climate change is acknowledged as a strategic priority in most financial institutions. This is a major change in the policy landscape from AR5. However, this does not mean that finance necessarily plays an adequate enabling role for climate investments. On the contrary, the literature shows that without appropriate conditions, finance can represent a barrier to filling the climate investment gap (Hafner et al. 2020). Indeed, despite the enormous acceleration in policy initiatives (e.g., NGFS 2020) and coalitions of the willing in the private sectors, the effect in terms of closing the investment gap identified already in AR5 has been limited (Section 15.5.2).
Financial investors have started to account for climate risk in some contexts but they do so only to a limited extent (Monasterolo and de Angelis 2020; Alessi et al. 2021; Bolton and Kacperczyk 2021) and the reasons for these remain unclear. Two aspects are relevant here. The first is the endogenous nature of climate financial risk and opportunities (with the term ‘risk’ meaning here the potential for adverse financial impact, whether or not the distribution of losses is known). Academics and practitioners in finance are aware that financial risk can in certain contexts be endogenous, that is, the materialisation of losses is affected by the action of financial players themselves. However, the standard treatment of risk both in financial valuation models and in asset pricing assumes that risk is exogenous. In contrast, endogeneity is a key feature of climate risk because today’s perception of climate risk affects climate investment, which in turn affects directly the future risk. This endogeneity leads to the fact that multiple and rather different mitigation scenarios are possible (Chapter 3). Moreover, the likelihood of occurrence of each alternative scenario is very hard to estimate. Further, the assessment of climate-related financial risk requires to combine information related to mitigation scenarios as well as climate impact scenarios, leaving open an important knowledge gap for the next years (Section 15.6.1).
The second aspect is that the multiplicity of equilibria results in a coordination problem whereby the majority of investors wait to move and reallocate their investments until they can follow a clear signal. Despite the initial momentum of the Paris Agreement, for many investors, both public and private, the policy signal seems not strong enough to induce them to align their investment portfolios to climate goals.
Analyses of the dynamics of the low-carbon transition suggest that it does not occur by itself and that it requires a policy signal credible enough in the perception of market players and investors (Battiston et al. 2021b). Credibility could require a policy commitment device (Brunner et al. 2012). The commitment would also need to be large enough (analogous to the ‘whatever it takes’ statement by the European Central Bank during the 2011–2012 European sovereign crisis (Kalinowski and Chenet 2020)). In principle, public investments in low-carbon infrastructures (or private-public partnerships) as well as regulation could provide credible signals if their magnitude and time horizon are appropriate (past experiences with feed-in-tariffs (FiTs) models across countries provide useful lessons).
15.2.2Macroeconomic Context
Entering 2020, the world already faced large macroeconomic headwinds to meeting the climate finance gap in the near term – barring some globally coordinated action. While an understanding of the disaggregated country-by-country, sector-by-sector, project-by-project, and instrument-by-instrument approach to raising climate finances analysed in the later parts of this chapter remains important, macroeconomic drivers of finance remain crucial in the near term.
Near-term finance financial flows in aggregate often show strong empirically observed cycles over time, especially in terms of macroeconomic and financial cycles. By near-term, we mean here the likely cycle over the next five to ten years (2020–2025 and 2020–2030), as influenced by global macroeconomic real business cycles (output, investment and consumption), with periodic asymmetric downside impacts and crises (Gertlerand Kiyotaki 2010; Borio 2014; Jordà et al. 2017; Borio et al. 2018). Financial cycles typically have strong co-movements (asset prices, credit growth, interest rates, leverage, risk factors, market fear, macro-prudential and central bank policies) (Coeurdacier and Rey 2013), they have large consequences for all types of financial flows such as equity, bond and banking credit markets, which in turn are likely to impact climate finance flows to all sub-sectors and geographies (with greater expected volatility in more risky and more leveraged regions). This is in contrast to longer-term trend considerations (2020–2050) that typically focus the attention on drivers of disaggregated flows of climate finance and policies. The upward trends of the cycles tend to favour speculative bubbles like real estates at the expense of investment in production and infrastructures whereas the asymmetric downsides raise uncertainty and risks for longer-term investments on newer climate technologies, and favour a flight to near-term safety (e.g., lowest risk non-climate short-term treasury investments, highest creditworthy countries, and away from cross-border investments (Section 15.5) – making the challenge of longer-term low-carbon transition more difficult. In this respect, the impact of financial regulation is unclear. On the one hand, it could be argued that the tighter bank regulations under Basel III, combined with an economic environment with higher uncertainty and flatter yield curve, can push banks to retrench from climate finance projects (Blended Finance Taskforce, 2018a), since banks tend to limit loan maturity to five or eight years, while infrastructure projects typically require the amortisation of debt over 15 to 20 years (Arezki et al. 2016). On the other hand, other studies report that stricter capital requirements are not a driving factor for moving away from sustainability projects (CISL and UNEP FI 2014).
Four key aspects of the global macroeconomy, each slightly different, pointed in a cascading fashion towards a deteriorating environment for stepped-up climate financing over the next crucial decade (2020–2030), even before COVID-19. The argument is often made that there is enough climate financing available if the right projects and enabling policy actions (‘bankable projects’) present themselves (Cuntz et al. 2017; Meltzer 2018). The attention to ‘bankability’ does not however address access and equity issues (Bayliss and Van Waeyenberge 2018). Some significant gains in climate financing at the sectoral and microeconomic levels were nevertheless happening in specific segments, such as solar energy financing and labelled green bonds (although how much of such labelled financing is incremental to unlabelled financing that might have happened anyway remains uncertain) (Tolliver et al. 2019). Issues of ‘labelling’ (Cornell 2020) apply even more to ESG (environmental, social and governance) investments, which started to grow rapidly after 2016 (Section 15.6.5). Overall, these increments for climate finance remained, however, small in aggregate relative to the size of the shifts in climate financing required in the coming decade. Annual energy investments in developing regions (other than China) which account for two-thirds of the world population, with least costs of mitigation per tonne of emissions (one-half that in developed regions), and for the bulk of future expected global GHG emissions, saw a 20% decline since 2016, and only a one-fifth share of global clean energy investment, reflecting persistent financing problems and costs of mobilising finance towards clean energy transition, even prior to the pandemic (IEA 2021a). In the words of a macroeconomic institution, ‘tangible policy responses to reduce greenhouse gas emissions have been grossly insufficient to date’ (IMF 2020a). The reason is in part global macroeconomic headwinds, which show a relative stagnation since 2016 and limited cross-border flows in particular (Yeo 2019).
Slowing and more unstable GDP growth. The first headwind was more unstable and slowing GDP growth at individual country levels and in aggregate because of worsening climate change impact events (Donadelli et al. 2019; Kahn et al. 2019). As each warmer year keeps producing more negative impacts – arising from greater and rising variability and intensity of rainfall, floods, droughts, forest fires and storms – the negative consequences have become more macro-economically significant, and worst for the most climate-vulnerable developing countries ( high confidence). Paradoxically, while these effects should have raised the social returns and incentives to invest more in future climate mitigation, a standard public policy argument, these macroeconomic shocks may work in the opposite direction for private decisions by raising the financing costs now (Cherif and Hasanov 2018). With some climate tipping points, potentially in the near-term reach (see AR6 WGI Chapter 4) the uncertainty with regard to the economic viability and growth prospects of selected macroeconomically critical sectors increases significantly (AR6 WGII Chapters 8 and 17). Taking account of other behavioural failures, this was creating a barrier for proactive and accelerated mitigation and adaptation action.
Public finances. The second headwind was rising public fiscal costs of mitigation and adapting to rising climate shocks affecting many countries, which were negatively impacting public indebtedness and country credit ratings (Cevik and Jalles 2020; Klusak et al. 2021) at a time of growing stresses on public finances and debt (Benali et al. 2018; Kling et al. 2018; Kose et al. 2020) ( high confidence). Every climate shock and slowing growth puts greater pressures on public finances to offset these impacts. Crucially, the negative consequences were typically greater at the lower end of income distributions everywhere (Acevedo et al. 2018; Aggarwal 2019). As a result, the standard prescription of raising distributionally adverse carbon taxes and reducing fossil fuel subsidies to raise resources faced political pushback in several countries (Copland 2020; Green 2021), and low rates elsewhere. Reduced taxes on capital, by contrast, was viewed as a way to improve growth (Bhattarai et al. 2018; Font et al. 2018), and working against broader fiscal action. Progress with carbon pricing remained modest across 44 OECD and G20 countries, with 55–70% of all carbon emissions from energy use entirely unpriced as of 2018 (OECD 2021a). Climate-vulnerable countries meanwhile faced sharply rising cost of sovereign debt. Buhr et al. (2018) calculate the additional financing costs of Climate Vulnerable Forum countries of USD40 billion 5 on government debt over the past 10 years and USD62 billion for the next 10 years. Including private financing cost, the amount increases to USD146–168 billion over the next decade.
Credit risks. The third headwind is rising financial and insurance sector risks and stresses (distinct from real ‘physical’ climate risks above) arising from the impacts of climate change, and systematically affecting both national and international financial institutions and raising their credit risks ( high confidence) (Dafermos et al. 2018; Rudebusch 2019; Battiston et al. 2021a). Central banks are beginning to take notice (Carney 2019; NGFS 2019). It is also the case that, even if at greater risk from stranded assets in the future, the large-scale financing of new fossil fuel projects by large global financial institutions rose significantly since 2016, because of perceived lower private risks and higher private returns in these investments and other factors than in alternative but perceived more risky low-carbon investments.
Global growth. The fourth headwind entering 2020 was the sharply slowing global macroeconomic growth, and prospects for near-term recession (which occurred in the pandemic). During global real and financial cycle downturns (Jordà et al. 2019), the perception of general financial risk rises, causing financial institutions and savers to reallocate their financing to risk-free global assets ( high confidence). This ‘flight to safety’ was evident even before the recent pandemic, marked by an extraordinary tripling of financial assets to about USD16.5 trillion in negative-interest earning ‘safer’ assets in 2019 in world debt markets – enough to have nearly closed the total financing gap in climate finance over a decade.
15.2.3Impact of COVID-19 Pandemic
The macroeconomic headwinds have worsened dramatically with the onset of COVID-19. Almost two years after the pandemic started, it is still too uncertain and early to conclude impacts of the pandemic until 2025–2030, especially as they affect climate finance. Multiple waves of the pandemic, new virus mutations, accumulating human toll, and growing vaccine coverage but vastly differing access across developed versus developing regions, are evident. They are causing divergent impacts across sectors and countries, which combined with the divergent ability of countries and regions to mount sufficient fiscal and monetary policy actions imply continued high uncertainty on the economic recovery paths from the crisis. The situation remains more precarious in middle- and low-income developing countries (IMF 2021a). While recovery is happening, the job losses have been large, poverty rates have climbed, public health systems are suffering long-term consequences, education gains have been set back, public debt levels are higher (5–10% of GDP higher), financial institutions have come under longer-term stress, a larger number of developing countries are facing debt distress, and many key high-contact sectors, such as tourism and trade, will take time to recover (Eichengreen et al. 2021). The implication is negative headwinds for climate finance with public attention focused on pandemic relief and recovery and limited (and divergent) fiscal headroom for a low-carbon transition, with considerable uncertainties ahead (Hepburn et al. 2020b; Maffettone and Oldani 2020; Steffen et al. 2020).
The larger and still open public policy choice question that COVID-19 now raises is whether there is room for public policy globally and in respect of their individual economies to integrate climate more centrally to their growth, jobs and sustainable development strategies worldwide for ecological and economic survival. The outcomes will depend on the robustness of recovery from the pandemic, and the still evolving public policy responses to the climate agenda in the recovery process. Private equity and asset markets have recovered surprisingly rapidly during the pandemic (in response to the massive fiscal and central bank actions generating large excess savings with very low or negative yields boosting stock markets). On public spending, some early studies suggest that the immediate economic recovery packages were falling well short of being sufficiently climate sustainable (Gosens and Jotzo 2020; Kuzemko et al. 2020; O’Callaghan 2021) but several governments have also announced intentions to spend more on a green recovery, ‘build back better’ and Just Transition efforts (Section 15.2.4), although outcomes remain highly uncertain (Lehmann et al. 2021; Markandya et al. 2021).
An important immediate finding from the COVID-19 crisis was that the slowdown in economic activity is illustrating some of these choices: immediately after the onset, more costly and carbon-intensive coal use for energy use tumbled in major countries such as China and the USA, while the forced ‘stay-at-home’ policies adopted around the major economies of the world led to a –30–35% decline in individual country GDP, and was in turn associated with a decrease in daily global CO2 emissions by –26% at their peak in individual countries, and –17% globally (–11 to –25% for ±1σ) by early April 2020 compared with the mean 2019 levels, with just under half coming from changes in surface transport, city congestion and country mobility (Le Quéré et al. 2020). Along with the carbon emissions drop was a dramatic improvement in other parameters such as clean air quality. Moreover, longer-term behavioural impacts are also possible: a dramatic acceleration of digital technologies in communications, travel, retail trade and transport. The question however is whether the world might revert to the earlier carbon-intensive path of recovery, or to a different future, and the choice of policies in shaping this future. Studies generally suggest that the gains from long-term impacts of the pandemic on future global warming will be limited and depend more on the nature of public policy actions and long-term commitments by countries to raise their ambitions, not just on climate but on sustainable development broadly (Barbier 2020; Barbier and Burgess 2020; Forster et al. 2020; Gillingham et al. 2020; Reilly et al. 2021). The positive lesson is clear: opportunities exist for accelerating structural change, and for a re-orientation of economic activity modes to a low-carbon use strategy in areas such as coal use in energy consumption and surface transport, city congestion and in-country mobility, for which lower-cost alternatives exist and offer potentially dramatic gains (Hepburn et al. 2020b).
A new consensus and compact towards such a structural change and economic stimulus instruments may therefore need to be redrawn worldwide, where an accelerated low-carbon transition is a priority; and accelerated climate finance to spur these investments may gain by becoming fully and rapidly integrated with near-term economic stimulus, growth and macroeconomic strategies for governments, central banks, and private financial systems alike. If that were to happen, COVID-19 may well be a turning point for sustainable climate policy and financing. Absent that, a return to ‘business-as-usual’ modes will mean a likely down-cycle in climate financing and investments in the near term.
Expectations that the recovery package stimulus will increase economic activity rely on the assumption that increased credit investment will have a positive effect on demand, the so-called demand-led policy (Mercure et al. 2019). The argument for a green recovery also draws on the experience from the post-global financial crisis in 2008–2009 recovery, in which large economies such as China, South Korea, the USA and the EU observed that green investments propelled the development of new industrial sectors. Noticeably, this had a positive net effect on job creation when compared to the investment in traditional infrastructure (UKERC 2014; Vona et al. 2018; Jaeger et al. 2020). For a more in-depth discussion on macroeconomic-finance possible response see Section 15.6.3. Here, we conclude with the options for reviving a better globally coordinated macroeconomic climate action. The options are some combinations of five possible elements:
1. Reaffirmation of a strong financial agenda in future UNFCCC Conference of Parties meetings, and a new collective finance target, which will need to be undertaken by 2025. Given that the shortfalls in financing are likely to be acute for developing regions and especially the more debt-stressed and vulnerable (Dibley et al. 2021; Elkhishin and Mohieldin 2021; Laskaridis 2021; Umar et al. 2021), developed countries may wish to step up their collective support (Resano and Gallego 2021). One possibility is to expedite the new Special Drawing Rights (SDR) issuance allocation rules for the USD650 billion recently (2021) approved, most of which will go to increase the reserves of G7 and other high-income countries unless voluntarily reallocated towards the needs of the most vulnerable low-income countries, raising resources potentially ‘larger than the Marshall Plan in today’s money’ (IMF 2021b; Jensen 2021; Obstfeld and Truman 2021), with decisions to be taken. Ameli et al. (2021a) note the climate investment trap of the current high cost of finance that effectively lowers green electricity production possibilities in Africa for a cost optimal pathway. Other initiatives could also include G7 and G20 governments (especially with the lead taken by the developed members for cross-border support to avoid over-burdening public resources in developing countries) running coordinated fiscal deficits to accelerate the financing of low carbon investments (‘green fiscal stimulus’).
2. Introducing new actions, including regulatory, to take some of the risks off the table from institutional financial players investing in climate mitigation investment and insurance. This could include the provision of larger sovereign guarantees to such private finance, primarily from developed countries but jointly with developing countries to create a level playing field (Dafermos et al. 2021) backed by explicit and transparent recognition of the ‘social value of mitigation actions’ or SVMAs, as fiscally superior (because of bigger ‘multipliers’ of such fiscal action to catalyse private investment than direct public investment) and the bigger social value of such investments (Article 108, UNFCCC) (Hourcade et al. 2018; Krogstrup and Oman 2019).
3. Facilitating and incentivising much larger flows of cross-border climate financing which is especially crucial for such investments to happen in developing regions, where as much as two-thirds of collective investment may need to happen (IEA 2021a), and where the role of multilateral, regional and global institutions such as the International Monetary Fund (IMF) (including the expansion in availability of climate SDRs referred to earlier) could be important.
4. Global central banks acting in coordination to include climate finance as an intrinsic part of their monetary policy and stimulus (Carney 2019; Jordà et al. 2019; Hilmi et al. 2021; Schoenmaker 2021; Svartzman et al. 2021).
5. An acceleration of Just Transition initiatives, outlined further below (Section 15.2.4).
15.2.4Climate Finance and Just Transition
Climate financein support of a Just Transition is likely to be a key to a successful low-carbon transition globally ( high confidence). Ambitious global climate agreements are likely to work far better by maximising cooperative arrangements (IPCC 2018; Gazzotti et al. 2021) with greater financing support from developed to developing regions in recognition of ‘common but differentiated responsibilities and respective capabilities’ and a greater ethical sense of climate justice (Khan et al. 2020; Sardo 2020; Warner 2020; Pearson et al. 2021). While Just Transition issues apply within developed countries as well (see later discussion), these are of relatively second-order significance to addressing climate justice issues between richer and poorer countries – given the scale of financing and existing social safety nets in the former and their absence in the latter. For example, over the past three decades drought in Africa has caused more climate-related mortality than all climate-related events combined from the rest of the world (Warner 2020). These issues can however serve both as a bridge and a barrier to greater cooperation on climate change. The key is to build greater mutual trust with clearer commitments and well-structured key decisions and instruments (Sardo 2020; Pearson et al. 2021).
The Just Transition discussion has picked up steam. It was explicitly recognised in the Paris Agreement and the 2018 Just Transition Declaration signed by 53 countries at COP24, which ‘recognised the need to factor in the needs of workers and communities to build public support for a rapid shift to a zero-carbon economy.’ Originally proposed by global trade unions in the 1980s, the recent discourse has become broader. It has coalesced into a more inclusive process to reduce inequality across all three areas of energy, environment and climate (McCauley and Heffron 2018; Bainton et al. 2021). It seeks accelerated public policy support to ensure environmental sustainability, decent work, social inclusion and poverty eradiation (Burrow 2017), widely shared benefits, and protection of indigenous rights, and livelihoods of communities and workers who stand to lose (including workers in fossil fuel sectors such as coal and oil and gas) (UNFCCC 2018b; EBRD 2020; Jenkins et al. 2020). Because the process involves ‘climate justice’ and equity within and across generations, it involves difficult political trade-offs (Newell and Mulvaney 2013). The implications for a Just Transition in climate finance are clear: expanding equitable and greater access to climate finance for vulnerable countries, communities and sectors, not just for the most profitable private investment opportunities, and a larger role for public finance in fulfilling existing finance commitments (Bracking and Leffel 2021; Kuhl 2021; Long 2021; Roberts et al. 2021).
Large shocks such as pandemics, and slow-growing ones such as climate, are typically known to worsen inequality (IMF and World Bank 2020 ). Evidence from 133 countries between 2001–2018 suggests that such shocks can cause social unrest, and migration pressures, especially when starting inequality is high and social transfers are low (Saadi Sedik and Xu 2020). Additionally, climate policies are more politically difficult to implement when the setting is one of high inequality but much less politically costly where incomes are more evenly distributed with stronger social safety nets (Furceri et al. 2021). A redrawn social compact incorporating climate (Beck et al. 2021) that would adopt redistributive taxes and lower carbon consumption, and strengthen state capacity to deliver safety nets, health and education with accelerated climate and environmental sustainability within and across countries, is increasingly recognised as important. Countries, regions and coordination bodies of the larger countries (G7, G20) have already begun such a shift to financing of a Just Transition, but primarily focused on the developed countries, although gaps remain (Krawchenko and Gordon 2021).
Such a redrawing of a social compact has happened significantly in the past, for example, after the 1860s ‘gilded age of capital’ with the enlargement of the franchise in democratisation waves in Europe and the Americas (Dasgupta and Ziblatt 2015, 2016). Not only was social conflict avoided but growth outcomes became more equitable and faster. Similarly, comprehensive modern social safety nets and progressive taxation, which started in the Great Depression and was extended in the post-war period, had both a positive pro-growth and lower inequality effects (Brida et al. 2020).
There are three levels at which policy attention on climate financing now may need to be focused. The first is the need to address the global equity issues in climate finance in a more carefully constructed globally cooperative public policy approach. The second is to address issues appropriately with enhanced support, at the national level. The third is to work it down further, to addressing needs at local community levels. Because private investors and financing mostly deal with allocation to climate finance at a global portfolio level, then to allocation by countries, and finally to individual projects, the challenge for them is to refocus attention to Just Transition issues at the country level, but also globally as well as locally (in other words, at all three levels).
Climate finance will likely face greater challenges in the post-pandemic context (Hanna et al. 2020; Henry et al. 2020). Evidence from the COVID-19 pandemic suggests that those in greatest vulnerability often had the least access to human, physical, and financial resources (Ruger and Horton 2020). It has also left in in its wake divergent prospects for economic recovery, with rising constraints on credit ratings and costly debt burden in many developing countries contrasted with the exceptionally low interest rate settings in developed economies driving the limited fiscal space in the former groups (Benmelech and Tzur-Ilan 2020). Similarly, monetary policies are likely to be much tighter in developing countries in part structurally because of the absence of ‘exceptional privilege’ of global reserve currencies in developed economies.
The result is a divergence in recovery prospects in the aftermath of the pandemic, with output losses (compared to potential) set to worsen in developing economies (excluding China) as compared to developed countries (IMF 2020b). In these circumstances, a coordinated and cooperative approach, instead of unilateralism, might work better (McKibbin and Vines 2020). In the case of climate, simulations clearly suggest the need and advantages of better coordinated climate action with stepped-up Paris Agreement envisaged transfers (IMF 2020b). Several options in international climate finance arrangements to support a Just Transition are both available and urgent.
As a first priority, measures might need to accelerate a mix of equitable financial grants, low-interest loans, guarantees and workable business models access across countries and borders, from developed countries to low-income countries. A big push on low-carbon energy access globally, especially in large low-income regions such as Africa, with accelerated financial transfers, makes sense (Boamah 2020). For about one billion people globally at the base of the pyramid without access to modern low-carbon energy access, such an action, with enormous immediate leap-frogging potential, would be a key pathway to achieve the SDGs, ensure that high-carbon energy use is avoided, such as the burning of biomass and forests for charcoal, and improve air quality and public health, especially women’s health (van der Zwaan et al. 2018; Nathwani and Kammen 2019; Dalla Longa and van der Zwaan 2021; Michaelowa et al. 2021; Osabuohien et al. 2021).
A second priority is to accelerate the implementation of the USD100 billion a year (and likely more, given growing financing gaps) in climate finance commitments expressed in the Copenhagen Agreement Accord (and reiterated since) from developed to developing countries, and to build greater confidence by agreeing rapidly on key definitions. Shifting to a grant equivalent net flows definition of climate finance, which is now universally accepted for all other aid flows by all parties since 2014 and which took effect since 2019 on every other public international good finance provision (under the SDGs), with the sole exception of climate finance, would resolve many uncertainties: the disbursement of climate finance flows on a grant equivalent basis that is comparable across institutions, instruments and countries, and measurement with greater accuracy about the effective transfer of resources. The journey to get to a clear and precise definition of net official overseas development assistance (ODA) took time. The original proposal was first initiated in the 1960s (Pincus 1963) but it was not till multilateral development banks (MDBs) and others laid out the compelling reasons why (Chang et al. 1998) that this was accomplished: especially to resolve decades of confusion and inconsistency between different types of financial flows and hence the perennial measurement problems and ‘the compromise between political expediency and statistical reality’ (Bulow and Rogoff 2005; Hynes and Scott 2013; Scott 2015, 2017).
A third related and increasingly crucial priority is to expedite the operational definition of blended finance and promote the use of public guarantee instruments. Private flows to accelerate the low-carbon transition in developing countries would benefit enormously, by gaining clearer access to public international funds and support defined on a grant equivalent basis, provided development and climate finance operational definitions and procedures were improved on an urgent basis (Blended Finance Taskforce 2018a; OECD-DAC 2021). When blended and supported by public finance and policy, the grant equivalency measure can easily and more accurately measure the value and benefit of blended public and private finance by comparing the effective interest cost (and volume) gain with such financing, against the benchmark costs without such blending. Here again, a pressing challenge is to improve the operational definitions of what counts as ODA within blended finance. Blended finance remains very poorly defined and accounted (Pereira 2017; Andersen et al. 2019; Attridge and Engen 2019; Basile and Dutra 2019). Guarantees are expressly not included in the definition of ODA (Garbacz et al. 2021). As a result, bilateral and multilateral agencies have no incentive or limited authority and basis to use such instruments, while multilateral development banks continue to approach guarantees with great caution because of the limits of their original charters (World Bank 2009) and require counter-indemnities by recipient countries, internal and historic agency inertia, perceived loss of control over the use of funds (compared to their preferred direct project-based lending) and employ restrictive accounting rules for capital provisioning of guarantees at 100% of their face value to maintain AAA ratings with credit rating agencies (Humphrey 2017; Pereira dos Santos and Kearney 2018; Bandura and Ramanujam 2019; Hourcade et al. 2021a). Largely because of such official uncertainty the actual flows of blended finance and guarantees continue to remain a very small share (typically, less than 5%) of official and multilateral finance flows to lower project risks and costs, and hence the potential for large-scale accelerated low-carbon private investments in developing countries. Public guarantees can offer a fifteen times multiplier effect on the scale of low-carbon investments generated with such support, compared to a 1:1 ratio in direct financing (Hourcade et al. 2021a).
It makes sense to expedite these operational procedures (Khan et al. 2020) which cannot be otherwise explained except in terms of avoiding responsibilities, even where the benefits would be high (Klöck et al. 2018). It also causes (unnecessary) fragmentation and complexity and often ‘strategic’ ambiguity by many actors (Pickering et al. 2017), which worsens the possibilities for international cooperation, a critical requirement to achieve the Paris goals (IPCC 2018). The world would gain collectively if these issues were to be decided soon. The absence of such a collective decision continues to be exceptionally costly for the implementation of the Paris Agreement because of the fractious and seemingly insoluble negotiating climate and a breakdown of trust that this has created (Roberts and Weikmans 2017).
A fourth priority is expanding jobs and dealing with job losses in the global low-carbon transition (Carley and Konisky 2020; Crowe and Li 2020; Pai et al. 2020; Cunningham and Schmillen 2021; Hanto et al. 2021), especially in coal and other sectors, as well as land and other effects for indigenous communities (Zografos and Robbins 2020). Many countries, especially low-income countries, remain dependent on fossil fuels for their energy and exports and jobs, and support for their transition to a low-carbon future will be essential. Global recovery from the pandemic will take longer than initially envisaged (IMF 2021c; OECD 2021b) and an accelerated climate action for a Build Back Better global infrastructure plan with better and more resilient jobs might play a key role as part of the Just Transitions. Already, there is substantial evidence (Sulich et al. 2020; Dell’Anna 2021; Dordmond et al. 2021) that a more sustainable climate path would generate many more net productive jobs (with much higher employment multipliers and mutual gains from given spending) than would any other large-scale alternative. But this would nevertheless require a carefully managed transition globally, including access to much larger volumes of climate financing in developing economies (Muttitt and Kartha 2020). The multilateral finance institutions have generally played a supportive role, expanding their financing to developing countries during the pandemic (even as bilateral aid flows have fallen sharply), but have been hampered by the constraints on their mandates and instruments (as noted earlier). Political leadership and direction will be again crucial to enhance their roles. The recent expansion of SDR quotas at the IMF similarly might help, but the current distributions of quota benefits flow primarily to the developed countries and do little to expand investment flows on a longer-term basis for a global expansion in growth and job opportunities in the low-carbon transition.
As a fifth priority, transformative climate financing options based on equityand global sustainability objectives may also need to consider a greater mix of public pricing and taxation options on the consumption side (Arrow et al. 2004; Folke et al. 2021). Two-thirds of global GHG emissions directly or indirectly are linked to household consumption, with average per capita carbon footprint of North America and Europe of 13.4 and 7.5 tCO2-eq per capita, respectively, compared to 1.7 in Africa and Middle East (Gough 2020) and as high as 200 tCO2-eq per capita among the top 1% in some high-income geographies versus 0.1 tCO2-eq at the other end of the income distribution in some least-developed countries (Chancel and Piketty 2015). Globally, the highest-expenditure households account for eleven times the per capita emissions of lowest-expenditure households, with rising carbon income elasticities that suggest ‘redistribution of carbon shares from global elites to global poor’ as welfare efficient (Chancel and Piketty 2015; Hubacek et al. 2017). Within countries and regions,and within sectors, similar patterns hold. The top 10% of the population with the highest per capita footprints account for 27% of the EU carbon footprint, and the top 1% have a carbon footprint of 55 tCO2-eq per capita, with air transport the most elastic, unequal and carbon-intensive consumption (Ivanova and Wood 2020). Similarly, within sectors, there are large differences in carbon-intensity in the building sector in North America (Goldstein et al. 2020) and across cities where consumption-based GHG emissions vary widely across the world (ranging from 1.8 to 25.9 tCO2-eq per capita).
Numerous options exist (Broeks et al. 2020; Nyfors et al. 2020) for such carbon consumption reduction measures, while potentially improving societal well-being, for example: (i) inner-city zoning restrictions on private cars and promoting walking/bicycle use and improved shared low-carbon transport infrastructure; (ii) advertising regulation and carbon taxes and fees on high-carbon luxury status goods and services; (iii) subsidies and exemptions for low-carbon options, higher value-added taxes on specific high-carbon products and services, subsidies for public low-carbon options such as commuter transport, and other behavioural nudges (Reisch et al. 2021); and (iv) framing options (emphasising total cost of car over lifetimes), mandatory smart metering, collective goods and services (leasing, renting, sharing options) and others. Finally, reducing subsidies on fossil fuels, raising the progressivity of taxes and raising overall wealth taxes on the richest households, which have been sharply falling (Scheuer and Slemrod 2021) even as global income and wealth have risen, with regressive and falling overall taxes (Alvaredo et al. 2020; Saez and Zucman 2020), could effectively generate significant revenues (over 1% of GDP yr –1), about the same size as the proposed global USD50 pertonne carbon price proposed and estimated by the IMF/OECD 2021 report to the G20 (IMF and OECD 2021) to cover expected net interest costs on overall decarbonisation initiatives and financing of green new deals (Schroeder 2021).
These five options identified above on near-term actions and priorities will however, require greater collective political leadership. A review of past crisis episodes suggests that collective actions to avoid large global or multi-country risks work well primarily when the problems are well defined, a small number of actors are involved, solutions are relatively well established scientifically, and public costs to address them are relatively small (Sandler 1998, 2015) (for example, dealing with early pandemic outbreaks such as Ebola, TB, and cholera; extending global vaccination programmes such as smallpox, measles and polio; early warning systems and actions for natural disasters such as tsunamis, hurricanes/cyclones and volcanic disasters; the Montreal Protocol for ozone-depleting refrigerants, and renewables wind and solar energy development). They do not appear to work as well for more complex global collective action problems which concern a number of economic actors, sectors, without inexpensive and mature technological options, and where political and institutional governance is fragmented. Greater political coordination is needed because the impacts are often not near term or imminent, but diffuse, slow moving and long term, and where preventive disaster avoidance is costly even when these costs are low compared to the longer-term damages – till tipping points are reached of the need for reduced ‘stressors’ and increasing ‘facilitators’ (Jagers et al. 2020). But by then, it may be too late.
Private institutional investors equally might equally wish to pay greater attention to the Just Transition finance issues. It would be useful for investors to identify ways to support to such initiatives, and more clearly identify the benefits of such transition measures envisaged by both countries and investment financing proposals, including incorporating Just Transition consideration in their support to broader ESG and green financing initiatives.
The second level of attention needed on Just Transitions has to do with inequities within a large country setting, developed or developing. The Just Transition issue exists within developed countries as well. As the ongoing pandemic illustrates, the first climate burden hit is often felt most acutely at the level of states and cities, with many smaller ones without enough fiscal capacity or ability to mount an adequate discretionary counter policy. Only national governments have the ability to borrow more in their fiscal accounts to address large collective problems, whether pandemics or climate change. Therefore, it is important that national policies and funds be available for programmes to address the Just Transition issues for larger subnational states, cities and regions. This would be helped by countries including Just Transition initiatives in their NDCs for financing (as South Africa has recently done), and attention by external financing agencies and MDBs to large-scale adverse impacts in their climate policies and investments. For example, the EU Green Deal plans (Nae and Panie 2021) include several initiatives (focusing on industries, regions and workers adversely affected, with explicit programmes to address them).
The third level of argument is for a shift in focus from an exclusive attention to financing of mitigation and low-carbon new investments projects to also better understanding and addressing the local adverse impacts of climate change on communities and people, who are vulnerable and increasingly dispossessed due to losses and damages from climate change or even those who are impacted by decarbonisation measures in the fossil fuel sectors and transportation, as well as those who are harmed by polluting sectors: indigenous men and women, minorities and generally the poor. It is evident that very few resources are available to countries, investors, civil society, and smaller development institutions seeking to achieve a just transition (Robins and Rydge 2020).
Finally, greater support is warranted for smaller towns and cities, local networks, small and medium-sized enterprises (SMEs), communities, local authorities and universities for projects, research ideas and proposals (Lubell and Morrison 2021; Moftakhari et al. 2021; Stehle 2021; Vedeld et al. 2021).
15.3Assessment of Current Financial Flows
15.3.1Financial Flows and Stocks: Orders of Magnitude
Assessments of finance for climate action need to be placed within the broader perspective of all investments and financing flows and stocks. This section provides aggregate level reference points of relevance to the remainder of this chapter, notably when assessing current levels of climate and fossil fuel-related investments and financing (Sections 15.3.2.3 and 15.3.2.4 respectively), as well as estimates of investment and financing needed to meet climate objectives (Section 15.4).
Measures of financial flows and stocks provide complementary and interrelated insights into trends over time: the accumulation of flows, measured per unit of time, results in stocks, observed at a given point in time (IMF 2009; UN and ECB 2015). On the flows side, GDP, a System of National Accounts (SNA) statistical standard that measures the monetary value of final goods and services produced in a country in a given period of time. In 2020, global GDP represented above USD201570 trillion 6 (down from around 80 trillion USD2015 in 2019), out of which developed countries represented approximately 60% (Figure 15.1); a slowly decreasing share over the last years. The GDP metric is useful here as an indicator of the level of activity of an economy but gives no indication relating to human well-being or SDG achievements (Giannetti et al. 2015) as it counts positively activities that negatively impact the environment, without making deductions for the depletion and degradation of natural resources.
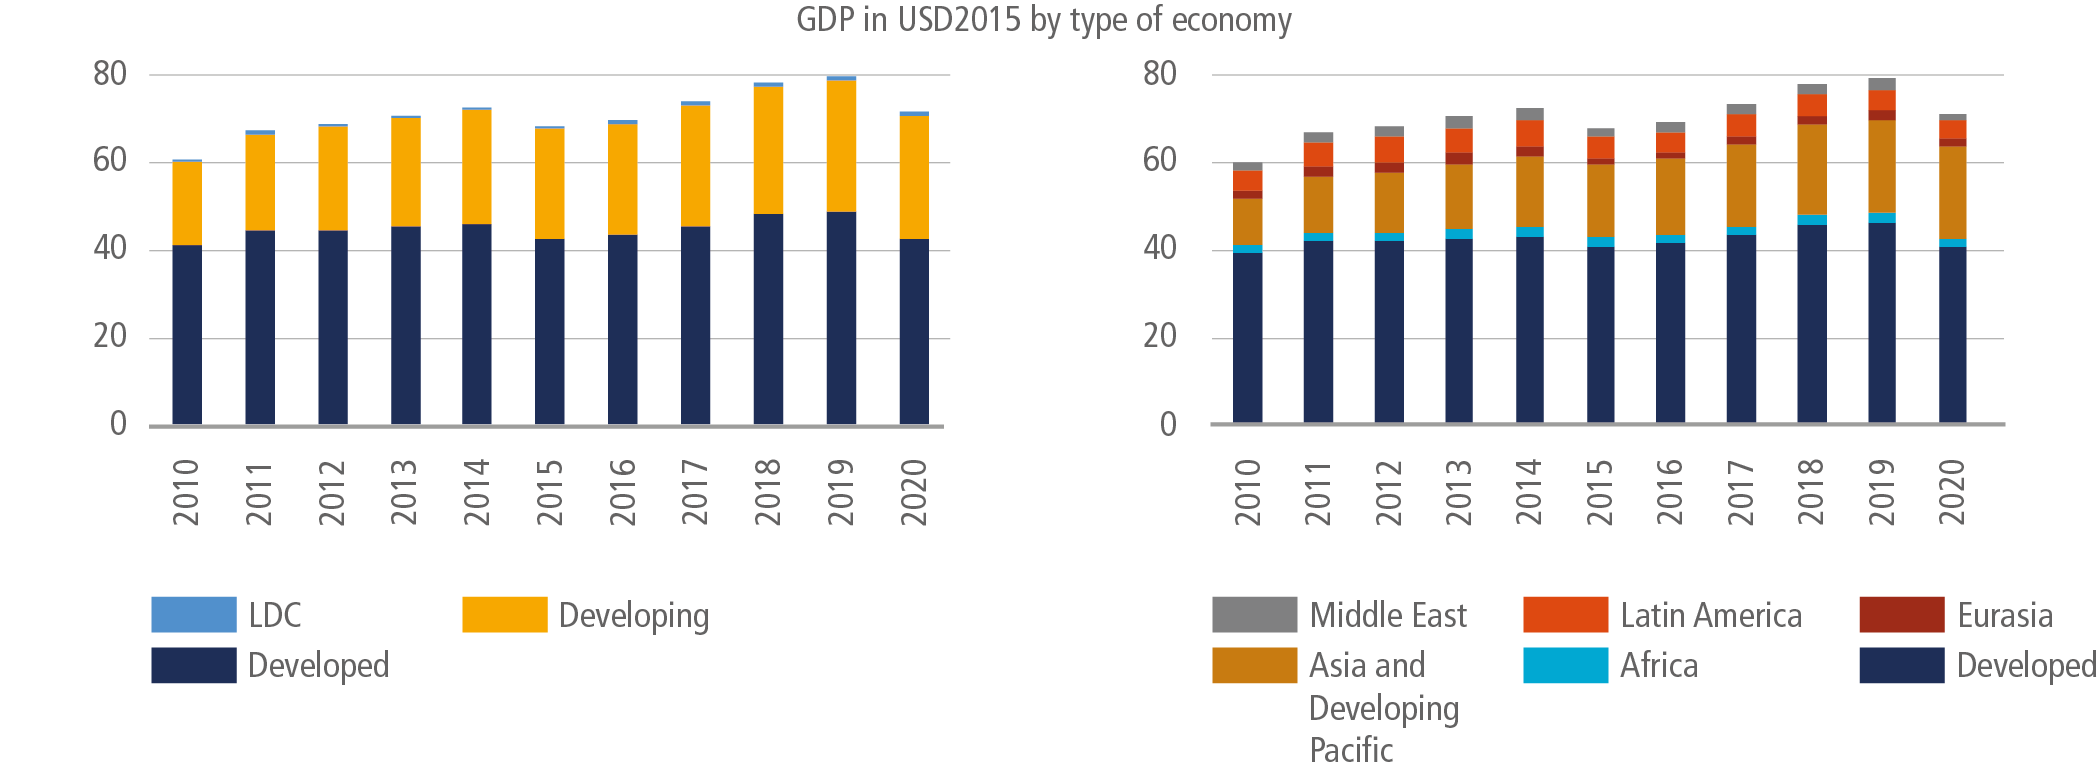
Figure 15.1 | Financial flows – GDP (trillion USD2015) by type of economy (left) and region (right). Note: Regional breakdown based on official UN country classification. GDP in trillion USD2015. Source: World Bank Data (2020a). Numbers represent aggregated country data. Last updated data on 15 September 2021. CC BY-4.0.
Gross-fixed capital formation (GFCF), another SNA standard that covers tangible assets (notably infrastructure and equipment) and intangible assets, is a good proxy for investment flows in the real economy. In 2019, global GFCF reached around 20 trillion USD2015 compared to around 14 trillion USD2015 in 2010, a more than 40% increase (Figure 15.2). Global GFCF represents about a quarter of global GDP, a relatively stable ratio since 2008. This share is, however, much higher for emerging economies, notably in Asia, which are building new infrastructure at scale. As analysed in Sections 15.4 and 15.5, infrastructure investment needs and gaps in developing countries are significant. How these are met over the next decade will critically influence the likelihood of reaching the Paris Agreement goals.
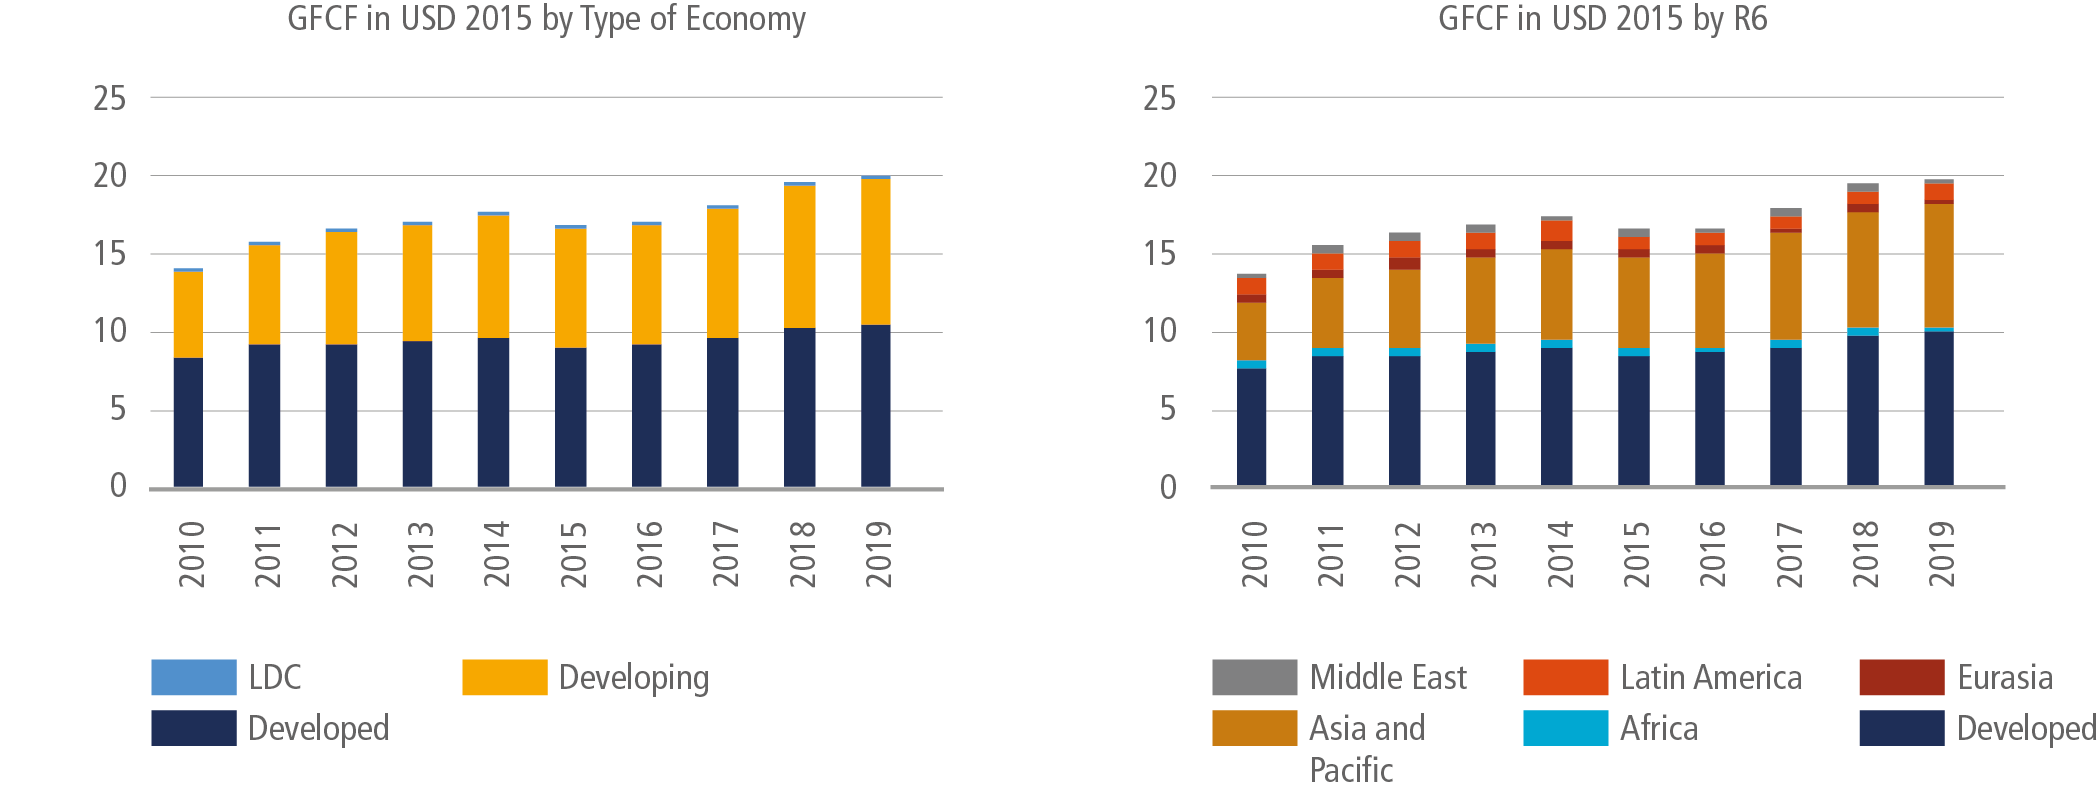
Figure 15.2 | Financial flows – GFCF (trillion USD2015) by type of economy (left) and region (right). Note: Regional breakdown based on official UN country classification. GDP in trillion USD2015. Gross fixed capital formation (GFCF) includes land improvements (fences, ditches, drains, and so on); plant, machinery, and equipment purchases; and the construction of roads, railways, and the like, including schools, offices, hospitals, private residential dwellings, and commercial and industrial buildings. Source: World Bank Data (2020b). Data for 2020 not available. Last updated data on 15 September 2021. CC BY-4.0.
On the stock side, an increasingly significant portion of the growing value of financial capital (stocks in particular) may be disconnected from the value of underlying productive capital in the real economy (Igan et al. 2020). This trend, however, remains uneven between developed countries, most of which have relatively deep capital markets, and developing countries at different stages of development (Section 15.6.7). Bonds, a form of debt financing, represent a significant share of total financial assets. As of August 2020, the overall size of the global bond markets (amount outstanding) was estimated at approximately USD128.3 trillion, out of which over two thirds was from ‘supranational, sovereign, and agencies’, and just under a third from corporations (ICMA 2020b). As discussed later in the chapter, since AR5, an increasing number and volume of bonds have been earmarked for climate action but these still only represent less than 1% of the total bond market. As of end-2020, climate-aligned bonds outstanding were estimated at USD0.9 trillion (Giorgi and Michetti 2021), though already raising concerns in terms of both underlying definitions (Section 15.6.6) and risks of increased climate-related indebtedness (Section 15.6.1, 15.6.3).
From the perspective of climate change action, these orders of magnitude make it possible to highlight the relatively small size of current climate finance flows and relatively larger size of remaining fossil fuel-related finance flows (discussed in the following two sub-sections), as well as, more generally, the significant overall scale of financial flows and stocks that have to be made consistent with climate goals. These orders of magnitude further make it possible to put in perspective climate-related investment needs (Section 15.4) and gaps (Section 15.5).
15.3.2Estimates of Climate Finance Flows
The measurement of climate finance flows continues to face similar definitional, coverage and reliability issues as at the time of AR5 and the Special Report on Global Warming of 1.5°C, despite progress made (more sources, greater frequency, and some definitional improvements) by a range of data providers and collators. Based on available estimates (Table 15.1 and Figure 15.3), flows of annual global climate finance are on an upward trend since AR5, reaching a high-bound estimate of USD681 billion in 2016 (UNFCCC 2018a), representing USD674 billion 2015. Latest available estimates indicate a drop in 2018 (Buchner et al. 2019) and a rebound in 2019 and 2020 (medium confidence) (Naran et al. 2021). Although not directly comparable in terms of scope, current climate finance flows remain small (approx. 3%) compared to the GFCF reference point introduced in Section 15.3.1, and need to be put in perspective with remaining fossil fuel financing (medium confidence) (Section 15.3.2.3).
Table 15.1 | Total climate finance flows between 2013 and 2020.
Source (type) | 2013 | 2014 | 2015 | 2016 | 2017 | 2018 | 2019 | 2020 |
UNFCCC SCF (total high) | 687 | 584 | 680 | 681 | Published after lit. cut-off | n/a | n/a | |
Deflated to USD2015 | 706 | 590 | 680 | 674 | ||||
UNFCCC SCF (total low/CPI) | 339 | 392 | 472 | 456 | /608 | /540 | /623 | /640 |
Deflated to USD2015 | 349 | 396 | 472 | 451 | /590 | /513 | /581 | /590 |
Note: CPI: Climate Policy Initiative; SCF: Standing Committee on Finance. Numbers in current billion USD. Deflated to USD2015 in italic. Given the variations in numbers reported by different entities, changes in data, definitions and methodologies over time, there is low confidence attached to the aggregate numbers presented here. The higher bound reported in the SCF’s Biennial Assessment reports includes estimates from the International Energy Agency on energy efficiency investments, which are excludes from the lower bound and CPI’s estimates. Sources: UNFCCC (2018a); Buchner et al. (2019); Naran et al. (2021).

Figure 15.3 | Available estimates of global climate finance between 2014 and 2020. Note: Numbers in current billion USD. Deflated to USD2015 see Table 15.1 in italic. Type of Economy figure (left) : Regional breakdown based on official UN country classification. ‘0’ no regional mapping information available. Sectoral figure (right) : Policy includes Disaster Risk Management; Policy and national budget support and capacity building. Transport includes Sustainable/Low-carbon Transport. Energy Efficiency includes Industry, Extractive Industries, Manufacturing & Trade, Low-carbon Technologies, Information and Communications Technology, Buildings and Infrastructure. Electricity includes Renewable Energy Feneration, “Infrastructure, energy and other built environment”, Transmission and Distribution Systems, and Energy Systems. No sector means no sector information available, or negligible flows. Other includes Non-energy GHG reductions, Coastal Protection. Source: own calculations, based on Naran et al. (2021).
At an aggregate level, in both developed and developing countries, the vast majority of tracked climate finance is sourced from domestic or national markets rather than cross-border financing (Buchner et al. 2019). This reinforces the point that national policies and settings remain crucial (Section 15.6.2), along with the development of local capital markets (Section 15.6.7).
Climate finance in developing countries remains heavily concentrated in a few large economies ( high confidence), with Brazil, India, China and South Africa accounting for around one-quarter to more than a third depending on the year, a share similar to that represented by developed countries. Least-developed countries (LDCs), on the other hand, continue to represent less than 5% year-on-year (medium confidence) (BNEF 2019; Buchner et al. 2019). Further, the relatively modest growth of climate finance in developed countries is a matter of concern given that economic circumstances are, in most cases, relatively more amenable to greater financing, savings and affordability than in developing countries.
At a global level, the majority of tracked climate finance is assessed as coming from private actors (Buchner et al. 2019), although, the boundaries between private and public finance include significant grey zones (Box 15.2), which implies that different definitions could lead to different conclusions (Yeo 2019; Weikmans and Roberts 2019). However, private investments in climate projects and activities often benefit from public support in the form of co-financing, guarantees or fiscal measures. In terms of financial instruments and mechanisms, debt as well as balance sheet financing (which can rely on both own resources and further debt) and project financing (combining a large debt portion and smaller equity portion) represent the lion’s share. In this context, the rapid rise of climate-related bond issuances since AR5 (Giorgi and Michetti 2021) represents an opportunity for scaling up climate finance but also poses underlying issues of integrity (Nicol et al. 2018a; Shishlov et al. 2018) and additionality (Schneeweiss 2019), as further discussed in Section 15.6.5, and needs to be considered in the context of overall indebtedness and debt sustainability (Sections 15.6.1 and 15.6.3).
Mitigation continues to represent the lion’s share of global climate finance (consistently above 90% between 2017 and 2020), and in particular renewable energy, followed by energy efficiency and transport ( high confidence) (UNFCCC 2018a; Buchner et al. 2019). While capacity additions on the ground kept rising, falling technology costs in certain sectors (e.g., solar energy) has had a negative impact on the year-on-year trend that can be observed in terms of volumes of climate finance (BNEF 2019; IRENA 2019a). However, such cost reduction could free up investment and financing capacities for potential use in other climate-related activities.
Tracking adaptation finance continues to pose significant challenges in terms of data and methods. Notably, the mainstreaming of resilience into investments and business decisions makes it difficult to identify relevant activities within financial datasets (Agrawala et al. 2011; Brown et al. 2015; Averchenkova et al. 2016). Despite these limitations, evidence shows that finance for adaptation remains fragmented and significantly below rapidly rising needs (Section 15.4 and Cross-Chapter Box FINANCE: Finance for Adaptation and Resilience in Chapter 17 of AR6 WGII report). Further, there is increasing awareness about the need to better understand and address the interlinkages between climate change adaptation and disaster risk reduction (DRR) towards achieving resilience (OECD 2020a). Watson et al. (2015) however, note that between 2003 and 2014, of the USD2 billion that flowed through dedicated climate change adaptation funds, only USD369 million explicitly went to DRR activities (Climate Funds Update 2014; Nakhooda et al. 2014a; Nakhooda et al. 2014b; Watson et al. 2015). For the private sector, insurance and reinsurance remain the dominant way to transfer risk as discussed in Section 15.6.4).
More generally, significant gaps remain to track climate finance comprehensively at a global level:
•Available estimates are based on a good coverage of investments in renewable energy and, where available, energy efficiency and transport, while other sectors remain more difficult to track, such as industry, agriculture and land use ( high confidence) (UNFCCC 2018a; Buchner et al. 2019).
•In contrast to international public climate finance, domestic public finance data remain partial despite initiatives to track domestic climate finance (e.g., Hainaut and Cochran 2018) and public expenditures ( high confidence) (for instance based on the UNDP’s Climate Public Expenditure and Institutional Review approach).
Data on private and commercial finance remain very patchy, particularly for corporate financing (including debt financing provided by commercial banks), for which it is difficult to establish a link with activities and projects on the ground ( high confidence). Further, as individual sources of aggregate reporting (UNFCCC 2018a; Buchner et al. 2019; FS-UNEP Centre and BNEF 2020) tend to rely on the same main data sources (notably the BNEF commercial database for renewable energy investments) as well as to cross-check numbers against similar other sources, there is a potential for ‘group-think’ and bias.
Such data gaps as well as varying definitions of what qualifies as ‘climate’ (or more broadly as ‘green’ and ‘sustainable’) not only pose a measurement challenge. They also result in a lack of clarity for investors and financiers seeking climate-related opportunities. Such uncertainty can lead both to reduced climate finance as well as to a lack of transparency in climate-related reporting (further discussed in Section 15.6.1), which in turn further hinders reliable measurement.
In terms of finance provided and mobilised by developed countries for climate action in developing countries, while accounting scope and methodologies continue to be debated (Box 15.4), progress has been achieved on these matters in the context of the UNFCCC (UNFCCC 2019b). A consensus, however, exists, on a need to further scale up public finance and improve its effectiveness in mobilising private finance (OECD 2020b), as well as to further prioritise adaptation financing, in particular towards the most vulnerable countries (Carty et al. 2020). The relatively low share of adaptation in international climate finance to date may in part be due to a low level of obligation and precision in global adaptation rules and commitments (Hall and Persson 2018). Further, providers of international climate finance may have more incentive to support mitigation over adaptation as mitigation benefits are global while the benefits of adaptation are local or regional (Abadie et al. 2013).
Box 15.4 | Measuring Progress Towards the USD100 Billion yr–1by 2020 Goal – Issues of Method
In 2009, at COP15, Parties to the UNFCCC agreed the following: ‘In the context of meaningful mitigation actions and transparency on implementation, developed countries commit to a goal of mobilising jointly USD100 billion a year by 2020 to address the needs of developing countries. This funding will come from a wide variety of sources, public and private, bilateral and multilateral, including alternative sources of finance’ (UNFCCC 2009).
This goal is further embedded as a target under SDG 13 Climate Action. While the parameters for what and how to count were not defined when the goal was set, progress in this area has been achieved under the UNFCCC (UNFCCC 2019b) and via a UN-driven independent expert review (Bhattacharya et al. 2020).
There remain well documented interpretations and debates on how to account for progress (Clapp et al. 2012; Stadelmann et al. 2013; Jachnik et al. 2015; Weikmans and Roberts 2019). Different interpretations relate mainly to the type and proportion of activities that may qualify as ‘climate’ on the one hand, and to how to account for different types of finance (and financial instruments) on the other hand. As an example, there are different points at which financing can be measured, for example, pledges, commitments, disbursements. There can be significant lags between these different points in time, for example disbursements may spread over time. Further, the choice of point of measurement can have an impact on both the volumes and on the characteristics (geographical origin, labelling as public or private) of the finance tracked. The enhanced transparency framework under the Paris Agreement may lead to improvements and more consensus in the way climate finance is accounted for and reported under the UNFCCC. Available analyses specifically aimed at assessing progress towards the USD100 billion goal remain rare, for example the UNFCCC SCF Biennial Assessments do not directly address this point (UNFCCC 2018a). Dedicated OECD reports provide figures based on accounting for gross flows of climate finance based on analysing activity-level data recorded by the UNFCCC (bilateral public climate finance) and the OECD (multilateral public climate finance, mobilised private climate finance and climate-related export credits) (OECD 2015a; OECD 2019a; OECD 2020b). For 2018, the OECD analysis resulted in a total of USD78.9 billion, out of which USD62.2 billion of public finance, USD2.1 billion of export credits and USD14.5 billion of private finance was mobilised. Mitigation represented 73% of the total, adaptation 19% and cross-cutting activities 8%.
Reports by Oxfam provide a complementary view on public climate finance, building on OECD figures and underlying data sources to translate gross flows of bilateral and multilateral public climate finance in grant equivalent terms, while also, for some activities, applying discounts to the proportion considered as climate finance (Carty et al. 2016; Carty and Le Comte 2018; Carty et al 2020). The resulting annual averages for 2015–2016 and 2017–2018 range between 32% (low bound) and 44% (high bound) of gross public climate finance. The difference with OECD figures stems from the high share represented by loans, both concessional and non-concessional, in public climate finance, that is, 74% in 2018 (OECD 2020b).
A point of method that attracts much attention relates to how to account for private finance mobilised. The OECD, through its Development Assistance Committee, established an international standard to measure private finance mobilised by official development finance, which consists in methods tailored to different financial mechanisms. These methods take into account the role of, risk taken, and/or amount provided by all official actors involved in a given project, including recipient country institutions, thereby also avoiding risks of double counting (OECD 2019b). MDBs apply a different method (World Bank 2018a) in their joint climate finance reporting (AfDB et al. 2020), which neither correspond to the geographical scope of the USD100 billion goal, nor address the issue of attribution to the extent required in that context.
Notwithstanding methodological discussions under the UNFCCC, there is still some distance from the USD100 billion a year commitment being achieved, including in terms of further prioritising adaptation. While the scope of the commitment corresponds to only a fraction of the larger sums needed (Section 15.4), its fulfilment can both contribute to climate action in developing countries as well as to trust building in international climate negotiations. Combined with further clarity on geographical and sectoral gaps, this can, in turn, facilitate the implementation of better coordinated and cooperative arrangements for mobilising funds (Peake and Ekins 2017).
15.3.3Fossil Fuel-related and Transition Finance
As called for by Article 2.1c of the Paris Agreement and introduced in Section 15.3.1, achieving the goal of the Paris Agreement of holding the increase in the global average temperature to well below 2°C above pre-industrial levels and pursuing efforts to limit the temperature increase to 1.5°C above pre-industrial levels requires making all finance consistent with this goal. Data on investments and financing to high GHG activities remain very partial and difficult to access, as relevant actors currently have little incentive or obligations to disclose such information compared to reporting on and communicating about their activities contributing to climate action. Further, the development of methodologies to assess finance for activities misaligned with climate mitigation goals, for hard- and costly-to-abate sectors such as heavy industries, as well as for activities that eventually need to be phased out but can play a transition role for a given period, remain work in progress. This results in limited empirical evidence to date.
In modelled pathways that limit warming to 1.5°C (>50%) with no or limited overshoot, however, make it clear that the share of fossil fuels in energy supply has to decrease (see Chapter 3). For instance, the International Energy Agency (IEA) Net Zero by 2050 scenario relies on halting sales of new internal combustion engine passenger cars by 2035, rapid and steady decrease of the production of coal (minus 90%), oil (minus 75%) and natural gas (minus 55%) by 2050, and phasing out all unabated coal and oil power plants by 2040 (IEA 2021b). To avoid locking GHG emissions incompatible with remaining carbon budgets, this implies a rapid scaling down of new fossil fuel-related investments, combined with a scaling up of financing to allow energy and infrastructure systems to transition (high confidence).
The IEA provides comprehensive analyses of global energy investments, estimated at about USD1.8 trillion a year over 2017–2019 (IEA 2019a, 2020a), and expected to reach that level again in 2021 after a drop to about 1.6 trillion in 2020 (IEA 2021c). Energy investments represent about 8% of global GFCF (Section 15.3.2.1). In the power sector, fossil fuel-related investments reached an estimated USD120 billion yr –1 on average over 2019–2020, which remains well above the level that underpin the IEA’s own Paris-compatible Sustainable Development Scenario (SDS) and Net Zero Emission (NZE) scenarios. The IEA observes a similar inconsistency for supply-side new investments: in 2019–2020 on average yr –1, an estimated USD650 billion were invested in oil supply and close to USD100 billion in coal supply. These estimates also result in fossil fuel investments remaining larger in aggregate than the total tracked climate finance worldwide (Section 15.3.2.2). For oil and gas companies, which are amongst the world’s largest corporations and sometimes government owned or backed, low-carbon solutions are estimated to represent less than 1% of capital expenditure (IEA 2020b). As discussed in the remainder of this chapter, shifting investments towards low-GHG solutions requires a combination of conducive public policies, attractive investment opportunities, as well as the availability of financing to finance such a transition.
In terms of financing provided to fossil fuel investments, available analyses point out a still significant role played by commercial banks and export credit agencies. Commercial banks provide both direct lending as well as underwriting services, the latter facilitating capital raising from investors in the form of bond or share issuance. Available estimates indicate that lending and underwriting extended over 2016– 2019 by 35 of the world’s largest banks to 2100 companies active across the fossil fuel lifecycle reached USD687 billion yr –1 on average (Rainforest Action Network et al. 2020). Official export credit agencies, which are owned or backed by their government, de-risk exports by providing guarantees and insurances or, less often, loans. In 2016–2018, available estimates indicate the provision of about USD31 billion yr –1 worth of fossil fuel-related official export credits, out of which close to 80% was for oil and gas, and over 20% for coal (DeAngelis and Tucker 2020).
Finance for new fossil fuel-related assets lock in future GHG emissions that may be inconsistent with remaining carbon budgets and, as discussed above, with emission pathways to reach the Paris Agreement goals. This inconsistency exposes investors and asset owners to the risk of stranded assets, which results from potential sharp strengthening climate public policies, that is, transition risk. As a result, a growing number of investors and financiers are assessing climate-related risks with the aim to disclose information about their current level of exposure (to both transition and physical climate-related risks), as well as to inform their future decisions (TCFD 2017). Reporting to date is, however, inconsistent across geographies and jurisdictions (CDSB and CDP 2018; Perera et al. 2019), with also a wide variety of metrics, methodologies, and approaches developed by commercial providers that contribute to disparate outcomes (Kotsantonis and Serafeim 2019; Boffo and Patalano 2020). Further, as developed in Section 15.6.1, there is currently not enough evidence in order to conclude whether climate-related risk assessments result in increased climate action and alignment with the goals of the Paris Agreement (The 2° Investing Initiative and Wüest Partner 2020).
As developed in Section 15.6.3, the insufficient level of ambition and coherence of public policies at national and international levels remains the root cause of the still significant misalignment of investment and financing compared to pathways compatible with the Paris Agreement temperature goal (UNEP 2018). Such lack of coherence includes low pricing of carbon and of environmental externalities more generally, as well as misaligned policies in non-climate policy areas such as fiscal, trade, industrial and investment policy, and financial regulation (OECD 2015b), as further specified in the sectoral Chapters 6 to 12.
The most documented policy misalignment relates to the remaining very large scale of public direct and indirect financial support for fossil fuel-related production and consumption in many parts of the world (Bast et al. 2015; Coady et al. 2017; Climate Transparency 2020). Fossil fuel subsidies are embedded across economic sectors as well as policy areas, for example, from a trade policy perspective, in most countries, import tariffs and non-tariff barriers are substantially lower on relatively more CO2 intensive industries (Shapiro 2020). Available inventories of fossil fuel subsidies (in the form of direct budgetary transfers, revenue forgone, risk transfers, or induced transfers), covering 76 economies, indicate a rise to USD340 billion in 2017, a 5% increase compared to 2016. Such trend is due to slowed down progress in reducing support among OECD and G20 economies in 2017 (OECD 2018b) and to a rise in fossil fuel subsidies for consumption in several developing economies (Matsumura and Adam 2019), which, in turn, reduces the efficiency of public instruments and incentives aimed at redirecting investments and financing towards low-GHG activities.
As a result, the demand for fossil fuels, especially in the energy production, transport and buildings sectors, remain high, and the risk-return profile of fossil fuel-related investments is still positive in many instance (Hanif et al. 2019). Political economy constraints of fossil fuel subsidy reform continue to be a major hurdle for climate action (Schwanitz et al. 2014; Röttgers and Anderson 2018), as further discussed in Section 15.5.2. and Chapter 13.
15.4Financing Needs
15.4.1Definitions of Financing Needs
Financing needs 7 are discussed in various contexts, only one being international climate politics and finance. Also, financing needs are used as an indicator for required system changes (when compared to current flows and asset bases) and an indicator for near- to long-term investment opportunities from the perspective of investors and corporates. Investment needs are widely used as an indicator focusing on initial investments required to realise new infrastructure. It compares relatively well with private sector flows dominated by return-generating investments but lacks comparability and explanatory power regarding the needs in the context of international climate cooperation, where considerations on economic costs play a more substantial role. Chapter 12 elaborates on global economic cost estimates for various technologies. This indicator includes both costs and benefits of options, of which investment-related costs make up only one component. Both analyses offer complementary insights. There are financing needs not directly related to the realisation of physical infrastructure and which are not covered in both investment and cost estimates. For instance, the needs for building institutional capacity to achieve social and economic goals and to strengthen knowledge, skills, national and international cooperation might not be significant, but an enabling environment for future investments would not be established without satisfying it. Moreover, comprehending financial needs for addressing economic losses due to climate change can hardly be measured in terms of the indicators introduced before.
Understanding the magnitude of the challenge to scale up finance in sectors and regions requires a more comprehensive (and qualitative) assessment of the needs. For finance to become an enabler of the transition, domestic and international public interventions can be needed to ensure enough supply of finance across sectors, regions and stakeholders. The location of financing needs and vicinity to capital matter given home bias (Fuchs et al. 2017; OECD 2017a; Ito and McCauley 2019) (prioritising own country or regions), transaction costs and risk considerations (Section 15.2). Most of the finance is mobilised domestically but the depth of capital markets is substantially greater in developed countries, increasing the challenges to mobilise substantial volumes of additional financing for many developing countries. The same applies to various stakeholders with limited connections into the financial sector. In addition, governments enabling financial market frameworks, guidelines and supportive infrastructure is crucial for inclusive finance for the bottom of the pyramid, especially disadvantaged and economically marginalised segments of society.
The attractiveness of a sector and region for capital markets depends on several factors. Some essential elements are the duration of loan and profile as long-term loans and heavily heterogeneous returns represent challenges in financing mitigation technologies and policies. After the financial crisis and restricted access to long-term debt, capital intensity of technologies and resulting long payback periods of investment opportunities for mitigation technologies have been a crucial challenge (Bertoldi et al. 2021). Also, implicit discount rates applied during the investment decision process vary depending on the payback profile, with research mainly covering the difference between the financing of assets generating revenues versus costs (Jaffe et al. 2004; Schleich et al. 2016). In addition, a low correlation between the climate projects and dominating asset classes might provide an opportunity in climate action by satisfying the appetite of institutional investors, which tend to manage portfolios with consideration of the Markowitz modern portfolio theory (optimising return and risk of a portfolio through diversification) (Marinoni et al. 2011). Transaction cost is a significant barrier to the diffusion and commercialisation of low-carbon technologies and business models and adaptation action. High transaction costs, attributed to various factors, such as complexity and limited standardisation of investments, limited pipelines, complex institutional and administrative procedures, create significant opportunity costs of green investments comparing with other standard investments (IRENA 2016; Nelson et al. 2016; Feldman et al. 2018). For example, transaction costs are commonly observed in small-scale, dispersed independent renewable energy systems, especially in rural areas, and energy efficiency projects (Hunecke et al. 2019). A more robust standardisation and alignment of Power Purchase Agreement (PPA) terms with best practices globally has led to a substantially increased interest in capital markets in developing countries (WBCSD 2016; Schmidt et al. 2019; World Bank 2021 ). Notably, PPA significantly increases the probability of more balanced investment and development outcomes and ultimately more sustainable independent power projects in developing countries. Therefore, lowering transaction costs would be essential for creating investor appetite. The role of intermediaries bundling demand for financing has been demonstrated to reduce transaction costs and to reach investors’ critical size. In addition, new innovative approaches, such as fintech and blockchain (Section 15.6.8), have been discussed for providing new opportunities in the energy sector.
Economic viability of investments – ideally not relying on the pricing of positive externalities – has been a critical driver of momentum in the past. The falling technology costs and the competitiveness of renewable technologies, especially solar PV and wind, have accelerated the deployment of renewable technologies over the past years. Renewable energy technologies are now often competitive, and have even become the cheapest, in many countries, even without financial support (FS-UNEP Centre and BNEF 2015, 2016, 2017, 2018, 2019; IEA 2020c; IRENA 2020a) and without pricing of the avoided carbon emissions. In contrast, the dependency on regulatory interventions and public financial support to create financial viability has provided a source of volatile investor appetite. The annual volume of renewable investment by country is often volatile, reflecting ending and new regulations and policies (IEA 2019a).
For example, the recent Chinese policy direction towards tougher access to and a substantial cut in feed-in-tariffs in 2018 led to a significant drop in renewable investment and new capacity addition in China (FS-UNEP Centre and BNEF 2019; Hove 2020). However, the significant bouncing back of newly installed capacity (72 GW wind power and 47 GW solar power in 2020) shows the strong development of zero-carbon power generation driven by lower cost and policies to support them by energy revolution strategies in China. Investors had proven to be willing to work with transparent support mechanisms, such as with the Clean Development Mechanism (CDM), which stimulated emission reductions and allowed industrialised countries to implement emission-reduction projects in developing countries to meet their emission targets (Michaelowa et al. 2019). However, the collapse of carbon markets and prices, especially of the EU Emissions Trading System, led to the continuous decline of Certified Emission Reductions issuances from CDM in the past years (World Bank Group 2020). Also, the dependency on regulatory intervention to ensure fair market access only has proven to burden investor appetite.
A significant share of investment needs in heavily regulated sectors, such as electricity, public transport, and telecom, emphasises the importance of regulatory intervention, such as ownership and market access (OECD 2017b). For instance, energy-system developments require effective and credible commitments and action by policymakers to ensure an efficient capital allocation aligned with climate targets (Bertram et al. 2021).
There is a lot of discussion about the regulated ownership of the private sector (European Commission 2017) and the restructuring of electricity market contributed to low level of investment in baseline electricity capacity and in investment research and innovation. These changes create uncertainty of investment, and barriers to market entry and exit also potentially limit the competition in the market and restrict the entrance of new investment (Finon 2006; Joskow 2007; Grubb and Newbery 2018). This is also the case in developing countries (Foster and Rana 2020).
The positive development in the energy sector has benefitted from the evident stand-alone character of renewable energy generation projects. First movers realised these projects with investors and developers acting from conviction (Steffen et al. 2018). Such action is not possible to this extent in energy efficiency with related investment rather representing an add-on component and consequently requiring the support of decision-makers used to business-as-usual projects. Despite the benefits that improvement of energy efficiency has in contributing to curbing energy consumption, mitigating greenhouse gas emissions, and providing multiple co-benefits (IEA 2014a), investment in energy efficiency is a low priority for firms, and the financial environment is not favourable due to lack of awareness of energy efficiency by financial institutions, existing administrative barriers, lack of expertise to develop projects, asymmetric information, and split incentives (UNEP DTU 2017; Cattaneo 2019). While Energy Service Companies’ (ESCO) business models are expected to facilitate the investment in energy efficiency by sharing a portion of financial risk and providing expertise, there has been limited progress made with ESCO business models, and only slightly over 20% of projects used financing through ESCOs (UNEP DTU 2017).
The investment needs and existing challenges differ by sector. Each sector has different characteristics along the arguments listed above making the supply of finance by commercial investors an enabling factor or barrier. In the transport sector, transformation towards green mobility would provide significant co-benefits for human health by reducing transport-related air pollution, so the transport sector cannot achieve such transformation in isolation from other sectors. However, a considerable involvement of the public sector in many transportation infrastructure projects is given, and the absence of a standard solution increases transaction costs (including bidding package, estimating, drawing up a contract, administering the contract, corruption, and so on). Financial constraints, including access to adequate finance, pose a significant challenge in the agriculture sector, especially for SMEs and smallholder farmers. The distortion created by government failure and a lack of effective policies create barriers to financing for agriculture. The inability to manage the impact of the agriculture-related risks, such as seasonality, increases uncertainty in financial management. Moreover, inadequate infrastructure, such as electricity and telecommunication, makes it difficult for financial institutions to reach agricultural SMEs and farmers and increases transaction costs (World Bank 2016). Low economies of scale, low bargaining power, poor connectivity to markets, and information asymmetry also lead to higher transaction costs (Pingali et al. 2019). In the industrial manufacturing and residential sector, gaining energy efficiency remains one of the critical challenges. Investment in achieving energy efficiency encounters some challenges when it may not necessarily generate direct or indirect benefits, such as increase in production capacity or productivity and improvement in product quality. Also, early-stage, high upfront cost and future, stable revenue stream structure suggest the needs for a better enabling environment, such as a robust financial market, awareness of financial institutions, and regulatory frameworks (e.g., stringent building codes, incentives for ESCOs) (IEA 2014a; Barnsley et al. 2015).
15.4.2Quantitative Assessment of Financing Needs
Multiple stakeholders prepare and present quantitative financing needs assessments with methodologies applied to vary significantly representing a major challenge for aggregation of needs (e.g., Osama et al. (2021) for African countries), most of them with a focus on scenarios likely to limit warming to 2°C or lower. The differences relate to the scope of the assessments regarding sectors, regions and periods, top-down versus bottom-up approaches, and methodological issues around boundaries of climate-related investment needs, particularly full vs incremental costs and the exclusion or inclusion of consumer-level investments. Information on investment needs and financing options in NDCs mirrors this challenge and is heavily heterogeneous (Zhang and Pan 2016).
In particular, for global approaches, modelling assumptions are often heavily standardised, focusing on technology costs. Only limited global analysis is available on incremental costs and investments, reflecting the reality of developing countries, also considering the interplay with significant infrastructure finance gaps, and can hardly serve as a robust basis for negotiations about international public climate finance. The focus on investment irrespective of uncertainty as well as other qualitative aspects of needs does not allow for a straightforward analysis of the need for public finance to leverage private sector financing and of the country heterogeneity in terms of investment risks and access to capital (Clark et al. 2018).
One source of uncertainty about the investment estimates for the power sector is the evolution of the levelised cost of technical options in the future, for example the continuation of the observed declining costs trends of renewable energy (IRENA 2020b) which has been underestimated in many modelling exercises. The learning by doing processes and economies of scale might be at least partially outweighed, in all countries and more specifically in Small Island Developing States (SIDS) and other developing countries because of different risk factors, scales of installations, accessibility, and others (Lucas et al. 2015; van der Zwaan et al. 2018). These parameters, together with transaction costs/soft costs (Section 15.5), financing costs and the level of technical competences need to be better represented in the future to represent the ‘climate investment trap’ in many developing countries (García de Fonseca et al. 2019). This ‘climate investment trap’, as flagged by Ameli et al. (2021a), is created by existing and expected physical effects of climate change, higher financing costs and resulting lower investment levels in developing countries. Applying significantly standardised assumptions can consequently not provide robust insights for specific country groups. This will require progress in the spatiotemporal granularity of the models (Collins et al. 2016).
Another source of uncertainty about the financing needs is the interplays between (i) the baseline economic growth rates, (ii) the link between economic growth and energy demand, including rebound effects of energy efficiency gains, (iii) the evolution of microeconomic parameters such as fossil fuel prices, interest rates, currency exchange rates (iv) the level of integration between climate policies and sectoral policies and their efficacy, and (v) the impact of climate policies on growth and the capacity of fiscal and financial policies to offset their adverse effect (IPCC 2014; IPCC 2018). Integrated assessment models (IAMs) try to capture some of these interplays even though they typically do not capture the financial constraints and the structural causes of the infrastructure investment gap. Many of them rely on growth models with full exploitation of the means of production (labour and capital). They nevertheless provide useful indications of the orders of magnitude at play over the long run, and the determinants of their uncertainty. Global yearly average low-carbon investment needs until 2030 for electricity, transportation, AFOLU and energy efficiency measures including industry and buildings are estimated between 3% and 6% of the world’s GDP according to the analysis in Section 15.5. The incremental costs of low-carbon options are less than that and their funding could be achieved without reducing global consumption by reallocating 1.4% to 3.9% of global savings. 2.4% on average (see Box 4.8 of SR1.5 (IPCC 2018)) currently flow towards real estate, land and liquid financial vehicles. For the short-term decisions, the major information they give is the uncertainty range because this is an indicator of the risks decision-makers need.
While the AR6 Scenarios Database provides good transparency with regard to technology costs for electricity generation, assumptions driving in particular investments in energy efficiency are rarely made available in both IAM-based assessments and also other studies. Taking into account the much broader range of tested and untested technologies the confidence levels, in particular for 2050 estimates, remain low but can provide an initial indication. Also, the ranges allow for a rough indication on possible ‘green’ investment volumes and respective asset allocation for financial sector stakeholders.
Using global scenarios assessed in Chapter 3 for assessing investment requirements. Tables 15.2 and 15.3 present the analysis of investment requirements in global modelled mitigation pathways assessed in Chapter 3 for key energy sub-sectors within modelled global pathways that limit warming to 2°C (>67%) or lower. These pathways explore the energy, land-use, and climate system interactions and thus help identify required energy sector transformations to reach specific long-term climate targets. However, reporting of investment needs outside the energy sector was scarce, reducing the explanatory power of the shown total investment need in the context of overall investment needs (Ekholm et al. 2013; IPCC 2018, Box 4.8; McCollum et al. 2018; Bertram et al. 2021). The modelling of these scenarios is done with a variation of scenario assumptions along different dimensions (inter alia policy, socio-economic development and technology availability), as well as with different modelling tools which represent different assumptions about the structural functioning of the energy-economy-land-use system (see Annex III: ‘Scenarios and modelling methods’ for details). Tables 15.2 and 15.3 focus on the near-term (2023–2032) investment requirements in the energy sector and how these differ depending on temperature category. Figures 3.36 and 3.37 present the data for the medium term (2023–2052). The results highlight both requirements for increased investments and a shift from fossil towards renewable technologies and efficiency for more ambitious temperature categories. The substantial ranges within each category reflect multiple pathways, differentiated by socio-economic assumptions, technology, and so on. It is necessary to open up these extra dimensions and contrast them with national and sub-regional analysis to understand how investment requirements depend on particular circumstances and assumptions within a country for a specific technology. Limiting peak temperature to levels of 1.5°C–2°C requires rapid decarbonisation of the global energy systems, with the fastest relative emission reductions occurring in the power generation sector (Hirth and Steckel 2016; Luderer et al. 2018).
Table 15.2 | Global average yearly investments from 2023–2032 for electricity supply in billion USD2015.
Category | Fossil | Nuclear | Storage | Transmission and distribution | Non-Biomass Renewables | |||
All | Thereof | |||||||
Solar | Wind | |||||||
C1 | 53 [50] | 127 [52] | 221 [39] | 549 [50] | 1190 [52] | 498 [52] | 390 [52] | |
(Range) | (34;115) | (85;165) | (88;295) | (422;787) | (688;1430) | (292;603) | (273;578) | |
C2 | 78 [100] | 116 [92] | 57 [66] | 489 [81] | 736 [96] | 312 [96] | 237 [96] | |
(Range) | (50;129) | (61;150) | (37;139) | (401;620) | (482;848) | (181;385) | (174;328) | |
C3 | 75 [221] | 96 [190] | 28 [129] | 389 [157] | 639 [207] | 220 [207] | 266 [207] | |
(Range) | (52;129) | (50;122) | (8;155) | (326;760) | (432;820) | (167;345) | (137;353) | |
Note: Global average yearly investments from 2023–2032 (in USD2015). Electricity subcomponents are not exhaustive. Hydro, geothermal, biomass and others are not shown, as these are shown to be of smaller magnitude (Chapter 3). Difference between non-biomass renewables and solar/wind represents hydro and in some scenarios geothermal, tidal, and ocean. Scenarios are grouped into common AR6 categories (vertical axis, C1–C3). The numbers represent medians across all scenarios within one category, and rounded brackets indicate inter-quartile ranges, while the numbers in squared brackets indicate number of scenarios. C6, C7, and C8 are not shown in Table 15.2. Reference C5 category for Transmission and Distribution (T&D) is 364bn (294bn to 445bn) [111] used for calculation of incremental needs in Figure 15.4. Data source: AR6 Scenarios Database.
Table 15.3 | Regional average yearly investments from 2023–2032 for electricity supply in billion USD2015.
Africa | East Asia | Europe | South Asia | Latin America | Middle East | North America | Australia, Japan, and New Zealand | East. Eur. W.C. Asia | South East Asia | |
Non-biomass renewables | ||||||||||
C1 | 41 [39] | 302 [41] | 130 [41] | 120 [41] | 69 [41] | 67 [41] | 177 [41] | 37 [41] | 48 [41] | 85 [41] |
(Range) | (36;66) | (188;356) | (101;150) | (83;164) | (55;97) | (31;90) | (149;222) | (28;39) | (35;65) | (59;141) |
C2 | 32 [77] | 179 [87] | 95 [87] | 69 [87] | 55 [87] | 28 [87] | 106 [87] | 19 [87] | 17 [87] | 63 [87] |
(Range) | (27;42) | (124;255) | (64;104) | (35;84) | (27;73) | (19;43) | (73;134) | (12;29) | (10;37) | (35;78) |
C3 | 17 [170] | 166 [185] | 91 [185] | 53 [182] | 53 [185] | 22 [182] | 119 [185] | 22 [179] | 15 [185] | 38 [182] |
(Range) | (12;47) | (108;200) | (42;118) | (35;80) | (25;81) | (11;32) | (71;167) | (12;30) | (11;30) | (22;67) |
Thereof solar | ||||||||||
C1 | 16 [39] | 134 [41] | 43 [41] | 53 [41] | 22 [41] | 33 [41] | 81 [41] | 11 [41] | 20 [41] | 33 [41] |
(Range) | (8;24) | (89;147) | (38;55) | (37;82) | (14;34) | (16;40) | (75;95) | (10;16) | (10;25) | (17;56) |
C2 | 10 [77] | 83 [87] | 34 [87] | 37 [87] | 16 [87] | 15 [82] | 44 [87] | 7 [80] | 5 [81] | 20 [87] |
(Range) | (6;14) | (54;125) | (19;47) | (17;41) | (8;21) | (10;23) | (18;69) | (4;10) | (1;12) | (9;33) |
C3 | 7 [170] | 53 [185] | 28 [184] | 23 [182] | 12 [184] | 12 [164] | 32 [185] | 9 [157] | 8 [164] | 14 [182] |
(Range) | (3;14) | (42;83) | (17;36) | (17;39) | (5;25) | (9;20) | (21;74) | (4;11) | (3;12) | (7;27) |
Thereof wind | ||||||||||
C1 | 10 [39] | 133 [41] | 59 [41] | 45 [41] | 19 [41] | 22 [41] | 58 [41] | 20 [41] | 17 [41] | 28 [41] |
(Range) | (4;30) | (86;164) | (29;86) | (23;71) | (15;26) | (13;39) | (44;122) | (12;25) | (10;23) | (17;52) |
C2 | 5 [77] | 63 [87] | 41 [83] | 23 [87] | 15 [87] | 8 [81] | 31 [87] | 8 [87] | 4 [81] | 19 [87] |
(Range) | (4;14) | (44;102) | (9;59) | (14;30) | (7;18) | (3;16) | (19;75) | (5;12) | (2;12) | (6;23) |
C3 | 3 [170] | 64 [185] | 59 [169] | 21 [182] | 12 [184] | 10 [160] | 52 [184] | 10 [179] | 4 [164] | 10 [182] |
(Range) | (2;15) | (40;93) | (12;65) | (12;37) | (7;22) | (5;13) | (19;86) | (6;13) | (2;10) | (5;32) |
Storage | ||||||||||
C1 | 3 [27] | 68 [32] | 46 [32] | 27 [32] | 7 [29] | 13 [30] | 56 [30] | 4 [32] | 3 [24] | 15 [30] |
(Range) | (0;8) | (30;80) | (9;54) | (24;45) | (2;11) | (3;19) | (30;62) | (2;6) | (0;4) | (1;30) |
C2 | 2 [36] | 19 [60] | 18 [52] | 10 [57] | 3 [42] | 3 [31] | 13 [44] | 1 [43] | 0 [20] | 3 [41] |
(Range) | (0;4) | (6;36) | (7;35) | (4;17) | (1;8) | (0;4) | (11;34) | (1;2) | (0;0) | (2;13) |
C3 | 4 [78] | 20 [106] | 22 [92] | 9 [107] | 9 [85] | 4 [78] | 29 [81] | 1 [90] | 0 [78] | 9 [83] |
(Range) | (0;6) | (1;33) | (3;41) | (1;21) | (0;13) | (0;9) | (2;42) | (0;2) | (0;1) | (0;16) |
Transmission and distribution | ||||||||||
C1 | 24 [39] | 147 [39] | 67 [39] | 51 [39] | 40 [39] | 27 [39] | 87 [39] | 16 [39] | 24 [39] | 64 [39] |
(Range) | (13;39) | (96;250) | (61;105) | (46;97) | (29;62) | (22;40) | (70;120) | (13;19) | (18;35) | (26;94) |
C2 | 24 [77] | 132 [77] | 60 [77] | 49 [77] | 36 [77] | 33 [77] | 70 [77] | 14 [77] | 26 [77] | 36 [77] |
(Range) | (14;30) | (84;175) | (48;79) | (43;56) | (28;45) | (27;37) | (53;92) | (8;19) | (17;34) | (28;61) |
C3 | 14 [150] | 93 [153] | 61 [153] | 46 [150] | 26 [153] | 25 [150] | 70 [153] | 14 [147] | 23 [153] | 26 [150] |
(Range) | (10;37) | (74;190) | (52;86) | (38;86) | (21;62) | (17;40) | (52;90) | (11;16) | (17;27) | (17;87) |
C5 | 13 [109] | 81 [110] | 55 [110] | 41 [109] | 25 [110] | 23 [109] | 58 [110] | 14 [109] | 23 [110] | 25 [109] |
(Range) | (9;13) | (67;160) | (46;59) | (22;46) | (19;28) | (15;28) | (51;67) | (12;16) | (16;26) | (17;29) |
Note: Average yearly investments from 2023–2032 for electricity generation capacity, by aggregate regions (in billion USD2015). Further notes see Table 15.2. Reference C5 category for Transmission and Distribution shown in Table 15.2 as it is used for calculation of incremental needs for Figure 15.4. Vertical axis, C4–C8 except Transmission and Distribution not shown. Data source: AR6 Scenarios Database.
This requires fast shifts of investment as infrastructures in the power sector generally have long lifetimes of a few decades. in global modelled pathways that limit warming to 1.5°C (>50%) with no or limited overshoot, investments into non-biomass renewables (especially solar and wind, but also including hydro, geothermal, and others not shown in Table 15.2) increase to over USD1 trillion yr –1 in 2030, increasing by more than factor 3 over the values of around USD250–300 billion yr –1 that have been relatively stable over the last decade (IEA 2019a). Overall, electricity generation investments increase considerably, reflecting the higher relevance of capital expenditures in decarbonised electricity systems. While decreasing technology costs have substantially reduced the challenge of high capital intensity, still remaining relative disadvantages in terms of capital intensity of low-carbon power technologies can especially create obstacles for fast decarbonisation in countries with high interest rates, which decrease the competitiveness of those technologies (Iyer et al. 2015; Hirth and Steckel 2016; Steckel and Jakob 2018; Schmidt et al. 2019). CCS as well as nuclear will not drive investment needs until 2030, given considerably longer lead-times for these technologies, and the lack of a significant project pipeline currently.
What is apparent is that the bulk of investment requirements corresponds to medium- and low-income countries in Asia, Latin America, the Middle East and Africa, as these still have growing energy demand, and it is still considerably lower than the global average. This illustrates a vital opportunity to ensure the build-up of sustainable energy infrastructures in these regions and constitutes a risk of additional carbon lock-in if investments into fossil infrastructures, especially coal-fired power plants, and uncontrolled urban expansion, continue.
Investment needs in electrification derived from IAMs do not include systematically investments in end-use equipment and distribution (Box 4.8 in SR1.5 (IPCC 2018)). Model-based estimates of investment needs don’t have the regional granularity to single out LDCs, as model regions typically are defined based on geographic proximity and therefore aggregate LDCs and other countries. With the average electricity consumption per capita in Africa increasing to 0.68–0.87 (1.43–2.92) MWh in 2030 (2050) yr –1 and remaining at the very low end of the global range [0.46 in Africa compared to the upper end of 12.02 in North America, MWh per capita and year in 2020], the targeted full electrification until 2030 appears unrealistic across all scenarios. SEforAll and IEA estimate assumed investment needs to decentralised end-user electrification to come in around USD40 billion on average until 2030 (SEforALL and CPI 2020; IEA 2021d).
Quantitative analysis of investment needs in energy generation based on IRENA and IEA data and comparison to AR6 scenario database output .
According to IRENA, the government plans in place today call for investing at least USD95 trillion in energy systems over the coming three decades (2016–2050) (IRENA 2020c). Redirecting and increasing investments to ensure a climate-safe future (Transforming Energy Scenario, TES) would require reaching on average around 1 trillion USD2015 yr –1 (average until 2030) for electricity generation as well as grids and storage, increasing to above 2 trillion USD2015 yr –1 (average until 2030) in the 1.5 scenario (IRENA 2021). IEA’s respective SDS and NZE scenarios come in at average annual investments between USD1.0 trillion yr –1 and USD1.6 trillion yr –1 (average until 2030) (IEA 2021b). These additional data points for the C1 and C3 category underpin the range presented in the AR6 Scenarios Database for needs until 2032 despite the slightly varying periods.
In contrast to the IAMs, IRENA and IEA assessments do not allow for an analysis of mitigation-driven investment needs in transmission and distribution, which likely results in an overestimation of the mitigation-driven investment needs in their analysis.
It is worth highlighting that driven by technology cost assumptions, IRENA forecasts falling average annual investments needs for energy, but also energy efficiency, for the period 2030–2050 compared to 2020–2030. In the 1.5°C scenario (1.5-S) the total annual investment needs excluding fossils and nuclear decrease from 5.0 trillion USD2015 until 2030 yr –1 to 3.8 trillion USD2015 yr –1 for 2030–2050 (IRENA 2021). In IAM scenarios of Category C1, electricity supply investments (including generation, transmission and distribution, and storage) remain flat at 2.2 trillion USD2015 yr –1 through the coming three decades in absolute terms. Given rising GDP, the complementary methods and sources thus consistently point to a peak in electricity supply investments as a percentage of GDP in mitigation scenarios in the coming decade. This reflects the fact that the coming decade requires low-carbon power generation investments to both cover the demand increase and (partly premature) replacement of fossil generation capacities, both concentrated in emerging and developing countries. Relative investment numbers for electricity measured against GDP then decrease towards 2050, as they only need to cover natural replacement and increasing demands (which due to electrification will also pick up in developed countries), and due to further declining technology costs. Investments for low-carbon fuel supply like hydrogen and synthetic fuels, and for direct electrification equipment (heat pumps, electric vehicles (EV), etc.) scale up from much lower levels and will likely continue to grow as a share of GDP until mid-century, though uncertainties and accounting is still much more uncertain. (Bertram et al. 2021).
Quantitative analysis of investment needs in other sectors. As described above, investment needs in non-energy sectors tend to be ignored in many integrated assessment models with studies for individual countries or regions providing a more fragmented picture only. However, the quality of estimates is likely not to be less robust given the drawbacks of integrated assessment models.
Chapter 7 stresses the importance of opportunity costs for AFOLU mitigation options, in particular for afforestation and avoided deforestation projects, and derives net annual costs of around USD278 billion yr –1 in the next several decades, mostly opportunity costs. Net costs of delivering 5-6 Gt CO2 yr –1 of forest related carbon sequestration and emission reduction around 2050 as assessed with sectoral models are estimated to reach to ~ USD400 billion yr –1 by 2050, excluding externality costs (Chapter 7.4).
Energy efficiency. Estimates on energy investment needs vary significantly with a low level of transparency with regard to underlying technology cost assumptions burdening the confidence levels.
IRENA only selectively reports financing needs for energy efficiency in buildings and industry as separate categories. For the 1.5-S average yr –1 needs until 2050 come in at 963 billion USD2015 for buildings, 102 billion USD2015 for heat pumps, and 354 billion USD2015 for industry. Applying the relative share of these categories on higher total needs until 2030, around 1.8 trillion USD2015 yr –1 in buildings and industry are needed in the 1.5-S. For the TES cumulative energy efficiency investment needs until 2030 are stated at 29 trillion USD2015 translating into an yearly average of around 1.7 trillion USD2015 yr –1, excluding transportation. IEA estimates come in at a much lower level at 0.6 and 0.8 billion USD2015 yr –1 on average between 2026–2030 for their SDS and NZE scenarios.
Transportation. Forthe transportation sector, OECD has presented the most comprehensive assessment of financing needs in the AR6 database based on IEA data with the annual average coming in at USD2.7 trillion between 2015 and 2035 i In modelled global pathways that limit warming to 2°C (>67%). The assessment comprises road, rail and airports/ports infrastructure, with only rail infrastructure being considered in this analysis.
On a regional level, Oxford Economics (2017) shows that annual infrastructure investments between 2016 and 2040 vary widely. For all available countries (n=50) estimates count close to 0.4 trillion USD2015 yr –1, including 0.217 trillion USD2015 yr –1 for China. Based on available data for nine African countries, investments in rail infrastructure range from USD0.1 billion in Senegal to USD1.6 billion in Nigeria. Osama et al. (2021) highlight a USD4.7 billion financing gap for African countries in the transport sector. In Latin America Oxford Economics (2017) identifies Brazil as frontrunner of required rail investments with USD8.3 billion, followed by Peru with USD2.3 billion. In total, developed countries’ financing needs mount up to almost USD120 billion yr –1 (n=15, mean=7.97bn USD) for rail infrastructure. Financing needs in developing countries (excluding LDCs and excluding China) mount up to almost USD50 billion yr –1 (n=27, mean=1.78bn USD, excluding China). Oxford Economics (2017) reports rail infrastructure financing needs for China of more than USD200 billion yr –1 between 2016 and 2040.
Fisch-Romito and Guivarch (2019) show, by endogenising the impact of urban infrastructure policies on mobility needs and modal choices that transportation investment needs globally might be lower in low-carbon pathways compared with baselines, with lower investments in road and air infrastructure. This does mean that higher investments are not needed over the following two decades; this is confirmed by Rozenberg and Fay (2019) that strong policy integration between urban, transportation and energy policies reduce the total investment gap.
IRENA as well as IEA have presented estimates for energy efficiency investments in the transport sector. For the 1.5-S scenario, IRENA indicates average investment needs of USD20150.2 trillion yr –1 for EV infrastructure, USD20150.2 trillion yr –1 for transport energy efficiency and USD20150.3 trillion yr –1 for EV batteries (average until 2030) (IRENA 2020d). IEA indicates a total of around 0.6 and 0.7 trillion USD2015 yr –1 for transport energy efficiency in the SDS and IEA scenarios for the 2026–2030 period (IEA 2021c). Many investment categories relating to mitigation options, in particular with regard to behavioural change and transport mode changes (Chapter 10, Figure SPM.8), are neglected in these analyses despite their significant mitigation potential.
AFOLU. The Food and Land Use Coalition estimates additional investment needs for ten critical transitions for the global food and land use systems to achieve the long-term global goal (LTGG) and SDGs. Additional annual investment needs until 2030 add up to USD300–350 billion. Considering the change in global diets as well as the land-based nature-based solutions only, annual investment needs would come in between USD110–135 billion. Chapter 7 stresses the importance of opportunity costs for AFOLU mitigation options, in particular for afforestation projects, and derives average yearly investment needs of around 278 billion USD2015 yr –1 until 2030 rising to 431 billion USD2015 yr –1 over the next several decades, including opportunity costs. The estimate is based on an assumption of emission reductions consistent with pathways C1–C4, leading to average abatement of 9.1 GtCO2 yr –1 (median range 6.7–12.3 GtCO2 yr –1) from 2020–2050 and marginal costs of USD100 per tonne CO2, excluding investments in bioenergy with carbon capture and storage and changes in food consumption and food waste (Section 7.4). The largest investments are projected to occur in Latin America, South-East Asia, and Africa, constituting 61% of total expenditure. The implied change of land use might trigger negative effects on other SDGs which need to be addressed to offer robust safeguards and labelling for investors.
However, given the strong interlinkage of the presented transitions and accumulated effects, climate change related investments can hardly be separated (The Food and Land Use Coalition 2019). Shakhovskoy et al. (2019) present an overview of financing needs of small-scale farmers globally, however, without focusing on the required climate-related investments. According to their assessment, 270 million smallholder farmers in South and South-East Asia, sub-Saharan Africa and Latin America face approximately USD240 billion of financing needs, thereof USD100 billion short-term agricultural needs, USD88 billion long-term agricultural needs and USD50 billion non-agricultural needs (Shakhovskoy et al. 2019). These numbers can only provide ‘an indication of the magnitude of the climate investments required in small-scale agriculture’ (CPI 2020). Table 15.4 summarises the studies used as well as adjustments made to determine needs for the gap discussion in Section 15.5.2.
Table 15.4 | Sector studies to determine average financing needs.
Sector | Studies | Global ranges trillion USD yr –1– Confidence Level | Regional breakdown | Comment | ||
Energy | IAM database, SEforAll (SEforALL and CPI 2020), IRENA 1.5-S and TES scenarios (IRENA 2021), IEA SDS and NZE scenarios (IEA 2021b) | 0.8–1.5 | High confidence | Detailed breakdown for R10 possible for IAM database and applied to the derived range | Medium confidence | Wide ranges primarily driven by varying assumptions with regard to grid investments relating to the increased renewable energy penetration. |
Energy Efficiency | IRENA 1.5-S and TES scenarios, IEA SDS and NZE scenarios | 0.5–1.7 | Medium confidence | Adjustments required to regional categorisation by IEA and IRENA | Low-medium confidence | Medium confidence levels due to missing transparency with regard to underlying assumptions on technology costs. Low-to-medium confidence level on regional allocations due to required adjustments. |
Transport | OECD/IEA (OECD 2017b) and Oxford Economics (2017) on rail investment data, IRENA 1.5-S and TES scenarios, IEA SDS and NZE scenarios for transport (energy efficiency) and electrification | 1.0–1.1 | Medium confidence | Adjustments required to regional categorisation by IEA and IRENA | Low-medium confidence | Needs including battery costs, not total costs, of electric vehicles, likely underestimation of needs due to missing data points on rail infrastructure. |
AFOLU | Chapter 7 analysis, Section 7.4; The Food and Land Use Coalition (Land use Coalition (2019); (Shakhovskoy et al. 2019) | 0.1–0.3 | High confidence | Breakdown for R10 possible for Chapter 7 analysis | Medium confidence | Upper end of range includes opportunity costs as these likely increase costs of investment in land. |
Note: Total range USD2.3 trillion to USD4.5 trillion yr –1.
Adaptation financing needs. Financing needs for adaptation are even more difficult to define than those of mitigation because mobilising specific adaptation investments is only part of the challenge since ultimately improving societies’ adaptive capacities depends on the SDGs’ fulfilment (Hallegatte et al. 2016). Bridging the investment gap on irrigation, water supply, health care, energy access, and quality buildings is an essential enabling condition for adapting to climate change. The scenario analysis conducted by Rozenberg and Fay (2019) show that fulfilling the SDGs to improve the adaptive capacity of low- and middle-income countries would require investments in water supply, sanitation, irrigation and flood protection that would account for about 0.5% of developing countries’ GDP in a baseline scenario to 1.85% and 1% with a strong and anticipatory policy integration (USD664 billion and 351 billion on average by 2030).
Most studies choose to assess public sector projects, ignoring household-level investments as well as private sector adaptation (UNEP 2018; Buchner et al. 2019). UNEP’s 2020 Adaptation Gap Report estimates adaptation costs amounting to 140–300 billion USD yr –1 in 2030 and USD280–500 billion yr –1 in 2050 (UNEP 2021). Over 100 countries included adaptation components in their intended NDCs (INDCs) and approximately 25% of these referenced national adaptation plans (NAPs) (GIZ 2017 a) but estimates of the financing required for NAP processes is not available. These NAPs, as formally agreed under the UNFCCC in 2010, are iterative, continuous processes that have multiple stages with a developmental phase that requires country-specific financing of primarily which comprises grants, bond issuance or debt conversion (NDC Partnership 2020, NAP Global Network 2017). At the same time, multilateral climate funds such as the Green Climate Fund and the GEF/Least Developed Countries Fund offer ‘readiness and preparatory support’ and implementation for the NAPs and adaptation planning process (GCF 2020a; GEF 2021a,b). There has been no significant updating of adaptation cost estimates since UNEP’s (UNEP 2016, 2018). The Global Commission on Adaptation makes the case that investing USD1.8 trillion in early warning system, climate-resilient infrastructure, global mangrove and resilient water resources would generate about USD1.7 trillion in benefits due to avoided cost and non-monetary and social resources (Verkooijen 2019; UNEP 2021).
There is increasing recognition of rising adaptation challenges and associated costs within and across developed countries. Undoubtedly many developed countries are spending more on a wide range of adaptation issues, both as preventive measures and building resilience (greening infrastructure, climate-proofing major projects and managing climate-related risks) against the impacts of climate change extreme weather events (US GCRP 2018a). Developed countries’ climate change adaptation spending covers areas such as federal insurance programmes, federal, state and local property and infrastructure, supply chains, and water systems.
15.5Considerations on Financing Gaps and Drivers
15.5.1Definitions
The analysis of financing gaps in climate action, which is used to measure implementation action and mitigation impact(FS-UNEP Centre and BNEF 2019) cannot be carried out as a pure demand-side challenge, in isolation from the analysis of barriers to deploy funds (e.g., Ramlee and Berma 2013) and to take investment initiatives. These barriers are ‘friction that prevents socially optimal investments from being commercially attractive’ (Druce et al. 2016). They are at the root of the ‘microeconomic paradox’ of a deficit of infrastructure investments despite a real return between 4% and 8% (Bhattacharya et al. 2016), of the low share of carbon-saving potentials tapped by dedicated policies such as energy renovation programmes (Ürge-Vorsatz et al. 2018), and, more generally of a demand for climate finance lower than the volume of economically viable projects (de Gouvello and Zelenko 2010; Timilsina et al. 2010).
A few exercises tried assess the consequences of the perpetuation of these drivers on the magnitude of the financing gap. They suggest, comparing the evolution of the infrastructure investment trends (beyond energy) by comparison with what they should be in an optimal scenario, a cumulative deficit between 19% (Oxford Economics 2017) and 32% (Arezki et al. 2016). The volume of this gap is of the same order of magnitude as the incremental infrastructure investments (energy and beyond) for meeting a 1.5°C target (2.4% of the world GDP on average) (Box 4.8 of SR1.5 (IPCC 2018)) calculated by exercises assuming no pre-existing investment gap. This figure is consistent with the 1.5% to 1.8% assessed by the European Commission (2020) for Europe and the 2% of the IMF (2021d) for the G20, which do not encompass many developing countries for which economic take-off is today fossil fuels dependent. For low- and middle-income economies, Rozenberg and Fay’s (2019) results suggest to increase the infrastructure investments by 2.5 to 6 percentage points of GDP to cover both the reduction of the structural investment gap and the specific additional costs for bridging it with low-carbon and climate-resilient options. These assessments indicate the challenge at stake but do not exist at very disaggregated sectoral and regional levels for sectors other than energy.
The below quantitative analysis does not differentiate between financing gaps driven by barriers within or outside the financial sector given that the IAM models as well as most other studies used do not incorporate actual risk ranges depending on policy strength and coherence and institutional capacity, low-carbon policy risks, lack of long-term capital, cross-border currency fluctuation, and pre-investment costs and barriers within the financial sector that discourage private sector financing. They comprise short-termism (UNEP Inquiry 2016b), high perceived risks for mitigation-relevant technologies and/or regions (information gap through incomplete/asymmetric information, (Kempa and Moslener 2017; Clark et al. 2018)), lack of carbon pricing effects (Best and Burke 2018), home bias (results in limited balancing for regional mismatches between current capital and needs distribution, (Boissinot et al. 2016)), and perceived high opportunity and transaction costs (results from limited visibility of future pipelines and policy interventions; SME financing tickets and the missing middle, (Grubler et al. 2016)). In addition, barriers outside the financial sector will have to be addressed to close future financing gaps. The mix and dominance of individual barriers might vary significantly across sectors and regions and is analysed below.
The interpretation of the quantitative analysis thus needs to be performed, taking into account the qualitative needs assessment in Section 15.4.1 and the evolution of parameters that determine the risk-weighted relative attractiveness of low-carbon and climate-resilient investments compared to other investment opportunities. With some institutions having announced climate finance commitments and/or targets (see also Box 15.4), the actual asset allocation of commercial financial sector players including sectoral and regional focus will respond to tangible and financially viable investment opportunities available in the short term. Robust long-term pathways to create such conditions for a significant private sector involvement rarely exist and expectations on private sector involvement in some critical sectors/regions might be too high (Clark et al. 2018).
15.5.2Identified Financing Gaps for Sector and Regions
The following section compares recent climate finance flows as reported by CPI and IEA to needs derived in Section 15.4, ignoring the slight mismatch in time horizons. The analysis ignores interlinked gaps, in particular infrastructure investment gaps and other SDG-related investment gaps, which need to be addressed in parallel to reach the LTGG but also at least partially to facilitate green investments.
Total investments in mitigation need to increase by around three and six times with significant gaps existing across sectors and regions 8 ( high confidence). The findings on still significant gaps and limited progress over the past few years to some extent seem to contradict the massive increase in commitments by financial institutions. As discussed in Section 15.6, the investment gap is not due to global scarcity of funds.
However, these investment gaps have little explanatory power in terms of the magnitude of the challenge to mobilise funding. In addition to measurement challenges from different definitions and data gaps, sectors and regions offer highly divergent financial risk-return profiles, in particular due to missing or weak regulatory environments consistent with ambitions levels, and economic costs as well as limited local capital markets, limited institutional capacity to ensure safeguard, standardisation, scalability and replicability of investment opportunities and financing models, and a pipeline ready for commercial investments. Moreover, soft costs and institutional capacity for enabling environment that can be prerequisite for addressing financing gaps are ignored when focusing on investment cost needs.
Sectoral considerations. The renewable energy sector attracted the highest level of financing in absolute and relative terms with business models in generation being proven and rapidly falling technology costs driving the competitiveness of solar photovoltaic and onshore wind, even without taking account of the mitigation component (FS-UNEP Centre and BNEF 2019; IRENA 2020a). This investment activity comes in line with the first generation of NDCs and their heavy focus on mitigation opportunities in the renewable energy sector (Pauw et al. 2016; Schletz et al. 2017). Still, the investment gap tends to remain stable with flows over the past years not showing an upward trend.
Comparing annual average total investments in global fuel supply and the power sector of approximately USD1.5 trillion 9 yr –1 in 2019 (IEA 2020a) to the investment in the Stated Policies Scenario (approximately 1.7 trillion USD2015 yr –1) and the Sustainable Development Scenario (approximately 1.8 trillion USD2015 yr –1) in 2030 underlines the required shift of existing capital investment from fossil to renewables even more than the need to increase sector allocations (Granoff et al. 2016; McCollum et al. 2018).
Ensuring access to the heavily regulated electricity markets is a key driver for an accelerated private sector engagement (IFC 2016; FS-UNEP Centre and BNEF 2018; REN21 2019), with phasing out of support schemes and regulatory uncertainty being a major driver for reduced investment volumes in various regional markets in the past years (FS-UNEP Centre and BNEF 2015, 2016, 2017, 2018, 2020). Strategic investors and corporate investments by utilities dominate the investment activity in developed countries and countries in transition (BNEF 2019) based on the competitiveness of renewable energy sources. Reasonable auction results based on a substantial private-sector competition for investments have also been achieved in selected developing countries driven by rather standardised contract structures and the increased availability of risk mitigation instruments addressing political and regulatory risks and home bias constraints (FS-UNEP Centre and BNEF 2019; IRENA 2020a). Development finance institution (DFI) climate portfolios tend to be driven by concessional loans for renewable energy generation assets with equity often being provided by (semi-) commercial investors (Section 15.3) which will have to change to accelerate renewable energy investment activity.
Given the wide range of estimates on current investment flows into energy efficiency, substantial uncertainty exists with regard to the magnitude of the investment gaps. While CPI publishes investment levels of 41 billion USD2015 in 2019 and 24 billion USD2015 in 2020 for energy efficiency, counting majorly international flows, IEA results come in at a much higher level of around 250 billion USD2015 annually between 2017 and 2020 (IEA 2021c) and IRENA (2020c) estimates energy efficiency investments in buildings between 2017–2019 at an average of USD139 billion yr –1.
Public sector investments in the transport sector have increased significantly in the past years reflecting the increased interest of capital markets in renewable energy and the efficient and corresponding reallocation of public funding. Provision of funding by capital markets for public transport infrastructure among others heavily depends on suitable financing vehicles and increased funding for development of projects with a low level of standardisation (OECD 2015a).
Both IRENA and IEA include only incremental costs of EVs in their estimates on needs while CPI, when measuring actual flows, includes those at full costs. Total private flows for EVs included in CPI numbers amount to USD41 billion in 2018 (Buchner et al. 2019), representing more than 80% of private sector finance into the transport sector, around one third of total public and private funding to the transport sector in 2018. This likely results in an underestimation of the financing gap – in addition to the fact that estimates for investment needs for rail infrastructure are only available for selected countries.
Current financing of land-based mitigation options is less than USD1 billion yr –1 representing only 2.5% of climate mitigation funding, significantly below the potential proportional contribution (Buchner et al. 2019). A stronger focus on deforestation-free value chain, including a stronger reflection in taxonomies and financial sector investment decision processes are necessary to ensure an alignment of financial flows with the LTGG. Taking into account the specifics of land-based mitigation (in particular long investment horizons, strong dependency on the monetisation of mitigation effects, strong public sector involvement) a significant scale-up of commercial financing to the sector can hardly be expected in the absence of strong climate policies (Clark et al. 2018). Agriculture is likely to develop more potential to mobilise private finance than the forest sector given its strong linkage to food security and hunger and shorter payback periods. The significant gap in land-based mitigation finance also indicates the crucial lack of finance to the bottom of the pyramid.
Agricultural support is an important source of distortions to agricultural incentives in both rich and poor countries (Mamun et al. 2019) ranging from the largest component of the support, market price supports, increased gross revenue to farmers as a result of higher prices due to market barriers created by government policies, to production payments and other support including input subsidy (e.g., fertiliser subsidy) (Searchinger et al. 2020). USD600 billion of annual governmental support for agriculture in the OECD database contributes only modestly to the related objectives of boosting crop yields and just transition (Searchinger et al. 2020). A review of NDCs of 40 developing countries which submitted a NDC to the UNFCCC Interim NDC Registry by April 2017, and include within their NDC efforts to REDD+ via support from the UN-REDD Programme and/or World Bank Forest Carbon Partnership Facility, indicates that none of the countries reviewed mention fiscal policy reform of existing finance flows to agricultural commodity production or other publicly supported programmes that affect the direct and underlying drivers of land use conversion (Kissinger et al. 2019).
Analysis by region and type of economy. The analysis of gaps by type of economy illustrates the challenge for developing countries. Estimated mitigation financing needs as a percentage of mean 2017–2020 GDP in USD2015 comes in at around 2–4% for developed countries, and around 4-9% for developing countries ( high confidence) (Figure 15.4). Climate finance flows have to increase by a factor of four to seven in developing countries and three to five in developed countries. This disparity is further exacerbated when considering adaptation, infrastructure and SDG-related investment needs ( high confidence) (Hourcade et al. 2021a). However, differences across developing countries are significant. Flows to Eastern Asia, with its annual average flows (2017–2020) of 252 billion USD2015 being dominated by China (more than 95% of total mitigation flows to Eastern Asia), would have to increase by a factor of two to four, a comparable level to developed countries. Section 15.6.2 elaborates on outlooks with regard to fiscal space and ability to tap capital markets, in particular for developing countries. In particular, attention must accelerate on low-income Africa. This large continent currently contributes very little to global emissions, but its rapidly rising energy demands and renewable energy potential versus its growing reliance on fossil fuels and ‘cheap’ biomass (especially fuelwood for cooking and charcoal, with impacts on deforestation) amid fast-rising urbanisation makes it imperative that institutional investors and policymakers recognise the very large ‘leap-frog’ potential for the renewable energy transition as well as risks of lock-in effects in infrastructure more generally in Africa that is critical to hold the global temperatures rise to well below 2°C in the longer term (2020–2050). Overlooking this transition opportunity, rivalling China, India, USA and Europe, would be costly. Policies centred around the accelerated development of local capital markets for energy transitions – with support from external grants, supra-national guarantees and recognition of carbon remediation assets – are crucial options here, as in other low-income countries and regional settings. Notably, climate finance flows to African countries might have even decreased for mitigation technology deployment (stagnated for adaptation between 2017 and 2020), widening the finance gap in African countries in the recent years (high confidence).

Figure 15.4 | Breakdown of recent average (downstream) mitigation investments and model-based investment requirements for 2020–2030 (USD billion) in scenarios that likely limit warming to 2°C or lower. Mitigation investment flows and model-based investment requirements by sector / segment (energy efficiency in buildings and industry, transport including efficiency, electricity generation, transmission and distribution including electrification, and agriculture, forestry and other land use), by type of economy, and by region (see Annex II Part I Section 1: By region is based on intermediate level (R10) classification scheme. By type of economy is based on intermediate level (R10) classification scheme, which considers ‘North America’, ‘Europe’, and ’Australia, Japan and New Zealand’ as developed countries, and the other seven regions as developing countries). Breakdown by sector / segment may differ slightly from sectoral analysis in other contexts due to the availability of investment needs data. The granularity of the models assessed in Chapter 3, and other studies, do not allow for a robust assessment of the specific investment needs of LDCs or SIDSs. Investment requirements in developing countries might be underestimated due to missing data points as well as underestimated technology costs. In modelled pathways, regional investments are projected to occur when and where they are cost cost-effective to limit global warming. The model quantifications help to identify high-priority areas for cost-effective investments, but do not provide any indication on who would finance the regional investments. Investment requirements and flows covering downstream / mitigation technology deployment only. Data includes investments with a direct mitigation effect, and in the case of electricity, additional transmission and distribution investments. See section 15.4.2 Quantitative assessment of financing needs for detailed data on investment requirements. Data on mitigation investment flows are based on a single series of reports (Climate Policy Initiative, CPI) which assembles data from multiple sources. Investment flows for energy efficiency are adjusted based on data from the International Energy Agency (IEA). Data on mitigation investments do not include technical assistance (i.e., policy and national budget support or capacity building), other non-technology deployment financing. Adaptation only flows are also excluded. Data on mitigation investment requirements for electricity are based on emission pathways C1, C2 and C3 (Table SPM.1). For electricity investment requirements, the upper end refers to the mean of C1 pathways and the lower end to the mean of C3 pathways. Data points for energy efficiency, transport and AFOLU cannot always be linked to C1–C3 scenarios. Data do not include needs for adaptation or general infrastructure investment or investment related to meeting the SDGs other than mitigation, which may be at least partially required to facilitate mitigation. The multiplication factors show the ratio of average annual model-based mitigation investment requirements (2020–2030) and most recent annual mitigation investments (averaged for 2017–2020). The lower and upper multiplication factors refer to the lower and upper ends of the range of investment needs.
Given the multiple sources and lack of harmonised methodologies, the data can only be indicative of the size and pattern of investment gaps. The gap between most recent flows and required investments is only a single indicator. A more comprehensive (and qualitative) assessment is required in order to understand the magnitude of the challenge of scaling up investment in sectors and regions. The analysis also does not consider the effects of misaligned flows. {15.3, 15.4, 15.5, Table 15.2, Table 15.3, Table 15.4}

Figure 15.5 | Visual abstract to address financing gaps in Section 15. 6.
Over 80% of climate finance is reported to originate and stay within borders, and even higher for private climate flows (over 90%) (Boissinot et al. 2016). There are multiple reasons for such ‘home bias’ in finance – national policy support, differences in regulatory standards, exchange rate, political and governance risks, as well as information market failures. The extensive home bias means that even if national actions are announced and intended to be implemented unilaterally and voluntarily, the ability to implement them requires access to climate finance which is constrained by the relative ability of financial and capital markets at home to provide such financing, and access to global capital markets that requires supporting institutional policies in source countries. ‘Enabling’ public policies and actions locally (cities, states, countries and regions), to reduce investment risks and boost domestic climate capital markets financing, and to enlarge the pool of external climate financing sources with policy support from source capital countries thus matters at a general level. The biggest challenge in climate finance is likely to be in developing countries, even in the presence of enabling policies and quite apart from any other considerations such as equity and climate justice (Klinsky et al. 2017) or questions about the equitable allocations of future ‘climate budgets’ (Gignac and Matthews 2015). The differentiation between developed and developing countries matters most on financing. Most developed countries have already achieved very high levels of incomes, have the largest pool of capital stock and financial capital (which can be more easily redeployed within these countries given the home bias of financial markets), the most well-developed financial markets and the highest sovereign credit ratings, in addition to starting with very high levels of per capita carbon consumption – factors that should allow the fastest adjustment to low-carbon investments and transition in these countries from domestic policies alone. The financial and economic circumstances are more challenging in many developing countries, even within a heterogeneity of circumstances across countries. The dilemma, however, is that the fastest rates of the expected increase in future carbon emissions are in developing countries. The biggest challenge of climate finance globally is thus likely to be the constraints to climate financing because of the opportunity costs and relative under-development of capital markets and financing constraints (and costs) at home in developing countries, and the relative availability or absence of adequate financing policy support internationally from developed countries. The Paris Agreement and commitment by developed countries to support the climate financing needs of developing countries thus continue to matter a great deal.
Soft costs/institutional capacity (Osama et al. 2021). Most funding needs assessments focus on technology costs and ignore the cascade of financing needs as outlined above. International grant funding or national budget allocations for soft costs like the creation of a regulatory environment can be a prerequisite for the supply of commercial financing for the deployment of technologies. Such critical funding needs might represent a small share of overall investment needs but current (relatively small) gaps in funding of policy reforms can hinder or delay deployment of large volumes of funding in later years. The role, as well as the approximate volumes of such required timely international grant funding or national budget allocations, appear underestimated in research. The numbers available for the creation of an enabling environment for medium-sized renewable energy (RE) projects in Uganda (GET FiT Uganda 2018) are illustrative only and cannot be transferred as assumptions to other countries without taking into account potentially varying starting points in terms of institutional readiness, pipelines, as well as the general business environment. GET FiT Uganda supported 170 MWp of medium-scale RE capacity triggering investments of USD453 million (GET FiT Uganda 2018), international results-based incremental cost support amounted to USD92 million and project preparation, technical assistance, and implementation support, required USD8 million, excluding support from national agencies.
There is strong evidence of the correlation between institutional capacity of countries and international climate finance flows towards those economies (Adenle et al. 2017; Stender et al. 2019) and a strong need for robust institutional capacity to manage the transformation in a sustainable and human rights based way (Duyck et al. 2018). Oneexample to consider unaddressed social concerns is the ongoing call for feedback by the European Commission and its platform on sustainable finance. It argues for a social taxonomy, that can support the identification of financing opportunities for economic activities contributing to social objectives (European Commission 2021b). SEforAll has highlighted the issue of investments not going to the countries with the greatest need, also partly driven by institutional capacity levels (SEforALL and CPI 2020). Also, most of the developing countries’ NDCs are conditional upon international support for capacity building (Pauw et al. 2020). The Climate Technology Centre and Network (CTCN) was created as an operational arm of the UNFCCC Technology Mechanism with the mandate to respond to requests from developing countries. Initial evaluations of the mechanism underpin its importance and value for developing countries but stress long lead times and predictability of future international public finance to maintain operations as key challenges (UNFCCC 2017; DANIDA 2018). While limited pipelines, limited absorptive capacities as well as restricted institutional capacity of countries are often stated as challenges for an accelerated deployment of finance (Adenle et al. 2017), the question remains on the role of international public climate finance to address this gap and whether a concrete current financing gap exists for patient institutional capacity building. While current short-term, mostly project-related, capacity building often fails to meet needs but alternative, well-structured patient interventions and finance could play an important role (Saldanha 2006; Hope 2011) accepting other barriers than financing playing a role as well. One reason why international public climate finance is not sufficiently directed to such needs might be the complexity in measuring intangible, direct outcomes like improved institutional capacity (Clark et al. 2018).
Early stage/venture capital financing/pilot project financing. Early-stage companies in impact investment sectors with business solutions can contribute positively to climate impact. Figure SPM.8 highlights the need for new business models facilitating parts of the behavioural change. Also, SE4All has underpinned the need for an expansion of available business models to achieve universal access (SEforALL and CPI 2020). Further research and development needs range from resource efficiency of proven technologies and next generation technologies but also new technologies (Chapter 16). Access to early stage financing remains critical with performance in recent years being weak (Gaddy et al. 2016). This historically weak performance of clean tech start-ups burdens the interest of investors in the sector on the one hand and discourages experienced executive talent (Wang and Yee 2020). Besides that, the concentration of venture capital markets in the USA, Europe and India represents a major challenge (FS-UNEP Centre and BNEF 2019; Statistica 2021). With regard to commercial-scale demonstration projects, IEA estimates a need of USD90 billion of public sector finance before 2030 having around USD25 billion already planned by governments to 2030 (IEA 2021c).
Need for parallel rather than sequential investment decisions. The needs and gaps assessment does not include upstream investment needs required to facilitate the technology deployment as foreseen in the scenarios presented above. For example, for their transforming energy scenario IRENA estimates the number of EVs to increase from around 8 million units in 2019 to 269 million units in 2030 (IRENA 2020c). This would require investments in battery factories amounting to approximately USD207 billion with further investment requirements in the value chain (IRENA 2020d). This illustrates the extent of parallel investments based on goals rather than concrete regulatory interventions and/or demand and poses a problem of upfront investment risks for each industry in the chain in the absence of certainty of the presence of parallel decisions in the upstream and downstream links in the chain. This is a typical element of the ‘valley of the death’ of innovation (Scherer et al. 2000; Åhman et al. 2017). It discourages risk-taking and slows down the learning-by-doing processes, economies of scale and increasing returns to adoption needed for lowering the costs of systemic technical change (Kahouli-Brahmi 2009; Weiss et al. 2010). Implications for risk perception, financing costs as well as investment decision-making processes and ultimately for feasibility are rarely considered.
Finance for adaptation and resilience. As explained early, the reduction of the infrastructure gap to increase societies’ resilience and the implementation of the NAPs will require more and higher levels of sustained financing. Activities mobilised for adaptation and resilience are often not marketable and their financing will continue coming from the public sector (Murphy and Parry 2020) and, at the international level, from grants-based technical assistance or through budgetary support or basket finance for large projects/programmes or sector-wide approaches or multilateral finance under (Non-)UNFCCC10 that also anticipate supporting NAP implementation – particularly those involving incremental costs and co-benefits, which will include sectoral approaches such as water, energy, infrastructures, and food production. According to the UNFCCC, ‘in 2015–2016, 3% of international public adaptation finance flows was supplied by multilateral climate funds, while 84% came from development finance institutions and 13% from other government sources’ (UNFCCC 2019c). Comprehensive reporting on adaptation finance by Murphy and Parry (2020) and Buchner et al. (2019) argues that flows of finance for adaptation action in developing countries in 2017 and 2018 were estimated to be approximately USD30 billion; this plus an additional estimated flow of USD12 billion for dual adaptation and mitigation actions totalled USD42 billion, accounting for 7.25% of the total estimated international public and private flows of climate finance (Buchner et al. 2019). They are far below the financing needs given in Section 15.4. To date, the private sector has limited involvement in NAPs and adaptation projects and planning but can be involved through public-private partnership (Section 15.6.2.1) and other incentives provided by governments (Schmidt-Traub and Sachs 2015; Druce et al. 2016; Koh et al. 2016; UNEP 2016; NAP Global Network 2017; Murphy and Parry 2020) and innovative private financing mechanisms such as green and blue bonds. However, adaptation financing is only about 2% of the share of green bond financing raised up to June 2019 (UNFCCC 2019c), 11 whereas it is about 10% of sovereign green bonds raised (UNFCCC 2019d). (Tuhkanen 2020), in a detailed review of green bond issuance in the Environmental Finance Data base 2019, found that between March 2010 to April 2019, ‘5% of all green bonds issued were categorised as adaptation and that ‘the private sector accounts for a significant proportion of adaptation-related green bond issuances’ (Tuhkanen 2020). However, GIZ (2017b), Nicol et al. (2017, 2018a), and Tuhkanen (2020) highlight that there is scepticism about this stream of finance for adaptation due to the factors that have thus far limited the private sector’s involvement in adaptation: lack of resilience-related revenue streams, the small scale of some adaptation projects and the overall ‘intangibility’ of financing adaptation projects (Larsen et al. 2019).
Financing for resilience is limited, unpredictable, fragmented and focused on few projects or sectors and short term as opposed to programmatic and long term (10–15 years) finacing to build resilience (ISDR 2009, 2011; Kellett and Peters 2014; Watson et al. 2015). Market-based mechanisms are available but not equally accessible to all developing countries, particularly SIDS and LDCs, and such mechanisms can undermine debt sustainability (OECD and World Bank 2016 ). While resilience financing is mainly grant funding, concessional loans are increasing substantially and are key sources of financing for disaster and resilience, particularly for upper-middle-income countries (OECD and World Bank 2016 ). The combination of these trends can contribute to greater levels of indebtedness among many developing countries, many of which are already at or approaching debt distress.
Social protection systems can be linked with a number of the instruments already considered: reserve funds, insurance and catastrophe bonds, regional risk-sharing facilities, contingent credit, in addition to traditional international aid and disaster response. Hallegatte et al. (2017) recommend combining adaptive social protection with financial instruments in a consistent policy package, which includes financial instruments to deliver adequate liquidity and contingency plans for the disbursement of funds post disaster. Challenges related to financing residual climate-related losses and damages are particularly high for developing countries. Financing losses and damages from extreme events requires rapid pay-outs; the cost of financing for many developing countries is already quite high; and the expense of risk financing is expected to increase as disasters become more frequent, intense and more costly, not only due to climate change but also due to higher levels of exposure. Addressing both extreme and slow onset climate impacts requires designing adequate financial protection systems for reaching the most vulnerable. Moreover, some fraction of losses and damages, both material and non-material, are not commonly valued in monetary terms (non-economic loss) and hence financing requirements are hard to estimate. These non-market-based residual impacts include loss of cultural identity, sacred places, human health and lives (Ameli et al. 2021a; Paul 2019; Serdeczny 2019).
15.6Approaches to Accelerate Alignment of Financial Flows with Long-term Global Goals
Near-term actions to shift the financial system over the next decade are critically important and possible with globally coordinated efforts. Taking into account the inertia of the financial system as well as the magnitude of the challenge to align financial flows with the long-term global goals, fast action is required to ensure the readiness of the financial sector as an enabler of the transition ( high confidence). The following subsections elaborate on key areas which can have a catalytic effect in terms of addressing existing barriers – besides political leadership and interventions discussed in other Chapters of AR6.
Addressing knowledge gaps with regard to climate risk analysis and transparency will be one key driver for more appropriate climate risk assessment and efficient capital allocation (Section 15.6.1), efficient enabling environments to support the reduction of financing costs and reduce dependency on public financing (Section 15.6.2), a revised common understanding of debt sustainability, including that negative implications of deferred climate investments on future GDP, particularly stranded assets and resources to be compensated, can facilitate the stronger access to public climate finance, domestically and internationally (Section 15.6.3), climate risk pooling and insurance approaches are a key element of financing of a just transition (Section 15.6.4), the supply of finance to a widened focus on relevant actors can ensure transformational climate action at all levels (Section 15.6.5), new green asset classes and financial products can attract the attention of capital markets and support the scale up of financing by providing standardised investment opportunities which can be well integrated in existing investment processes (Section 15.6.6), a stronger focus on the development of local capital markets can help mobilise new investor groups and to some extent mitigate home bias effects (Section 15.6.7), new business models and financing approaches can help to overcome barriers related to transactions costs by aggregating and/or transferring financing needs and establishing a supply of finance for needs of stakeholder groups lacking financial inclusion (Section 15.6.8).
15.6.1Addressing Knowledge Gaps with Regard to Climate Risk Analysis and Transparency
Achieving climate mitigation and adaptation objectives requires ambitious climate finance flows in the near-term, that is, 5–10 years ahead. However, knowledge gaps in the assessment of climate-related financial risk are a key barrier to such climate finance flows. Therefore, this section discusses the main knowledge gaps that are currently being addressed in the literature and those that remain outstanding.
Climate-related financial risk is meant here as the potential adverse impact of climate change on the value of financial assets. A recent but remarkable development since AR5 is that climate change has been explicitly recognised by financial supervisors as a source of financial risk that matters both for financial institutions and citizens’ savings (Bolton et al. 2020). Previously, climate change was mostly regarded in the finance community only as an ethical issue. The reasons why climate change implies financial risk are not new and are discussed more in detail below. What is new is that climate enters now as a factor in the assessment of financial institutions’ risk (e.g., the European Central Bank or the European Banking Authority) and credit rating (Section 15.6.3), and, going forward, into stress-test exercises. This implies changes in incentives of the supervised financial actors, both public and private, and thus changes in the landscape of mitigation action by generating a new potential for climate finance flows. However, critical knowledge gaps remain. In particular, the underestimation of climate-related financial risk by public and private financial actors can explain that the current allocation of capital among financial institutions is often inconsistent with the mitigation objectives (Rempel et al. 2020). Moreover, even a correct assessment of risk, which could provide incentives for divesting from carbon-intensive activities, does not necessarily lead to investing in the technical options needed for deep decarbonisation. Therefore, understanding the dynamics of the low-carbon transition require to fill in at the same time gaps about risk and gaps about investments in enabling activities in a broader sense.
Physical risk. On the one hand, unmitigated climate change implies an increased potential for adverse socio-economic impacts especially in more exposed economic activities and areas ( high confidence). Accordingly, physical risk refers to the component of financial risk associated with the adverse physical impact of hazards related to climate change (e.g., extreme weather events or sea level rise) on the financial value of assets such as industrial plants or real estate. In turn, these losses can translate into losses on the values of financial assets issued by exposed companies (e.g., equity/bonds) and or sovereign entities as well as losses for insurance companies. The assessment of climate financial physical risks poses challenges in terms of data, methods and scenarios. It requires cross-match scenarios of climate-related hazards at granular geographical scale, with the geolocation and financial value of physical assets. The relationship between the value of physical assets (such as plants or real estate) and the financial value of securities issued by the owners of those assets is not straightforward. Further, the repercussion of climate-related hazards on sovereign risk should also be accounted for.
Transition risks and opportunities. On the other hand, the mitigation of climate change, by means of a transition to a low-carbon economy, requires a transformation of the energy and production system at a pace and scale that implies adverse impacts on a range of economic activities, but also opportunities for some other activities ( high confidence). If these impacts are factored in by financial markets, they are reflected in the value of financial assets. Thus, transition risks andopportunities refers to the component of financial risk (opportunities) associated with negative (positive) adjustments in assets’ values resulting directly or indirectly from the low-carbon transition.
The concepts of carbon stranded assets (see e.g., Leaton and Sussams 2011), and orderly vs disorderly transition (Sussams et al. 2015) which emerged in the NGO community, have provided powerful metaphors to conceptualise transition risks and have evolved into concepts used also by financial supervisors (NGFS 2019)and academics. The term carbon stranded assets refers to fossil fuel-related assets (fuel or equipment) that become unproductive. An orderly transition is defined here as a situation in which market players are able to fully anticipate the price adjustments that could arise from the transition. In this case, there would still be losses associated with stranded assets, but it would be possible for market players to spread losses over time and plan ahead. In contrast, a disorderly transition is defined here as a situation in which a transition to a low-carbon economy on a 2°C path is achieved (i.e., by about 2040), but the impact of climate policies in terms of reallocation of capital into low-carbon activities and the corresponding adjustment in prices of financial assets (e.g., bonds and equity shares) is large, sudden and not fully anticipated by market players and investors. Note the impact could be unanticipated even if the date of the introduction is known in advance by the market players. There are several reasons why such adjustments could occur. One simple argument is that the political economy of the transition is characterised by forces pulling in different directions, including opposing interests within the industry, and mounting pressure from social awareness of unmitigated climate risks. Politics will have to find a synthesis and the outcome could remain uncertain until it suddenly unravels. Note also that, in order to be relevant for financial risk, the disorderly transition does not need to be a catastrophic scenario in terms of the fabric of markets. It also does not automatically entail systemic risk, as discussed below. Knowledge gaps in this area are related to emerging questions, including: What are, in detail, the transmission channels of physical and transition risk? How to assess the magnitude of the exposure to these risks for financial institutions and ultimately for people’s savings? How do transition risk and opportunities depend on the future scenarios of climate change and climate policies? How to deal with the intrinsic uncertainty around the scenarios? To what extent could an underestimation of climate-related financial risk feed back on the alignment of climate finance flows and hamper the low-carbon transition? Should climate risk be explicitly accounted for in regulatory frameworks for financial institutions, such as Basel III for banks and national frameworks for insurance? What lessons from the 2008 financial crisis are relevant here, regarding moral hazard and the trustworthiness of credit risk ratings? The attention of both practitioners and the scientific community to these questions has grown since the Paris Agreement. In the following we review some of the findings from the literature, but the field is relatively young and many of the questions are still open. 12 Damages from climate change are expected to escalate dramatically in Europe (Forzieri et al. 2018) and in some EU countries there is already some evidence that banks, anticipating possible losses on the their loan books, lend proportionally less as a consequence.
Assessment of physical risk. There is a literature on estimates of economic losses on physical assets (see Cross-Working Group Box ECONOMIC in chapter 16 of AR6 WGII). Here we discuss some figures and mechanisms that are relevant for the financial system. Significant cost increases have been observed related to increases in frequency and magnitude of extreme events ( high confidence) (Section 15.4.2). At the global level, the expected ‘climate value at risk’ (climate VaR) of financial assets has been estimated to be 1.8% along a business-as-usual emissions path (Dietz et al. 2016), with however, a concentration of risk in the tail (e.g., 99th VaR equals to 16.9%, or USD24.213 trillion, in 2016). Climate-related impacts are estimated to increase the frequency of banking crises (up over 200% across scenarios) while rescuing insolvent banks could increase the ratio of public debt to gross domestic product by a factor of two (Lamperti et al. 2019). Further assessments of physical risk for financial assets (Mandel 2020), accounting in particular for the propagation of losses through financial networks, estimate global yearly GDP losses at 7.1% (1.13%) in 2080, without adaptation (with adaptation), the former corresponding to a 10-fold increase with respect to the current yearly losses (0.76% of global GDP). Finally, climate physical risk can impact on the value of sovereign bonds (one of the top asset classes by size), in particular for vulnerable countries (Volz et al. 2020).
Insurance pay-outs for catastrophes have increased significantly over the last 10 years, with dramatic cost spikes in years with multiple major catastrophes (such as in 2018 with hurricanes Harvey, Irma, and Maria). This trend is expected to continue. The indirect costs of a climate-related flooding event can be up to 50% of the total costs, the majority of which is not covered by insurance (Alnes et al. 2018) (Section15.6.4). The gap between total damage losses and insurance pay-outs has increased over the past 10 years (Swiss Re Institute 2019). Indeed, the probability of ‘extreme but plausible’ scenarios will be progressively revised upwards in the ‘value at risk’. As a result it becomes more difficult to find financial actors willing to provide insurance, as was observed for real estate in relation to flood and wildfires in California (Ouazad and Kahn 2019). This progressive adjustment would keep the financial system safe (Climate-Related Market Risk Subcommittee 2020; Keenan and Bradt 2020), but transfer to taxpayers the onus of damage compensation and the financing of adaptation investments (OECD 2021c) as well as build up latent liabilities.
Assessment of transition risk. Carbon stranded assets. Fossil fuel reserve and resource estimates exceed in equivalent quantity of CO2 with virtual certainty the carbon budget available to reach the 1.5°C and 2°C targets ( high confidence) (Meinshausen et al. 2009; McGlade and Ekins 2015; Millar et al. 2017). In relative terms, stranded assets of fossil fuel companies amount to 82% of global coal reserves, 49% of global gas reserves and 33% of global oil reserves (McGlade and Ekins 2015). This suggests that only less than the whole quantity of fossil fuels currently valued (either currently extracted, waiting for extraction as reserves or assets on company balance sheets) can yield economic return if the carbon budget is respected. The devaluation of fossil fuel assets implies financial losses for both the public sector (Section 15.6.8) and the private sector (Coffin and Grant 2019). Global estimates of potential stranded fossil fuel assets amount to at least 1 trillion, based on ongoing low-carbon technology trends and in the absence of climate policies (cumulated to 2035 with 10% discount rate applied; USD8 trillion without discounting (Mercure et al. 2018a)). With worldwide climate policies to achieve the 2°C target with 75% likelihood, this could increase to over USD4 trillion (until 2035, 10% discount rate; USD12 trillion without discounting). Other estimates indicate USD8–15 trillion (until 2050, 5% discount rate, (Bauer et al. 2015)) and USD185 trillion (cumulated to year 2115 using combined social and private discount rate (Linquiti and Cogswell 2016)). However the geographical distribution of potential stranded fossil fuel assets (also called ‘unburnable carbon’) is not even across the world due to differences in production costs (McGlade and Ekins 2015). In this context, a delayed deployment of climate finance and consequently limited alignment of investment activity with the Paris Agreement tend to strengthen carbon and thus to increase the magnitude of stranded assets.
Assets directly and indirectly exposed to transition risk. In terms of types of assets and economic activities, the focus of estimates of carbon stranded assets tends to be on physical reserves of fossil fuel (e.g., oil fields) and sometimes financial assets of fossil fuel companies (van der Ploeg and Rezai 2020). However, a precondition for a broader analysis of transition risks and opportunities is to go beyond the narrative of stranded assets and to consider a classification of sectors of all the economic activities that could be affected (Monasterolo 2020). This, in turn depends on their direct or indirect role in the GHG value chain, their level of substitutability with respect to fossil fuel and their role in the policy landscape. Moreover, such a classification needs to be replicable and comparable across portfolios and jurisdictions. One classification that meets these criteria is the Climate Policy Relevant Sectors (CPRS) (Battiston et al. 2017) which has been used in several studies by financial supervisors (EIOPA 2018; ECB 2019; EBA 2020; ESMA 2020). The CPRS classification builds on the international classification of economic activities (ISIC) to map the most granular level (4 digits) into a small set of categories characterised by differing types of risk: fossil fuel (i.e., all activities whose revenues depend mostly and directly on fossil fuel, including concession of reserves and operating industrial plants for extraction and refinement); electricity (affected in terms of input but that can in principle diversify their energy sources); energy intensive (e.g., steel or cement production plants, automotive manufacturing plants), which are affected in terms of energy cost but not in terms of the main input); and transport and buildings (affected in terms of both energy sources and specific policies). All financial assets (e.g., bonds, equity shares, loans) having as issuers or counterparties firms whose revenues depend significantly on the above activities are thus potentially exposed to transition risks and opportunities. Further, investors’ portfolios have to be part of the analysis since changes in financial assets values affect the stability of financial institutions and can thus feed back into the transition dynamics itself (e.g., through cost of debt for firms and through costs for assisting the financial sector). One outstanding challenge for the analysis of investors’ exposure to climate risks is the difficulty of gathering granular and standardised information on the breakdown of non-financial firms’ revenues and CAPEX in terms of low-/high-carbon activities (high confidence).
Several financial supervisors have conducted assessments of transition risk for the financial system at the regional level. For instance, the European Central Bank (ECB) reported preliminary estimates of aggregate exposures of financial institutions to CPRS relative to their total debt securities holdings as ranging between 1% for banks to about 9% for investment funds (ECB 2019). The European Insurance and Occupational Pensions Authority (EIOPA) reported aggregate exposures to CPRS of EU insurance companies at about 13% of their total securities holdings (EIOPA 2018). Further analyses on the EU securities holdings indicate that among financial investments in bonds issued by non-financial corporations, EU institutions hold exposures to CPRS ranging between 36.8% for investment funds to 47.7% for insurance corporations; analogous figures for equity holdings range from 36.4% for banks to 43.1% for pension funds (Alessi et al. 2019). Another study indicates that losses on EU insurance portfolios of sovereign bonds could reach up to 1%, in conservative scenarios (Battiston et al. 2019).
Given the magnitude of the assets that are potentially exposed, reported in the previously cited studies, a delayed or uncoordinated transition risk can have implications for financial stability not only at the level of individual financial institutions, but also at the macro level. The possible systemic nature of climate financial risk has been highlighted on the basis of general equilibrium economic analysis (Stern and Stiglitz 2021).
Some financial authorities recognise that climate change represents a major source of systemic risk, particularly for banks with portfolios concentrated in certain economic sectors or geographical areas (de Guindos 2021). Specifically, the concern that central banks would have to act as ‘climate rescuers of last resort’ in a systemic financial crisis stemming from some combination of physical and transition risk has been raised in the financial supervisor community (Bolton et al. 2020). The systemic nature of climate risk is reinforced by the possible presence of moral hazard. Indeed, if a sufficient number of financial actors have an incentive to downplay climate-related financial risk, then systemic risk builds up in the financial system, eventually materialising for taxpayers (Climate-Related Market Risk Subcommittee 2020). While such type of risk may go undetected to standard market indicators for a while, it can materialise with a time delay, similarly to the developments observed in the run up to the 2008 financial crisis.
These considerations are part of an ongoing discussion on whether the current financial frameworks, including Basel III, should incorporate explicitly climate risk as a systemic risk. In particular, the challenges in quantifying the extent of climate risk, reviewed in this section, especially if risk is systemic, raise the question whether a combination of quantitative and qualitative restrictions on banks’ portfolios could be put in place to limit the build-up of climate risks (Baranović et al. 2021).
Endogeneity of risk andmultiplicity of scenarios. One fundamental challenge is that climate-related financial risk is endogenous ( high confidence). This means that the perception of the risk changes the risk itself, unlike most contexts of financial risk. Indeed, transition risk depends on whether governments and firms continue on a business-as-usual pathway (i.e., misaligned with the Paris Agreement targets) or engage on a climate mitigation pathway. But the realisation of the transition pathway depends itself on how, collectively, society, including financial investors and supervisors, perceive the risk of taking or not taking the transition scenario. The circularity between perception of risk and realisation of the scenario implies that multiple scenarios are possible, and that which scenario is ultimately realised can depend on policy action. The coordination problem associated also with low-carbon investments opportunities increases the uncertainty. Further, not all low-carbon activities are directly functional to the transition (e.g., investments in pharmaceutical, IT companies, or financial intermediaries), thus not all reallocations of capital lead to the same path.
In this context, probabilities of occurrence of scenarios are difficult to assess and this is important because risks vary widely across the different scenarios. In this context a major challenge is the fat-tail nature of physical risk. One the one hand, forecasts of climate change and its impact on humans and ecosystems imply tail events (Weitzman 2014) and tipping points which cannot be overcome by model consensus (Knutti 2010). On the other hand, everything else the same, costs and benefits vary substantially with assumptions on agents’ utility, productivity, and intertemporal discount rate, which ultimately depend on philosophical and ethical considerations (Nordhaus 2007; Stern 2008; Pindyck 2013). Thus, more knowledge is needed on the interaction of climate physical and transition risks, the possible reinforcing feedbacks and transmission channels to the economy and to finance. Moreover, models need to account for compound risk, that is, the interaction of climate physical and/or transition risk with other sources of risk such as pandemics, such as COVID-19.
Challenges for climate transition scenarios. The endogeneity of risk and its associated deep uncertainty implies that the standard approach to financial risk, consisting of computing expected values and risk based on historical values of market prices, is not adequate for climate risk ( high confidence) (Bolton et al. 2020). To address this challenge, a recent stream of work has developed an approach to make use of climate policy scenarios to derive risk measures (e.g., expected shortfall) for financial assets and portfolios, conditioned to scenarios of disorderly transition (Battiston et al. 2017; Monasterolo and Battiston 2020; Roncoroni et al. 2020). In particular, climate policy shocks on the output of low-/high-carbon economic activities are calculated based on trajectories of energy technologies as provided by large-scale Integrated Assessment Models (Kriegler et al. 2015; McCollum et al. 2018) conditioned to the introduction of specific climate policies over time. This approach allows to conduct climate stress-tests both at the level of financial institutions and at the level of the financial system of a given jurisdiction.
In a similar spirit, recently, the community of financial supervisors in collaboration with the community of climate economics has identified a set of climate policy scenarios, based on large-scale IAM, as candidate scenarios for assessing transition risk (Monasterolo and Battiston 2020). These scenarios have been used, for instance, in an assessment of transition risk conducted at a national central bank (Allen et al. 2020). This development is key to mainstreaming the assessment of transition risk among financial institutions, but the following challenges emerge ( high confidence). First, a consensus among financial supervisors and actors on scenarios of transition risk that are too mild could lead to a systematic underestimation of risk. The reason is that the default probability of leveraged financial institutions is sensitive to errors in the estimation of the loss distribution and hence sensitive on the choice of transition scenarios (Battiston and Monasterolo 2020 ). This in turn could lead to an allocation of capital across low-/high-carbon activities that is insufficient to cater for the investment needs of the low-carbon transition.
Second, IAM do not contain a description of the financial system in terms of actors and instruments and make assumptions on agents’ expectations that could be inconsistent with the nature of a disorderly transition (Espagne 2018; Pollitt and Mercure 2018a; Battiston et al. 2020b). In particular, IAMs solve for least cost pathways to an emissions target in 2100 (AR4 WGIII SPM Box 3), while the financial sector’s time horizon is much shorter and risk is an important factor in investment decisions.
Third, the current modelling frameworks used to develop climate mitigation scenarios, which are based on large-scale IAM, assume that the financial system acts always as an enabler and do not account for the fact that, under some condition (i.e., if there is underestimation of climate transition risk) can also act as a barrier to the transition (Battiston et al. 2020a) because it invests disproportionately more in high-carbon activities.
Macroeconomic implications of the technological transition. Global macroeconomic changes that may affect asset prices are expected to take place as a result of a possible reduction in growth or contraction of fossil fuel demand, in scenarios in which climate targets are met according to carbon budgets, but also following ongoing energy efficiency changes ( high confidence) (Clarke et al. 2014; Mercure et al. 2018a). A review of the economic mechanisms involved in the accumulation of systemic risk associated with declining industries, with focus on fossil fuels, is given by Semieniuk et al. (2021). An example is the transport sector, which uses around 50% of oil extracted (IEA 2018; Thomä 2018). A rapid diffusion of EV (and other alternative vehicle types) poses an important risk as it could lead to oil demand peaking far before mid-century (Mercure et al. 2018b; 2021). New technologies and fuel switching in aviation, heavy industry and shipping could further displace liquid fossil fuel demand (IEA 2017). A rapid diffusion of solar photovoltaic could displace electricity generation based predominantly on coal and gas (Sussams and Leaton 2017). A rapid diffusion of household and commercial indoor heating and cooling based on electricity could further reduce the demand for oil, coal and gas (Knobloch et al. 2019). Parallels can be made with earlier literature on great waves of innovation, eras of clustered technological innovation and diffusion between which periods of economic, financial and social instability have emerged (Freeman and Louca 2001; Perez 2009).
Due to the predominantly international nature of fossil fuel markets, assets may be at risk from regulatory and technological changes both domestically and in foreign countries (medium confidence). Fossil fuel exporting nations with lower competitiveness could lose substantial amounts of industrial activity and employment in scenarios of peaking or declining demand for fossil fuels. In scenarios of peaking oil demand, production is likely to concentrate towards the Middle East and OPEC countries (IEA 2017). Since state-owned fossil fuel companies tend to enjoy lower production costs, privately-owned fossil fuel companies are more at risk (Thomä 2018). Losses of employment may be directly linked to losses of fossil fuel-related industrial activity or indirectly linked through losses of large institutions, notably of government income from extraction royalties and export duties. A multiplier effect may take place making losses of employment spill out of fossil fuel extraction, transformation and transportation sectors into other supplying sectors (Mercure et al. 2018a).
Main regulatory developments andvoluntary responses to climate risk. Framing climate risk as a financial risk (not just as an ethical issue) is key for it to become an actionable criterion for investment decision among mainstream investors ( high confidence) (TCFD 2019). Since 2015 financial supervisors and central banks (e.g., the Financial Stability Board, the G20 Green Finance Study Group, and the Network for Greening the Financial System (NGFS)) have played a central role in raising awareness and increasing transparency of the potential material financial impacts of climate change within the financial sector (Bank of England 2015, 2018; TCFD 2019). The NGFS initiative has engaged, in particular, in the elaboration of climate financial risk scenarios.
Although disclosure has increased since the TCFD recommendations were published, the information is still insufficient for investors and more clarity is needed on potential financial impacts and how resilient corporate strategies are under different scenarios (TCFD 2019). Several efforts to provide guidance and tools for the application of the TCFD recommendations have been made (using Sustainability Accounting Standards Board (SASB) Standards and the Climate Disclosure Standards Board (CDSB) Framework to Enhance Climate-Related Financial Disclosures in Mainstream Reporting TCFD Implementation Guide (UNEP FI 2018; CDSB and SASB 2019). Results of voluntary reporting have been mixed, with one study pointing to unreliable and incomparable results reported by the US utilities sector to the CDP (Stanny 2018).
There have been also similar initiatives at the national level (DNB 2017; UK Government 2017; US GCRP 2018b). In particular, France was the first country to mandate climate risk disclosure from financial institutions (via Article 173 of the law on energy transition). However, disclosure responses have been so far mixed in scope and detail, with the majority of insurance companies not reporting on physical risk (Evain et al. 2018). In the UK, mandatory GHG emissions reporting for UK-listed companies has not led to substantial emissions reductions to date but could be laying the foundation for future mitigation (Tang and Demeritt 2018).
A key recent development is the EU Taxonomy for Sustainable Finance (TEG 2019), which provides a classification of economic activities that (among other dimensions) contribute to climate mitigation or can be enabling for the low-carbon transition. Indirectly, such classification provides useful information on investors’ exposure to transition risk (Alessi et al. 2019; ESMA 2020). Finally, many consultancies have stepped forward offering services related to climate risk. However, the methods are typically proprietary, non-transparent, or based primarily on carbon footprinting, which is a necessary but insufficient measure of climate risk. Further, ESG (environmental, social and governance) metrics can be useful but are, alone, inadequate to assess climate risk.
Decision-makers in financial risk management make increasing use of climate policy scenarios, in line with the TCFD guidelines and the recommendations of the NGFS. In order to reduce the number of scenarios to consider, Illustrative Mitigation Pathways (IMPs, Chapter 3), have been elaborated to illustrate key features that characterise the possible climate (policy) futures. The following considerations can be useful for scenario end-users who carry out risk analyses on the basis of the scenarios described in Chapter 3. It is possible to associate climate policy scenarios with levels of physical and/or transition risk, but these are not provided with the scenario data themselves.
On the one hand, each scenario is associated with a warming path, which in turn, on the basis of the results from WGII, implies certain levels of physical risk (AR6 WGII Chapter 16). However, climate impacts are not accounted for in the scenarios. Moreover, levels of risk may vary with the reason for concern and with the speed of the implementation of adaptation. On the other hand, while mitigation can come with transition risk, in the case of lack of coordination among the actors, as discussed earlier in this section, this is not modelled explicitly in the trajectories, since the financial sector is not represented in underlying models. The scientific state of the art in climate-related financial risk offers an analysis that is not yet comprehensive of both the physical and transition risk dimensions in the same quantitative framework. However, decision-makers can follow a mixed approach where they can combine quantitative risk assessment for transition risk with more qualitative risk analysis related to physical risk.
Figure 15.6 represents sequences of events following along a scenario both in terms of physical risk (left) and transition risk (right). Four groups of IMPs (more are considered based on the warming level they lead to in 2100. Current Policies (CurPol) considers climate policies implemented in 2020 with only a gradual strengthening afterwards, leading to above 4°C warming (with respect to pre-industrial levels). Moderate Action (ModAct) explores the impact of implementing the NDCs (pledged mitigation targets) as formulated in 2020 and some further strengthening afterwards, thereby limiting warming to less than 4°C (>50%), but above 3°C (>50%). In these two scenarios, there is no stabilisation of temperature, meaning that further warming occurs after 2100 (and higher risk) even if stabilisation could be eventually achieved. They are referred to as pathways with higher emissions. The warming levels reached along these two scenarios imply physical risk levels that are ‘Moderate’ until 2050 and ‘Very High’ in 2050–2100 (with low levels of adaptation). Noting, that ‘Moderate’ physical risk can mean for some countries (i.e., SIDS) significant and even hardly absorbable consequences (i.e., reaching hard adaptation limits). Transition risk is not relevant for these scenarios, since a transition is not pursued.
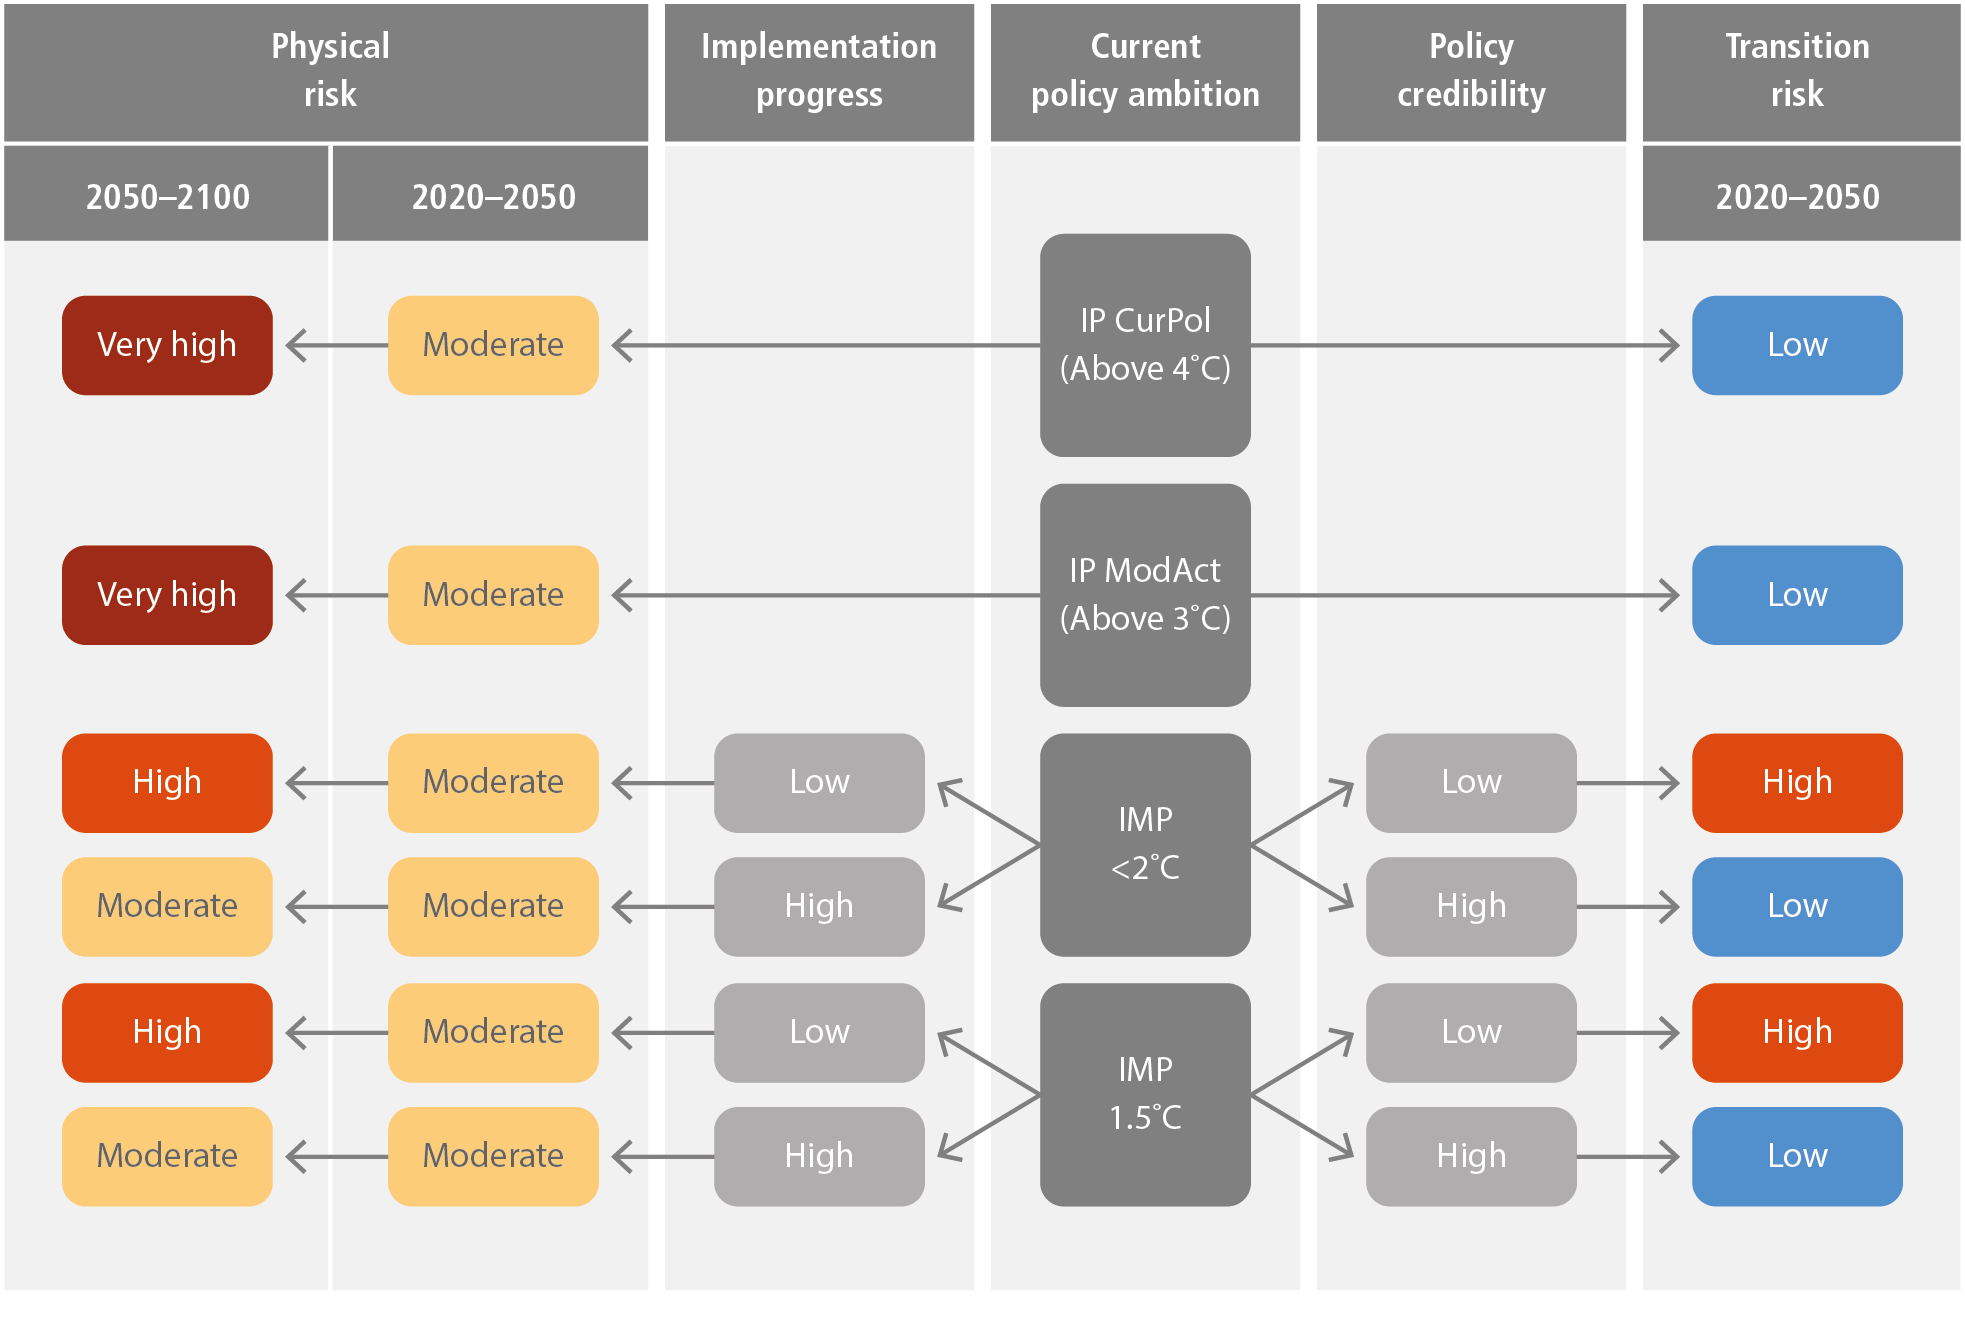
Figure 15.6 | Schematic representation of climate scenarios in terms of both physical and transition risk. While the figure does not cover all possible events, it maps out how the combination of stated targets can lead to different paths in terms of risk, depending on implementation progress and policy credibility. IMP 1.5°C and IMP< 2°C are representative for IMP-GS (Sens. Neg; Ren), IMP-Neg, IMP-LD; IMP-Ren; IMP-SP. Note that the figure defines ‘High’ progress as higher, but it is important that the physical risk varies by region and country. This means, that ‘Moderate’ physical risk can be significant and even hardly absorbable for some countries.
Illustrative Mitigation Pathways include two groups of scenarios consistent with modelled global pathways that limit warming to 2°C (>67%) or lower, respectively. The two groups are representative for the IMPs defined in Chapter 3. In these scenarios, warming is stabilised before 2100. The warming levels along these paths imply ‘Moderate’ physical risk until 2050 and ‘High’ risk in 2050–2100 (with low levels of adaptation). Transition risk can arise along these trajectories from changes in expectations of economic actors about which of the scenarios is about to materialise. These changes imply, in turn, possible large variations in the financial valuation of securities and contracts, with losses on the portfolio of institutional investors and households. High policy credibility is key to avoiding transition risk, by making expectations consistent early on with the scenario. Low credibility can delay the adjustment of expectations by several years, leading either to a late and sudden adjustment. However, if the policy never becomes credible, this changes the scenario since the initial target is not met.
15.6.2Enabling Environments
The Paris Agreement recognised for the first time the key role of aligning financial flows to climate goals. It further emphasises the importance of making financial flows consistent with climate actions and SDGs (Zamarioli et al. 2021).This alignment has now to be operated in a specific environment where the scaling-up of climate policies is conditional upon their contribution to post-COVID-19 recovery packages (Sections 15.2.2 and 15.2.3 and Box 15.6). The enabling environments that are to be established account for the structural parameters of the underinvestment in long-term assets. The persistent gap between the ‘propensity to save’ and ‘propensity to invest’ (Summers 2016) obstructs the scaling up of climate investments, and it results from a short-term bias of economic and financial decision-making (Miles 1993; Bushee 2001; Black and Fraser 2002) that returns weighted on short-term risk dominate the investment horizon of financial actors. Overcoming this bias is the objective of an enabling environment apt to launch of a self-reinforcing circle of trust between project initiators, industry, institutional investors, the banking system, and governments.
The role of government is crucial for creating an enabling environment for climate (Clark 2018), and governments are critical in the launching and maintenance of this circle of trust by lowering the political, regulatory, macroeconomic and business risks ( high confidence). The issue is not just to progressively enlarge the space of low-carbon investments but to replace one system (fossil fuels energy system) rapidly with another (low-carbon energy system). This is a wave of ‘creative destruction’ with the public support for developing new markets and new entrepreneurship and finance for green products and technologies in a context which requires strong complementarities between Schumpeterian (technological) and Keynesian (demand-related) policies (Dosi et al. 2017). However, it is challenging to overcome the constraint of public budget under the pressure of competing demands and of creditworthy constraints for countries that do not have an easy access to reserve currencies. It is needed to maximise, both at the national and international levels, the leverage ratio of public funds engaged in blended finance for climate change which is currently very low, especially in developing countries (Attridge and Engen 2019).
Transparency: Policy de-risking measures, such as robust policy design and better transparency, as well as financial de-risking measures, such as green bonds and guarantees, at both domestic and international levels, enhance the attractiveness of clean energy investments ( high confidence) (Steckel and Jakob 2018). Organisations such as the Task Force on Climate-related Financial Disclosures (TCFD) can help increase capital markets’ climate financing, including private sector, by providing financial markets with information to price climate-related risks and opportunities (TCFD 2020). However, risk disclosures alone would likely be insufficient as long as market failures that inhibit the emergence of low-carbon investment initiatives with positive risk-weighted returns ( high confidence) (Christophers 2017; Ameli et al. 2020).
Central banks and climate change. Central banks in all economies will likely have to play a critical role in supporting the financing of fiscal operations, particularly in a post-COVID-19 world ( high confidence). Instruments and institutional arrangements for better international monetary policy coordination will likely be necessary in the context of growing external debt stress and negative credit rating pressures facing both emerging and low-income countries. Central bankers have started examining the implications of disruptive risks of climate change, as part of their core mandate of managing the stability of the financial system (Chenet et al. 2021). Climate-related risk assessments and disclosure, including central banks’ stress testing of climate change risks, can be considered as a first step (Rudebusch 2019), although such risk assessments and disclosure may not be enough by themselves to spur increased institutional low-carbon climate finance (Ameli et al. 2020).
Green quantitative easing (QE) is now being examined as a tool for enabling climate investments (Dafermos et al. 2018) in which central banks could explicitly conduct a programme of purchases of low-carbon assets (Aglietta et al. 2015). A green QE programme ‘would have the benefit of providing large amounts of additional liquidity to companies interested’ in green projects (medium confidence) (Campiglio et al. 2018). Green QE would have positive effects for stimulating a low-carbon transition, such as accelerating the development of green bond markets (Hilmi et al. 2021), encouraging investments and banking reserves, and reducing risks of stranded assets, while it might increase income inequality and financial instability (Monasterolo and Raberto 2017). While the short-term effectiveness would not be substantial, the central bank’s purchase of green bonds could have a positive effect on green investment in the long run (Dafermos et al. 2018). However, the use of green QE needs to be cautious on potential issues, such as undermining the central bank’s independence, affecting the central bank’s portfolio by including green assets with poor financial risk standards, and potential regulatory capture and rent-seeking behaviours (Krogstrup and Oman 2019).
Additional monetary policies and macroprudential financial regulation may facilitate the expected role of carbon pricing on boosting low-carbon investments (medium confidence) (D’Orazio and Popoyan 2019). Commercial banks may not respond to the price signal and allocate credits to low-carbon investments due to the existence of market failure (Campiglio 2016). This could support the productivity of green capital goods and encourage green investments in the short term, but might cause financial instability by raising non-performing loans ratio of dirty investments and creating green bubbles (Dunz et al. 2021). Financial supervisors needs to implement stricter guidelines to overcome the greenwashing challenges (Caldecott 2020).
Efficient financial markets and financial regulation. An influential efficient financial markets hypothesis (Fama 1970, 1991, 1997) proceeds from the assumption that in well-developed financial markets, available information at any point of time is already well captured in capital markets with many participants. Despite increasing challenges to the theory (Sewell 2011), especially by repeated episodes of global financial crashes and crises, and other widely noted anomalies, a weaker form of the efficient markets hypothesis may still apply (medium confidence). It is arguable that accumulating scientific evidence of climate impacts is being accompanied by rising levels of climate finance. Banks and institutional investors are also progressively rebalancing their investment portfolios away from fossil fuels and towards low-carbon investments (IEA 2019b; Monasterolo and de Angelis 2020). In the meantime, the world runs the risk of sharp adjustments, crises and irreversible ‘tipping points’ (Lontzek et al. 2015) sufficiently destabilising climate outcomes. This leads to the policy prescription towards financial regulatory agencies requiring greater and swifter disclosure of information about rising climate risks faced by financial institutions in projects and portfolios and central bank attention to systemic climate risk problems as one possible route of policy action (Carney 2015; Dietz et al. 2016; Zenghelis and Stern 2016; Campiglio et al. 2018). However, disclosure requirements of risks and information in private settings remain mostly voluntary and difficult to implement (Battiston et al. 2017; Monasterolo et al. 2017).
Nevertheless, financial markets are innovating in search of solutions (Section 15.6.6). Recognising and dealing with stranded fossil fuel assets is also a key area of growing concern that financial institutions are beginning to grapple with. Larger institutions with more patient capital (pensions, insurance) are also increasingly beginning to enter the financing of projects and green bond markets. The case for efficient financial markets in developing countries is worse (Abbasi and Riaz 2016; Hong et al. 2019) because of weaker financial institutions (Hamid et al. 2017), heightened credit rationing behaviour (Bond et al. 2015), and high risk aversion as most markets are rated as junk, or below/barely investment grade (Hanusch et al. 2016). Other constraints such as limited long-term financial instruments and underdeveloped domestic capital markets, absence of significant domestic bond markets for investments other than sovereign borrowing, and inadequate term and tenor of financing, make the efficient markets thesis practically inapplicable for most developing countries.
Markets, finance and creative destruction. Branches of macro-innovation theory could be grouped into two principal classes (Mercure et al. 2016): ‘equilibrium – optimisation’ theories that treat innovators as rational perfectly informed agents and reaching equilibrium under market price signals; and ‘non-equilibrium’ theory where market choices are shaped by history and institutional forces and the role of public policy is to intervene in processes, given a historical context, to promote a better outcome or new economic trajectory. The latter suggests that new technologies might not find their way to the market without price or regulatory policies to reduce uncertainty on expected economic returns. A key issue is the perception of risk by investors and financial institutions. The financial system is part of complex policy packages involving multiple instruments (cutting subsidies to fossil fuels, supporting clean energy innovation and diffusion, levelling the institutional playing field and making risks transparent) (Polzin 2017) and the needed big systemic push (Kern and Rogge 2016) requires it takes on the role of ‘institutional innovation intermediaries’ (Polzin et al. 2016).
As far as climate finance is concerned, public R&D support had large cross-border knowledge spill-overs indicating that openness to trade was important, capacity expansion had positive effects on learning-by-doing on innovation over time, and that feed-in-tariffs (FiTs), in particular, had positive impacts on technology diffusion (Grafström and Lindman 2017) (Box 16.4). The FiTs programme has been associated with rapid increase in early renewables capacity expansion across the world by reducing market risks in financing and stability in project revenues (Menanteau et al. 2003; Jacobsson et al. 2009) (Section 9.9.5). Competitive auctions where the bidder with the lowest price or other criteria is selected for government’s call for tender are increasingly being utilised as an alternative to FITs due to their strengths of flexibility, potential for real price discovery, ability to ensure greater certainty in price and quantity, and capability to guarantee commitments and transparency (IRENA and CEM 2015).
Outside of renewable energy, scattered but numerous examples are available on the role of innovative public policy to spur and create new markets and technologies (Arent et al. 2017): (i) proactive role of the state in energy transitions (e.g., the retirement of all coal-fired power plants in Ontario, Canada, between 2007 and 2014 (Kern and Rogge 2016; Sovacool 2016)); (ii) too early exit and design problems not considering the market acceptability and financing issues (e.g., energy-efficient retrofitting in housing in UK (Rosenow and Eyre 2016), low or negative returns in reality versus engineering estimates in weatherisation programmes in US (Fowlie et al. 2018)); and (iii) energy performance contracting for sharing the business risks and profits and improving energy efficiency (energy service companies (Bertoldi and Boza-Kiss 2017; Qin et al. 2017) and utility energy service contracts in the USA (Clark 2018)).
Crowding out. Literature has discussed the risks of low effectiveness of public interventions and of a crowding out effect of climate-targeted public support to other innovation sectors (Buchner et al. 2013). However, much academic literature suggests no strong evidence of crowding out. (Deleidi et al. 2020). Examining the effect of public investment on private investment into renewables in 17 countries over 2004–2014, showed that the concept of crowding out or in does not apply well to sectoral studies and found that public investments positively support private investments in general.
Support climate action via carbon pricing, taxes, and emission trading systems. Literature and evidence suggest that futures markets regarding climate are incomplete because they do not price in externalities (Scholtens 2017). As a result, low-carbon investments do not take place to socially and economically optimal levels, and the correct market signals would involve setting carbon prices high enough or equivalent trading in reduced carbon emissions by regulatory action to induce sufficient and faster shift towards low-carbon investments ( high confidence) (Aghion et al. 2016). Nonetheless, durable carbon pricing in economic and political systems must be implemented and approached combining related elements to both price and quantity (Grubb 2014).
The introduction of fiscal measures, such as carbon taxes, or market-based pricing, such as emission trading schemes, to reflect carbon pricing have benefits and drawbacks that policymakers need to consider, taking account of both country-specific conditions and policy characteristics. Carbon tax can be a simpler and easier way to implement carbon pricing, especially in developing countries, because countries can utilise the existing fiscal tools and do not need concrete enabling conditions as market-based frameworks ( high confidence). The reallocation of revenues from carbon taxes can be used for low-carbon investments, supporting poorer sections of society and fostering technological change (High-Level Commission on Carbon Prices 2017). In combination with other policies, such as subsidies and public R&D on resource-saving technologies, properly designed carbon taxes can facilitate the shift towards low-carbon, resource-efficient investments (Bovari et al. 2018; Naqvi and Stockhammer 2018; Dunz et al. 2021) (Section 9.9.3). The effectiveness of carbon pricing has been supported by various evidence. EU ETS has cut emissions by 42.8% in the main sectors covered (European Commission 2021a), and China had achieved emissions reductions and energy conservation through its pilot ETS between 2013 and 2015 (Zhang et al. 2019; Hu et al. 2020). Institutional learning, administrative prudence, appropriate carbon revenue management and stakeholder engagement are key ingredients for successful ETS regimes (Narassimhan et al. 2018).
The presence of carbon prices can promote low-carbon technologies and investments (Best and Burke 2018), and price signals, including carbon taxation, provide powerful and efficient incentives for households and firms to reduce CO2 emissions (IMF 2019). The expansion of carbon prices is dependent on country-specific fiscal and social policies to hedge against regressive impacts on welfare, competitiveness, and employment (Michaelowa et al. 2018). Such impacts need to be offset using the proceeds of carbon taxes or auctioned emission allowances to reduce distortive taxation (Bovenberg and de Mooij 1994; Goulder 1995; de Mooij 2000; Chiroleu-Assouline and Fodha 2014) and fund compensating measures for the population sections that are most adversely impacted (Combet et al. 2010; Jaccard 2012; Klenert et al. 2018). This is more difficult for developing countries with a large share of energy-intensive activities, fossil fuel exporting countries and countries which have lower potential to mitigate impacts due to lower wages or existing taxes (Lefèvre et al. 2018).
Non-carbon price instruments, such as market-oriented regulation and public programmes involving low-carbon infrastructure, may be preferable in developing countries where market and regulatory failure and political economy constraints are more prevalent (Finon 2019). While carbon pricing was suggested by many economists and researchers (Nordhaus 2015; Pahle et al. 2018), overcoming the political and regulatory barriers would be necessary for the further implementation of an effective carbon pricing scheme nationally and internationally. Without strong political support, the effectiveness of carbon pricing would be limited to least-cost movements (Meckling et al. 2015).
Role of domestic financing sources. Efforts to address climate change can be scaled up through the mobilisation of domestic funds (Fonta et al. 2018). Publicly organised and supported low-carbon infrastructures through resurrected national development banks may be justified (Mazzucato and Penna 2016). It is important to efficiently allocate the public financing, and State Investment Banks (SIBs) can take up key roles (i) to provide capital to assist with overcoming financial barriers, (ii) to signal and direct investments towards green projects, and (iii) to attract private investors by taking up a de-risking role. Also, they can become a first mover by investing in new and innovative technologies or business models (Geddes et al. 2018). State-owned enterprises (SOEs) can also have an overall positive effect on renewables investments, outweighing any effect of crowding out private competitors (Prag et al. 2018). Green investment banks can assist in the green transition by developing valuable expertise in implementing effective public interventions to overcome investment barriers and mobilise private investment in infrastructure (OECD 2015c). De-risking measures may reduce investment risks, but lacking research and data availability hinders designing such measures (Dietz et al. 2016). Local governments’ efforts to de-risk by securitisation might have negative effects by narrowing the scope for a green developmental state and encouraging privatisation of public services (Gabor 2019).
The potential role of coordinated multilateral initiatives. There is a growing awareness of the low leverage ratio of public to private capital in climate blended finance (Blended Finance Taskforce 2018b) and of a ‘glass ceiling’, caused by a mix of agencies’ inertia and perceived loss of control over the use of funds, on the use of public guarantees by MDBs to increase it ( high confidence) (Gropp et al. 2014; Schiff and Dithrich 2017; Lee et al. 2018). Many proposals have emerged for multilateral guarantee funds: Green Infrastructure Funds (de Gouvello and Zelenko 2010; Studart and Gallagher 2015), Multilateral Investment Guarantee Agency (Enhanced Green MIGA) (Déau and Touati 2018), guarantee funds to bridge the infrastructure investment gap (Arezki et al. 2016), and multi-sovereign guarantee mechanisms (Dasgupta et al. 2019). The obstacle of limited fiscal space for economic recovery and climate actions in low-income and some emerging economies can be overcome only in a multilateral setting. Several multilateral actions are being envisaged: G20’s suspension of official bilateral debt payments, IMF’s adoption of new SDRs allocation (IMF 2021b). However, any form of unconventional debt relief will generate development and climate benefits only if they credibly target bridging the countries’ infrastructure gap with low-carbon climate-resilient options.
Of interest in multilateral settings is a credibility-enhancing effect provided by reciprocal gains for both the donor and the host country. Guarantor countries can compensate the public cost of their commitments with the fiscal revenues of induced exports. As to the host countries, they would benefit from new capital inflows and the grant equivalents of reduced debt service which might potentially go far beyond USD100 billion yr –1 (Hourcade et al. 2021a). A second interest would be to support a learning process about agreed-upon assessment and monitoring methods using clear metrics. Developing standardised and science-based assessment methods at low transaction costs is essential to strengthen the credibility of green investments and the emergence of a pipeline of high-quality bankable projects which can be capitalised in the form of credible assets and supported with transparent and credible domestic spending. Multi-sovereign guarantees would provide a quality backing to developing countries and allow for expanding developing countries’ access to capital markets at a lower cost and longer maturities, overcome the Basel III’s liquidity impediment and the EU’s Solvency II directive on liquidity (Blended Finance Taskforce 2018b), and accelerate the recognition of climate assets by investors seeking safe investment havens (Hourcade et al. 2021b). They would also strengthen the efficacy of climate disclosure through high grades climate assets and minimise the risks of ‘greening’ of the portfolios by investing in ‘carbon neutral’ activities and not in low-carbon infrastructures. Finally, they would free up grant capacities for SDGs and adaptation that mostly involve non-marketable activities by crowding in private investments for marketable mitigation activities.
15.6.2.1The Public-Private and Mobilisation Narrative and Current Initiatives
Financing by development finance institutions and development banks aims to address market failures and barriers related to limited access to capital as well as provide direct and indirect subsidisation by accepting higher risk, longer loan tenors and/or lower pricing. Many development and climate projects in developing and emerging countries have traditionally been supported with concessional loans by development finance institutions and/or international financial institutions (DFIs/IFIs). With an increasing number of sectors becoming viable and increasing complaints of private sector players with regard to crowding out (Bahal et al. 2018), a stronger separation and crowding in of commercial financing at the project/asset level is targeted. MDBs and IFIs were crucial for opening and growth in the early years of the green bonds, which represent a substantial share of issuances (CBI 2019a). Drivers of an efficient private sector involvement are stronger incentives to have projects delivered on time and in budget as well as market competition (Hodge et al. 2018). It remains key that the private sector mobilisation goes hand in hand with institutional capacity building as well as strong sectoral development in the host country, as a strong, knowledgeable public partner with the ability to manage the private sector is a dominating success factor for public-private cooperation (WEF 2013; Yescombe 2017; Hodge et al. 2018).
Limited research is available on the efficiency of mobilisation of the private sector at the various levels and/or the theory of change attached to the different approaches as applied in classical public-private partnerships. Also, transparency on current flows and private involvement at the various levels is limited with no differentiation being made in reporting (e.g., GCF co-financing reporting). Limited prioritisation and agreement on prioritisation of sectors and/or project categories being ready and/or preferred for direct private sector involvement might become a challenge in the coming years ( high confidence) (Sudmant et al. 2017a; Sudmant et al. 2017b).
Public guarantees have been increasingly proposed to expand climate finance, especially from the private sector, with scarce public finance, by reducing the risk premium of the low-carbon investment opportunities (de Gouvello and Zelenko 2010; Emin et al. 2014; Studart and Gallagher 2015; Schiff and Dithrich 2017; Lee et al. 2018; Steckel and Jakob 2018). They have the advantage of a broad coverage including the ‘macro’ country risks and to tackle the up-front risks during the preparation, bidding and development phases of the project lifecycle that deter project initiators, especially for capital-intensive and immature options. Insurances are also powerful de-risking instruments (Déau and Touati 2018) but they entitle the issuer to review claims concerning events and cannot cope with up-front costs. Contractual arrangements like power purchase agreements are powerful instruments to reduce market risks through a guaranteed price but they weigh on public budgets. Risk-sharing that brings together public agencies, firms, local authorities, private corporates, professional cooperatives, and institutional financiers can reduce costs (UNEP 2011), and support the deployment of innovative business models (Déau and Touati 2018). Combined with emission taxes they can contribute to reducing credit rationing of immature and risky low-carbon technologies (Haas and Kempa 2020).
Box 15.5 | The Role of Enabling Environments for Decreasing Economic Cost of Renewable Energy
A widely used indicator for the relative attractiveness of renewable energy but also development of price levels is the levelised cost of energy (LCOE). It is applied by a wide range of public and private stakeholders when tracking progress with regard to cost degression (Aldersey-Williams and Rubert 2019). LCOE calculation methodologies vary but in principle consider project-level costs only (NEA 1989). Besides other weaknesses, the LCOE concept usually does not consider societal costs resulting from de-risking instruments and/or other public interventions/support and therefore caution has to be applied when using the LCOE as the sole indicator of the success of enabling environments. The yearly IRENA mapping on renewable energy auction results demonstrates the extremely broad ranges of LCOEs (equal to the agreed tariffs) for renewable energy which can be observed (IRENA 2019a). For example, in 2018, solar PV LCOEs for utility-scale projects came in between USD0.04 kWh –1 and USD0.35 kWh –1 with a global weighted average of USD0.085 kWh –1. However, comparative analysis taking into account societal costs is hardly available driven by challenges in the context of the quantification of public support.
The GET FiT concept argued that the mitigation of political and regulatory risk by sovereign and international guarantees is cost-efficient in developing countries, illustrating the estimated impact of such risk-mitigation instruments on equity and debt financing costs, and consequently required feed-in tariff levels (Deutsche Bank Climate Change Advisors 2011). The impact of financing costs on cost of renewable energy generation is well researched with significant differences across countries and technologies being observed, with major drivers being the regulatory framework as well as the availability and type of public support instruments (Geddes et al. 2018; Steffen 2019). With a focus on developing countries and based on a case study in Thailand Huenteler et al. (2016) demonstrate the significant effect of regulatory environments but also local learning and skilled workforce on cost of renewables. The effect of those exceeds the one of global technology learning curves.
Egli et al. (2018) identify macroeconomic conditions (general interest rate) and experience effects within the renewable energy finance industry as key drivers in developed countries with a stable regulatory environment, contributing 5% (PV) and 24% (wind) to the observed reductions in LCOEs in the German market with a relatively stable regulatory environment. They conclude that ‘extant studies may overestimate technological learning and that increases in the general interest rate may increase renewable energies’ LCOEs, casting doubt on the efficacy of plans to phase out policy support’ (Egli et al. 2018). A rising general interest rate level could heavily impact LCOEs – for Germany, a rise of interest rates to pre-financial crisis levels in five years could increase LCOEs of solar and wind by 11–25% respectively (Schmidt et al. 2019).
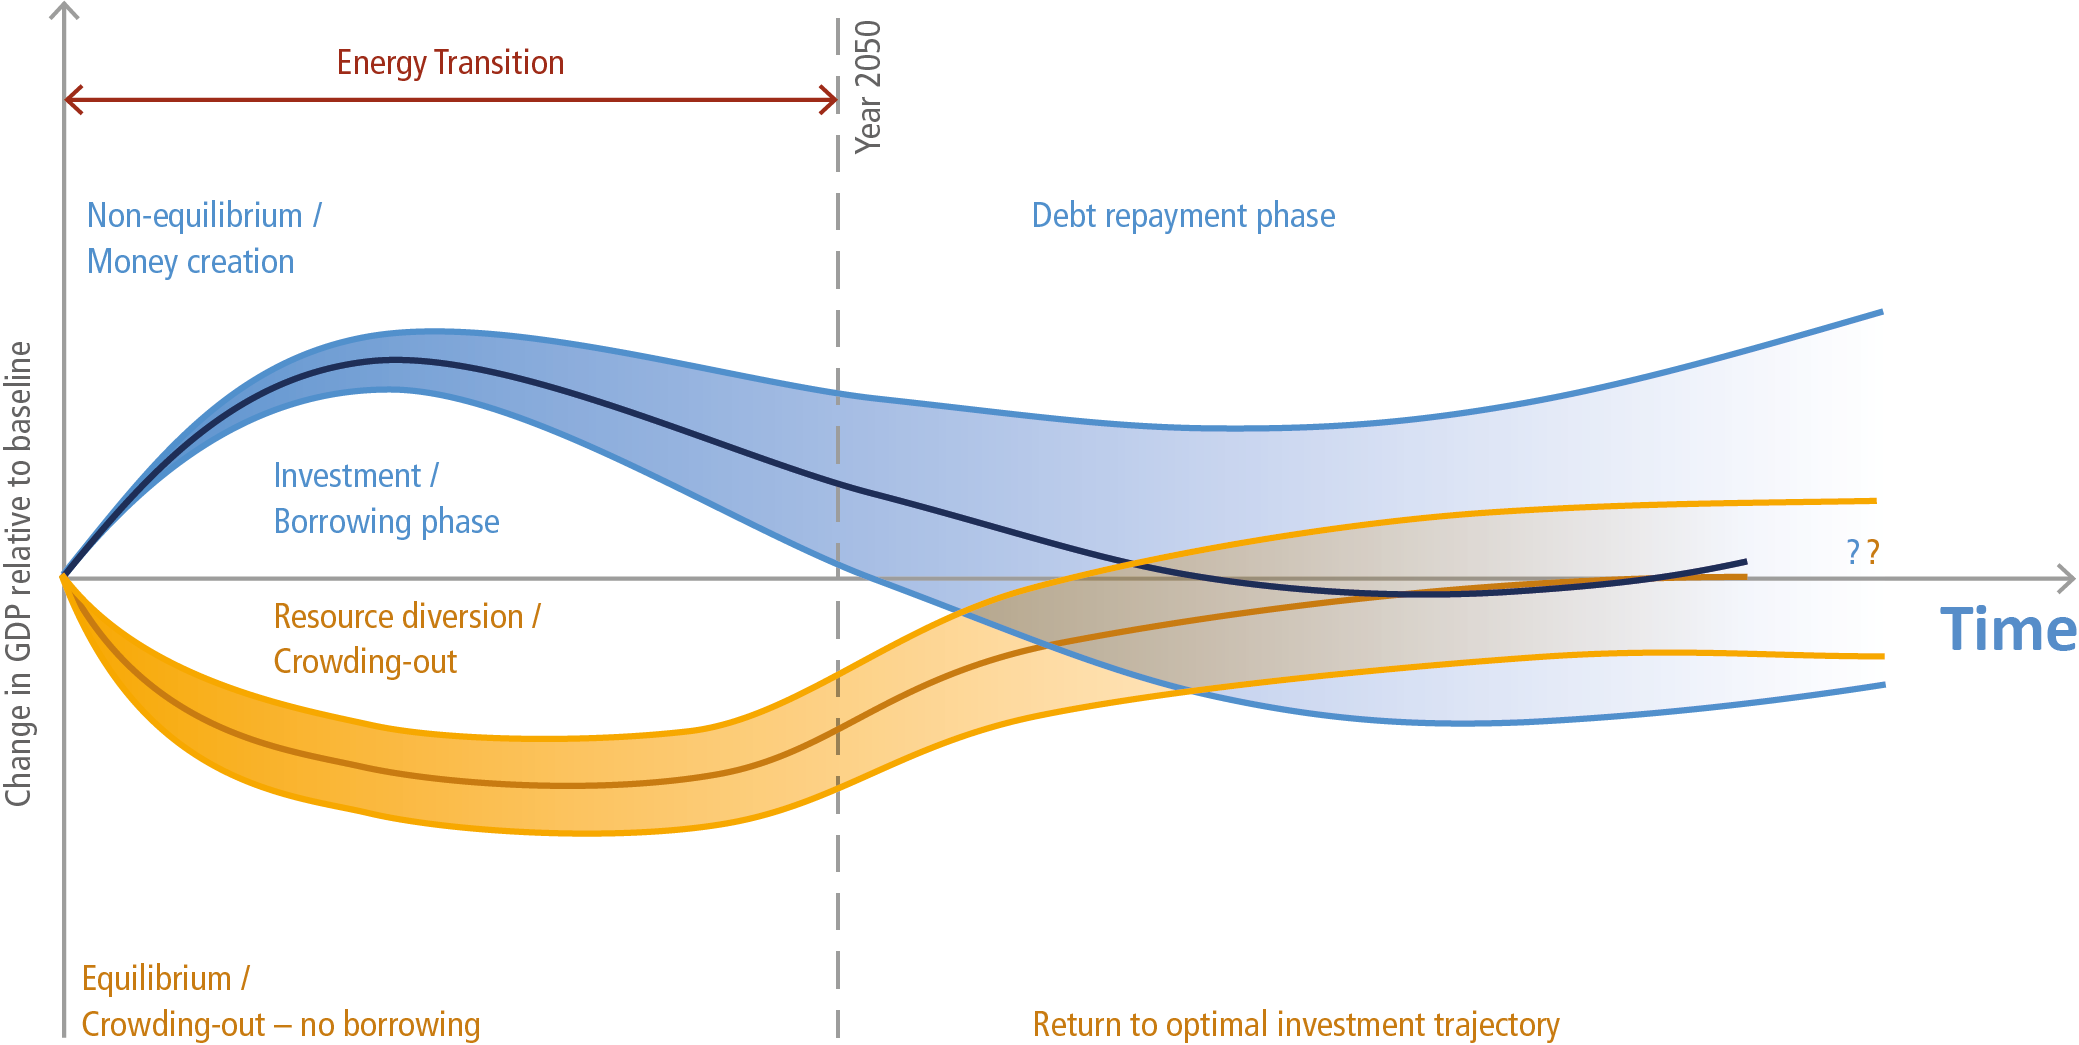
Box 15.6, Figure 1 | Two worlds – energy transition outcomes under alternative model assumptions (Keynesian vs General Equilibrium). Source: Mercure et al. (2019).
15.6.3Considerations on Availability and Effectiveness of Public Sector Funding
The gap analysis as well as other considerations presented in this chapter illustrate the critical role of increased volumes and efficient allocation of public finance to reach the long-term global goals, both nationally and internationally.
Higher public spending levels driven by the impacts of COVID-19 and related recovery packages. Higher levels of public funding represent a massive chance but also a substantial risk. A missing alignment of public funding and investment activity with the Paris Agreement (and Sustainable Development Goals) would result in significant carbon lock-ins, stranded assets and thus increase transition risks and ultimately economic costs of the transition ( high confidence). Using IMF data for stimulus packages, Andrijevic et al. (2020) estimated that COVID-19-related fiscal expenditure had surpassed USD12 trillion by October 2020 (80% in OECD countries), a third of which being spent in liquidity support and health care. Total stimulus pledged to date is ten times higher than low-Paris-consistent carbon investment needs from 2020–2024 (Andrijevic et al. 2020; Vivid Economics 2020). Overall, stimulus packages launched include USD3.5 trillion to sectors directly affecting future emissions, with overall fossil fuel investment flows outweighing low-carbon technology investment (Vivid Economics 2020).
Lessons from the global financial crises show that although deep economic crises create a sharp short-term emission drop, and green stimulus is argued to be the ideal response to tackle both the economic and the climate crises at once, disparities between regional strategies hinder the low-carbon transition ( high confidence). Indeed, inconsistent policies within countries can also counterbalance emission reductions from green stimulus, as well as a lack of transparency and green spending pledged not materialising (Jaeger et al. 2020). Also, aggressive monetary policy as a response to the global financial crisis, including quantitative easing that did not target low-carbon sectors, has been heavily criticised (Jaeger et al. 2020). The COVID-19 crisis recovery, in contrast, benefits from developments which have taken place since, such as an emerging climate-risk awareness from the financial sector, reflected in the call from the Coalition of Finance Ministers for Climate Action (Coalition of Finance Ministers for Climate Action 2020), which unites 50 countries’ finance ministers, for a climate-resilient recovery.
The steep decrease in renewable electricity costs since 2010 also represents a relevant driver for a low-carbon recovery (Jaeger et al. 2020). Many more sectors are starting to show similar opportunities for rapid growth with supportive public spending such as low-carbon transport and buildings (IEA 2020d). Expectations that the package will increase economic activity rely on the assumption that increased credit will have a positive effect on demand, the so-called demand-led policy (Mercure et al. 2019). Boosting investment should propel job creation, increasing household income and therefore demand across economic sectors ( high confidence). A similar plan has also been proposed by the US administration and the European Union through the Next Generation EU (European Council 2020).
Nevertheless, three uncertainties remain. First, only those countries and regions with highest credit-ratings (AAA or AA) with access to deep financial markets and excess savings will be able to mount such counter-cyclical climate investment paths, typically high-income developed economies ( high confidence). In more debt constrained developing countries lower access to global savings pools because of higher risk perceptions and lower credit ratings (BBB or less), exacerbated by COVID-19, are already leading to credit downgrades and defaults (Koseet al. 2020) and have long tended to be fiscally pro-cyclical (McManus and Ozkan 2015). These include the general class of virtually all major emerging and especially low-income developing countries, to which such demand-stimulating counter-cyclical climate-consistent borrowing path is likely . To access such funds, these countries would need globally coordinated fiscal policy and explicit supporting cross-border instruments, such as sovereign guarantees, strengthening local capital markets and boosting the USD100 billion annual climate finance commitment (Dasgupta et al. 2019).
Second, a strong assumption is that voters will be politically supportive of extended and increased fiscal deficit spending on climate on top of COVID-19-related emergency spending and governments will overcome treasury biases towards fiscal conservatism (to preserve credit ratings). However, evidence strongly suggests that voters (and credit rating agencies) tend to be fiscally conservative (Peltzman 1992; Lowry et al. 1998; Alesina et al. 2011; Borge and Hopland 2020), especially where expenditures involve higher taxes in the future and do not identifiably flow back to their local bases (the ‘public good’ problem) ( high confidence). Such mistrust has been a reason for abortive return to fiscal austerity often in the past (most recently during global financial crisis) and may benefit for political support by consistently reframing the climate expenditures in terms of job creation benefits (Bougrine 2012), effectiveness of least-cost fiscal spending on climate for reviving private activity, and the avoidance of catastrophic losses (Huebscher et, al. 2020) from higher carbon emissions. A new understanding of debt sustainability including negative implications of deferred climate investments on future GDP has not yet been mainstreamed (see more on the debt sustainability discussion below (e.g., Buhr et al. 2018; Fresnillo 2020a). In addition, implications on the availability of international public finance flows are not yet clear since current additional funding prioritises urgent health care support rather than an increase in predictable mid-/long-term financial support. Heavy investment needs for recovery packages in developed countries on the one hand and their international climate finance commitments on the other might be perceived to compete for available ‘perceived as appropriate’ budgets.
Box 15.6 | Macroeconomics and Finance of a Post-COVID-19 Green Stimulus Economic Recovery Path
Financial history suggests that capital markets may be willing to accommodate extended public borrowing for transient spending spikes (Barro 1987) when macroeconomic conditions suggest excess savings relative to private investment opportunities (Summers 2015) and when public spending is seen as timely, effective and productive, with governments able to repay when conditions improve as economic crisis conditions abate ( high confidence). A surge in global climate mitigation spending in the post-pandemic recovery may be an important opportunity, which global capital markets are signalling (Global Investor Statement 2019). The standard ‘neo-classical’ macroeconomic model is often used in integrated energy-economy-climate assessments (Balint et al. 2016; Nordhaus 2018). This class of Computable General Equilibrium (CGE) models, however, has a limited treatment of the financial sector and assumes that all resources and factors of production are fully employed, there is no idle capacity and no inter-temporal financial intermediation (Pollitt and Mercure 2018b). Investment cannot assume larger values than the sum of previously determined savings, as a fixed proportion of income. Such constraint, as stressed by Mercure et al. (2019), implies that investment in low-carbon infrastructure, under the equilibrium assumptions, necessarily creates a (neo-Ricardian) crowding-out effect that contracts the remaining sectors. Box 15.6, Figure 1 shows the implications (in the red-shaded part of Figure 1).
Post-Keynesian demand-side macroeconomic models, with financial sectors and supply-side effects, in contrast, allow for the reality of non-equilibrium situations: persistent short- to medium-term underemployed economy-wide resources and excess savings over investment because of unexpected shocks, such as COVID-19. In these settings, economic stimulus packages allow a faster recovery with demand-led effects: ‘Economic multipliers are near zero when the economy operates near capacity. In contrast, during crises such as the GFC, economic multipliers can be high’ (Blanchard and Leigh 2013; Hepburn et al. 2020b). The expected results are opposite to the standard supply-led equilibrium models as a response to investment stimulus (the green-shaded part of Box 15.6, Figure 1), as intended by ‘green-stimulus’ packages such as proposed by the EU (Balint et al. 2016; Mercure et al. 2019).
Even if demand-led models work better in depressions, the question nevertheless is whether the additional public borrowing for such ‘green stimulus’ can be undertaken by market borrowings given already high public debt levels and recovered in the future from taxes as the economy revives. The results of recent macroeconomic modelling work (Liu et al. 2021) represented by 10 major countries/regions suggests answers. It uses a non-standard macroeconomic framework, with Keynesian features such as financial and labour market rigidities and fiscal and monetary rules (McKibbin and Wilcoxen 2013). First, a global ‘green stimulus’ of about an average of 0.8% of GDP annually in additional fiscal spending between 2020–30 would be required to accelerate the emissions reduction path required for a 1.5°C transition. Second, such a stimulus would also accelerate the global recovery by boosting GDP growth rates by about 0.6% annually during the critical post-COVID period. Third, the optimal tax policy would be to backload the carbon taxes to later in the macroeconomic cycle, both because this would avoid dampening near-term growth while pre-announced carbon tax plans would incentivise long-term private energy transition investment decisions today and provide neutral borrowing. This macroeconomic modelling path thus replicates the ‘green stimulus’ impacts expected in theory (Box 15.6, Figure 1). There are also some other additional features of the modelled proposal: (i) fiscal stimulus – needed in the aftermath of the pandemic – can be an opportunity to boost green and resilient public infrastructure; (ii) green research and development ‘subsidies’ are feasible to boost technological innovations; and (iii) income transfers to lower income groups are necessary to offset negative impacts of rising carbon taxes.
Substantial effects of the COVID-19 pandemic, which is relatively unique in its public health impacts when combined with the consequences of deep economy-wide shocks (economic downturn, public finances, and debt), are expected to last for decades even in the absence of no significant future recurrence. A scenario where the pandemic recurs mildly every year for the foreseeable future further hinders GDP and investment recovery, where growth is unlikely to rebound to previous trajectories, even within OECD economies (McKibbin and Vines 2020) and with worse effects in developing regions. History is strongly supportive: studies on the longevity of pandemics’ impacts indicate significant macroeconomic effects persisting for decades, with depressed real rates of return, increased precautionary savings (Jordà et al. 2020), unemployment (Rodríguez-Caballero and Vera-Valdés 2020) and social unrest (Barrett and Chen 2021). The direct effect on emissions is likely to be a small reduction from previous trajectories, but the longer-lasting impacts are more on the macroeconomic-finance side. Pandemic responses have increased sovereign debt across countries in all income bands (IMF 2021e). However, its sharp increase in most developing economies and regions has caused debt distress (Bulow et al. 2021), widening the gap in developing countries’ access to capital (Hourcade et al. 2021b). While strong coordinated international recovery strategies with climate-compatible economic stimulus is justified (Barbier 2020; Barbier and Burgess 2020; IMF 2020c; Le Quéré et al. 2021; Pollitt et al. 2021), national recovery packages announced do not show substantial alignment with climate goals (D’Orazio 2021; Hourcade et al. 2021b; Rochedo et al. 2021; Shan et al. 2021). Contradictory post-COVID-19 investments in fossil fuel-based infrastructure may create new carbon lock-ins, which would either hinder climate targets or create stranded assets (Hepburn et al. 2020a; Le Quéré et al. 2021; Shan et al. 2021), whilst deepening global inequalities (Hourcade et al. 2021b).
Considerations on global debt levels and debt sustainability as well as implications for climate finance. The Paris Agreement marked the consensus of the international community that a temperature increase of well below 2°C needs to be achieved and the SR1.5 has demonstrated the economic viability of 1.5°C. However, in terms of increase of supply of, in particular, public finance, often the debate is still driven by the question on affordability, considerations around financial debt sustainability and budgetary constraints against the background of macroeconomic headwinds – even more in the (post-)COVID-19 world ( high confidence). The level of climate alignment of debt is hardly considered in debt-related regulation and/or debt sustainability agreements like the Maastricht Treaty ceilings (3% of GDP government deficit and 60% of GDP (gross) government debt) not considering economic costs of deferred climate action as well as economic benefits of the transformation.
Robust studies on the economic costs and benefits in the short- to long-term of reaching the LTGG exist for only few countries and/or regions, primarily in the developed world ( high confidence) (e.g. BCG 2018; McKinsey 2020a). With many studies underpinning the strong economic rationale for high investments in the short-term(e.g., McKinsey 2020a), regional differences are significant highlighting the need for extensive cooperation and solidarity initiatives.
For many developing countries, the focus of debt sustainability discussions is on the negative effect of climate change on the future GDP and the uncertainty with regard to short-term effects of climate change and their economic implications ( high confidence). With long-term economic impacts of climate change being in the focus of the modelling community, the volatility of GDP in the short term driven by shocks is more difficult to analyse and requires country-specific deep-dives. IPCC scenario data is often not sufficient to perform such analysis with additional assumptions being needed (Acevedo 2016). For debt sustainability analysis, these more short-term impacts are, however, a crucial driver with transparency being limited to the significance of climate-related revision of estimates. The latter might result in a continued overestimation of future GDP as happened in the past, increasing the vulnerability of highly indebted countries (Guzman 2016; Mallucci 2020). While climate change considerations have already impacted country ratings and debt sustainability assessments (and financing costs), it is unclear whether current GDP forecasts are realistic. The review of the IMF debt sustainability framework leads to a stronger focus on vulnerability rather than only income thresholds when deciding upon eligibility for debt relief and/or concessional resources (Mitchell 2015), which could become a mitigation factor for the challenge described before.
Debt levels globally but particularly in developing and vulnerable countries have significantly increased over the past years with current and expected climate change impacts further burdening debt sustainability ( high confidence). For low- and middle-income countries, 2018 marked a new peak of debt levels amounting to 51% of GDP; between 2010 and 2018, external debt payments as a percentage of government budget grew by 83% in low- and middle-income countries, from an average of 6.71% in 2010 to an average of 12.56% in 2018 (Fresnillo 2020b). COVID-19 has further reduced the fiscal space of many developing governments and/or increased the likelihood of debt stress. With many vulnerable countries already being burdened with higher financing costs, this limited fiscal space further shrinks their ability to actively steer the required transformation (Buhr et al. 2018). Limited progress in increasing debt transparency remains another burden (Section 15.6.7).
Considering the need for responses to both short-term liquidity issues and long-term fiscal space, current G20/IMF/World Bank debt service suspension initiatives are focused on the liquidity issue rather than underlying problems of more structural nature of many low-income countries (Fresnillo 2020a). In order to ensure fiscal space for climate action in the coming decade, a mix between debt relief, deferrals of liabilities, extended debt levels and sustainable lending practices including new solidarity structures need to be considered in addition to higher levels of bilateral and multilateral lending to reduce dependency on capital markets and to bridge the availability of sustainably structured loans for highly vulnerable and indebted countries. More standardised debt-for-climate swaps, a higher share of GDP-linked bonds or structures ensuring (partial) debt cancellation in case countries are hit by physical climate change impacts/shocks appear possible. The ‘hurricane’ clause introduced by Grenada, or wider natural disaster clauses provide issuers with an option to defer payments of interest and principal in the event of a qualifying natural disaster and can reduce short-term debt stress (UN Addis Ababa Action Agenda Art. 102) (UN 2015 a). A mainstreaming of such clauses has been pushed by various international institutions. The collective action clause might be a good example of a loan/debt term which became market standard. Definition of triggers is likely the most complex challenge in this context.
The use of debt-for-nature and debt-for-climate-swaps is still very limited and not mainstreamed but offers significant potential if used correctly ( highconfidence).
An increasing number of debt-for-climate/nature swaps have been seen in recent years applied primarily in international climate cooperation and in bilateral contexts, however, not (yet) to an extent addressing severe and acute debt crises (Essers et al. 2021; Volz et al. 2021) offering significant potential if used correctly (Warland and Michaelowa 2015). Significant lead times, needs-based structuring, transparency with regard to the additionality of financed climate action, uncertainty with regard to own resource constraints and ODA accountability remain as barriers for a massive scale-up needed to make transactions relevant (Mitchell 2015; Fuller et al. 2018; Essers et al. 2021). At the same time, the limitation of the use of debt-based instruments as a response to climate-related disasters and counter-cyclical loans might be necessary (Griffith-Jones and Tyson 2010).
Ensuring efficient debt restructuring and debt relief in events of extreme shocks and imminent over-indebtedness and sovereign debt default are further crucial elements with a joint responsibility of debtors and creditors (UN 2015 a). In this context, the Commonwealth Secretariat flagged that the diversification of the lender portfolio made debt restructuring more difficult with more and more heterogeneous stakeholders being involved (Mitchell 2015) and the UN AAAA raising concerns about non-cooperative creditors and disruption of timely completion of debt restructuring (UN 2015 a). This is a side effect of a stronger use of capital markets, which needs to be carefully considered in the context of sovereign bond issuances (Section 15.6.7).
Stranded assets. The debate around stranded assets focuses strongly on the loss of value to financial assets for investors (Section 15.6.1), however, stranded assets and resources in the context of the transition towards a low-emission economy ‘are expected to become a major economic burden for states and hence the tax payers’ ( high confidence) (EEAC 2016). Assets include not only financial assets but also infrastructure, equipment, contracts, know-how, jobs as well as stranded resources (Bos and Gupta 2019). Besides financial investors and fiscal budgets, consumers remain vulnerable to stranded investments. Against the background of the frequent simultaneousness of losses occurring for financial investors on the one hand and negative employment effects as well as regional development and fiscal effects on the other hand, negotiations about compensations and public support to compensate for negative effects of phasing out of polluting technologies often remain interlinked and compensation mechanisms and related redistribution effects untransparent.
Recent phase-out deals tend to aim for (partial or full) compensation rather than no relief for losses. In contrast to the line of argument in the tobacco industry, the backward-looking approach and a resulting obligation of compensation by investors in polluting assets can be observed rarely with the forward-looking approach of compensations by future winners for current losers dominating – despite the high level of awareness about carbon externalities and resulting climate change impacts among polluters for many years (van der Ploeg and Rezai 2020). In particular, transactions in the energy sector show a high level of investor protection also against much needed climate action which is also well illustrated by the share of claims settled in favour of foreign investors under the Energy Charter Treaty and investor-state dispute settlement (Bos and Gupta 2019).
Late government action can delay action and consequently strengthen the magnitude of action needed at a later point in time with implications for employment and economic development in impacted regions requiring higher level of fiscal burden ( high confidence). This has also been considered in the context of global climate cooperation with prolonged support for polluting infrastructure resulting in heavy lock-in effects and higher economic costs in the long run (Bos and Gupta 2019). Despite a significant share of fossil resources which need to become stranded in developing countries to reach the LTGG, REDD+ remains a singular example for international financial cooperation in the context of compensation for stranded resources.
15.6.4Climate Risk Pooling and Insurance Approaches
Since 2000, the world has been experiencing significant increase in economic losses and damages from natural disasters and weather perils such as tropical cyclones, earthquakes, flooding and drought. Total global estimate of damage is about USD4210 billion, 2000–2018 (Aon Benfield UCL Hazard Research Centre 2019). The largest portion of this is attributed to tropical cyclones (USD1253 billion), followed by flooding (USD914 billion), earthquakes (USD757 billion) and drought (approximately USD372 billion, or about USD20 billion yr –1 losses) (Aon Benfield UCL Hazard Research Centre 2019). In the period 2017–2018, natural catastrophe losses totalled approximately USD219 billion (Bevere 2019). According to the National Oceanic and Atmospheric Administration, 14 weather and climate disasters cost USD91 billion in 2018 (NOAA NCEI 2019). The European Environment Agency reports that ‘disasters caused by weather and climate-related extremes accounted for some 83% of the monetary losses over the period 1980–2017’ for EU Member States (EU-28) and that ‘weather and climate-related losses amounted to EUR426 billion (at 2017 values)’. For the EEA member countries (EEA-33), the ‘total reported economic losses caused by weather and climate-related extremes’ over the same period amounted to approximately EUR453 billion (EEA 2019). Asia Pacific and Oceania has been particularly impacted by typhoon and flooding (China, India, the Philippines) resulting in economic losses of USD58 billion, 2000–2017, and a combination of flooding, typhoon and drought totalling USD89 billion in 2018 (inclusive of loss by private insurers and government sponsored programmes (Aon Benfield UCL Hazard Research Centre 2019). Based on past historical analysis, a region such as the Caribbean, which has experienced climate-related losses equal to 1% of GDP each year since 1960, is expected to have significant increases in such losses in the future leading to possibly upwards of 8% of projected GDP in 2080 (Commonwealth Secretariat 2016). Similarly, Latin American countries, such as Argentina, El Salvador and Guatemala, experienced severe losses in agriculture totalling about USD6 billion due to drought in 2018 (Aon Benfield UCL Hazard Research Centre 2019). In the African region, where climate is projected to get significantly warmer, continuing severe drought in parts of East Africa, Tropical Cyclone Idai, had devastating economic impacts for Mozambique, Zimbabwe and Malawi (WMO 2019). According to Munich Re, loss from about 100 significant events in 2018 for Africa are estimated at USD1.4 billion (Munich Re 2019).
While there are questions about the sufficiency of insurance products to address the losses and damages of climate-related disasters, insurance can help to cover immediate needs directly, provide rapid response and transfer financial risk in times of extreme crisis ( high confidence) (GIZ 2015; Lucas 2015; Schoenmaker and Zachmann 2015; Hermann et al. 2016; Wolfrom and Yokoi-Arai 2016; Kreft and Schäfer 2017; UNESCAP 2017; Matias et al. 2018; UNECA 2018; Broberg and Hovani-Bue 2019; EEA 2019; Martinez-Diaz et al. 2019). Commercial insurability is heavily driven by the predictability of losses and the resulting ability to calculate insurance premium levels properly. Climate change has become a major factor of increasing uncertainty. The previously strong reliance on historic data in calculation of premium levels may be but a starting point given the likely need for upward adjustment due to climate change and potential consequential economic damage. Different risk perceptions between policyholders and insurers will create contrary assessments on premium levels and consequently underinsurance. McKinsey (2020b) also stresses the systemic effect of climate change on insurers’ business models and resulting availability of appropriate insurance products.
The conventional approach to such protective or hedging position has been indemnity and other classical insurance micro-, meso- and macro-level schemes (Hermann et al. 2016). These include micro insurance schemes such as index insurance and weather derivative approaches that cover individuals’ specific needs such as coverage for farm crops. Meso-level insurance schemes, which primarily benefit intermediary institutions, such as NGOs, credit unions, financial institutions and farmer credit entities, seek to reduce losses caused by credit default thereby ‘enhancing investment potential’, whereas macro-level insurance schemes ‘allow both insured and uninsured individuals to be compensated for damages caused by extreme weather events’ (Hermann et al. 2016). These macro-level insurance schemes include catastrophe bonds and weather derivatives and so on, that transfer risk to capital markets (Hermann et al. 2016). Over the last decades, there has been a trend towards weather-index insurance and other parametric insurance products based on predefined pay-out risk pooling instruments. It has gained favour with governments in developing regions such as Africa, the Caribbean and the Pacific because it provides certainty and predictability about funding – financial preparedness – for emergency actions and initial reconstruction and reduces moral hazard. This ‘financial resilience’ is also increasingly appealing to the business sector, particularly micro, small and medium enterprises (MSMEs), in developing countries (MEFIN Network and GI RFPI Asia 2016; Woods 2016; Schaer and Kuruppu 2018).
To date, sovereign parametric climate risk pooling as a way of managing climate risk does not seem to have much traction in developed countries and does not appear to be attractive to actors in the G20 countries. No G20 members are yet party to any climate risk pooling initiative (Kreft and Schäfer 2017). However, international bilateral donors such as the USAID and the UK Foreign, Commonwealth and Development Office (FCDO, formerly DFID), and the multilateral development banks are all, to different extent, supporters of the various climate risk pooling initiatives now operational in developing countries.
As noted also in IPCC AR5, risk sharing and risk transfer strategies provide ‘pre-disaster financing arrangements that shift economic risk from one party to another’ (IPCC 2012). Risk pooling among countries and regions is relatively advantageous when compared to conventional insurance because of the effective subsidising of ‘affected regions’ using revenues from unaffected regions which involve pooling among a large subset of countries ( high confidence) (Lucas 2015). In general, the premiums are less costly than what an individual country or entity can achieve and disbursement is rapid and there are also fewer transaction costs (Lucas 2015; World Bank 2015). The World Bank argues that the experience with the Pacific Catastrophe Risk Insurance Pilot (PCRIP) and Africa Risk Capacity risk pooling (ARC) show savings of 50% in obtaining insurance cover for pooled risk compared with purchasing comparable coverage individually (Lucas 2015; World Bank 2015; ARC 2016). However, it requires, as noted by UNESCAP, ‘extensive coordination across participating countries, and entities’ (Lucas 2015).
At the same time, this approach has substantial basis risk (actual losses do not equal financial compensation) ( high confidence) (Hermann et al. 2016). With parametric insurance, pay-outs are pre-defined and based on risk modelling rather than on-the-ground damage assessment so may be less than, equal to, or greater than the actual damage. It does not cover actual losses and damage and therefore, may be insufficient to meet the cost of rehabilitation and reconstruction. It may also be ‘non-viable’ or damaging to livelihoods in the long run (UNFCCC 2008; Hellmuth et al. 2009; Hermann et al. 2016). Additionally, if the required threshold is not met, there may be no pay-out, though a country may have experienced substantial damages from a climatic event. This occurred for the Solomon Islands in 2014 which discontinued its insurance with the Pacific Catastrophe Risk Insurance Pilot when neither its Santa Cruz earthquake nor the 2014 flash floods were eligible to receive a pay-out under the terms of the insurance (Lucas 2015).
Increasingly, climate risk insurance schemes are being blended into disaster risk management as part of a comprehensive risk management approach ( high confidence). The best-known example is the Caribbean Catastrophe Risk Insurance Facility (CCRIF SPC 2018), which involves cooperation among Caribbean states, Japan, Canada, UK and France and international organisations such as the World Bank (UNESCAP 2017). But there are growing platforms of such an approach mainly under the umbrella of the G7’s InsuResilience Initative (Deutsche Klimafinanzierung 2020), including, the Pacific Catastrophe Risk Assessment and Financing Initiative for the Pacific Islands (PCRAFI), the African Risk Capacity (ARC Agency and its financial affiliate), and the African Risk Capacity Limited (ARC Ltd/ the ARC Group) (ARC 2016) and in the Asian region, the South East Asian Disaster Risk Insurance Facility (SEADRIF) and the ASEAN Disaster Risk Financing and Insurance Program (ADRFI), (SEADRIF 2018; GIZ and World Bank 2019; Martinez-Diaz et al. 2019; Vyas et al. 2019; World Bank 2019a). The group of 20 vulnerable countries (V20) has also developed a Sustainable Insurance Facility (SIF), billed as a technical assistance facility for climate-smart 14 insurance for MSMEs in 48 developing countries aswell as potentially to de-risk renewable energy in these countries and regions (ACT Alliance 2020; V20 2020; V20 2021).
However, as noted above, climate risk pooling is not a panacea. There are very obvious and significant challenges. According to Kreft and Schäfer (2017), limitations of insurance schemes include coordination challenges, limited scope, destabilisation due to exit of one or more members as premiums rise and inadequate attention to permanence (Schaeffer et al. 2014). There are also challenges with risk diversification, replication, and scalability ( high confidence). For example, CCRIF is extending both its membership and diversifying its geographic dimensions into Central America in seeking to lower covariate risk (similar shocks among cohorts such as droughts or floods). Under the SPC portfolio, CCRIF is able to segregate risk across the regions. Risk insurance does not obviate from the need to engage in capacity building to scale-up as well as having process for addressing systemic risk. Currently, risk pools have limited sectoral reach and may cover agriculture but not other important sectors such as fisheries and public utilities. Only recently (July 2019) has CCRIF initiated coverage of fisheries with the development of its Caribbean Oceans and Aquaculture Sustainability Facility (COAST) instrument (CCRIF SPC 2019; ACT Alliance 2020). Historically, risk pool mechanisms, like CCRIF and ARC, only cover a small subset of perils, such as tropical cyclones, earthquakes and excess rainfall but do not include other perils such as drought. Since 2016, ARC has increased its scope to cover drought and in 2019 launched ARC Replica, which not only covers drought but offers premiums and coverage to NGOs and the World Food Programme through the START Network and a pastoral drought product for protecting small farmers and ensuring food security. In some regions and countries, there may also be limited access to reinsurance (Schaeffer et al. 2014; Lucas 2015). An important down-side of climate risk pooling is that it does not cover the actual cost of damage and losses. Though on the positive side, pay-out may exceed costs, but it may also be less than costs. Hence, the parametric approach is not a panacea and does not preclude having recourse to conventional indemnity insurance, which will cover full damage costs after a climate change event as it involves full on-the-ground assessment of factors such as the necessity and costs of repair versus, say, replacement value of damaged infrastructure. This may be important for governmental and publicly provided services such as schools, hospitals, roads, airports, communications equipment and water supply facilities. Given the growing popularity of parametric insurance and climate risk pooling, there are very ambitious attempts to expand this approach on several fronts (Scherer 2017). Schoenmaker and Zachmann (2015) have proposed a global climate risk pool to help the most vulnerable countries. The pathway to this includes capacity building in underdeveloped financing sectors of developing countries. They argue that as climate extremes become more normalised, they will wipe out significant parts of the infrastructure and productive capacity of developing countries. This will have knock-on impact on fiscal capacity due to lowered tax revenue and high rebuilding costs. ‘Developing countries’, Schoenmaker and Zachmann (2015) argue, ‘cannot insure against such events on a market basis, nor would it be sensible to divert scarce fiscal resources away from infrastructure investment into accumulating a financial buffer for such situations’. In that context, Schoenmaker and Zachmann (2015) call for international risk pooling as ‘the only sensible strategy’, especially if it addresses the major gaps in climate risk insurance for poor and vulnerable communities by enhancing demand through ‘smart support instrument’ for premium support such as full or partial premium subsidies and investment in providing risk reduction (Schäfer et al. 2016; Le Quesne et al. 2017; MCII 2018; Vyas et al. 2019). This, it is argued, may help to smoothen out the limited uptake of regional institutions such as ARC and CCRIF SPC, which are only in three regions of the world (with missing mechanism in South America) (Kreft and Schäfer 2017). Existing regional mechanisms, while they may perform very well, only cover a portion of climatic hazards and tend to have limited subscribers. For example, across the key four sovereign risk pools (ARC, CRIFSPC, PCRAFI and SEADRIF), though there are 68 countries only one-third or 32% have purchased coverage in 2019 and 46% ‘did not deploy disaster risk financing instruments’ (ACT Alliance 2020).
Other gaps and challenges flagged by Kreft and Schäfer (2017) include limited coverage of the full spectrum of contingency risks experienced by countries, inadequate role of risk management as a standard for all regional pools, though there are some emerging best practices in terms of data provision on weather-related risks, and incentivisation of risk reduction ( high confidence). Here, they recognise the work of Africa Risk Capacity for not only providing the infrastructure to trigger disbursement but for also promoting national risk analysis. Another important gap in the landscape of climate risk pooling is lack of attention to financial institutions’ lending portfolios that are vulnerable to weather shocks. In this regard subsidies as part of innovative financing schemes facilitated by the donor community can encourage the uptake of meso-level climate risk insurance solutions (Kreft and Schäfer 2017).
In the literature, there are two attempts at systematic evaluation or comprehensive assessment of regional climate risk pools: a comprehensive study by Scherer (2017) and FCDO’s ten-year evaluation (2015–2024). Overall, neither of these studies draw adverse conclusions about regional climate risk pooling initiatives/mechanisms. According to Scherer, ‘it appears that insurances work in principle and there is certainly success’ and ‘initial experiences demonstrate regional climate risk insurances works’. The author cited the 28 pay-outs to 16 countries of USD106 millionarguing that it provides cash-starved countries with much needed cash (Scherer 2017, p. 4). The FCDO study (Scott 2017) examines the uptake of ARC and its impact on reducing vulnerability to disasters. It notes that there is scarce literature on disaster risk insurance mechanisms in terms of impacts. In its current sample of 20 countries as of November 2017, four are projected to experience food security crisis (IPC Level 3) but are not signatories to the ARC, which may signal that ARC is not attractive to all food insecure countries and that there is no overwhelming appetite for ARC among poorer countries. Additionally, Panda and Surminski (2020) research the importance of indicators and frameworks for monitoring the performance and impact of Coalition for Disaster Resilient Infrastructure (CDRI) but make no final assessment of any of the regional climate risk pool. However, they propose mechanisms to improve the transparency and accountability of the system. Scherer (2017), Forest (2018) and Panda and Surminski (2020) seem to indicate that there is ‘enthusiasm to support and scale-up regional climate risk insurance’ (Scherer 2017, p. 4) Examples of this support include: the Germany Ministry for Economic Cooperation and Development (BMZ) has provided USD5.9 million for the World Food Programme (WFP) to protect 1.2 million vulnerable African farmers with climate risk insurance, through ARC Replica, and the G7 InsuResilience Vision 2025, which has committed to ensuring 400–500 million poor persons are covered against disaster shock by pre-arranged finance and insurance mechanism by 2025; some of this will be through ARC (WFP 2020). Of course, this does not mean that risk pools are without challenges or are not failing on specific sets of metrics. Forest (2018) flags three failing areas: policy holder and hazard coverage, the cost of premium and risk transfer parameters, and the use of pay-out, which in most cases are up to the government. Here, ARC is flagged among the three regional risk pools, as the only one with contingency plan requirements that can support effective use of pay-outs. Other research exploring climate risk pooling and its impacts flag lack of transparency around pay-out, premium or risk transfer parameters. Ultimately, climate risk pools are not full insurance; they offer only limited coverage. Entities such as the U4 Anti-Corruption Help Desk are exploring how to mitigate potential corruption with regard to climate risk insurance.
15.6.5Widen the Focus of Relevant Actors: Role of Communities, Cities and Subnational Levels
There is an urgency and demand to meet the financial needs of the climate change actions not only at the national level but also at the subnational level, to achieve low-carbon and climate-resilient cities and communities ( high confidence) (Barnard 2015; Moro et al. 2018). Scaling up subnational climate finance and investment is a necessary condition to achieve climate change mitigation and adaptation action (Ahmad et al. 2019).
The importance of exploring effective subnational climate finance. Stronger subnational climate action is indispensable to adapt cities to build more sustainable, climate-positive communities (Kuramochi et al. 2020). It has transformative potential as a key enabler of inclusive urban economic development through the building of resilient communities ( high confidence) (Floater et al. 2017a; Colenbrander et al. 2018b; Ahmad et al. 2019). Yet the significant potential of subnational climate finance mechanisms remains unfulfilled. Policy frameworks, governance, and choices at higher levels underpin subnational climate investments (Colenbrander et al. 2018b; Hadfield and Cook 2019). To scale climate investment, a systematicunderstanding of the preconditions to mobilising high-potential financing instruments at the national and subnational levels is necessary.
Subnational climate finance needs and flows. Subnational climate finance covers financing mechanisms reaching or utilising subnational actors to develop climate positive investment in urban areas. The fragility of interconnected national and subnational finances affects subnational finance flows, including the impact of the social-economic crisis (Canuto and Liu 2010; Ahrend et al. 2013). The effect of deficit in investment for global infrastructure towards the growing subnational-level debt also creates pressure on subnational finances and constrains future access to financing ( high confidence) (Smoke 2019).
The International Finance Corporation estimates a cumulative climate investment opportunity of USD29.4 trillion across six urban sectors (waste, renewable energy, public transportation, water, EVs, and green buildings) in emerging market cities, cities in developing countries with more than 500,000 population, to 2030 (IFC 2018). However, the State of Cities Climate Finance report estimated that an average of USD384 billion was invested in urban climate finance annually in 2017–2018 (Negreiros et al. 2021). The International Institute for Environment and Development estimates that out of the USD17.4 billion total investments in climate finance, less than 10% (USD1.5 billion) was approved for locally-focused climate change projects between 2003 and 2016 (Soanes et al. 2017).
Subnational climate public and private finance. Urban climate finance and investment are prominent in the subnational climate finance landscape (CCFLA 2015; Buchner et al. 2019). Finance mechanisms that can support climate investment for the urban sector include public-private partnerships (PPPs); international finance; national investment vehicles; pricing, regulation, standards; land value capture; debt finance; and fiscal decentralisation (Granoff et al. 2016; Floater et al. 2017b; Gorelick 2018; White and Wahba 2019). Among these mechanisms, PPPs, debt finance, and land value capture have the potential to mobilise private finance (Ahmad et al. 2019). Better standardisation in processes is needed, including those bearing on contracts and regulatory arrangement, to reflect local specificities (Bayliss and Van Waeyenberge 2018) (Section 15.6.1.1).
PPPs are particularly important in cities with mature financial systems as the effectiveness of PPPs depends on appropriate investment architecture at scale and government capacity ( high confidence). Such cities can enable infrastructure such as renewable energy production and distribution, water networks, and building developments to generate consumer revenue streams that incentivise private investors to purchase equity as a long-term investment (Floater et al. 2017b).
National-level investment vehicles can provide leadership for subnational climate financing and crowd in private finance by providing early-stage market support to technologies or evidence related to asset performance and costs-benefits ( high confidence). The use of carbon pricing is increasing at the subnational level along with regulation and standards on negative externalities, such as pollution, to steer investment towards climate financing (World Bank Group 2019).
Debt financing via subnational bonds and borrowing, including municipal bonds, is another potential tool for raising upfront capital, especially for rich cities ( high confidence). The share of subnational, sub-sovereign, and sovereign bonds could grow over time, given efforts to expand the creditworthiness and ensure a sufficient supply of own-source revenue to reduce the default risk. As of now, subnational and sub-sovereign bonds are constrained by public finance limits and the fiscal capacities of governments. However, while green bonds have potential for growth at the subnational level and may result in a lower cost of capital in some cases, the market faces challenges related to scaling up and has been associated with limited measurable environmental impact to date (Section 15.6.8). Further, bonds with lower credit ratings drive higher issuance costs for climate risk cities, for example, costs related to disclosure and reporting (Painter 2020).
Key challenges of subnational climate finance. Across all types of cities, five key challenges constrain the flow of subnational climate finance ( high confidence): (i) difficulties in mobilising and scaling-up private financing (Granoff et al. 2016); (ii) deficient existing architecture in providing investment on the scale and with the characteristics needed (Anguelovski and Carmin 2011; Brugmann 2012); (iii) political-economic uncertainties, primarily related to innovation and lock-in barriers that increase investment risks (Unruh 2002; Cook and Chu 2018; White and Wahba 2019); (iv) the deficit in investment for global infrastructure affects the growing subnational-level debt (Canuto and Liu 2010); and (v) insufficient positive value capture (Foxon et al. 2015).
Different finance challenges between rich and poor cities. Access to capital markets has been one of the major sources for subnational financing and is generally limited to rich cities, and much of this occurs through loans ( high confidence). Different challenges to accessing capital markets associated with wealthy and poorer cities are compounded into three main issues: (i) scarcity and access of financial resources (Bahl and Linn 2014; Colenbrander et al. 2018b; Cook and Chu 2018; Gorelick 2018); (ii) the level of implication from the existing distributional uncertainties to the current financing of infrastructural decarbonisation across carbon markets (Silver 2015); and (iii) the policy and jurisdictional ambiguity in urban public finance institutions (Padigala and Kraleti 2014; Cook and Chu 2018). In poorer cities, these differing features continue to be inhibited by contextual characteristics of subnational finance, including gaps in domestic and foreign capital (Meltzer 2016), the mismatch between investment needs and available finance (Gorelick 2018), weak financial autonomy, insufficient financial maturity, investment-grade credit ratings in local debt markets (Bahl and Linn 2014), scarce diversified funding sources and stakeholders (Gorelick 2018; Zhan et al. 2018; Zhan and de Jong 2018) and weak enabling environments (Granoff et al. 2016).
The depth and character of the local capital market also affect cities differently in generating bonds ( high confidence). Challenges facing cities in developing countries include insufficient appropriate institutional arrangements, the issues of minimum size, and high transaction costs associated with green bonds (Banga 2019). Green projects and project pipelines are generally smaller in scale feasible for a bond market transaction (Saha and D’Almeida 2017; DFID 2020). De-risking in the different phases of long-term project financing can be promoted to improve the appetite of capital markets (Section in 15.6.7).
Climate investment and finance for communities. There is insufficient evidence about which financing schemes contribute to climate change mitigation and adaptations at community level ( high confidence). There is growing interest in the linkages between microfinance and adaptation in the agriculture sector (Agrawala and Carraro 2010; Fenton et al. 2015; Chirambo 2016; CIF 2018; Dowla 2018), the finance for community-based adaptation actions (Fenton et al. 2014; Sharma et al. 2014), and the relations between remittances and adaptation (Le De et al. 2013). However, there is less discussion on community finance aside from the benefits of community finance and village funds in contributing to close investment gaps and community-based mitigation in the renewable energy and forest sectors (Ebers Broughel and Hampl 2018; Bauwens 2019; Watts et al. 2019) The full potential and barriers of the community finance model are still unknown and research needs to expand understanding of favourable policy environments for community finance (Bauwens 2019; Watts et al. 2019).
Implications for the transformation pathway. Cities often have capacity constraints on planning and preparing capital investment plans. Integrated urban capital investment planning is an option to develop cross-sectoral solutions that reduce investment needs, boost coordination capacity, and increase climate-smart impacts ( high confidence) (Negreiros et al. 2021). In countries with weak and poorly functioning intergovernmental systems, alliances and networks may influence their organisational ability to translate adaptive capacity for transformation into actions (Leck and Roberts 2015; Colenbrander et al. 2018a). Deepening understanding of country-specific enabling environment for mobilising urban climate finance among and within cities and communities, design of policy, institutional practices and intergovernmental systems are needed to reduce negative implications of transformation (Steele et al. 2015).
15.6.6Innovative Financial Products
Innovative financial products with increased transparency on climate risk have attracted investor demand, and can facilitate investor identification of low-carbon investments ( high confidence). Innovative products may not necessarily increase financial flows for climate solutions in the near term, however they can help build capacity on climate risk and opportunities within institutions and companies to pave the way for increased flows over time.
Investor demand is driving developments in innovative financial products ( high confidence). Since AR5, innovative financial products such as sustainability and green-labelled financial products have proliferated (Section 15.3). These financial products are not necessarily ‘new’ in terms of financial design but are packaged or labelled in an innovative way to attract responsible and impact-oriented institutional investors.
The growth and diversity of the green bond market illustrates how innovative financial products can attract both public and private investors ( high confidence). Demand for green financial products initially stemmed from public sector pension funds. Pension funds and insurance companies in OECD countries have traditionally favoured bonds as an asset class with lower risk (OECD and Bloomberg 2015).
Since AR5, labelled green bonds have grown significantly, exceeding USD290 billion issued in 2020 with a total of USD1.1 trillion in outstanding bonds (CBI 2021 a) (Section 15.6.7). Corporates, financial institutions and government-backed entities (for example in real estate, retail, manufacturing, energy utilities) issued the largest volumes, with use of proceeds focused primarily on GHG mitigation in energy, buildings and transport projects (CBI 2021 a). Given their focus on GHG mitigation, green bonds are also sometimes referred to as climate bonds, but the common market terminology is ‘green’. Municipal green bond issuance has also been growing (Section 15.6.7). Beyond green bonds, additional products such as green loans, green commercial paper, green initial public offerings (IPOs), green commodities, and sustainability-linked bonds and loans have also been introduced in the market (CBI 2019a) (Section 15.6.7).
Investor demand for green bonds is evidenced by over-subscription of deals. Recent studies indicate an over-subscription for green-labelled bonds by an average of between three and five times, as compared to non-labelled bonds (Gore and Berrospi 2019; Nauman 2020). Results of a survey of global treasurers showed a higher demand for green bonds than non-labelled bonds for 70% of the respondents (CBI 2020a).
The financial crisis associated with COVID-19 has put increased pressure on debt issuers, and the extent to which the increase in indebtedness for sovereigns and corporates has been financed via climate-related-labelled debt products is not known. Further, at this time there is no identified literature assessing the degree to which international versus domestic investors are financing sovereign green debt in developing countries (Section 15.6.7) However, since the onset of the COVID-19 crisis, continued steady growth in issuance has been observed broadly across sustainable bonds (including green, social and sustainability bonds), with more significant growth in social bonds to support the COVID-19 recovery (Maltais and Nykvist 2020; CBI 2021 a).
Index providers and exchanges can also play a supporting role in transparency for identification of benchmarks and innovative financial products for climate action. Low-carbon indices have proliferated in recent years, with varying approaches including reduced exposure to fossil, best-in-class performers within a sector, and fossil-free (UN PRI 2018) (see discussion on ESG index performance that follows in this section). Indices can provide transparency on low-carbon opportunities, making it simpler for funds and investors to identify green investment options. Exchanges can also play a supporting role to the uptake of green financial products through transparent listings and requirements to improve credibility of green labelling. The number of green or sustainability bond listing segments tripled from five in 2016 to 15 in 2018 (SSE 2018). Green security listings can also be used to enhance local capital markets (Section 15.6.7).
Significant potential exists for continued growth in innovative financial products, though some challenges remain ( high confidence). Despite recent growth and diversification, green bonds face several challenges in scaling up. Issuance of green-labelled bonds constitutes approximately 1% of the global bond market issuance (ICMA 2020b; CBI 2021 a) Potential exists to increase issuance amongst corporates, for instance, and across a broader regional scope (although subject to limitations of local capital markets). Yet there remain several challenges to growing the green bond market, including inter alia concerns about greenwashing and limitations in application to developing countries (Shishlov et al. 2018; Banga 2019).
There is no globally accepted definition of green bonds, and varied definitions of eligible green activities are evolving across regional bond markets. Beyond the most commonly used green label, other related labels such as blue, sustainable, transition, sustainable development goal (SDG), social and environmental, social and governance (ESG) have some overlapping applications (Schumacher 2020). The degree to which these labels represent climate-relevant investments depends on underlying criteria and how they are applied (Section 15.6.4).
There are several initiatives aimed at protecting the integrity of the green label. Guidance on use and management of proceeds established by the International Capital Markets Association’s Green Bond Principles (GBP) is followed on a voluntary basis, which notes eligible use of proceeds as primarily climate mitigation and adaptation projects. The GBP also recommend independent external reviews at the time of issuance, with 89% of green bond issuers in 2020 having external reviews at the time of issuance (CBI 2021 a). In addition to best practice based on voluntary principles, a further check on greenwashing, although insufficient on its own, is the fear of reputation risk on behalf of investors, issuers and intermediaries in the age of social media (Hoepner et al. 2017; Deschryver and de Mariz 2020). A report on post-issuance green bond impact reporting notes that despite concerns (Shishlov et al. 2018), greenwashing incidence is rare, with 77% of green bond issuers reporting on allocation and 59% reporting on impact, but with significant variance in quality and consistency of impact reporting (CBI 2021 b).
Financial disclosure regulatory developments can help further align and specify definitions of green in the financial sector but are not a substitute for climate policy ( high confidence). Developing a common basis for understanding a green label could further reduce uncertainty or concerns of greenwashing. Regulatory developments in some regions seek to further guard against greenwashing with more specific definitions. The EU sustainable finance package, including the EU Taxonomy and EU Green Bond Standard draft regulations, is the broadest reaching, but not the only, regional initiative focused on disclosure of climate risk (Section 15.6.3). Taxonomies across regions are not always aligned on what can constitute a green project, for example with respect to transition activities (Pfaff et al. 2021) (Section 15.6.7). While standardisation can help reduce uncertainty in markets with imperfect knowledge, the green bond market is currently developing and is expected to continue to reflect regional differences in economic governance approaches (Nedopil et al. 2021). Regulations may also have trade-offs in terms of transaction costs for green financial product issuers. Classification approaches can also face challenges, depending on how they are designed, in their ability to capture new technologies and social impacts (Section 15.4).
Green bonds have been primarily targeting climate mitigation projects, with far fewer projects identified as adaptation. Green bonds mainly finance projects in the energy, buildings and transportation sectors, which constituted 85% of the use of proceeds of green bonds in 2020 (CBI 2020b, 2021a). Agriculture and forestry projects, including adaptation projects, have been less suited to be financed in a bond structure, which could be in part due to the more dispersed and smaller nature of the projects and in part due to project ‘bankability’ or ability to contribute steady streams of financing to pay back the terms of a bond. However, adaptation projects may not be identified as such as resiliency becomes more mainstreamed into infrastructure planning (Section 15.3.2).
While green bonds have the potential to further support financial flows to developing countries, local capital markets can be at varying stages of development (Banga 2019) (Sections 15.6.2 and 15.6.7). While multilateral and bilateral development finance institutions have been active in the green bond market, global issuance in 2020 in the top 10 countries included only one developing country (CBI 2021 a). Targeting international investors can be enhanced via de-risking activities (15.6.4).
Identifying green financial products can increase uptake and may result in a lower cost of capital in certain parts of the market ( high confidence). Investors face a systematic underpricing of climate risk in financial markets (Krogstrup and Oman 2019; Kumar et al. 2019). Transparent identification of financial products can make it easier for investors to include low-carbon products in their portfolios. Investors with mandates that include or are focused on climate change are showing an interest in green-labelled financial products. Investors that identify themselves as green constitute approximately 53% of the investor base for green bonds in the first half of 2019 (CBI 2019b).
There is some evidence of a premium, or an acceptance of lower yields by the investor, for green bonds (medium confidence). A survey of recent literature finds some consensus of the existence of a green premium in 56% of the studies on the primary markets (with a wide variance of premium amount), and 70% of the studies on the secondary market (with an average premium of –1 to –9 basis points), particularly for government issued, investment grade and green bonds that follow defined governance and reporting practices (MacAskill et al. 2021). In the US municipal bond market, as credit quality for green-labelled bonds has increased in the past few years, some studies show a positive premium for green bonds is arising (Baker et al. 2018; Karpf and Mandel 2018), or appearing only in the secondary market (Partridge and Medda 2020), while others find no evidence of a premium (Hyun et al. 2019; Larcker and Watts 2020). Several studies also show a recent emergence of a premium and oversubscription for some green-labelled bonds denominated in EUR (CBI 2019b), in some cases for both USD or EUR green bonds (Ehlers and Packer 2017), with a wide variation in the range of the observed difference in basis points focusing on the secondary market (Gianfrate and Peri 2019; Nanayakkara and Colombage 2019; Zerbib 2019), with financial institution and corporate green bonds exhibiting a marginal premium compared with their non-green comparisons (Hachenberg and Schiereck 2018; Kempa et al. 2021).
Spillover effects of green bonds may also impact equity markets and other financing conditions. Stock prices have been shown to positively respond to green bond issuance (Tang and Zhang 2020). One study linked enhanced credit quality induced by issuing green-labelled bonds to a lower cost of capital for corporate issuers (Agliardi and Agliardi 2019). Issuers’ reputation and use of third-party verification can also improve financing conditions for green bonds (Bachelet et al. 2019). Green bonds are strongly dependent on fixed income market movements and are impacted by significant price spillover from the corporate and treasury bond markets (Reboredo 2018). A simulation of future green sovereign bond issuances shows that this can promote green finance via firm’s expectations and the credit market (Monasterolo and Raberto 2018).
Financial flows via these instruments have limited measurable environmental impact to date, however they can support capacity building on climate risk and opportunities within institutions to realise future impacts ( high confidence). There is a lack of evidence to date that green and sustainable financial products have significant impacts in terms of climate change mitigation and adaptation Box 15.7). Further, new products must be coupled with tightened climate policy and a reduction in investments associated with GHG-emitting activities to make a difference on the climate (Section 15.3.3.2).
It is challenging to link specific emission reductions with specific instruments that mainly target climate activities such as green bonds. Data challenges point to an inability to link emission reductions, including Scope 3 GHG emissions, at the organisation or firm level with green bond use-of-proceeds issuance (Ehlers et al. 2020; Tuhkanen and Vulturius 2020). However one study found evidence of a signalling effect of issuing green bonds resulting in emission reductions at the corporate level following issuance (Flammer 2020), and another study characterised the lifecycle emissions of renewable energy financed by green bonds, indicating potentially substantive avoided emissions but with variance up to a factor of 12 across bonds depending on underlying assumptions (Gibon et al. 2020). There is also a lack of impact reporting requirements and consistency in the green bond market. Impact reporting is not typically required for green bond listings on specific exchanges, nor are there any requirements for independent reviews of impact reporting, however this could change in future if investors apply pressure.
Green-labelled products may not necessarily result in increased financial flows to climate projects, although there can be benefits from capacity building with issuing institutions. Green bonds can be used to finance new climate projects or refinance existing climate projects, and thus do not necessarily result in finance for new climate projects constituting additional GHG reductions (a framing used in the Clean Development Mechanism). The labelling process itself may not necessarily lead to additional financing (Dupre et al. 2018; Nicol et al. 2018b). However, the labelling process has merit in contributing to building capacity within issuing institutions on climate change (Schneeweiss 2019), which could support identification of new green projects in the pipeline.
Climate risk disclosure initiatives, some of which are voluntary in nature, may have a limited direct climate impact. Transparency on climate risk may not change investor decisions nor result in divestment, especially in the emerging economies, as support and clear direction from regulatory and policy mechanisms are required to drive institutional investors at large (Ameli et al. 2021b). On the other hand, there is evidence of reduced fossil fuel investments following mandatory climate risk disclosure requirements, indicating a broader signalling effect of transparency (Mésonnier and Nguyen 2021).
Box 15.7 | Impact of ESG and Sustainable Finance Products and Strategies
While scaling up climate finance remains a challenge (Section 15.3.2),there is consensus that investments that are managed taking into account broader sustainability criteria have increased consistently and ESG integration into sustainable investment is increasingly being mainstreamed by the financial sector over recent years (Maiti 2021). The United Nations Principles for Responsible Investment (PRI) grew to over 3000 signatories in 2020, representing over USD100 trillion in assets under management (UN PRI 2020). And according to the 2018 biennial assessment by Global Sustainable Investment Alliance, 15 sustainable investments in five major developed economies grew by 34% in the two-year period following the 2016 assessment. The primary ESG approaches leveraged were exclusion criteria and ESG integration, which together amounted to over USD37 trillion, accounting for two-thirds of the assessed sustainable investments, with novel strategies such as best-in class screening and sustainability-themed investing showing significant growth, although together they accounted for around 6% of these investments (GSIA 2019). Shareholder activism or corporate engagement is the other key approach, which has been well established and continued to grow to nearly USD10 trillion (GSIA 2019).
However, research indicates that ESG strategies by themselves do not yield meaningful social or environmental outcomes (Kölbel et al. 2020). When it comes to the tangible impact of the financial sector on addressing climate change and sustainable development, there remains ambiguity. There is a growing need for more robust assessment of ESG scores, including establishing higher standardisation of scoring processes and a common understanding of the different ESG criteria and their tangible impact on addressing climate change. The issue was highlighted in an assessment of six of the leading ESG rating agencies’ company ratings under the MIT Aggregate Confusion Project, which found the correlation among them to be 0.61, leading them to conclude that available ESG data was ‘noisy and unreliable’ (Berg et al. 2020). This need is reaffirmed by Drempetic et al. (2020), who claim that a thorough investigation of ESG scores remains a relatively neglected topic, with extraneous factors, such as firm size, influencing the score (Drempetic et al. 2020).
There continues to be a research gap in assessing the direct impact of ESG and sustainable investments on climate change indicators, with most existing studies assessing the co-relation between either the factors driving the sustainable finance trends and the impact on sustainable investments, or sustainable investments and the impact on corporate financial performance. Nevertheless, since the post-SDG adoption period, there has been a notable uptake on research linking sustainable business practices and financial performance (Muhmad and Muhamad 2020). This research shows that there is a growing business case for ESG investing, with evidence increasingly indicating a non-negative co-relation between ESG, SDG adoption and corporate financial performance (Friede et al. 2015; Muhmad and Muhamad 2020), and ESG performance having a positive relation with stock returns (Consolandi et al. 2020). Research focused on developed economies also indicates towards a positive relation between ESG criteria and disclosure, and economic sustainability of a firm (Giese et al. 2019; Alsayegh et al. 2020) and allays investor fears by showing that sustainable finance initiatives, such as divestment, do not adversely impact investment portfolio performance (Henriques and Sadorsky 2018; Trinks et al. 2018). It should be reiterated that this research assesses the co-relation between ESG criteria and corporate financial performance, with the researchers in some cases, such as Friede et al. (2015), including disclaimers of the results being inconclusive and highlighting the need for a deeper assessment for linking ESG criteria with impact on financial performance.
On the other hand, there is growing evidence for a sustainable investment lens having a broader positive impact on creating an enabling environment and strengthening the case for such investments. For instance, corporate social responsibility (CSR) activities and investments on the environment dimension, specifically in the areas of emission and resource reduction, were found to be profitable and a predictor of future abnormal returns in the longer term, from additional cash flow and additional demand (Dorfleitner et al. 2018). These factors could be contributing to the increasing trend of sustainable and green investments, and can be said to be further reiterated by the spate of investor-led collaborative initiatives and recent announcements by leading finance institutes in the developed economies, which is well recorded in a range of recent grey literature, including new climate-aligned investment strategies and ambition towards net zero targets.
Yet there is also a risk of companies announcing projected sustainability or net zerotargets and claiming the associated positive reputational impact, while having no clear action plan in place to achieve these. The lack of mandatory reporting frameworks, which results in an over-reliance on self-reported carbon data by companies for ESG assessments, can be a primary contributor (In and Schumacher 2021).
While there is a lack of research on the impactof sustainable finance products, divestment impact has been assessed in more detail. Although the research here also points towards the ambiguous direct impact of divestment on reducing GHG emissions or on the financial performance of fossil fuel companies, its indirect impact on framing the narrative around sustainable finance decisions (Bergman 2018), and the inherent potential of the divestment movement for building awareness and mobilising broader public support for effective climate policies, have been better researched and could be considered to be the more relevant outcomes (Braungardt et al. 2019). Arguments against divestment point to its largely symbolic nature, but Braungardt et al. (2019) elaborate on the broader positive impacts of divestment, which include its ability to spur climate action as a moral imperative and stigmatise and reduce the power of the fossil fuel lobby, and the potential of the approach to mitigate systemic financial risks arising due to climate change and address the legal responsibilities of investors merging in this regard.
Challenges remain with regards to overlapping definitions of sustainable and ESG investment opportunities, which also vary depending on social norms and pathways. There is also a general need for more extensive ESG disclosure at a corporate level, against the background of emerging mandatory impact reporting for asset managers in some regions. A movement is building towards sustainable investment strategies and increased sustainable development awareness in the financial sector (Muhmad and Muhamad 2020; Maiti 2021), which points to the ability of civil society movements, such as divestment campaigns, to have some influence on investor behaviour, although there are other influences such as climate risk disclosure initiatives and regulations.
15.6.7Development of Local Capital Markets
International situational context. Developing countries make up two-thirds of the world’s population and carry carbon-intensive economies where 70% of investments (see Chapter 3) need to be conducted to limit warming to 2°C. The focus for climate investments has been on China, USA, Europe, India and the G20 (UNEP 2019) but studies highlight Paris and SDG attention should be devoted to Africa, LDCs and SIDS (African Union Commission 2015; Feindouno et al. 2020; GCA-AAI 2020; Warner 2020; AOSIS 2021). The ‘special needs, circumstances and vulnerability’ of African, LDC and SIDS nations are recognised under UNFCCC and UN agreements (UN 2009, 2015a,b,c; UNFCCC 2010, 2015; Pauw et al. 2019). These nations currently contribute very little to global emissions. Developing countries with their growing economies, including the vast African continent roughly the size of China, Europe, USA, and India combined (IEA 2014b, p. 20) with a 1 billion population expected to double by 2050, growing reliance on fossil fuels and ‘cheap’ biomass (charcoal use and deforestation) amid rising urbanisation and industrialisation ambitions – collectively these nations hold large leap-frog potential for the energy transition as well as risks of infrastructure lock-in. Accelerated international cooperation is a critical enabler (IPCC 2018) in recognising this potential. This could mobilise global savings, scale up development of local capital markets for accelerated low-carbon investment and adaptation in low- and lower-middle-income countries as well as tackle illicit finance including tax avoidance leakages that deprive developing countries of valuable resources (US DoJ 2009; Hearson 2014; Hanlon 2017; US DoJ 2019; IATFD 2021). Diversifying funding sources is important at a time hard-currency Eurobond issuances reach records (Panizza and Taddei 2020; Moody’s Investors Service 2021). Otherwise, the structure of voluntary, nationally oriented, and financially fragmented arrangements under the Paris Agreement (Chapter 17) could lead to ‘regional rivalry’ (SSP 3) pathways (IPCC 2018; Gazzotti et al. 2021). The benefits are many times greater than apparent costs in terms of expected decline in global GHG emissions and attaining SDGs. These could even generate large ‘win-win’ opportunities back in capital source countries which will benefit from a flow back in import demand (Hourcade et al. 2021a).
Lessons from literature on policy options in mobilising capital for Paris and SDGs in developing countries can be summarised as follows:
1. development of national just transition strategies meet the USD100 billion commitment on a grant-equivalent basis to support NDCs that integrate policies on COVID-19 recovery, climate action, sustainable development and equity;
2. increase the leverage of public funds on diverse sources of private capital through de-risking investments and public-private partnerships involving location-based entities with AAA-rated players and institutional investors;
3. coordination of project preparation and development of project pipelines by infrastructure coordinator agencies, one-stop structuring and financing shops, project risk facilities provided by entities such as cities’ development banks, green banks, a world climate bank, global guarantee mechanism, and global infrastructure investment platform;
4. development of local currency bond markets backed by cross-border guarantees, technical assistance, remediation assets, especially by regional and national players whose mandates include nurturing local capital markets to support bond yield curve development and exchange listing options;
5. adopting advances in science-based assessment methods to foster accountability;
(a) for project assessment, measuring, reporting and verifying, and certification,
(b) for disclosures in climate, fossil fuels, SDGs, debt transparency and debt sustainability, and
(c) for progress on UN systems of national accounts particularly for public sector finance statistics.
Whole-of-society approach to mobilising diverse capital. There’s no shortage of money globally: it is simply that it has yet to travel to where it’s most needed. One challenge is unlocking unencumbered endowments to contribute to Paris and SDGs ( high confidence). The aggregate global wealth figures exceed USD200 trillion (Davies et al. 2016; UBS 2017; Credit Suisse 2020; Heredia et al. 2020). Some developing countries have run pilots for investing in government bonds capitalising on fintech growth discussed (The Economist 2017; Akwagyiram and Ohuocha 2021) (Section 15.6.6). Others are developing green products to encourage uptake by middle class retail investors (Eurosif 2018; UK DMO 2021). Millennial-aged inheritors expected to receive intergenerational transfers mobilised by global citizen activism (Chapter 2) invest in green retail and tech products (Morgan Stanley 2017; UBS 2017; Capgemini 2021). Historic inequity and diaspora-related private and public resources pledged and debated during the COVID-19 pandemic might have potential to contribute towards Paris and SDGs (Olusoga 2015; Glueck and Friedman 2020; Hall 2020; Piketty 2020; Timsit 2020; Goldman Sachs 2021; Guthrie 2021; Mieu 2021; Wagner 2021). Philanthropic institutions use grants, debt, equity, guarantees and issue investment grade bonds in using unencumbered endowments (Manilla 2018; Covington 2020; Moody’s Investors Service 2020) but only about 2% of their resources are dedicated to climate action (Williams T., 2015; Kramer 2017; Morena 2018; Delanoë et al. 2021). The pandemic exemplified the unprecedented collaboration and mobilisation of multilateral and scientific communities supported by the COVAX risk sharing mechanism for COVID-19 vaccines with pooling of financial and scientific resources (OECD 2021d). This momentum in international cooperation can be harnessed to galvanise resources, including for teaching of sciences in developing countries important in tackling society challenges, alleviating poverty (TWAS 2021) and inequity legacies compounded by climate impacts debated by many (Henochsberg 2016; Obregon 2018; Fernandez et al. 2021; The Economist 2021). Suggestions towards equitable models include ‘global adaptation funding approaches’ (Chancel and Piketty 2015), a ‘world climate bank’ to finance climate investments through long-term bonds (Foley 2009; Broome 2012; Broome and Foley 2016), a ‘cities development bank’ (Alexander et al. 2019), and ‘public debt financing models’ (Rendall 2021) for generations to share the burden which has precedence in history (Draper 2007; Fowler 2015).
Local financial institutions with local markets knowledge could benefit from technical assistance and partnership to scale up their potential with institutional investors better mobilised ( high confidence). The Global South has some 260 public development banks/PDBs representing USD5 trillion in assets with a worldwide PDB capacity to provide more than USD400 billion yr –1 of climate finance (IDFC and GCF 2020). Case studies discuss the potential for diaspora bond issuance being deployed for climate investments including securitisation of remittances as collateral for infrastructure bonds (Ketkar and Ratha 2010; Akkoyunlu and Stern 2012; Gelb et al. 2021). Such instruments could help harness diaspora remittances, whose flows rose from under USD 100 billion to USD530 billion during 1990–2018 (World Bank 2019c). PDBs could benefit from technical partnership with multilaterals and other local banks (Torres and Zeidan 2016). Their knowledge of local markets, can help build project pipelines (Figure 15.7) to channel local, domestic and international capital (Griffith-Jones et al. 2020). Institutional domestic and international investors have growing assets estimated to exceed USD100 trillion ( high confidence) (Willis Towers Watson 2020; UN PRI 2020; Halland et al. 2021; Heredia et al. 2021; Inderst 2021) and could be better mobilised. Some 36% of total assets under management (AUM) by the 100 largest asset owners come from pensions and sovereign wealth funds in the Asia Pacific region, with the remainder split almost evenly across Europe, the Middle East, Africa and North America. The largest pension fund in South Africa held about USD130 billion AUM in 2019 and African institutional investors held USD1.8 trillion in 2020 (PwC 2015; GEPF 2019; Bagus et al. 2020; GCA 2021a). UK NGO War on Want’s (2016) analysis of 101 fossil fuel and mining companies on the London Stock Exchange estimates these as holding USD1 trillion assets inside Africa. The Latin America and Caribbean region holds just about USD1 trillion AUM (Curtis 2016; Serebrisky et al. 2015; Cavallo and Powell 2019).

Figure 15.7 | Bond refinancing mobilises institutional investors in mature project phase. De-risk early-stage infrastructure projects. Source: adapted from PIDG (2019).
Investors with accumulated private capital are reported as looking for climate investments to ensure Just Transition, alignment with Paris and SDGs. However, progress remains pilot, slow and piecemeal ( high confidence). Global investors have published statements on their possible contribution, with recommendations to governments on de-risking to accelerate private sector investment to support Paris-aligned NDCs in developing countries (IIGCC 2015; IIGCC 2017; Global Investor Statement 2018; IIGCC 2018; Global Investor Statement 2019; IIGCC 2020). In March 2020, the UN Principles for Responsible Investment (PRI), had 3038 members representing USD103 trillion (UN PRI 2020); another coalition of investors published COVID-19 recovery plans (Investor Agenda 2020) and the Net Zero Asset Managers initiative was launched in December 2020 (NZAM 2020). However, it is still unclear how these pronouncements will be transformed to adequate financial flows and volumes of investment pipelines (IEA 2021d) (Chapter 3). Rempel and Gupta (2020) posit that a proportion of institutional holding is in fossil fuels. Clean energy transition minerals raise ESG questions around inclusive development for indigenous populations and require changes to supply chains exploiting child labour (Herrington 2021; IEA 2021a; IEA 2021f).
Options to mobilise institutional investors currently remain small pilots, relative to Paris and SDG ambitions ( high confidence). In terms of examples: in the women of colour-led arena, a Chicago pension fund invested in a developing country using a private equity fund; (Langhorne 2021, USAID 2021). Institutional BlackRock’s blended finance vehicle with OECD MDB partners focuses on developing countries (BlackRock 2021). In regional AAA MDB partnerships, the African Development Bank (AfDB) collaborates with African nations through a regional infrastructure fund (Africa50 2019); the Asian Development Bank (ADB) collaborates with a Philippines state-owned pension fund and Dutch pension fund in using a private equity fund to catalyse private sector investment (ADB 2012). A UN entity with several pooled public-private investment platforms includes an SDG blended finance vehicle (UN CDF 2020a; 2020b). A multilateral International Finance Corporation (IFC) blended finance fund, supported by a sovereign guarantee from Sweden’s SIDA, and separately a USD1 billion green bond fund by IFC and Europe’s Amundi asset manager buy green securities issued by developing country banks financing local currency climate investments (IFC 2018, 2021; Amundi and IFC 2019). The key parameter is the investment multiplier, the ratio of private investment mobilised by a given amount of public fund s which varies by product type. IFC’s portfolio of blended finance investments point to a self-reported range of 3 to 15 times for project debt and even higher levels (10 to 30) for debt finance provided on concessional terms (IFC 2021 a). Although an AAA-rated IFC blended finance fund was established in 2013, most investors joined in 2017 with insurers AXA and Swiss Re investing USD500 million each to bring the fund to USD7 billion raised from eight global investors (Attridge and Gouett 2021). Critics of blended finance mechanisms point to lack of data transparency hampering independent assessment on (i) value for public money and costs of blending versus other financial mechanisms, (ii) risks and benefits of de-risking private capital to collateralising climate-vulnerable Global South populations, (iii) lack of partnership with local players, and (iv) complex structures (Akyüz 2017; Mawdsley 2018; Convergence 2020; Attridge and Gouett 2021; Gabor 2021). Whilst blended finance transactions (BFTF 2018) are quite common in mature regulated markets with mandatory reporting requirements (Morse 2015; ICAEW 2021), the additional finance mobilised and their developmental impact remain unknown due to poor reporting that hammpers evidence-based policy making (Attridge and Gouett 2021). Projects that are aligned with blended finance principles in the UN Addis Agenda (UN 2015 a), and take account of local contexts by partnering with local actors, are much more likely to have sustainable impacts.
De-risking tools to lower capital costs and mobilise diverse investors. Paris-aligned NDCs that integrate policies on COVID-19 pandemic recovery, climate action, sustainable development, just transition and equity can harness co-benefits including contribution to Invisible UN SDG 7 energy poverty sectors ( high confidence). Developing countries require access to affordable finance for projects ranging from clean cooking solutions (Accenture 2018; World Bank et al. 2021); decentralised energy systems, intra-country power stations and regionally shared power pools with their associated energy distribution networks (IEA 2020d; IRENA 2020c). Close to 3 billion people in Africa and developing Asia have no access to clean cooking. For sub-Saharan Africa, the acute lack of electricity access lags behind all regions on SDG 7 indicators, impacting mostly women and children (IEA 2014b; IRENA 2020b,c; IEA et al. 2021; ESMAP 2020; Zhang 2021) (Box 6.1). These dire statistics remind of compounding tensions: historical inequities and the associated ‘first comer’ exploiting African resources for development elsewhere, the local climate change, ‘latecomer’ capacity development and technology transfer challenges, illicit mining finance and stranded assets (Curtis 2016; Bos and Gupta 2019; UNU-INRA 2019; Arezki 2021). The COVID-19 pandemic exacerbates this tension with more people pushed below the poverty line (Sumner et al. 2020) (section 15.6.4, Box 15.6 on post-COVID). Recent analysis points to the 60 largest banks providing USD3.8 trillion to fossil fuel companies since 2016, includinginside Africa (Rainforest Action Network et al. 2021). IMF estimated fossil fuel subsidies totalling USD5.2 trillion or 6.5% of global GDP in 2017 (Coady et al. 2019) to be compared with the USD2.4 trillion yr –1 energy investments over the next decade to limit global warming to 1.5°C (IPCC 2018). Analysts point to models in improvements to resources husbandry that include (i) developing strong minerals sector governance through sovereign wealth funds for domestic development (Wills et al. 2016) and (ii) compensation for Africa (Walsh et al. 2021) leaving fossil fuels underground (McGlade and Ekins 2015) in the Just Transition (Section 15.2.4) and Right to Develop debates as assets continue to be mined (IEA 2019c). In many developing regions, some of the world’s best renewable energy sources remain out of reach due to high costs which can be up to seven times those in developed countries (IEA 2021d). Shifting some risks through financial de-risking approaches could be instrumental (Schmidt 2014; Sweerts et al. 2019; Drumheller et al. 2020; Matthäus and Mehling 2020).
Combining approaches: (i) developed countries meeting UNFCCC USD100 billion commitment on a grant-equivalent basis, (ii) stepped up technical assistance, (iii) infrastructure coordination, (iv) knowledge sharing by project preparation entities, and (iv) harnessing project risk facilities such as guarantees could be instrumental for scaling climate finance for Paris-SDGs ( high confidence). Figure 15.7 illustrates the interplay between infrastructure project financing phases, bond refinancing and opportunities for developing bond yield curve benchmarks in nurturing local capital markets and mobilising diverse investors. These project financing phases have varying risk-return profiles and different benchmarks to track performance are often required by investors for different securities that might be created (Ketterer and Powell 2018).
An ODI (2018) survey of private and public project preparation facilities internationally showed high failure rates in early project preparation phases with recommendations on ‘one-stop-shops’ and knowledge sharing on effective approaches. During the very high-risk concept phase (Figure 15.7)– grants and technical assistance de-risk with design concepts, project proposals and feasibility studies completed to ‘kick-start’ the right projects. The early-stage developmental phase is characterised by short-term debt in the two to five years phase to complete construction enabled by concession finance. Bank loans are paid back by issuing bonds once the construction phase is completed. Such bond refinancing over say, 15–25 years, in the low-risk mature project phase can provide a lower cost of capital. Market-making to develop a pipeline of investment opportunities uses a complimentary mix of high-risk capital options in the form of grants, guarantees, equity, and mezzanine financing that can help (Attridge and Gouett 2021): (i) reduce up-front risks in the early phases, (ii) allow banks to recycle loans to new projects, and (iii) galvanise multilateral technical assistance for building bond yield curve benchmarks and de-risking local currency bond issuance of long tenors such as green bonds/resilience bonds (Berensmann et al. 2015; CBI 2015; Mercer 2018; Dasgupta et al. 2019; PIDG 2019; Braga et al. 2021; CBI et al. 2021; Hourcade et al. 2021a,b). Convergence (2019) points to investment from commercial banks with commercial debt of 11–15 years maturity being covered by guarantees. To achieve scale, some have issued special purpose vehicle (SPV) green infrastructure project bonds combining tenors up to 15 years with credit ratings assigned to mobilise investors with community trusts for local participation (Kaminker and Stewart 2012; Mathews and Kidney 2012; Mbeng Mezui and Hundal 2013; Essers et al. 2016; Moody’s Investors Service 2016; Ng and Tao 2016; Harber 2017). Bond refinancing could be facilitated through standardised national infrastructure style bonds, national infrastructure funds (Amonya 2009; Ketterer and Powell 2018) and country SPV infrastructure funds issuing bonds (Cavallo and Powell 2019) embedding MDBs.
Existing project risk facilities including guarantees could benefit from coordination, scaling and better reporting frameworks ( high confidence). Individual and clubs of developed and developing countries currently provide public guarantees (ADB 2015, 2018; IIGCC 2015; Pereira Dos Santos 2018; GGGI 2019; Garbacz et al. 2021). However MDB business models impose limitations on use of guarantees and collaboration with other MDBs (Gropp et al. 2014; Schiff and Dithrich 2017; Lee et al. 2018; Pereira dos Santos and Kearney 2018). Loans continue to dominate as the financial instrument of choice by MDBs and DFIs, with guarantees mobilising the most private finance for OECD reported data, even if their use remains limited (IATFD 2020; OECD 2020c; Attridge and Gouett 2021). Ramping up the use of guarantees to mobilise private investment raises questions around understanding efficacy in the design as there is no one size that fits all and more research is required to better understand this aspect (Convergence 2019). Sample guarantee forms in literature: (i) single-country Sweden and USA DFI forms (SIDA 2016, DCA 2018), (ii) multilateral institution offerings (Pereira Dos Santos 2018; IRENA 2020e), (iii) multi-sovereign guarantees one-stop platforms such as those on the PIDG/GuarantCo (PIDG 2019) and Africa Guarantee Fund owned by DFIs, including the African Development Bank (AfDB), the French Development Agency (AFD), the Nordic Development Fund (NDF), and the KfW Development Bank (AGF 2020), (iv) MIGA, established to provide political risk guarantees (enhanced green MIGA) (Déau and Touati 2018), (v) multilateral partnerships with developing nations via infrastructure funds (Section 15.6.7.2) and green infrastructure options (de Gouvello and Zelenko 2010; Studart and Gallagher 2015), (vi) guarantees embedded in project risk facilities such as currency fund TCX established by 22 DFIs (TCX 2020), and (vii) ASEAN and African multi-sovereign regional local currency bond guarantee funds and a co-guarantee platform (GGGI 2019; Garbacz et al. 2021). Fossil fuels currently benefit from de-risking tools from export credit agencies (Lawrence and Archer 2021), with questions around sustainable development (Wright 2011); Gupta et al. (2020) argue that these could be deployed for renewable energy. Sample project facilities reflecting the diverse project types across developing country regions can include i) UNEP Seed Capital ii) C40 Cities Facility iii) Blue Natural Capital Facility (IUCN 2021); iv) Clean Cooking Fund (ESMAP 2021) v) opportunities for guarantees in LDCs (Garbacz et al. 2021) vi) World Bank’s Renewables Risk Mitigation (GCF 2021) and World Bank’s Global Infrastructure Facility (GGGI 2019).. Multilaterals offer credit enhancement to manage both actual and perceived risks: in India’s corporate sector, renewable energy SPV project bonds have been guaranteed jointly by ADB and an infrastructure company raising the credit rating from sub-investment grade to investment grade to lower borrowing costs (ADB 2018; Agarwal and Singh 2018; Carrasco 2018).
Investment vehicles into green infrastructure come in various forms ( high confidence) and can include indirect corporate investment such as bonds; semi-direct investment funds via pooled vehicles such as infrastructure funds and private equity funds and project investment (direct) in green projects through equity and debt including loans, project bonds and green bonds. For pension funds in Australia and Canada, direct investment in infrastructure is about 5% of total AUM (Inderst and Della Croce 2013) whilst less than 1% for OECD pension funds goes to green infrastructure (Kaminker et al. 2013). Some regional developing country institutional investors use a variety of investment vehicles that span SPVs, private equity, domestic and regional local currency bond markets with statutory level mandates to address historic inequities (GEPF 2019). Cross-border collaboration in regional power markets such as Europe’s Nordpool; for developing countries could be led by repository of technical partnership from infrastructure funds and multilaterals (Oseni and Pollitt 2016; Juvonen et al. 2019; Chen et al. 2020; Nordpool 2021). Barriers to investments include non-standardised investment vehicles of scale and lack of national infrastructure road maps to give investor confidence in government commitment. Some have set up infrastructure coordinating entities embedding local science and engineering R&D (IPA 2021; National Infrastructure Commission 2021). Arezki et al. (2016) argue that coordination within existing platforms could create a global infrastructure investment platform for de-risking through guarantees and securitisation; Matthäus and (Mehling (2020) point to a global guarantee mechanism. Such AAA multilateral approaches create credibility-enhancing effects in developing capital markets. Hourcade et al. (2021a) suggest that the overall economic efficiency could be higher with guarantees calibrated per tonne on an agreed ‘social, economic, and environmental value of mitigation actions [and] their co-benefits’ (Article 108, Paris Agreement) basis, which would operate as a notional carbon price (High-Level Commission on Carbon Prices 2017). The grant equivalent of guarantees and induced equity inflows could be far beyond the USD100 billion promise. Such cooperative solutions in adopting development of local capital markets would end the drawbacks of the current plethora of low-scale fragmented project-by-project and ‘special-purpose’ pilots and programmes.
Harnessing existing bond markets and securities exchanges in nascent markets. The G20 has an action plan to support strengthening local currency bond markets and development of local capital markets is also part of the option for financing UN SDGs in developing countries (UN 2015 a, 2019, 2020; IATFD 2016, 2021). Primers are available on bond market development to support policy choices (World Bank and IMF 2001; Silva et al. 2020; World Bank 2020; Adrian et al 2021; IMF and World Bank 2021 ). Developing government bond yield curves with different maturities can be an important policy objective ( high confidence). This can support pricing discovery, liquidity (Wooldridge 2001) and can be achieved through step by step tranches from shorter to longer maturities to boost confidence and encourage municipals and other quasi-sovereigns. Money market instruments (such as, green commercial paper) anchor the short end of the yield curve with bonds of varying maturity issued by sovereign/quasi-sovereign entities (national treasuries, SOEs, municipalities) to mobilise investors (Goodfriend 2011; LSEG 2018; Tolliver et al. 2019). A variety of bonds are being used for developing countries including green (Ketterer et al. 2019), blue-water (Roth et al. 2019), transition, SDG/social, biodiversity bonds (Aglionby 2019), green/resilience bonds (AAC 2021); gender bonds (Andrade and Prado 2020) diaspora (LSEG 2017) and infrastructure project bonds (CBK 2021). Local policymakers would gain from technical and financial assistance in building green yield curves, for example with support from multilaterals (EIB 2012; IATFD 2016; Shi 2017; EIB 2018; Impact Investing Institute 2021). Green bonds are one of the most readily accessible to help fund Paris goals (Tolliver et al. 2019; Tuhkanen and Vulturius 2020). Section 15.3.2 refers to the growth in labelled bond markets (CBI 2021 a), low borrowing costs and yield curve building in Europe (Bahceli 2020; Serenelli 2021; Stubbington 2021; UK DMO 2021). For developing countries, labelled bonds have mostly been in hard currency (e.g. Smith 2021) despite local currency markets making up more than 80% total debt stock (IMF and World Bank 2016 ; Silva et al. 2020; Adrian et al 2021; Inderst 2021). The labelled bonds issuance by multilaterals do not currently mobilise the trillion levels needed. Research studies show that participating in green bond markets in part depends on a country having credible NDCs (Tolliver et al. 2020a; Tolliver et al. 2020b) and highlights diverse approaches working together to support local bond market development (Amacker and Donovan 2021; ICMA 2021; IMF and World Bank 2021 ).
Technical assistance options would benefit from coordination. Labelled bond costs remain high. Developing countries are using fiscal incentives, grants, and guarantees to support nascent bond markets with most taxonomies under development ( high confidence). Technical assistance requirements to improve the investment climate and bond market development will vary across national capacities. These would benefit from the USD100 billion UNFCCC grant equivalent basis to develop (i) regulatory and policy frameworks; (ii) UN national statistical systems (Singh et al. 2016; MacFeely and Barnat 2017; Paris21 2018; Bleeker and Abdulkadri 2020); (iii) credible NDC and SDG investment plans; (iv) project assessment certification and taxonomies; (v) bond market guidelines; and (vi) public finance management (US DoJ 2009; US DoJ 2019). Other technical assistance channels include diaspora entities, universities and learned societies (ICEAW 2012; UNFCCC 2021). LDCs supported by humanitarian entities are least likely to have active capital markets (ICRC 2020; IDFC 2020; Cao et al. 2021 b). Clubs of LDCs are partnering with AAA MDBs in aggregation approaches (AfDB 2020; GCF 2020b). Some UN entities provide technical assistance on municipal aggregation of projects (UN CDF 2021a), with Africa, LDC, SIDS nations and cities accessing green technical facilities and listings for labelled bonds (C40 Cities Climate Leadership Group 2016; Gorelick 2018; Jackson 2019; FSD Africa and CBI 2020; Gorelick and Walmsley 2020; MoE Fiji 2020; IFC 2021 c). Elevated climate risks imperil developing country ability to repay debts (Schmidt 2014; Buhr et al. 2018; Volz et al. 2020; Dibley et al. 2021). To lower overall costs and achieve more, entities have accessed technical assistance, listed local currency labelled bonds, and used credit enhancing bond guarantees, regulatory treatments and philanthropy schemes (Europe 2020 Project Bond Initiative 2012; SBN 2018; Agliardi and Agliardi 2019; Banga 2019). In the regions, China issued guidelines for stock exchanges and regulatory support for green bonds (Cao and Ma 2021), India issued regulations for local issuance of green bonds (CBI 2019a), while in the Latin America and Caribbean region, both plain vanilla and labelled bonds use the same authority (Ketterer et al. 2019). African, LDC and SIDS nations are reviewing ways to harness local exchanges (SSE 2018; GCF 2019; World Bank et al. 2021b; UN CDF 2021b). For taxonomies, the differences reflect the multitude of local Just Transition pathways, some with a purely environmental focus and others incorporating livelihood improvements (ICMA 2021). The sustainable bond market has been expanding as transition bonds become listed in anticipation of future developments (Roos 2021).
Progress towards transparency using scientific-based methods to build trust and accountability. After 60 years of development finance, critics underline limits coming from i) multilaterals model, lack of transparency around aid and debt (Mkandawire 2010; Lee 2017; PWYF 2019; Bradlow 2021; Gianfagna et al. 2021) ii) illicit finance (Plank 1993; Sachs and Warner 2001; Hanlon 2016; US DoJ 2019) ) iii) lack of developed country commitment to pledges (Nhamo and Nhamo 2016) iv) unregulated players as financial intermediaries in blended finance (Pereira 2017; Donaldson and Hawkes 2018; Attridge and Engen 2019; Tan 2019) v) weak accountability reflected in soft SDG data and vi) burden of responsibility in mobilising Paris and SDG resources to countries with historically soft institutional capacity (Hickel 2015; Donald and Way 2016; Scheyvens et al. 2016; Liverman 2018). Literature around trust in blended finance pinpoints four progress areas in accountability. First, debt transparency through public debt registries, centralised UN legacy debt restructuring and science-centred UN national statistical systems (Donaldson and Hawkes 2018; Jubilee Debt Campaign 2019; Stiglitz and Rashid 2020). Second, international reporting bell-weathers could be called upon to produce harmonised mandatory reporting frameworks that capitalise on TCFD to capture climate, debt sustainability (Section 15.6.7.3), SDG and fossil fuels (GISD 2020). Third, standardisation of assessment by third parties of the quantity and values of carbon saved by green projects (Hourcade et al. 2012) and of their contribution to quantified performance biodiversity targets (Finance for Biodiversity Initiative 2021) to facilitate their bundling, securitisation and repackaging in standardised liquid products and bonds (Arezki et al. 2016; Blended Finance Taskforce 2018a).
15.6.8Facilitating theDevelopment of New Business Models and Financing Approaches
New and innovative business models and financing approaches have emerged to help overcome barriers related to transactions costs by aggregating and/or transferring financing needs and establishing supply of finance for stakeholder groups lacking financial inclusion (high confidence).
15.6.8.1 Service-based Business Models in the Energy and Transport Sectors
Energy as a service (EaaS) is a business model whereby customers pay for an energy service without having to make any upfront capital investment (PwC 2014; Hamwi and Lizarralde 2017; Cleary and Palmer 2019). EaaS performance-based contracts can also be a form of ‘creative financing; for capital improvement that makes it possible to fund energy upgrades from cost reductions and deployment of decentralised renewable energy (KPMG 2015; Moles-Grueso et al. 2021). Innovation in EaaS has started at the household level, where smart meters using real-time data are used to predict peak demand levels and optimise electricity dispatch (Chasin et al. 2020; Government of UK 2016; Smart Energy International 2018).
Aggregators. An aggregator is a grouping of agents in a power system to act as a single entity when engaging in power system markets (MIT 2016). Aggregators can use operation optimisation platforms to provide real-time operating reserve capacity and a range of balancing services to integrate higher shares of variable renewable energy (Zancanella et al. 2016; Ma et al. 2017; Enbala 2018; Research and Markets 2017; IRENA 2019b). This makes a business case for deferred investments in grid infrastructure (medium confidence). Aggregating and managing demand-response of heat systems (micro CHP and heat pumps) has shown reduction in peak demand (TNO 2016).
Peer-to-peer (P2P) electricity trading. Producers and consumers can directly trade electricity with other consumers in an online marketplace to avoid the relatively high tariffs and the relatively low buy-back rates of traditional utilities (Liu et al. 2019; IRENA 2020f). P2P models trading with distributed energy resources reduce transmission losses and congestion (Mengelkamp et al. 2018; SEDA 2020; Lumenaza 2020; Sonnen 2020; UNFCCC 2020).
Community ownership models. Community ownership models refer to the collective ownership and management of energy-related assets with lower levels of investment, usually distributed renewable energy resources but also recently in heating systems and energy services (e.g., storage and charging) (Gall 2018; IRENA 2018; Kelly and Hanna 2019; Singh et al. 2019; Bisello et al. 2021; Maclurcan and Hinton 2021). Community ownership projects may need significant upfront investments, and the ability of communities to raise the required financing might prove insufficient, which can be supported by microcredits in the initial stages of the projects (Aitken 2013; Federici 2014; REN21 2016; Rescoop 2020).
Payment method: Pay-as-you-go (PayGo). PayGo business models emerged to address the energy access challenge and provide chiefly solar energy at affordable prices, using mobile telecommunication to facilitate payment through instalments; Yadav et al. 2019). However, PayGo has the technology and product risk, requires a financially viable and large customer base, and the system supplier must provide a significant portion of the finance and requires substantial equity and working capital (C40 Cities Climate Leadership Group 2018).
Transport sector business models. Analog to EaaS, mobility as a service (MaaS) offers a business model whereby customers pay for a mobility service without making any upfront capital investment (e.g., buying a car). MaaS tends to deliver significant urban benefits (e.g., cleaner air) and brings in efficiency gains in the use of resources ( high confidence). However, the switch to MaaS hardly improves the carbon footprint and further tempted on-demand mobility is likely to nurture carbon emissions (Suatmadi et al. 2019). Therefore, to support climate change mitigation, MaaS must be integrated with the deployment of smart charging of electric (autonomous) vehicles coupled to renewable energy sources (IRENA 2019d; Jones and Leibowicz 2019).
Financial technology applications to climate change. Financial technology, abbreviated as ‘fintech’, applies to data-driven technological solutions that aim to improve financial services (Dorfleitner et al. 2017; Lee and Shin 2018; Schueffel 2018). Fintech can enhance climate investment in innovative financial products and build trust through data, but also presents some challenges including potentially significant emissions from increased energy use with distributed transactions (Lei et al. 2021). Blockchain is a key fintech that secures individual transactions in a distributed system, which can have many applications with high impact potential but is also associated with uncertainty (OECD 2019c; World Energy Council 2019). Fintech applications with climate change mitigation potential have been growing recently, including tracking payment or asset history for credit scoring in AFOLU activities (Nassiry 2018; Davidovic et al. 2019), blockchain supported grid transactions (Livingston et al. 2018), carbon accounting throughout value chains (World Bank 2018b), or transparency and verification mechanisms for green financial instrument investors (Kyriakou et al. 2017; Stockholm Green Digital Finance 2017). Generally, blockchain and digital currency applications are not well covered by governance systems (Tapscott and Kirkland 2016; Nassiry 2018), which could lead to problems with security (Davidovic et al. 2019), and some licensing and prudential supervision frameworks are in flux.
15.6.8.2Nature-Based Solutions Including REDD+
Nature-based solutions are ‘actions to protect, sustainably manage and restore natural or modified ecosystems that address societal challenges effectively and adaptively, simultaneously providing human well-being and biodiversity benefits’ (Cohen-Shacham et al. 2016). Nature-based solutions consist of a wide range of measures including ecosystem-based mitigation and adaptation.
The studies on investment and finance for nature-based solutions is still limited. However, frameworks and schemes to incentivise the implementation of nature-based solutions, such as reducing emissions from deforestation and forest degradation and the role of conservation, sustainable management of forests and enhancement of forest carbon stocks in developing countries (REDD+), which contributes to climate change mitigation, has been actively discussed under the UNFCCC, with lessons from finance for REDD+ being available.
If effectively implemented, nature-based solutions can be cost-effective measures and able to provide multiple benefits, such as enhanced climate resilience, enhanced climate change mitigation, biodiversity habitat, water filtration, soil health, and amenity values ( high confidence) (Griscom et al. 2017; Keesstra et al. 2018; OECD 2019d; Griscom et al. 2020; Dasgupta 2021).
Nature-based solutions have large potential to address climate change and other sustainable development issues ( high confidence). Nature-based solutions are undercapitalised and the limited investment and finance, especially limited private capital, is widely recognised as one of the main barriers to the implementation and monitoring of the nature-based solutions (Seddon et al. 2020; Toxopeus and Polzin 2021; UNEP et al. 2021) Finance and investment models that generate their own revenues or consistently save costs are necessary to reduce dependency on grants (Schäfer et al. 2019; Wamsler et al. 2020).
REDD+. REDD+ can significantly contribute to climate change mitigation and also produce other co-benefits like climate change adaptation, biodiversity conservation, and poverty reduction, if well-implemented ( high confidence) (Milbank et al. 2018; Morita and Matsumoto 2018). We use the term REDD+ broadly, not limited to REDD+ implemented under the UNFCCC decisions, including Warsaw Framework for REDD+ (Chapter 14), but include voluntary REDD+ projects, such as projects which utilise voluntary carbon markets. Finance is a core element that incentivises and implements REDD+ activities. Various financial sources are financing REDD+ activities, including bilateral and multilateral, public and private, and international and domestic sources, with linking with several finance approaches/mechanisms including results-based finance and voluntary carbon markets (FAO 2018). However, there is lack of sufficient finance for REDD+ (Lujan and Silva-Chávez 2018; Maguire et al. 2021). REDD+ under the UNFCCC is implemented in three phases: readiness, implementation, and results-based payment phases. The Ecosystem Marketplace identified that at least USD5.4 billion in REDD+ in three phases funding has been committed through multiple development finance institutions so far (Maguire et al. 2021), and public funds are main sources that are supporting three phases, and most of the REDD+ finance was spent on the readiness phase (Atmadja et al. 2018; Lujan and Silva-Chávez 2018; Watson and Schalatek 2021). There is a significant gap between the existing finance and finance needs of REDD+ in each phase (Lujan and Silva-Chávez 2018). Furthermore, private sector contributions to REDD+ are currently limited mostly to the project-scale payments for carbon offsets/units through voluntary carbon markets (McFarland 2015; Lujan and Silva-Chávez 2018).
Current main challenges of REDD+ finance include the uncertainty of compliance carbon markets (which allow regulated entities to obtain and surrender emissions allowances or offsets to meet regulatory emissions reduction targets) (Maguire et al. 2021), as well as limited engagement of the private sector in REDD+ finance ( high confidence). With regard to the compliance carbon markets, at the international level, integrating climate cooperation through carbon markets into Article 6 of the Paris Agreement and including REDD+ has potential to enable emission reduction in more cost-effective ways, while the links between carbon markets and REDD+ under Article 6 is under discussion at the UNFCCC (Environmental Defense Fund 2019; Maguire et al. 2021) (Chapter 14). At the national and subnational levels, although compliance carbon markets such as in New Zealand, Australia and Colombia allow forest carbon units, how REDD+ will be dealt in the national and subnational government-led compliance carbon markets is uncertain (Streck 2020; Maguire et al. 2021). As for limited engagement of the private sector in REDD+ finance, there are various reasons why mobilising more private finance in REDD+ is difficult (Dixon and Challies 2015; Laing et al. 2016; Golub et al. 2018; Ehara et al. 2019; Streck 2020). The challenges include the needs of a clear understanding of carbon rights and transparent regulation on who can benefit from national REDD+ (Streck 2020); a clear regulatory framework and market certainty (Dixon and Challies 2015; Laing et al. 2016; Golub et al. 2018; Ehara et al. 2019); strong forest governance (Streck 2020), and implementation of REDD+ activities at national and subnational levels. Other challenges are associated with the nature of forest-based mitigation activities, the costs and complexity of monitoring, reporting and verification of REDD+ activities, because of the need to consider the risks of permanence, carbon leakage, and precisely determine and monitor the forest carbon sinks (van der Gaast et al. 2018; Yanai et al. 2020). Although REDD+ has many challenges to mobilise more private finance, there is discussion on exploring other finance opportunities for the forest sector, such as building new blended finance models combining different funding sources like public and private finance (Streck 2016; Rode et al. 2019), and developing enhanced bonds for forest-based mitigation activities (World Bank 2017).
Private finance opportunities for nature-based solutions. The development of nature-based solutions faces barriers that relate to the value proposition, value delivery and value capture of nature-based solutions business models and sustainable sources of public/private finance to tap into ( high confidence) (Toxopeus and Polzin 2017; Mok et al. 2021). However, the demand for establishing new finance and business models to attract both public and private finance to nature-based solutions is increasing in a wide range of topics such as urban areas, forestry and agriculture sectors, and blue natural capital including mangroves and coral reefs (Toxopeus and Polzin 2017; EIB 2019; Cziesielski et al. 2021; Mok et al. 2021; Thiele et al. 2021; UNEP et al. 2021). Furthermore, the recognition of the needs of financial institutions to identify the physical, transition and reputational risks resulting from not only climate change but also loss of biodiversity is gradually increasing (De Nederlandsche Bank and PBL Netherlands Environmental Assessment Agency 2020; Dasgupta 2021; TNFD 2021). Development of finance and business models for nature-based solutions needs to be explored, for example through utilising a wide range of financial instruments (e.g., equity, loans, bonds, and insurance), and creating standard metrics, baselines and common characteristics for nature-based solutions to promote the creation of a new asset class (Thiele et al. 2021; UNEP et al. 2021).
15.6.8.3Exploring Gender-responsive Climate Finance
Global and national recognition of the lack of finance for women has led to increasing emphasis on financial inclusion for women ( high confidence). Currently, it is estimated that 980 million women are excluded from formal financial system (Miles and Wiedmaier-Pfister 2018); and there is a 9% gender gap in financial access across developing countries (Demirguc-Kunt et al. 2018). This gender gap is the percentage difference between men and women with bank accounts as measured and reported in the Global Financial Inclusion (Global Findex) database. Policies and frameworks to expand and enhance financial inclusion also extend to the area of climate finance ( high confidence). Since AR5, there remain many questions and not enough evidence on the gender, distribution and allocative effectiveness of climate finance in the context of gender equality and women’s empowerment (Williams M., 2015; Chan et al. 2018; Wong et al. 2019). Nonetheless, the existing global policy framework (entry points, policy priorities, etc.) of climate funds is gradually improving in order to support women’s financial inclusion in both the public and the private dimensions of climate finance/investment (Schalatek 2015; Chan et al. 2018; Schalatek 2020). At the level of public multilateral climate funds, there have been significant improvements in integrating gender equality and women’s empowerment issues in the governance structures, policies, project approval and implementation processes of existing multilateral climate funds such as the UNFCCC’s funds managed by the Global Environment Facility, the Green Climate Fund and the World Bank’s CIFs ( high confidence) (Schalatek 2015; Williams M., 2015; Sellers 2016; GCF 2017). But according to a recent evaluation report, the integration of gender into operational policies and programmes is fragmented and there is lack of an ‘adequate, systematic and comprehensive gender equality approach for the allocation and distribution of funds for projects and programmes on the ground’ (GEF Independent Evaluation Office 2017; Schalatek 2018). The review found that ‘almost half of the analysed sample of 70 climate projects were judged to be largely gender-blind, and only 5% considered to have successfully mainstreamed gender, including in two Least Developed Countries Fund adaptation projects’ (GEF Independent Evaluation Office 2017; Schalatek 2018). While the GCF requires funding proposals to consider gender impact as part of their investment framework, 16 the fund does not have its own funding stream targeted to women’s project on the ground, nor is there as yet an evaluation as to how entities are actually implementing gender action plan in the projects. In the case of the CIFs, as noted by Schalatek (2018), ‘gender is not included in the operational principles of the Pilot Program on Climate Resilience (PPCR), which funds programmatic adaptation portfolios in a few developing countries, although most pilot countries have included some gender dimensions’. And, ‘gender is not integrated into the operations of the Clean Technology Fund (CTF), which finances large-scale mitigation in large economies and accounts for 70% of the CIFs’ pledged funding portfolio of 8.2 billion USD’ (Schalatek 2018). However, both the Forest Investment Program (FIP) and the Scaling-Up Renewable Energy in Low-Income Countries Program (SREP) have integrated gender equality as either a co-benefit or core criteria of these programmes (Schalatek 2018).
Overall, efforts to promote gender responsive/sensitive climate finance, at national and local levels, both in the public and private dimensions and more specifically in mitigation-oriented sectors such as clean and renewable energy, remain deficient ( high confidence). Recent developments in the capital markets in the areas of social bond are focused around gender bonds – debt instruments targeted to activities and behaviours that are relevant to gender equality and women’s empowerment. These bonds are aligned with Sustainability-linked Bonds as well as Social Bonds Principles of the International Capital Market Association. Issuances of gender-labelled bonds are increasing in the Asia Pacific region (the most comprehensive initiative is the Impact Investment Exchange’s (IIX) multi-country USD150 million Women’s Livelihood Bond 17 ) and in Latin America, Colombia, Mexico and Panama each have gender bond issuances). Additionally, a few developing countries, such as Pakistan (May 2021) and Morocco (March 2021) have issued gender bond guidelines for financial market participants.
Linkage to sectoral climate change issues and gender and climate finance. Subsets of actions designed to enhance women’s more formal integration into climate policies, programmes and actions by the global private sector include: investment in clean energy, redirecting funds to support women and vulnerable regions as a component of social and green bonds as well as insurance for climate risk management. In the latter context, insurance providers are arguing that ‘given the fact that women are disproportionately affected by climate change, there could be new finance innovations to address this gap’.(Miles and Wiedmaier-Pfister 2018). AXA and IFC estimate that the global women’s insurance market has the opportunity to grow to three times its current size, to UDS1.7 trillion by 2030 (AXA Group et al. 2015; GIZ et al. 2017). However, across the board, and in particular with regard to public funds, despite improvements in the substantive gender sensitisation and operational gender responsiveness of multilateral and bilateral climate finance funds operations, current flows of public and climate finance do not seem to be going to women and local communities in significant amounts (Chan et al. 2018; Schalatek 2020). At the same time, evaluations of the effectiveness of climate finance show that equitable flow of climate finance can play an important role in levelling the playing field and in enabling women and men to successfully respond to climate change and to enable the success and sustainability of local response in ensuring effective and sustainable climate strategies that can contribute to the global goals of the Paris Agreement (Minniti and Naudé 2010; Bird et al. 2013; Barrett 2014; Eastin 2018). This is particularly, so in the case of female-owned MSMEs, who, the literature increasingly shows, are key to promoting resilience at micro and macro scale in many developing countries (Omolo et al. 2017; Atela et al. 2018; Crick, F. et al. 2018).
Frequently Asked Questions (FAQs)
FAQ 15.1 | What’s the role of climate finance and the finance sector for a transformation towards a sustainable future?
The Paris Agreement has widened the scope of all financial flows from climate finance only to the full alignment of finance flows with the long-term goals of the Paris Agreement. While climate finance relates historically to the financial support of developed countries to developing countries, the Paris Agreement and its Article 2.1(c) have developed a new narrative that goes much beyond traditional flows and relates to all sectors and actors. Finance flows are consistent when the effects are either neutral with or without positive climate co-benefits to climate objectives; or explicitly targeted to climate benefits in adaptation and/or mitigation result areas. Climate-related financial risk is still massively underestimated by financial institutions, financial decision-makers more generally and also among public sector stakeholders, limiting the sector’s potential of being an enabler of the transition. The private sector has started to recognise climate-related risks and consequently redirect investment flows. Dynamics vary across sectors and regions with the financial sector being an enabler of transitions in only some selected (sub-)sectors and regions. Consistent, credible, timely and forward-looking political leadership remains central to strengthen the financial sector as enabler.
FAQ 15.2 | What’s the current status of global climate finance and the alignment of global financial flows with the Paris Agreement?
There is no agreed definition of climate finance. The term ‘climate finance’ is applied to the financial resources devoted to addressing climate change by all public and private actors from global to local scales, including international financial flows to developing countries to assist them in addressing climate change. Total climate finance includes all financial flows whose expected effect aims to reduce net greenhouse gas (GHG) emissions and/or to enhance resilience to the impacts of current and projected climate change. This includes private and public funds, domestic and international flows and expenditures. Tracking of climate finance flows faces limitations, in particular for national climate finance flows.
Progress on the alignment of financial flows with low GHG emissions pathways remains slow. Annual global climate finance flows are on an upward trend since the Fifth Assessment Report, according to the Climate Policy Initiative reaching more than USD630 billion in 2019/2020, however, growth has likely slowed down and flows remain significantly below needs. This is driven by barriers within and outside the financial sector. More than 90% of financing is allocated to mitigation activities despite the strong economic rationale of adaptation action. Adjusting for higher estimates on current flows for energy efficiency based on International Energy Agency data, the dominance of mitigation becomes even stronger. Persistently high levels of both public and private fossil-fuel related financing as well as other misaligned flows continue to be of major concern despite recent commitments. Significant progress has been made in the commercial finance sector with regard to the awareness of climate risks resulting from inadequate financial flows and climate action. However, a more consequent investment and policy decision-making that enables a rapid redirection of financial flows is needed. Regulatory support as a catalyser is an essential driver of such redirections. Dynamics across sectors and regions vary, with some being better positioned to close financing gaps and to benefit from an enabling role of finance in the short-term.
FAQ 15.3 | What defines a financing gap, and where are the critically identified gaps?
A financing gap is defined as the difference between current flows and average needs to meet the long-term goals of the Paris Agreement. Gaps are driven by various barriers inside (short-termism, information gaps, home bias, limited visibility of future pipelines) and outside (e.g., missing pricing of externalities, missing regulatory frameworks) of the financial sector. Current mitigation financing flows come in significantly below average needs across all regions and sectors despite the availability of sufficient capital on a global basis. Globally, yearly climate finance flows have to increase by a factor between three and six to meet average annual needs between 2020 and 2030.
Gaps are in particular concerning for many developing countries, with COVID-19 exacerbating the macroeconomic outlook and fiscal space for governments. Also, limited institutional capacity represents a key barrier for many developing countries, burdening risk perceptions and access to appropriately priced financing as well as limiting their ability to actively manage the transformation. Existing fundamental inequities in access to finance, as well as its terms and conditions, and countries’ exposure to physical impacts of climate change, overall result in a worsening outlook for a global just transition.
References
Abadie, L.M., I. Galarraga, and D. Rübbelke, 2013: An analysis of the causes of the mitigation bias in international climate finance. Mitig. Adapt. Strateg. Glob. Chang. , 18(7) , 943–955, doi:10.1007/s11027-012-9401-7.
Abbasi, F. and K. Riaz, 2016: CO2 emissions and financial development in an emerging economy: An augmented VAR approach. Energy Policy, 90, 102–114, doi:10.1016/j.enpol.2015.12.017.
Accenture, 2018: Financing Growth in the Clean Cookstoves and Fuels Market: An Analysis and Recommendations - Strengthening the Pipeline through Better Alignment of Financing with Enterprise Needs. 42 pp. https://cleancooking.org/wp-content/uploads/2021/07/549-1.pdf (Accessed November 1, 2021).
Acevedo, S., 2016: Gone with the Wind: Estimating Hurricane and Climate Change Costs in the Caribbean. International Monetary Fund, Washington, DC, 40 pp. https://www.imf.org/en/Publications/WP/Issues/2016/12/31/Gone-with-the-Wind-Estimating-Hurricane-and-Climate-Change-Costs-in-the-Caribbean-44333 (Accessed November 1, 2021).
Acevedo, S., M. Mrkaic, N. Novta, E. Pugacheva, and P. Topalova, 2018: The Effects of Weather Shocks on Economic Activity: What are the Channels of Impact?, International Monetary Fund, Washington, DC, USA, 40 pp. https://www.imf.org/%7B~%7D/media/Files/Publications/WP/2018/wp18144.ashx (Accessed November 1, 2021).
ACT Alliance, 2020: Climate Risk Insurance and Risk Financing in the Context of Climate Justice - A Manual for Development and Humanitarian Aid Practitioners. ACT Alliance, Geneva, 72 pp. https://reliefweb.int/sites/reliefweb.int/files/resources/Climate-Risk-Insurance-Manual_English-1.pdf (Accessed November 1, 2021).
ADB, 2012: First-Ever Private Equity Fund for Philippine Infrastructure Investments. Asian Development Bank (ADB) News Release, 31 July.
ADB, 2015: Local Currency Bonds and Infrastructure Finance in ASEA Countries. Asian Development Bank (ADB), Manila, 152 pp. https://www.adb.org/sites/default/files/publication/167313/local-currency-bonds-and-infrastructure-finance-asean-3.pdf (Accessed August 18, 2021).
ADB, 2018: India Infrastructure Finance Company Limited (IIFCL) guarantee facility credit enhancement of project bonds (India). Asian Development Bank (ADB), Manila, 2 pp.
Adenle, A.A. et al., 2017: Managing Climate Change Risks in Africa - A Global Perspective. Ecol. Econ. , 141, 190–201, doi:10.1016/j.ecolecon. 2017.06.004.
Adrian et al., 2021: Keeping it Local: A Secure and Stable Way to Access Financing. IMF Blog. https://blogs.imf.org/2021/03/12/keeping-it-local-a-secure-and-stable-way-to-access-financing/ (Accessed August 18, 2021).
AfDB, 2020: Sahel Group of Five: African Development Bank approves program to expand solar energy generation under Desert-to-Power scheme. African Development Bank Group (AfDB), press release, 18 December.
AfDB et al., 2018: 2017 Joint Report on Multilateral Development Banks’ Climate Finance.European Bank for Reconstruction and Development London, UK 44 pp.
AfDB et al., 2020: 2019 Joint Report on Multilateral Development Banks Climate Finance. European Bank for Reconstruction and Development, London, UK 56 pp.
Africa50, 2020: Annual Report 2019: Investing in infrastructure for Africa’s growth., Casablanca, 139 pp.
African Union Commission, 2015: Agenda 2063: The Africa We Want. First Ten-Year Implementation Plan 2013–2023. African Union Commission, Addis Ababa, Ethiopia, 20 pp.
Agarwal, S. and T. Singh, 2018: Unlocking the Green Bond Potential in India. The Energy and Resources Institute, New Delhi, 29 pp.https://www.teriin.org/projects/nfa/files/Green-Bond-Working-Paper.pdf (Accessed November 1, 2021).
AGF, 2020: African Guarantee Fund: Annual Report 2019. African Guarantee Fund (AGF), 109 pp. https://africanguaranteefund.com/wp-content/uploads/2021/04/AGF-Annual-Report-2019-Smaller-Version.pdf (Accessed August 18, 2021).
Aggarwal, R., 2019: The impact of climate shocks on consumption and the consumption distribution in India. PhD Thesis, Paris School of Economics, Paris, France, 60 pp.
Aghion, P., A. Dechezleprêtre, D. Hémous, R. Martin, and J. Van Reenen, 2016: Carbon Taxes, Path Dependency, and Directed Technical Change: Evidence from the Auto Industry. J. Polit. Econ. , 124(1) , 1–51, doi:10.1086/684581.
Agliardi, E. and R. Agliardi, 2019: Financing environmentally-sustainable projects with green bonds. Environ. Dev. Econ. , 24(6) , 608–623, doi:10.1017/S1355770X19000020.
Aglietta, M., É. Espagne, and F. Baptiste Perrissin, 2015: A proposal to finance low carbon investment in Europe. France Strategie, Paris, 1–7 pp. https://www.wmo.int/pages/publications/bulletin_fr/archives/61_1_fr/Fondsvertpourleclimat.html (Accessed November 1, 2021).
Aglionby, J., 2019: ‘Rhino bond’ breaks new ground in conservation finance. Financial Times, July 16.
Agrawala, S. and M. Carraro, 2010: Assessing the Role of Microfinance in Fostering Adaptation to Climate Change. SSRN Electron. J. , (15) , 20, doi:10.2139/ssrn.1646883.
Agrawala, S. et al., 2011: Private Sector Engagement in Adaptation to Climate Change: Approaches to Managing Climate Risks. OECD Publishing, Paris, France, 56 pp.
Ahluwalia, M.S., L. Summers, A. Velasco, N. Birdsall, and S. Morris, 2016: Multilateral Development Banking for this Century’s Development Challenges: Five Recommendations to Shareholders of the Old and New Multilateral Development Banks. Center for Global Development, Washington, DC, USA, 56 pp. https://www.cgdev.org/publication/multilateral-development-banking-for-this-centurys-development-challenges (Accessed November 1, 2021).
Ahmad, E., D. Dowling, D. Chan, S. Colenbrander, and N. Godfrey, 2019: Scaling up investment for sustainable urban infrastructure: A guide to national and subnational reform. Coalition for Urban Transitions, London, UK and Washington, DC, USA 1–46 pp. Coalition for Urban Transitions: London and Washington. https://newclimateeconomy.report/workingpapers/wp-content/uploads/sites/5/2019/04/CUT2019_Scaling_up_investment_for_sustainable_urban_infrastructure.pdf .
Åhman, M., L.J. Nilsson, and B. Johansson, 2017: Global climate policy and deep decarbonization of energy-intensive industries. Clim. Policy, 17(5) , 634–649, doi:10.1080/14693062.2016.1167009.
Ahrend, R., M. Curto-grau, and C. Vammalle, 2013: Passing the Buck? Central and Sub-national Governments in Times of Fiscal Stress. OECD, Paris, 33 pp.
Aitken, R., 2013: The Financialization of Micro-Credit. Dev. Change, 44(3) , 473–499, doi:10.1111/dech.12027.
Akkoyunlu, S. and M. Stern, 2012: An Empirical Analysis of Diaspora Bonds. Programme for the Study of Global Migration, 42 pp.
Akwagyiram, A. and C. Ohuocha, 2021: African fintech firm Flutterwave eyes U.S. listing after raising $170 million. Reuters, March 10.
Akyüz, Y., 2017: Playing with Fire: Deepened Financial Integration and Changing Vulnerabilities of the Global South. Oxford University Press, Oxford, UK, 279 pp.
Aldersey-Williams, J. and T. Rubert, 2019: Levelised cost of energy – A theoretical justification and critical assessment. Energy Policy, 124, 169–179, doi:10.1016/j.enpol.2018.10.004.
Alesina, A., D. Carloni, and G. Lecce, 2011: The Electoral Consequences of Large Fiscal Consolidations. National Bureau of Economic Research, Cambridge, MA, 19 pp. https://www .nber.org/system/files/working_papers/w17655/w17655.pdf (Accessed November 1, 2021).
Alessi, L., S. Battiston, A.S. Melo, and A. Roncoroni, 2019: The EU Sustainability Taxonomy: a financial impact assessment. Publications Office of the European Union, Luxembourg, 2019, doi:10.2760/347810 (Accessed November 1, 2021).
Alessi, L., E. Ossola, and R. Panzica, 2021: What greenium matters in the stock market? The role of greenhouse gas emissions and environmental disclosures. J. Financ. Stab. , 54, 100869, doi:10.1016/j.jfs.2021.100869.
Alexander, J. et al., 2019: Financing the sustainable urban future Scoping a green cities development bank.ODI, London, UK, 44 pp.
Allen, T. et al., 2020: Climate-Related Scenarios for Financial Stability Assessment: an Application to France. Banque de France, Paris, France, 65 pp.
Alnes, K., A. Berg, C. Clapp, E. Lannoo, and K. Pillay, 2018: Flood Risk for Investors. Are you prepared?CICERO, Oslo, Norway, 12 pp.https://pub.cicero.oslo.no/cicero-xmlui/handle/11250/2497350 (Accessed November 1, 2021).
Alsayegh, M.F., R. Abdul Rahman, and S. Homayoun, 2020: Corporate Economic, Environmental, and Social Sustainability Performance Transformation through ESG Disclosure. Sustainability, 12(9) , 3910, doi:10.3390/su12093910.
Alvaredo, F., L. Chancel, T. Piketty, E. Saez, and G. Zucman, 2020: Towards a System of Distributional National Accounts: Methods and Global Inequality Estimates from WID.world. Econ. Stat./Econ. Stat. , (517-518–519) , 41–59, doi:10.24187/ecostat.2020.517t.2018.
Amacker, J. and C. Donovan, 2021: Marathon or Sprint?: The Race for Green Capital in Emerging Markets. Centre for Climate Finance and Investment, London, UK, 41 pp. https://imperialcollegelondon.app.box.com/s/ge9thj52rcehma4bwxyt0fchi3q2niv5 (Accessed August 19, 2021).
Ameli, N., P. Drummond, A. Bisaro, M. Grubb, and H. Chenet, 2020: Climate finance and disclosure for institutional investors: why transparency is not enough. Clim. Change, 160(4) , 565–589, doi:10.1007/s10584-019-02542-2.
Ameli, N. et al., 2021a: Higher cost of finance exacerbates a climate investment trap in developing economies. Nat. Commun. , 12(1) , 4046, doi:10.1038/s41467-021-24305-3.
Ameli, N., S. Kothari, and M. Grubb, 2021b: Misplaced expectations from climate disclosure initiatives. Nat. Clim. Chang. , 11, 917–924, doi:10.1038/s41558-021-01174-8.
Amonya, F., 2009: Infrastructure Sovereign Bonds in Sub-Saharan Africa Dissecting the Road Governance Challenge of the New Financing Instrument. SSRN Electron. J. doi:10.2139/ssrn.2653429 (Accessed November 1, 2021).
Amundi and IFC, 2019: Emerging Market Green Bonds Report 2019. Amundi Asset Management, Paris, France, 34 pp.
Andersen, O.W. et al., 2019: Blended Finance Evaluation: Governance and Methodological Challenges. OECD Development Co-operation Working Papers 51, OECD Publishing, Paris, France, 32 pp.
Andrade, G. and G. Prado, 2020: Financial Innovation to Support Women-Led Businesses: Mexico’s First Gender Bond and the Role of National Development Banks. Inter-American Development Bank, Washington, DC, USA, 9 pp.
Andrijevic, M., C.-F. Schleussner, M.J. Gidden, D.L. McCollum, and J. Rogelj, 2020: COVID-19 recovery funds dwarf clean energy investment needs. Science, 370(6514) , 298–300, doi:10.1126/science.abc9697.
Anguelovski, I. and J. Carmin, 2011: Something borrowed, everything new: innovation and institutionalization in urban climate governance. Curr. Opin. Environ. Sustain. , 3(3) , 169–175, doi:10.1016/j.cosust.2010.12.017.
Aon Benfield UCL Hazard Research Centre, 2019: Weather, Climate & Catastrophe Insight: 2018 Annual Report . AON PLC, London, UK, 84 pp. http://thoughtleadership .aonbenfield.com/Documents/20190122-ab-if-annual-weather-climate-report-2018.pdf (Accessed November 1, 2021).
AOSIS, 2021: Alliance Of Small Island States (AOSIS) Leaders’ Declaration. https://www.aosis.org/launch-of-the-alliance-of-small-island-states-leaders-declaration/ (Accessed October 27, 2021).
ARC, 2016: ARC’s Agenda for Action on Climate Resilience: $2 Billion of Insurance Coverage for Africa by 2020.The African Risk Capacity Group, Johannesburg, South Africa, 21 pp.
Arent, D., C. Arndt, M. Miller, F. Tarp, and O. Zinaman (eds.), 2017: The political economy of clean energy transitions. 1st ed. Oxford University Press, Oxford, UKi, 632 pp.
Arezki, R., 2021: Climate finance for Africa requires overcoming bottlenecks in domestic capacity. Nat. Clim. Chang., 11, 888, doi:10.1038/s41558-021-01191-7.
Arezki, R., P. Bolton, S. Peters, F. Samama, and J. Stiglitz, 2016: From Global Savings Glut to Financing Infrastructure: The Advent of Investment Platforms. IMF, Washington DC, USA, 47 pp. https://www.imf.org/en/Publications/WP/Issues/2016/12/31/From-Global-Savings-Glut-to-Financing-Infrastructure-The-Advent-of-Investment-Platforms-43689 (Accessed November 1, 2021).
Arrow, K. et al., 2004: Are We Consuming Too Much?J. Econ. Perspect. , 18(3) , 147–172, doi:10.1257/0895330042162377.
Atela, J., K.E. Gannon, and F. Crick, 2018: Climate Change Adaptation among Female-Led Micro, Small, and Medium Enterprises in Semiarid Areas: A Case Study from Kenya. In: Filho, W.L. (ed)Handbook of Climate Change Resilience, Springer International Publishing, Cham, Switzerland, pp. 1–18.
Atmadja, S.S., S. Arwida, C. Martius, and P.T. Thuy, 2018: Financing REDD+: A transaction among equals, or an uneven playing field? In: Transforming REDD+: Lessons and new directions, Center for International Forestry Research (CIFOR), Bogor, Indonesia, pp. 29–40.
Attridge, S. and L. Engen, 2019: Blended finance in the poorest countries: The need for a better approach. ODI, London, UK, 75 pp. https://cdn.odi.org/media/documents/12666.pdf (Accessed November 1, 2021).
Attridge, S. and M. Gouett, 2021: Development finance institutions: the need for bold action to invest better. ODI, London, UK, 74 pp. https://cdn.odi.org/media/documents/DPF_Blended_finance_report_tuMbRjW.pdf (Accessed October 30, 2021).
Averchenkova, A., F. Crick, A. Kocornik-Mina, H. Leck, and S. Surminski, 2016: Multinational and large national corporations and climate adaptation: are we asking the right questions? A review of current knowledge and a new research perspective. Wiley Interdiscip. Rev. Clim. Chang. , 7(4) , 517–536, doi:10.1002/wcc.402.
AXA Group, Accenture, and IFC, 2015: SheforShield: Insure Women to Better Protect All. IFC, Washington, DC, USA, 178 pp. https://www.ifc.org/wps/wcm/connect/7a8950dd-db88-4d52-8b88-fbeb771cf89c/SheforShield_Final-Web2015.pdf?MOD=AJPERES&CVID=nZh46on.
Bachelet, M.J., L. Becchetti, and S. Manfredonia, 2019: The Green Bonds Premium Puzzle: The Role of Issuer Characteristics and Third-Party Verification. Sustainability, 11(4) , 1098, doi:10.3390/su11041098.
Bagus, U., F.J. de Girancourt, R. Mahmood, and Q. Manji, 2020: Africa’s insurance market is set to take off . McKinsey and Company, 10 pp, New York, USA. https://www.mckinsey.com/featured-insights/middle-east-and-africa/africas-insurance-market-is-set-for-takeoff (Accessed November 1, 2021).
Bahal, G., M. Raissi, and V. Tulin, 2018: Crowding-out or crowding-in? Public and private investment in India. World Dev. , 109, 323–333, doi:10.1016/j.worlddev.2018.05.004.
Bahceli, Y., 2020: German 30-yr green bond bucks market selloff with record demand. Reuters. May 11.
Bahl, R.W. and J.F. Linn, 2014: Governing and Financing Cities in the Developing World. Lincoln Institute of Land Management, Cambridge, UK, 56 pp. https://www.lincolninst.edu/sites/default/files/pubfiles/governing-and-financing-cities-developing-world-full_0.pdf (Accessed November 1, 2021).
Bainton, N., D. Kemp, E. Lèbre, J.R. Owen, and G. Marston, 2021: The energy‐extractives nexus and the just transition. Sustain. Dev. , 29(4) , 624–634, doi:10.1002/sd.2163.
Baker, M.P., D.B. Bergstresser, G. Serafeim, and J.A. Wurgler, 2018: Financing the Response to Climate Change: The Pricing and Ownership of U.S. Green Bonds. SSRN Electron. J. , 3275327, 1–44, doi:10.2139/ssrn.3275327.
Balint, T. et al., 2016: Complexity and the Economics of Climate Change: a Survey and a Look Forward. https://halshs.archives-ouvertes.fr/halshs-01390694.
Bandura, R. and S.R. Ramanujam, 2019: Innovations in guarantees for development . Center for Strategic and International Studies, Washington, DC, USA, and Rowman & Littlefield, Lanham, MD, USA, 50 pp.
Banga, J., 2019: The green bond market: a potential source of climate finance for developing countries. J. Sustain. Financ. Invest. , 9(1) , 17–32, doi:10.1080/20430795.2018.1498617.
Bank of England, 2015: The impact of climate change on the UK insurance sector: A Climate Change Adaptation Report by the Prudential Regulation Authority. Prudential Regulation Authority, London, UK, 85 pp. https://www.bankofengland.co.uk/-/media/boe/files/prudential-regulation/publication/impact-of-climate-change-on-the-uk-insurance-sector.pdf (Accessed November 1, 2021).
Bank of England, 2018: Transition in thinking: The impact of climate change on the UK banking sector. Prudential Regulation Authority, London, UK, 52 pp. https://www.bankofengland.co.uk/-/media/boe/files/prudential-regulation/report/transition-in-thinking-the-impact-of-climate-change-on-the-uk-banking-sector.pdf (Accessed November 1, 2021).
Baranović, I., I. Busies, W. Coussens, M. Grill, and H. Hempell, 2021: The challenge of capturing climate risks in the banking regulatory framework: is there a need for a macroprudential response? Macroprudential Bulletin, 15, ECB, Frankfurt am Main, Germany. https://www.ecb.europa.eu/pub/financial-stability/macroprudential-bulletin/html/ecb.mpbu202110_1~5323a5baa8.en.html (Accessed November 1, 2021).
Barbier, E.B., 2020: Greening the Post-pandemic Recovery in the G20. Environ. Resour. Econ. , 76(4) , 685–703, doi:10.1007/s10640-020-00437-w.
Barbier, E.B. and J.C. Burgess, 2020: Sustainability and development after COVID-19. World Dev. , 135, 105082, doi:10.1016/j.worlddev.2020.105082.
Barnard, S., 2015: Climate finance for cities: How can international climate funds best support low-carbon and climate resilient urban development?ODI, London, UK 27 pp. https://odi.org/en/publications/climate-finance-for-cities-how-can-climate-funds-best-support-low-carbon-and-climate-resilient-urban-development/ (Accessed November 1, 2021).
Barnsley, I., A. Blank, and A. Brown, 2015: Enabling Renewable Energy and Energy Efficiency Technologies. International Energy Agency, Paris, France, 115 pp. https://www.idaea.csic.es/medspring/sites/default/files/Enabling-Renewable-Energy-and-Energy-Efficiency-Technologies.pdf (Accessed November 1, 2021).
Barrett, P. and S. Chen, 2021: Social Repercussions of Pandemics. Working Paper No. 2021/021, IMF, Washington DC, USA, 24 pp. https://www.imf.org/-/media/Files/Publications/WP/2021/English/wpiea2021021-print-pdf.ashx (Accessed November 1, 2021).
Barrett, S., 2014: Subnational Climate Justice? Adaptation Finance Distribution and Climate Vulnerability. World Dev. , 58, 130–142, doi:10.1016/j.worlddev.2014.01.014.
Barro, R.J., 1987: Government spending, interest rates, prices, and budget deficits in the United Kingdom, 1701–1918. J. Monet. Econ. , 20(2) , 221–247, doi:10.1016/0304-3932(87)90015-8.
Basile, I. and J. Dutra, 2019: Blended Finance Funds and Facilities: 2018 Survey Results. OECDDevelopment Co-operation Working Papers, No. 59, OECD Publishing, Paris, France, 69 pp. doi: 10.1787/806991a2-en.
Bast, E., A. Doukas, S. Pickard, L. Van Der Burg, and S. Whitley, 2015:Empty promises: G20 subsidies to oil, gas and coal production. ODI, London, UK, and Washington DC, USA, 103 pp. https://www .odi.org/publications/10058-empty-promises-g20-subsidies-oil-gas-and-coal-production (Accessed November 1, 2021).
Battiston, S. and I. Monasterolo, 2020: On the dependence of investor’s probability of default on climate transition scenarios. SSRN Electron. J. , 3743647, 25, doi: 10.2139/ssrn.3743647.
Battiston, S., A. Mandel, I. Monasterolo, F. Schütze, and G. Visentin, 2017: A climate stress-test of the financial system. Nat. Clim. Change, 7(4) , 283–288, doi:10.1038/nclimate3255.
Battiston, S., P. Jakubik, I. Monasterolo, K. Riahi, and B. van Ruijven, 2019: Climate risk assessment of sovereign bonds’ portfolio of European insurers. In: EIOPA Financial Stability Report, December 2019. European Insurance and Occupational pensions Authority (EIOPA), Publications Office of the European Union, Luxembourg (Accessed November 1, 2021).
Battiston, S., I. Monasterolo, J. Min, K. Riahi, and B. van Ruijven, 2020a: Enabling or hampering. Climate risk and the role of finance in the low-carbon transition. SSRN Electron. J., 3748642, http://dx.doi.org/10.2139/ssrn.3748642.
Battiston, S., I. Monasterolo, K. Riahi, and B. van Ruijven, 2020b: Climate mitigation pathways need to account for the ambivalent role of finance. SSRN Electron. J., 3748041, doi: 10.2139/ssrn.3748041.
Battiston, S., Y. Dafermos, and I. Monasterolo, 2021a: Climate risks and financial stability. J. Financ. Stab. , 54, 100867, doi:10.1016/j.jfs.2021.100867.
Battiston, S., I. Monasterolo, K. Riahi, and B.J. van Ruijven, 2021b: Accounting for finance is key for climate mitigation pathways. Science, 372(6545) , 918–920, doi:10.1126/science.abf3877.
Bauer, N. et al., 2015: CO2 emission mitigation and fossil fuel markets: Dynamic and international aspects of climate policies. Technol. Forecast. Soc. Change, 90, 243–256, doi:10.1016/j.techfore.2013.09.009.
Bauwens, T., 2019: Analyzing the determinants of the size of investments by community renewable energy members: Findings and policy implications from Flanders. Energy Policy, 129 (October 2018), 841–852, doi:10.1016/j.enpol.2019.02.067.
Bayliss, K. and E. Van Waeyenberge, 2018: Unpacking the Public Private Partnership Revival. J. Dev. Stud. , 54(4) , 577–593, doi:10.1080/00220388.2017.1303671.
BCG, 2018: Klimapfade Deutschland. BCG, https://www.bcg.com/de-de/publications/2018/climate-paths-for-germany (Accessed November 1, 2021).
Beck, S., S. Jasanoff, A. Stirling, and C. Polzin, 2021: The governance of sociotechnical transformations to sustainability. Curr. Opin. Environ. Sustain. , 49, 143–152, doi:10.1016/j.cosust.2021.04.010.
Benali, N., I. Abdelkafi, and R. Feki, 2018: Natural-disaster shocks and government’s behavior: Evidence from middle-income countries. Int. J. Disaster Risk Reduct. , 27, 1–6, doi:10.1016/j.ijdrr.2016.12.014.
Benmelech, E. and N. Tzur-Ilan, 2020: The Determinants of Fiscal and Monetary Policies During the Covid-19Crisis.,NBER working paper 27461, NBER, Cambridge, MA, USA, 42 pp. doi: 10.3386/w27461.
Benn, J. and W. Luijkx, 2017: Emerging providers’ international co-operation for development ., Paris, France, 26 pp.
Berensmann, K., F. Dafe, and U. Volz, 2015: Developing local currency bond markets for long-term development financing in Sub-Saharan Africa. Oxford Rev. Econ. Policy, 31(3–4) , 350–378, doi:10.1093/oxrep/grv032.
Berg, F., J. Kölbel, and R. Rigobon, 2020: Aggregate Confusion: The Divergence of ESG Ratings. Forthcoming Review of Finance, SSRN Electron. J. , 3438533, doi:10.2139/ssrn.3438533.Bergman, N., 2018: Impacts of the Fossil Fuel Divestment Movement: Effects on Finance, Policy and Public Discourse. Sustainability, 10(7) , 2529, doi:10.3390/su10072529.
Bertoldi, P. and B. Boza-Kiss, 2017: Analysis of barriers and drivers for the development of the ESCO markets in Europe. Energy Policy, 107 (July 2016), 345–355, doi:10.1016/j.enpol.2017.04.023.
Bertoldi, P., M. Economidou, V. Palermo, B. Boza‐Kiss, and V. Todeschi, 2021: How to finance energy renovation of residential buildings: Review of current and emerging financing instruments in the EU. WIREs Energy Environ. , 10(1) , doi:10.1002/wene.384.
Bertram, C. et al., 2021: Energy system developments and investments in the decisive decade for the Paris Agreement goals. Environ. Res. Lett. , 16(7) , 074020, doi:10.1088/1748-9326/ac09ae.
Best, R. and P.J. Burke, 2018: Adoption of solar and wind energy: The roles of carbon pricing and aggregate policy support. Energy Policy, 118, 404–417, doi:10.1016/j.enpol.2018.03.050.
Bevere, L., 2019: sigma 2/2019: Secondary natural catastrophe risks on the front line. sigma Res. , Swiss Re Institute. https://www.swissre. com/institute/research/sigma-research/sigma-2019-02.html (Accessed November 1, 2021).
Bhattacharya, A. et al., 2020: Delivering on the $100 Billion Climate Finance Commitment and Transforming Climate Finance. Independent Expert Group on Climate Change. 70 pp. https://www.un.org/sites/un2.un.org/files/2020/12/100_billion_climate_finance_report.pdf (Accessed November 1, 2021).
Bhattarai, K. et al., 2018: Tax plan debates in the US presidential election: A dynamic CGE analysis of growth and redistribution trade-offs. Econ. Model. , 68, 529–542, doi:10.1016/j.econmod.2017.08.031.
Bird, N., T. Beloe, S. Ockenden, J. Corfee-Morlot, and S. Zou, 2013: Understanding Climate Change Finance Flows and Effectiveness – Mapping of Recent Initiatives. ODI, London, 15 pp.
Bisello, A., D. Vettorato, D. Ludlow, and C. Baranzelli, (eds.), 2021: Smart and Sustainable Planning for Cities and Regions. Springer International Publishing, Cham, Switzerland, 307 pp.
Black, A. and P. Fraser, 2002: Stock market short-termism—an international perspective. J. Multinatl. Financ. Manag. , 12(2) , 135–158, doi:10.1016/S1042-444X(01)00044-5.
BlackRock, 2021: Climate Finance Partnership – Institutional | BlackRock. https://www.blackrock.com/institutions/en-us/strategies/alternatives/real-assets/infrastructure/climate-finance-partnership (Accessed October 30, 2021).
Blanchard, O. and D. Leigh, 2013: Growth Forecast Errors and Fiscal Multipliers. IMF Working Paper 13/1, IMF, Washington DC, USA, 42 pp. https://www.imf.org/external/pubs/ft/wp/2013/wp1301.pdf (Accessed November 1, 2021).
Bleeker and Abdulkadri, 2020: A review of Caribbean national statistical legislation in relation to the United Nations Fundamental Principles of Official Statistics. Economic Commission for Latin America and the Caribbean (ECLAC). https://www.cepal.org/en/publications/45100-review-caribbean-national-statistical-legislation-relation-united-nations(Accessed October 27, 2021).
Blended Finance Taskforce, 2018a: Better finance better world. Consultation paper of the Blended Finance Taskforce. Business & Sustainable Development Commission - Blended Finance Taskforce, London, UK, 119 pp. http://s3.amazonaws.com/aws-bsdc/BFT_BetterFinance_final_01192018.pdf#asset:614:url (Accessed November 1, 2021).
Blended Finance Taskforce, 2018b: Blended Finance Taskforce calls to scale up the issuance and use of development guarantees. Business & Sustainable Development Commission - Blended Finance Taskforce, London, UK, 7 pp.
BNEF, 2019: Clean Energy Investment Trend 2018. Bloomberg NEF, New York, USA, 51 pp. https://data.bloomberglp.com/professional/sites/24/BNEF-Clean-Energy-Investment-Trends-2018.pdf (Accessed November 1, 2021).
Boamah, F., 2020: Desirable or debatable? Putting Africa’s decentralised solar energy futures in context. Energy Res. Soc. Sci. , 62, 101390, doi:10.1016/j.erss.2019.101390.
Bodle, R. and V. Noens, 2018: Climate Finance: Too Much on Detail, Too Little on the Big Picture?Carbon & Clim. Law Rev. , 12(3) , 248–257, doi:10.21552/cclr/2018/3/11.
Boffo, R. and R. Patalano, 2020: ESG Investing: Practices, Progress and Challenges. OECD, Paris, France, 85 pp. https://www.oecd.org/finance/ESG-Investing-Practices-Progress-Challenges.pdf (Accessed November 1, 2021).
Boissinot, J., D. Huber, and G. Lame, 2016: Finance and climate. OECD J. Financ. Mark. Trends, 2015(1) , 7–23, doi:10.1787/fmt-2015-5jrrz76d5td5.
Bolton, P. and M. Kacperczyk, 2021: Do investors care about carbon risk?J. Financ. Econ. , 142(2) , 517–549, doi:10.1016/j.jfineco.2021.05.008.
Bolton, P., M. Despres, L.A. Pereira Da Silva, F. Samama, and R. Svartzman, 2020: The green swan - Central banking and financial stability in the age of climate change. Bank of International Settlement, Basel, Switzerland, 107 pp. https://www.bis.org/publ/othp31.pdf (Accessed November 1, 2021).
Bond, E.W., J. Tybout, and H. Utar, 2015: Credit Rationing, Risk Aversion, and Industrial Evoluation in Developing Countries. Int. Econ. Rev. , 56(3) , 695–722, doi:10.1111/iere.12119.
Borge, L.-E. and A.O. Hopland, 2020: Less fiscal oversight, more adjustment. Eur. J. Polit. Econ. , 63 (June 2019), 101893, doi:10.1016/j.ejpoleco.2020.101893.
Borio, C., 2014: The financial cycle and macroeconomics: What have we learnt?J. Bank. Financ. , 45, 182–198, doi:10.1016/j.jbankfin.2013.07.031.
Borio, C., M. Drehmann, and D. Xia, 2018: The financial cycle and recession risk. BIS Quarterly Review December2018, BIS, Basel, Switzerland, 13 pp. https://www.bis.org/publ/qtrpdf/r_qt1812g.pdf (Accessed November 1, 2021).
Bos, K. and J. Gupta, 2019: Stranded assets and stranded resources: Implications for climate change mitigation and global sustainable development. Energy Res. Soc. Sci. , 56 (June), 101215, doi:10.1016/j.erss.2019.05.025.
Bougrine, H., 2012: Fiscal austerity, the Great Recession and the rise of new dictatorships. Rev. Keynes. Econ. , 0(1) , 109–125, doi:10.4337/roke.2012.01.07.
Bovari, E., G. Giraud, and F. Mc Isaac, 2018: Coping With Collapse: A Stock-Flow Consistent Monetary Macrodynamics of Global Warming. Ecol. Econ. , 147, 383–398, doi:10.1016/j.ecolecon.2018.01.034.
Bovenberg, A.L. and R.A. de Mooij, 1994: Environmental levies and distortionary taxation. Am. Econ. Rev. , 84(4) , 1085–1089.
Bracking, S. and B. Leffel, 2021: Climate finance governance: Fit for purpose?WIREs Clim. Change, 12(4) , doi:10.1002/wcc.709.
Braga, J.P., W. Semmler, and D. Grass, 2021: De-risking of green investments through a green bond market – Empirics and a dynamic model. J. Econ. Dyn. Control, 131, 104201, doi:10.1016/J.JEDC.2021.104201.
Braungardt, S., J. van den Bergh, and T. Dunlop, 2019: Fossil fuel divestment and climate change: Reviewing contested arguments. Energy Res. & Soc. Sci. , 50, 191–200, doi:10.1016/j.erss.2018.12.004.
Brida, J.G., E.J.S. Carrera, and V. Segarra, 2020: Clustering and regime dynamics for economic growth and income inequality. Struct. Chang. Econ. Dyn. , 52, 99–108, doi:10.1016/j.strueco.2019.09.010.
Broberg, M. and E. Hovani-Bue, 2019: Disaster Risk Reduction through Risk Pooling: The Case of Hazard Risk Pooling Schemes. In: The Cambridge Handbook of Disaster Risk Reduction and International Law[Samuel, K.L.H., M. Aronsson-Storrier, and K.N. Bookmiller, (eds.)]. Cambridge University Press, Cambridge, UK, pp. 257–274.
Broeks, M.J. et al., 2020: A social cost-benefit analysis of meat taxation and a fruit and vegetables subsidy for a healthy and sustainable food consumption in the Netherlands. BMC Public Health, 20(1) , 643, doi:10.1186/s12889-020-08590-z.
Broome, J., 2012: Climate matters: Ethics in a warming world. W.W. Norton & Company, New York, USA, 224 pp.
Broome, J. and D. Foley, 2016: A world climate bank. In: Institutions for future generation[González-Ricoy, I. and A. Gosseries, (eds.)]. Oxford University Press, Oxford, UK.
Brown, J., N. Bird, and L. Schalatek, 2010: Climate Finance Additionality: Emerging Definitions and theirImplications. Climate Finance Policy Brief No.2, ODI and Heinrich Boll Foundation, London, UK, and Berlin, Germany., 11 pp.
Brown, J. et al., 2015: Estimating mobilized private finance for adaptation: exploring data and methods. Climate Policy Initiative and OECD. London, UK and Berlin, Germany. http://climatepolicyinitiative.org/wp-content/uploads/2015/11/Estimating-mobilized-private-finance-for-adaptation-Exploring-data-and-methods. pdf (2015) (Accessed November 1, 2021).
Brugmann, J., 2012: Financing the resilient city. Environ. Urban. , 24(1) , 215–232, doi:10.1177/0956247812437130.
Brunner, S. and K. Enting, 2014: Climate finance: A transaction cost perspective on the structure of state-to-state transfers. Glob. Environ. Chang. , 27, 138–143, doi:10.1016/j.gloenvcha.2014.05.005.
Brunner, S., C. Flachsland, and R. Marschinski, 2012: Credible commitment in carbon policy. Clim. Policy, 12(2) , 255–271, doi:10.1080/14693062.2011.582327.
Buchner, B. et al., 2013: The Global Landscape of Climate Finance 2013. Climate Policy Initiative, London, UK, 54 pp. https://www.climatepolicyinitiative.org/wp-content/uploads/2013/10/The-Global-Landscape-of-Climate-Finance-2013.pdf (Accessed November 1, 2021).
Buchner, B. et al., 2019: Global Landscape of Climate Finance 2019. Climate Policy Initiative, London, UK, 36 pp. https://www.climatepolicyinitiative.org/wp-content/uploads/2019/11/2019-Global-Landscape-of-Climate-Finance.pdf (Accessed November 1, 2021).
Buhr, B. et al., 2018: Climate Change and the Cost of Capital in Developing Countries. Imperial College London, UK; SOAS University of London, UK; UN Environment, London, UK, and Geneva, Switzerland, 32 pp. https://eprints.soas.ac.uk/26038/ (Accessed November 1, 2021).
Bulow, J. and K. Rogoff, 2005: Grants versus Loans for Development Banks. Am. Econ. Rev. , 95(2) , 393–397, doi:10.1257/000282805774669727.
Bulow, J., C.M. Reinhart, K. Rogoff, and C. Trebesch, 2020: The debt pandemic: new steps are needed to improve sovereign debt workouts. IMF Finance & Development . https://www.imf.org/external/pubs/ft/fandd/2020/09/debt-pandemic-reinhart-rogoff-bulow-trebesch.htm (Accessed November 1, 2021).
Burrow, S., 2017: Foreword: The Imperative of a Just Transition. In: Just Transition: A Report for the OECD, Just Transition Centre, ITUC, Brussels, Belgium, pp. 1–2.
Bushee, B.J., 2001: Do Institutional Investors Prefer Near-Term Earnings over Long-Run Value?Contemp. Account. Res. , 18(2) , 207–246, doi:10.1506/J4GU-BHWH-8HME-LE0X.
C40 Cities Climate Leadership Group, 2016: C40 Cities Alliance Creditworthiness 2016. C40 Cities, London, UK, New York, NY, USA, and Rio de Janeiro, Brazil, 18 pp. http://c40-production-images.s3.amazonaws.com/good_practice_briefings/images/6_C40_GPG_Creditworthiness.original.pdf?1456788925 (Accessed November 1, 2021).
C40 Cities Climate Leadership Group, 2018: Clean Energy Business Model Manual. C40 Cities, London, UK, 66 pp (Accessed November 1, 2021).
Caldecott, B., 2020: Post Covid-19 stimulus and bailouts need to be compatible with the Paris Agreement. J. Sustain. Financ. & Invest. , 0(0) , 1–8, doi:10.1080/20430795.2020.1809292.
Campiglio, E., 2016: Beyond carbon pricing: The role of banking and monetary policy in financing the transition to a low-carbon economy. Ecol. Econ. , 121, 220–230, doi:10.1016/j.ecolecon.2015.03.020.
Campiglio, E. et al., 2018: Climate change challenges for central banks and financial regulators. Nat. Clim. Change, 8(6) , 462–468, doi:10.1038/s41558-018-0175-0.
Canuto, O. and L. Liu, 2010: Subnational Debt Finance and the Global Financial Crisis. Economic Premise, World Bank, Washington, DC, USA, 7 pp. http://documents1.worldbank.org/curated/en/637331468159337803/pdf/545070BRI0EP130Box349420B01PUBLIC1.pdf (Accessed November 1, 2021).
Cao, X., C. Jin, and W. Ma, 2021: Motivation of Chinese commercial banks to issue green bonds: Financing costs or regulatory arbitrage?China Econ. Rev. , 66, 101582, doi:10.1016/j.chieco.2020.101582.
Capgemini, 2021: World Wealth Report 2021. Capgemini, Paris, France, 51 pp. https://worldwealthreport.com/resources/world-wealth-report-2021/ (Accessed September 12, 2021).
Carley, S. and D.M. Konisky, 2020: The justice and equity implications of the clean energy transition. Nat. Energy, 5(8) , 569–577, doi:10.1038/s41560-020-0641-6.
Carney, M., 2015: Breaking the Tragedy of the Horizon–climate change and financial stability. Speech at Lloyd’s of London, UK, https://www.bankofengland.co.uk/.
Carney, M., 2019: A New Horizon. Speech at European Commission Conference, Brussels, Belgium: A global approach to sustainable finance. Bank of England, London, UK, https://www.bankofengland.co.uk/-/media/boe/files/speech/2019/a-new-horizon-speech-by-mark-carney (Accessed November 1, 2021).
Carrasco, B., 2018: ADB as a Responsible Development Partner: The India Infrastructure Finance Company Limited (IIFCL) Case Study. The KDI-ADB Workshop on Corporate Governance and SOE Reform, Seoul, Republic of Korea, https://events.development.asia/system/files/materials/2018/06/201806-adb-responsible-developments-partner-india-infrastructure-finance-company-limited-iifcl-case.pdf (Accessed November 1, 2021).
Carty, T. and A. Le Comte, 2018: Climate Finance Shadow Report 2018: Assessing progress towards the $100 billion commitment . Oxfam International, Oxford, 28 pp, https://www.oxfam.org/en/research/climate-finance-shadow-report-2016 (Accessed November 1, 2021).
Carty, T., J. Kowalzig, and A. Peterson, 2016: Climate Finance Shadow Report: Lifting the Lid on Progress towards the $100 Billion Commitment . Oxfam International, Oxford, UK, 24 pp. https://www.oxfam.org/sites/www.oxfam.org/files/file%7B%5C_%7Dattachments/bp-climate-finance-shadow-report-031116-en.pdf (Accessed November 1, 2021).
Carty, T., J. Kowalzig, and B. Zagema, 2020: Climate Finance Shadow Report 2020: Assessing progress towards the $100 billion commitment . Oxfam International, Oxford, 31 pp, https://www.oxfam.org/en/research/climate-finance-shadow-report-2020 (Accessed November 1, 2021).
Cattaneo, C., 2019: Internal and external barriers to energy efficiency: which role for policy interventions?Energy Effic. , 12(5) , 1293–1311, doi:10.1007/s12053-019-09775-1.
Cavallo, E.A. and A. Powell, 2019: 2019 Latin American and Caribbean Macroeconomic Report: Building Opportunities toGrow in a Challenging World. Inter-American Development Bank, Washington, DC, USA, doi: 10.18235/0001633.
CBI, 2015: Scaling up green bond markets for sustainable development . Climate Bonds Initiative (CBI), London, UK, 52 pp.
CBI, 2018: Climate Bonds Taxonomy. Climate Bonds Initiative (CBI), London, UK, 16 pp. https://www.climatebonds.net/files/files/CBI-Taxonomy-Sep18.pdf (Accessed November 1, 2021).
CBI, 2019a: Green Bonds: The State of the Market 2018. Climate Bonds Initiative (CBI), London, UK, 28 pp. https://www.climatebonds.net/resources/reports/green-bonds-state-market-2018 (Accessed November 1, 2021).
CBI, 2019b: Green Bond Pricing in the Primary Market: January – June 2019. Climate Bonds Initiative (CBI), London, UK, 24 pp. https://www.climatebonds.net/files/files/CBI_GB_Pricing_H1_2019_final.pdf (Accessed November 1, 2021).
CBI, 2020a: Green Bond Treasurer Survey 2020. Climate Bonds Initiative (CBI), London, UK, 24 pp. https://www.climatebonds.net/files/reports/climate-bonds-gb-treasurer-survey-2020-14042020final.pdf (Accessed November 1, 2021).
CBI, 2020b: Green Bonds: The State of the Market 2019. Climate Bonds Initiative (CBI), London, UK, 16 pp. https://www.climatebonds.net/files/reports/cbi%7B%5C_%7Dsotm%7B%5C_%7D2019%7B%5C_%7Dvol1%7B% 5C_%7D04d.pdf (Accessed November 1, 2021).
CBI, 2021 a: Sustainable Debt: Global State of the Market 2020. Climate Bonds Initiative (CBI), London, UK, 30 pp.
CBI, 2021 b: Post-issuance reporting in the green bond market . Climate Bonds Initiative (CBI), London, UK, 58 pp. https://www.climatebonds.net/files/reports/cbi_post_issuance_2021_02f.pdf (Accessed November 1, 2021).
CBI, GCA, and EBRD, 2021: Green Bonds for Climate Resilience. State of Play and Roadmap to Scale. Climate Bonds Initiative (CBI), London, UK, Global Center on Adaptation (GCA), Rotterdam, The Netherlands, and the European Bank for Reconstruction and Development (EBRD), 10 pp.
CCFLA, 2015: The State of City Climate Finance 2015. Cities Climate Finance Leadership Alliance (CCFLA), New York, NY, USA, 68 pp.http://www.citiesclimatefinance.org/2015/12/the-state-of-city-climate-finance-2015-2/ (Accessed November 1, 2021).
CCRIF SPC, 2018: Annual Report 2017-2018. The Caribbean Catastrophe Risk Insurance Facility (CCRIF SPC), Grand Cayman, Cayman Islands, 106 pp.
CCRIF SPC, 2019: The Caribbean Oceans and Aquaculture Sustainability Facility. The Caribbean Catastrophe Risk Insurance Facility (CCRIF SPC), Grand Cayman, Cayman Islands, 13 pp. https://www.ccrif.org/sites/default/files/publications/CCRIFSPC_COAST_Brochure_July2019.pdf (Accessed November 1, 2021).
CDSB and CDP, 2018: Ready or not: Are companies prepared for the TCFD recommendations? A geographical analysis of CDP 2017 responses. Climate Disclosure Standards Board (CDSB) and Carbon Disclosure Project (CDP), 34 pp. https://www.cdsb.net/sites/default/files/tcfd%7B%5C_%7Dpreparedness%7B%5C_%7Dreport%7B% 5C_%7Dfinal.pdf (Accessed November 1, 2021).
CDSB, and SASB, 2019: Using SASB Standards and the CDSB Framework to Enhance Climate-Related Financial Disclosures in Mainstream Reporting TCFD Implementation Guide. Climate Disclosure Standards Board (CDSB) and 61 pp. https://www.cdsb.net/tcfd-implementation-guidef (Accessed November 1, 2021).
Cevik, S. and J.T. Jalles, 2020: Feeling the Heat: Climate Shocks and Credit Ratings. IMF, Washington DC, USA, 22 pp. https://www.imf.org/en/Publications/WP/Issues/2020/12/18/Feeling-the-Heat-Climate-Shocks-and-Credit-Ratings-49945.
Chan, G., L. Forsberg, P. Garnaas-Halvorson, S. Holte, and D. Kim, 2018: Issue Linkage in the Climate Regime: Gender policies in climate finance. Center for Science, Technology, and Environmental Policy, Minneapolis, MN, USA, 49 pp. https://conservancy.umn.edu/bitstream/handle/11299/201625/Gender_in_Climate_Finance_Review_20180913_FULL.pdf?sequence=1&isAllowed=y (Accessed November 1, 2021).
Chancel, L. and T. Piketty, 2015: Carbon inequality: from Kyoto to Paris - Trends in the global inequality of carbon emissions (1998-2013) & prospects for an equitable adaptation fund. Paris School of Economics, Paris, France, 48 pp.
Chang, C.C., E. Fernandez-Arias, and L. Serven, 1998: Measuring Aid Flows: A New Approach. SSRN Electron. J. , 1817185, doi:10.2139/ssrn.1817185.
Chasin, F., U. Paukstadt, T. Gollhardt, and J. Becker, 2020: Smart energy driven business model innovation: An analysis of existing business models and implications for business model change in the energy sector. J. Clean. Prod. , 269, 122083, doi:10.1016/j.jclepro.2020.122083.
Chen, D. et al., 2020: Bridging the gaps and mitigating the risks: Tackling the challenges of sustainable cross-border energy infrastructure finance. G20 Insights, 14 pp. https://www.g20-insights.org/policy%7B%5C_%7Dbriefs/bridging-the-gaps-and-mitigating-the-risks-tackling-the-challenges-of-sustainable- cross-border-energy-infrastructure-finance/ (Accessed November 1, 2021).
Chenet, H., J. Ryan-Collins, and F. van Lerven, 2021: Finance, climate-change and radical uncertainty: Towards a precautionary approach to financial policy. Ecol. Econ. , 183, 106957, doi:10.1016/j.ecolecon.2021.106957.
Cherif, R. and F. Hasanov, 2018: The volatility trap: Precautionary saving, investment, and aggregate risk. Int. J. Financ. & Econ. , 23(2) , 174–185, doi:10.1002/ijfe.1610.
Chirambo, D., 2016: Integrating Microfinance, Climate Finance and Climate Change Adaptation: A Sub-Saharan Africa Perspective. In: Climate Change Adaptation, Resilience and Hazards[Leal Filho, W., H. Musa, G. Cavan, P. O’Hare, and J. Seixas, (eds.)]. Climate Change Management series, Springer International Publishing, Cham, Switzerland, pp. 195–207.
Chiroleu-Assouline, M. and M. Fodha, 2014: From regressive pollution taxes to progressive environmental tax reforms. Eur. Econ. Rev. , 69, 126–142, doi:10.1016/j.euroecorev.2013.12.006.
Christophers, B., 2017: Climate Change and Financial Instability: Risk Disclosure and the Problematics of Neoliberal Governance. Ann. Am. Assoc. Geogr. , 107(5) , 1108–1127, doi:10.1080/24694452.2017.1293502.
CICERO, 2015: Shades of Green. https://www.cicero.oslo.no/en/posts/single/cicero-shades-of-green (Accessed August 8, 2019).
CIF, 2018: Microfinance for Climate Adaptation: From Readiness to Resilience. Climate Investment Funds (CIF), Washington DC, USA, 37 pp. https://www.climateinvestmentfunds.org/sites/cif_enc/files/knowledge-documents/micro-finance_research_brief.pdf .
CISL and UNEP FI, 2014: Stability and sustainability in banking reform: Are environmental risks missing in Basel III?Cambridge Institute for Sustainability Leadership (CISL), Cambridge, UK, and United Nations Environment Programme Finance Initiative (UNEP FI), Geneva, Switzerland, 39 pp. https://www.unepfi.org/fileadmin/documents/StabilitySustainability.pdf (Accessed November 1, 2021).
Clapp, C., J. Ellis, J. Benn, and J. Corfee-Morlot, 2012: Tracking Climate Finance: What and How?, OECD, Paris, 44 pp. https://www.oecd.org/env/cc/50293494.pdf (Accessed November 1, 2021).
Clark, C.E., 2018: Energy Savings Performance Contracts (ESPCs) and Utility Energy Service Contracts (UESCs). LIBRARY OF CONGRESS WASHINGTON DC, Washington DC, USA, 16 pp. https://fas.org/sgp/crs/misc/R45411.pdf (Accessed November 1, 2021).Clark, R., J. Reed, and T. Sunderland, 2018: Bridging funding gaps for climate and sustainable development: Pitfalls, progress and potential of private finance. Land use policy, 71, 335–346, doi:10.1016/j.landusepol.2017.12.013.
Clarke, L., K. Jiang, K. Akimoto, M. Babiker, G. Blanford, K. Fisher-Vanden, J.-C. Hourcade, V. Krey, E. Kriegler, A. Löschel, D. McCollum, S. Paltsev, S. Rose, P.R. Shukla, M. Tavoni, B.C.C. van der Zwaan, and D.P. van Vuuren, 2014: Assessing Transformation Pathways. In: Climate Change 2014: Mitigation of Climate Change. Contribution of Working Group III to the Fifth Assessment Report of the Intergovernmental Panel on Climate Change[Edenhofer, O., R. Pichs-Madruga, Y. Sokona, E. Farahani, S. Kadner, K. Seyboth, A. Adler, I. Baum, S. Brunner, P. Eickemeier, B. Kriemann, J. Savolainen, S. Schlömer, C. von Stechow, T. Zwickel and J.C. Minx (eds.)]. Cambridge University Press, Cambridge, UK, and New York, NY, USA, pp. 413–510.
Cleary, K. and K. Palmer, 2019: Energy-as-a-Service: A Business Model for Expanding Deployment of Low-Carbon Technologies. Resources for the Future, Washington DC, USA, 6 pp. https://media.rff.org/documents/IB_19-09_EaaS.pdf (Accessed November 1, 2021).
Climate-Related Market Risk Subcommittee, 2020: Managing Climate Risk in the U.S. Financial System. USCFTC, Washington DC, USA, 165 pp. https://www.cftc.gov/sites/default/files/2020-09/9-9-20 Report of the Subcommittee on Climate-Related Market Risk - Managing Climate Risk in the U.S. Financial System for posting.pdf (Accessed November 1, 2021).
Climate Funds Update, 2014: Climate Funds Update: Data Dashboard. https://climatefundsupdate.org/data-dashboard/ (Accessed October 10, 2019).
Climate Transparency, 2020: The Climate Transparency Report 2020, Climate Transparency, Berlin, Germany. 69 pp.
Coady, D., I. Parry, L. Sears, and B. Shang, 2017: How Large Are Global Fossil Fuel Subsidies?World Dev. , 91, 11–27, doi:10.1016/j.worlddev.2016.10.004.
Coady, D., I. Parry, N.-P. Le, and B. Shang, 2019: Global Fossil Fuel Subsidies Remain Large: An Update Based on Country-Level Estimates. IMF, Washington DC, USA, 39 pp. https://www.imf.org/en/Publications/WP/Issues/2019/05/02/Global-Fossil-Fuel-Subsidies-Remain-Large-An-Update-Based-on-Country-Level-Estimates-46509 (Accessed August 18, 2021).
Coalition of Finance Ministers for Climate Action, 2020: Better Recovery, Better World: Resetting Climate Action in the Aftermath of the COVID-19 Pandemic, Coalition of Finance Ministers for Climate Action, Washington, DC, USA.
Cochran, I. and A. Pauthier, 2019: A Framework for Alignment with the Paris Agreement: Why, What and How for Financial Insitutions? Institute of Climate Economics, Paris, France 51 pp.
Coeurdacier, N. and H. Rey, 2013: Home Bias in Open Economy Financial Macroeconomics. J. Econ. Lit. , 51(1) , 63–115, doi:10.1257/jel.51.1.63.
Coffin, M. and A. Grant, 2019: Balancing the Budget: Why deflating the carbon bubble requires oil and gas companies to shrink. Carbon Tracker Initiative, London, UK, 55 pp. https://www.carbontracker.org/reports/balancing-the-budget/ (Accessed November 1, 2021).
Cohen-Shacham, E., G. Walters, C. Janzen, and S. Maginnis (eds.), 2016: Nature-based solutions to address global societal challenges. IUCN: Gland, Switzerland, 97, pp.2016–2036.
Colenbrander, S., D. Dodman, and D. Mitlin, 2018a: Using climate finance to advance climate justice: the politics and practice of channelling resources to the local level. Clim. Policy, 18(7) , 902–915, doi:10.1080/14693062.2017.1388212.
Colenbrander, S., M. Lindfield, J. Lufkin, and N. Quijano, 2018b: Financing Low Carbon, Climate-Resilient Cities. Coalition for Urban Transitions. London and Washington, DC. Coalition for Urban Transitions C40 Climate Leadership Group, WRI Ross Center for Sustainable Cities, London, UK, and Washington DC, USA, 44 pp. https://citiesipcc.org/wp-content/uploads/2018/03/IPCC-Background-Paper-Financing-Low-Carbon-Climate-Resilient-Cities.pdf (Accessed November 1, 2021).
Collins, S. et al., 2016: Integrating short term variations of the power system into integrated energy system models: A methodological review. Renewable and Sustainable Energy Reviews, 76, pp.839–856. 35 pp.
Combet, E., F. Ghersi, J.-C. Hourcade, and C. Thubin, 2010: La fiscalité carbone au risque des enjeux d’équité. Rev. française d’économie, 25(2) , 59–91, doi:10.3406/rfeco.2010.1805.
Commonwealth Secretariat, 2016: ClimateRisk Management: Opportunities and Challenges for Risk Pooling. The Commonwealth Small States Digest, 28 pp. doi: 10.14217/5jln4p72226b-en.
Consolandi, C., R.G. Eccles, and G. Gabbi, 2020: How material is a material issue? Stock returns and the financial relevance and financial intensity of ESG materiality. J. Sustain. Financ. Invest. , 1–24, doi:10.1080/20430795.2020.1824889.
Convergence, 2019: The use of guarantees in blended finance. Convergence, Toronto, Canada, July 30.
Convergence, 2020: The State of Blended Finance 2020. Convergence, Toronto, Canada, 67 pp.
Cook, M.J. and E.K. Chu, 2018: Between Policies, Programs, and Projects: How Local Actors Steer Domestic Urban Climate Adaptation Finance in India. In: Climate Change in Cities. The Urban Book Series[Hughes, S., E. Chu, and S. Mason, (eds.)]. Springer, Cham, Switzerland, pp. 255–277.
Copland, S., 2020: Anti-politics and Global Climate Inaction: The Case of the Australian Carbon Tax. Crit. Sociol. , 46(4–5) , 623–641, doi:10.1177/0896920519870230.
Cornell, B., 2020: ESG Investing: Conceptual Issues. J. Wealth Manag. , 23(3) , 61–69, doi:10.3905/jwm.2020.1.117.
Covington, C., 2020: Loan Guarantees. Confluence Philanthropy. https://www.confluencephilanthropy.org/Loan-Guarantees (Accessed October 14, 2021).
CPI, 2020: Examining the Climate Finance Gap for Small-Scale Agriculture. Climate Policy Initiative (CPI), https://www.climatepolicyinitiative.org/wp-content/uploads/2020/11/Examining-the-Climate-Finance-Gap-in-Small-Scale-Agriculture.pdf (Accessed November 1, 2021).
Credit Suisse, 2020: Global Wealth Report 2020. Credit Suisse, Zurich, Switzerland, 55 pp.
Crick, F., S.M. Eskander, S. Fankhauser, and M. Diop, 2018: How do African SMEs respond to climate risks? Evidence from Kenya and Senegal. World Dev. , 108, 157–168.
Crowe, J.A. and R. Li, 2020: Is the just transition socially accepted? Energy history, place, and support for coal and solar in Illinois, Texas, and Vermont. Energy Res. Soc. Sci. , 59, 101309, doi:10.1016/j.erss.2019.101309.
Cunningham, W. and A. Schmillen, 2021: The Coal Transition: Mitigating Social and Labor Impacts. World Bank, Washington DC, USA, 42 pp. https://openknowledge.worldbank.org/bitstream/handle/10986/35617/The-Coal-Transition-Mitigating-Social-and-Labor-Impacts.pdf?sequence= 1&isAllowed=y (Accessed November 1, 2021).
Cuntz, C., A. Afanador, N. Klein, F. Barrera, and R. Sharma, 2017: Connecting multilateral climate finance to mitigation projects A guide to the multilateral climate finance landscape of NAMAs Mountain Ecosystem Services View project NBS and Sustainable Urbanization View project . Ecofys, Utrecht, Netherlands, 48 pp. https://www.researchgate.net/publication/320197254 (Accessed November 1, 2021).
Curtis, M, 2016: The New Colonialism – Britain’s Scramble for Africa’s energy and mineral resources. War on Want, London, 37 pp. https://waronwant.org/resources/new-colonialism-britains-scramble-africas-energy-and-mineral-resources (Accessed November 1, 2021).
Cziesielski, M.J. et al., 2021: Investing in blue natural capital to secure a future for the Red Sea ecosystems. Front. Mar. Sci. , 7 (January), doi:10.3389/fmars.2020.603722.
D’Orazio, P., 2021: Towards a post-pandemic policy framework to manage climate-related financial risks and resilience. Clim. Policy, 0(0) , 1–15, doi:10.1080/14693062.2021.1975623.
D’Orazio, P. and L. Popoyan, 2019: Fostering green investments and tackling climate-related financial risks: Which role for macroprudential policies?Ecol. Econ. , 160 (July 2018), 25–37, doi:10.1016/j.ecolecon.2019.01.029.
Dafermos, Y., M. Nikolaidi, and G. Galanis, 2018: Climate Change, Financial Stability and Monetary Policy. Ecol. Econ. , 152, 219–234, doi:10.1016/j.ecolecon.2018.05.011.
Dafermos, Y., D. Gabor, and J. Michell, 2021: The Wall Street Consensus in pandemic times: what does it mean for climate-aligned development?Can. J. Dev. Stud. , 42(1–2) , 238–251, doi:10.1080/02255189.2020.1865137.
Dalla Longa, F. and B. van der Zwaan, 2021: Heart of light: an assessment of enhanced electricity access in Africa. Renew. Sustain. Energy Rev. , 136, 110399, doi:10.1016/j.rser.2020.110399.
DANIDA, 2018: Review of the Climate Technology Centre and Network (CTCN). Danish International Development Agency (DANIDA), Copenhagen, Denmark, 46 pp.
Dasgupta, A. and D. Ziblatt, 2015: How Did Britain Democratize? Views from the Sovereign Bond Market. J. Econ. Hist. , 75(1) , 1–29, doi:10.1017/S0022050715000017.
Dasgupta, A. and D.F. Ziblatt, 2016: Capital Meets Democracy: Representative Institutions and the Rise of Mass Suffrage in Sovereign Bond Markets. SSRN Electron. J. , 2768848, doi:10.2139/ssrn.2768848.
Dasgupta, D., J.C. Hourcade, and S. Nafo, 2019: A Climate Finance Initiative To Achieve the Paris Agreement and Strenghten Sustainable Development. HAL, Lyon, France. https://hal.archives-ouvertes.fr/hal-02121231 (Accessed November 1, 2021).
Dasgupta, P., 2021: The Economics of Biodiversity: The Dasgupta Review. HM Treasury, London, UK, 602 pp. https://www.gov.uk/government/collections/the-economics-of-biodiversity-the-dasgupta-review (Accessed November 1, 2021).
Davidovic, S., M.E. Loukoianova, C. Sullivan, and H. Tourpe, 2019: Strategy for Fintech Applications in the Pacific Island Countries. International Monetary Fund, Washington, DC, USA, 66 pp. https://www.imf.org/%7B~%7D/media/Files/Publications/DP/2019/English/sfapicea.ashx.
Davies, J.B., R. Lluberas, and A.F. Shorrocks, 2016: Estimating the level and distribution of global wealth, 2000–14. United Nations University World Institute for Development Economics Research (UNU-WIDER), Helsinki, Finland, 23 pp.
de Gouvello, C. and I. Zelenko, 2010: A Financing Facility for Low-Carbon Development in Developing Countries. The World Bank, Washington DC, USA, 56 pp.
de Guindos, L., 2021: Shining a light on climate risks: the ECB’s economy-wide climate stress test. European Central Bank Blog, March 18.
de Mooij, R.A., 2000: A survey of the double-dividend literature. In: Environmental Taxation and the Double Dividend[De Mooij, R.A., (ed.)]. Emerald Group Publishing Limited, Bingley, UK, pp. 11–28.
De Nederlandsche Bank, and PBL Netherlands Environmental Assessment Agency, 2020: Indebted to nature: Exploring biodiversity risks for the Dutch financial sector. Amsterdam, Netherlands and The Hague, Netherlands,https://www.dnb.nl/media/4c3fqawd/indebted-to-nature.pdf (Accessed November 1, 2021).
DeAngelis, K. and B. Tucker, 2020: Adding Fuel to the Fire: Export Credit Agencies and Fossil Fuel Finance. Oil Change International and Friends of the Earth — U.S. Washington, DC, USA. 15 pp. https://priceofoil.org/2020/01/30/g20-ecas-2020/ (Accessed November 1, 2021).
Déau, T. and J. Touati, 2018: Financing Sustainable Infrastructure. In: Coping with the Climate Crisis[Arezki, R., P. Bolton, K. El Aynaoui, and M. Obstfeld, (eds.)]. Columbia University Press, New York, NY, USA, pp. 167–178.
Delanoë, E., A. Gautier, and A.-C. Pache, 2021: What can philanthropy do for the climate? Strategic pathways for climate giving. Alliance, January 19.
Deleidi, M., M. Mazzucato, and G. Semieniuk, 2020: Neither crowding in nor out: Public direct investment mobilising private investment into renewable electricity projects. Energy Policy, 140 (February), 111195, doi:10.1016/j.enpol.2019.111195.
Dell’Anna, F., 2021: Green jobs and energy efficiency as strategies for economic growth and the reduction of environmental impacts. Energy Policy, 149, 112031, doi:10.1016/j.enpol.2020.112031.
Demirguc-Kunt, A., L. Klapper, D. Singer, S. Ansar, and J. Hess, 2018: The Global Findex Database 2017: Measuring Financial Inclusion and the Fintech revolution. World Bank Publications, Washington, DC, USA, http://hdl.handle.net/10986/29510 (Accessed November 1, 2021).
Deschryver, P. and F. de Mariz, 2020: What Future for the Green Bond Market? How Can Policymakers, Companies, and Investors Unlock the Potential of the Green Bond Market?J. Risk Financ. Manag. , 13(3) , 61, doi:10.3390/jrfm13030061.
Deutsche Bank Climate Change Advisors, 2011: Get FiT Plus: De-Risking Clean Energy Business Models in a Developing Country Context . Deutsche Bank Group, Frankfurt, Germany. https://www.osti.gov/etdeweb/servlets/purl/22090459 (Accessed November 1, 2021).
Deutsche Klimafinanzierung, 2020: InsuResilience Initiative and Global Partnership. Deutsche Klimafinanzierung. https://www.germanclimate finance.de/overview-climate-finance/channels-german-climate-finance/insuresilience/ (Accessed November 1, 2021).
DFID, 2020: International Development Infrastructure Commission: Recommendations Report . Department for International Development (DFID), London, UK, https://www.gov.uk/government/publications/international-development-infrastructure-commission-report (Accessed November 1, 2021).
Dibley, A., T. Wetzer, and C. Hepburn, 2021: National COVID debts: climate change imperils countries’ ability to repay. Nature, 592(7853) , 184–187, doi:10.1038/d41586-021-00871-w.
Dietz, S., A. Bowen, C. Dixon, and P. Gradwell, 2016: ‘Climate value at risk’ of global financial assets. Nat. Clim. Chang. , 6(7) , 676–679, doi:10.1038/nclimate2972.
Dixon, R. and E. Challies, 2015: Making REDD+ pay: Shifting rationales and tactics of private finance and the governance of avoided deforestation in Indonesia. Asia Pac. Viewp. , 56(1) , 6–20, doi:10.1111/apv.12085.
DNB, 2017: Waterproof?: An exploration of climate-related risks for the Dutch financial sector. De Nederlandsche Bank (DNB), Amsterdam, The Netherlands, 64 pp. https://www.dnb.nl/en/binaries/Waterproof% 7B%5C_%7Dtcm47-363851.pdf (Accessed November 1, 2021).
Donadelli, M., M. Jüppner, A. Paradiso, and C. Schlag, 2019: Temperature Volatility Risk. SSRN Electron. J. , 3333915, doi:10.2139/ssrn.3333915.
Donald, K. and S.-A. Way, 2016: Accountability for the Sustainable Development Goals: A Lost Opportunity?Ethics Int. Aff. , 30(2) , 201–213, doi:10.1017/S0892679416000083.
Donaldson, C. and S. Hawkes, 2018: Open Books: How development finance institutions can be transparent in their financial intermediary lending, and why they should be. Oxfam GB, Oxford, UK, 37 pp.
Dordmond, G., H.C. de Oliveira, I.R. Silva, and J. Swart, 2021: The complexity of green job creation: An analysis of green job development in Brazil. Environ. Dev. Sustain. , 23(1) , 723–746, doi:10.1007/s10668-020-00605-4.
Dorfleitner, G., L. Hornuf, M. Schmitt, and M. Weber, 2017: Definition of FinTech and Description of the FinTech Industry. In: FinTech in Germany[Dorfleitner, G., L. Hornuf, M. Schmitt, and M. Weber (eds.)]. Springer International Publishing, Cham, Switzerland, pp. 5–10.
Dorfleitner, G., S. Utz, and M. Wimmer, 2018: Patience pays off – corporate social responsibility and long-term stock returns. J. Sustain. Financ. Invest. , 8(2) , 132–157, doi:10.1080/20430795.2017.1403272.
Dosi, G., M. Napoletano, A. Roventini, and T. Treibich, 2017: Micro and macro policies in the Keynes+Schumpeter evolutionary models. J. Evol. Econ. , 27(1) , 63–90, doi:10.1007/s00191-016-0466-4.
Dowla, A., 2018: Climate change and microfinance. Bus. Strateg. & Dev. , 1(2) , 78–87, doi:10.1002/bsd2.13.
Draper, N., 2007: “Possessing Slaves”: Ownership, Compensation and Metropolitan Society in Britain at the time of Emancipation 1834-40. Hist. Work. J. , 64(1) , 74–102, doi:10.1093/hwj/dbm030.
Drempetic, S., C. Klein, and B. Zwergel, 2020: The Influence of Firm Size on the ESG Score: Corporate Sustainability Ratings Under Review. J. Bus. Ethics, 167(2) , 333–360, doi:10.1007/s10551-019-04164-1.
Druce, L., U. Moslener, C. Gruening, P. Pauw, and R. Connell, 2016: Demystifying adaptation finance for the private sector. UNEPNairobi, 87 pp. https://www.unepfi.org/publications/climate-change-publications/demystifying-adaptation-finance-for-private-sector/ (Accessed. November 1, 2021).
Drumheller, C., S. Denison, R. Ebel, and M. Martin, 2020: De-risking Renewable Energy Financing. First EAGE Workshop on Geothermal Energy and Hydro Power in Africa, Vol. 2020. European Association of Geoscientists & Engineers, Houten, Netherlands, pp. 1–5.
Dunz, N., A. Naqvi, and I. Monasterolo, 2021: Climate sentiments, transition risk, and financial stability in a stock-flow consistent model. J. Financ. Stab. , 54, 100872, doi:10.1016/j.jfs.2021.100872.
Dupre, S., T. Posey, T. Wang, and T. Jamison, 2018: Shooting for the Moon in a Hot Air Ballon?2° Investing Initiative Discussion Paper May 2018, 2° Investing Initiative, Paris, France, 25 pp.
Duyck, S., S. Jodoin, and A. Johl, (eds.), 2018: Routledge Handbook of Human Rights and Climate Governance. Routledge, Abingdon, UK, 52 pp.
Eastin, J., 2018: Climate change and gender equality in developing states. World Dev. , 107, 289–305, doi:10.1016/j.worlddev.2018.02.021.
EBA, 2020: Risk assessment of the European banking system. Publications Office of the European Union, Luxembourg, 94 pp. https://eba.europa.eu/sites/default/documents/files/document%7B%5C_%7Dlibrary/Risk, Accessed November 1, 2021).
Ebers Broughel, A. and N. Hampl, 2018: Community financing of renewable energy projects in Austria and Switzerland: Profiles of potential investors. Energy Policy, 123 (August), 722–736, doi:10.1016/j.enpol.2018.08.054.
EBRD, 2020: The EBRD just transition initiative: Sharing the benefits of a green economy transition and protecting vulnerable countires, regions and people from falling behind. EBRD, London, UK, 47 pp. https://www.ebrd.com/just-transition.
ECB, 2019: Financial Stability Review, May 2019. European Central Bank (ECB), Frankfurt, Germany, 156 pp. https://www.ecb.europa.eu/pub/financial-stability/fsr/html/ecb.fsr201905%7B~%7D266e856634.en.html (Accessed November 1, 2021).
EEA, 2019: Economic losses from climate-related extremes in Europe. European Environment Agency, Copenhagen, Denmark, 30 pp. https://www.eea.europa.eu/data-and-maps/indicators/direct-losses-from-weather-disasters-3/assessment-2# : , (Accessed November 1, 2021).
EEAC, 2016: International Scan 2016: Emerging Issues in an International Context. EEAC and Rli, The Hague, Netherlands, https://www.rli.nl/sites/default/files/international_scan_eeac-rli_webversie_def.pdf (Accessed November 1, 2021).
Egli, F., B. Steffen, and T.S. Schmidt, 2018: A dynamic analysis of financing conditions for renewable energy technologies. Nat. Energy, 3(12) , 1084–1092, doi:10.1038/s41560-018-0277-y.
Ehara, M. et al., 2019: REDD+ engagement types preferred by Japanese private firms: The challenges and opportunities in relation to private sector participation. For. Policy Econ. , 106 (September 2018), 101945, doi:10.1016/j.forpol.2019.06.002.
Ehlers, T. and F. Packer, 2017: Green bond finance and certification, BIS Quarterly Review September 2017, BIS, Basel, Switzerland, 89–104 pp. https://www.bis.org/publ/qtrpdf/r_qt1709h.pdf (Accessed November 1, 2021).
Ehlers, T., B. Mojon, and F. Packer, 2020: Green bonds and carbon emissions: exploring the case for a rating system at the firm-level. BIS Quarterly Review September 2020, BIS, Basel, Switzerland. pp. 31–47. https://www.bis.org/publ/qtrpdf/r_qt2009c.pdf (Accessed November 1, 2021).
EIB, 2012: An outline guide to Project Bonds Credit Enhancement and the Project Bond Initiative. European Investment Bank (EIB), Luxembourg, 27 pp. https://www.eib.org/attachments/documents/project_bonds_guide_ en.pdf (Accessed November 1, 2021).
EIB, 2018: European Investment Bank Financial Report 2017. European Investment Bank (EIB), Luxembourg, 251 pp. https://www.eib.org/en/publications/financial-report-2017 (Accessed December 31, 2020).
EIB, 2019: Investing in nature: Financing conservation and Nature-based Solutions. European Investment Bank (EIB), Luxembourg.
Eichengreen, B., D. Park, and K. Shin, 2021: The shape of recovery: Implications of past experience for the duration of the COVID-19 recession. J. Macroecon. , 69, 103330, doi:10.1016/j.jmacro.2021.103330.
EIOPA, 2018: European Insurance and Occupational Pensions Authority - Financial Stability Report December2018.EIOPA, Frankfurt, Germany.
Ekholm, T., H. Ghoddusi, V. Krey, and K. Riahi, 2013: The effect of financial constraints on energy-climate scenarios. Energy Policy, 59, 562–572, doi:10.1016/j.enpol.2013.04.001.
Elkhishin, S. and M. Mohieldin, 2021: External debt vulnerability in emerging markets and developing economies during the COVID-19 shock. Rev. Econ. Polit. Sci. , 6(1) , 24–47, doi:10.1108/REPS-10-2020-0155.
Emin, G., M. Lepetit, A. Grandjean, and O. Ortega, 2014: Massive financing of the energy transition. SFTE feasibility study: synthesis report. Energy renovation of public buildings. Association for the Financing of the Energy Transition, A.F.T.E.R, Paris, France, 37 pp.
Enbala, 2018: VIRTUAL POWER PLANTS: Coming Soon to a Grid Near You. Microgrid Knowledge, Newbury, NH, USA. https://microgridknowledge.com/virtual-power-plants-grid/ (Accessed November 1, 2021).
Environmental Defense Fund, 2019: The power of markets to increase ambition. Environmental Defense Fund, New York, USA. https://www.edf.org/sites/default/files/documents/Power_of_markets_to_increase_ambition.pdf (Accessed November 1, 2021).
ESMA, 2020: Consultation Paper: Draft advice to European Commission under Article 8 of the Taxonomy Regulation. European Securities and Markets Authority (ESMA), Paris, France, 102 pp. https://www.esma.europa.eu/press- news/consultations/consultation-paper-draft-advice-ec-under-article-8-taxonomy-regulation (Accessed November 1, 2021).
ESMAP, 2021: The State of Access to Modern Energy Cooking Services. Energy Sector Management Assistance Program (ESMAP), Washington DC, USA, 121 pp.
Espagne, E., 2018: Money, Finance and Climate: The Elusive Quest for a Truly Integrated Assessment Model. Comp. Econ. Stud. , 60(1) , 131–143, doi:10.1057/s41294-018-0055-7.
Essers, D., H.J. Blommestein, D. Cassimon, and P.I. Flores, 2016: Local Currency Bond Market Development in Sub-Saharan Africa: A Stock-Taking Exercise and Analysis of Key Drivers. Emerg. Mark. Financ. Trade, 52(5) , 1167–1194, doi:10.1080/1540496X.2015.1073987.
Essers, D., D. Cassimon, and M. Prowse, 2021: Debt-for-climate swaps: Killing two birds with one stone? Global Environmental Change Volume 71, doi: 10.1016/j.gloenvcha.2021.102407, Antwerp, Belgium, 4 pp.
Europe 2020 Project Bond Initiative, 2012: Innovative Infrastructure financing: the Project Bond Initiative, EIB, London, UK. 4 pp. https://www.eib.org/attachments/press-news-the-europe-2020-project-bond-initiative-07112012-en.pdf (Accessed November 1, 2021).
European Commission, 2020: Impact Assessment accompanying the document Stepping up Europe’s 2030 climate ambition. Investing in a climate-neutral future for the benefit of our people. Commission Staff Working Document, European Commission, Brussels, Belgium, 141 pp.
European Commission, 2021a: Questions and Answers - Emissions Trading – Putting a Price on carbon, July 14 2021.. European Commission, Brussels, Belgium.
European Commission, 2021b: Draft Report by Subgroup 4: Social Taxonomy. 61 pp. Platform on Sustainable Finance, Brussels, Belgium, https://ec.europa.eu/info/sites/default/files/business_economy_euro/banking_and_finance/documents/sf-draft-report-social-taxonomy-july2021_en.pdf (Accessed November 1, 2021).
European Council, 2020: European Council conclusions, 17-21 July 2020 - Consilium. European Council, Brussels, Belgium, https://www.consilium.europa.eu/media/45109/210720-euco-final-conclusions-en.pdf (Accessed November 1, 2021).
Eurosif, 2018: European SRI Study 2018. The European Sustainable Investment Forum (Eurosif), Brussels, Belgium, 114 pp. https://www.eurosif.org/ wp-content/uploads/2021/10/European-SRI-2018-Study.pdf (Accessed November 1, 2021).
Evain, J., M. Cardona, and M. Nicol, 2018: Article 173: Overview of climate-related financial dislosure after two years of implementation. Institute for Climate Economics, Paris, France, 4 pp. https://www.i4ce.org/en/publication/article-173-overview-of-climate-related-financial-dislosure-after-two-years-of-implementation/ (Accessed November 1, 2021).
Fama, E.F., 1970: Efficient Capital Markets: A Review of Theory and Empirical Work. J. Finance, 25(2) , 383, doi:10.2307/2325486.
Fama, E.F., 1991: Efficient Capital Markets: II. J. Finance, 46(5) , 1575, doi:10.2307/2328565.
Fama, E.F., 1997: Market Efficiency, Long-Term Returns, and Behavioral Finance. SSRN Electron. J. , doi:10.2139/ssrn.15108.
FAO, 2018: REDD + finance and investments, FAO, Rome, Italy.
Federici, S., 2014: From Commoning to Debt: Financialization, Microcredit, and the Changing Architecture of Capital Accumulation. South Atl. Q. , 113(2) , 231–244, doi:10.1215/00382876-2643585.
Feindouno, S., P. Guillaumont, and C. Simonet, 2020: The Physical Vulnerability to Climate Change Index: An Index to Be Used for International Policy. Ecol. Econ. , 176, 106752, doi:10.1016/J.ECOLECON.2020.106752.
Feldman, D., R. Jones-Albertus, and R. Margolis, 2018: Impact of Research and Development, Analysis, and Standardization on PV Project Financing Costs. National Renewable Energy Laboratory, Golden, CO, USA. https://www.nrel.gov/docs/fy18osti/70939.pdf (Accessed November 1, 2021).
Fenton, A., D. Gallagher, H. Wright, S. Huq, and C. Nyandiga, 2014: Up-scaling finance for community-based adaptation. Clim. Dev. , 6(4) , 388–397, doi:10.1080/17565529.2014.953902.
Fenton, A., J. Paavola, and A. Tallontire, 2015: Microfinance and climate change adaptation: an overview of the current literature. Enterp. Dev. Microfinance, 26(3) , 262–273, doi:10.3362/1755-1986.2015.023.
Fernandez, K., K. Casey, and N. Nikova, 2021: France’s Overdue Debt to Haiti. SSRN Electron. J. , doi:10.2139/ssrn.3798841.
Finance for Biodiversity Initiative, 2021: Greening Sovereign Debt: Building a Nature and Climate Sovereign Bond Facility. Finance for Biodiversity Initiative, London, UK, 44 pp. https://a1be08a4-d8fb-4c22-9e4a-2b2f4 cb7e41d.filesusr.com/ugd/643e85_021432a338a34c3e9223 7ffdd128404c.pdf (November 1, 2021).
FinansNorge, Forsikring & Pension, FFI, and Svensk Forsakring, 2013: Weather related damage in the Nordic countries-from an insurance perspective. FinansNorge, Forsikring & Pension, FFI, and Svensk Forsakring, Oslo, Norway, Hellerup, Denmark and Stockholm, Sweden. 42 pp.https://www.svenskforsakring.se/globalassets/rapporter/klimat/weather-related-damage-in-the-nordic-countries.pdf (Accessed November 1, 2021).
Finon, D., 2006: Incentives to invest in liberalised electricity industries in the North and South. Differences in the need for suitable institutional arrangements. Energy Policy, 34(5) , 601–618, doi:10.1016/j.enpol.2005.11.012.
Finon, D., 2019: Carbon policy in developing countries: Giving priority to non-price instruments. Energy Policy, 132 (September 2018), 38–43, doi:10.1016/j.enpol.2019.04.046.
Fisch-Romito, V. and C. Guivarch, 2019: Transportation infrastructures in a low carbon world: An evaluation of investment needs and their determinants. Transp. Res. Part D Transp. Environ. , 72, 203–219, doi:10.1016/j.trd.2019.04.014.
Flammer, C., 2020: Corporate Green Bonds. SSRN Electron. J. , doi:10.2139/ssrn.3125518.
Floater, G. et al., 2017a: Financing The Urban Transition: Policymakers’ Summary. Coalition for Urban Transitions. London, UK and Washington, USA. https://newclimateeconomy.report/workingpapers/wp-content/uploads/sites/5/2017/10/NCE2017_PolicyMakers_02012018.pdf (Accessed November 1, 2021).
Floater, G. et al., 2017b: Global Review of Finance For Sustainable Urban Infrastructure. Coalition for Urban Transitions, London, UK, and Washington USA, 60 pp. https://newclimateeconomy.report/workingpapers/wp-content/uploads/sites/5/2018/01/NCE2017%7B%5C_%7DCUT%7B%5C_%7DGlobalReview%7B%5C _%7D02012018.pdf (Accessed November 1, 2021).
Foley, 2009: The economic fundamentals of global warming. SFI WORKING PAPER: 2007-12-044, Sante Fe Institute, Santa Fe, USA. https://citeseerx.ist.psu.edu/viewdoc/download?doi=10.1.1.79.1173&rep=rep1&type=pdf (Accessed November 1, 2021).
Folke, C. et al., 2021: Our future in the Anthropocene biosphere. Ambio, 50(4) , 834–869, doi:10.1007/s13280-021-01544-8.
Font, B.C., P. Clerc, and M. Lemoine, 2018: Should euro area countries cut taxes on labour or capital in order to boost their growth?Econ. Model. , 71, 279–288, doi:10.1016/j.econmod.2017.12.019.
Fonta, W.M., E.T. Ayuk, T. van Huysen, and T. van Huysen, 2018: Africa and the Green Climate Fund: current challenges and future opportunities. Clim. Policy, 18(9) , 1210–1225, doi:10.1080/14693062.2018.1459447.
Forest, R., 2018: Climate Risk Insurance: Transparency, Participation and Accountability. An overview Assessment of Regional Risk Pools. Munich Climate Insurance Initiative, Bonn, Germany, 33 pp.
Forster, P.M. et al., 2020: Current and future global climate impacts resulting from COVID-19. Nat. Clim. Change, 10(10) , 913–919, doi:10.1038/s41558-020-0883-0.
Forzieri, G. et al., 2018: Escalating impacts of climate extremes on critical infrastructures in Europe. Glob. Environ. Change, 48, 97–107, doi:10.1016/j.gloenvcha.2017.11.007.
Foster, V. and A. Rana, 2020: Rethinking Power Sector Reform in the Developing World. World Bank, Washington DC, USA, 324 pp.
Fowler, N., 2015: Britain’s Slave Owner Compensation Loan, reparations and tax havenry. Tax Justice Network, June 9.
Fowlie, M., M. Greenstone, and C. Wolfram, 2018: Do Energy Efficiency Investments Deliver? Evidence from the Weatherization Assistance Program*. Q. J. Econ. , 133(3) , 1597–1644, doi:10.1093/qje/qjy005.
Foxon, T.J. et al., 2015: Low carbon infrastructure investment: extending business models for sustainability. Infrastruct. Complex. , 2(1) , 4, doi:10.1186/s40551-015-0009-4.
Frame, D.J. et al., 2020: Climate change attribution and the economic costs of extreme weather events: a study on damages from extreme rainfall and drought. Clim. Change, 162(2) , 781–797, doi:10.1007/s10584-020-02729-y.
Freeman, C. and F. Louçã, 2001: As Time Goes by: From the Industrial Revolutions to the Information Revolution. Oxford University Press, Oxford, UK.
Fresnillo, I., 2020a: The G20 Debt Service Suspension Initiative: Draining out the Titanic with a bucket?European Network on Debt and Development, Brussels, Belgium, https://dette-developpement.org/IMG/pdf/dssishadowreport.pdf (Accessed November 1, 2021).
Fresnillo, I., 2020b: Out of service: How public services and human rights are being threatened by the growing debt crisis. European Network on Debt and Development, Brussels, Belgium. https://www.eurodad.org/outofservice (Accessed November 1, 2021).
Friede, G., T. Busch, and A. Bassen, 2015: ESG and financial performance: aggregated evidence from more than 2000 empirical studies. J. Sustain. Financ. Invest. , 5(4) , 210–233, doi:10.1080/20430795.2015.1118917.
FS-UNEP Centre and BNEF, 2015: Global Trends in Renewable Energy Investment Report 2015. Frankfurt School – United Nations Environment Programme (FS-UNEP) Frankfurt, Germany, and Bloomberg New Energy Finance (BNEF).
FS-UNEP Centre and BNEF, 2016: Global Trends in Renewable Energy Investment Report 2016. Frankfurt School – United Nations Environment Programme (FS-UNEP) Frankfurt, Germany, and Bloomberg New Energy Finance (BNEF).
FS-UNEP Centre and BNEF, 2017: Global Trends in Renewable Energy Investment Report 2017. Frankfurt School – United Nations Environment Programme (FS-UNEP) Frankfurt, Germany, and Bloomberg New Energy Finance (BNEF).
FS-UNEP Centre and BNEF, 2018: Global Trends in Renewable Energy Investment Report 2018. Frankfurt School – United Nations Environment Programme (FS-UNEP) Frankfurt, Germany, and Bloomberg New Energy Finance (BNEF), 76 pp. https://fs-unep-centre.org/fileadmin/gtr/Global%7B%5C_%7DTrends%7B%5C_%7DReport (Accessed November 1, 2021).
FS-UNEP Centre and BNEF, 2019: Global Trends in Renewable Energy Investment Report 2019. Frankfurt School – United Nations Environment Programme (FS-UNEP) Frankfurt, Germany, and Bloomberg New Energy Finance (BNEF). https://fs-unep-centre.org/fileadmin/user%7B%5C_%7Dupload/GTR%7B%5C_%7D2019.pdf (Accessed November 1, 2021).
FS-UNEP Centre and BNEF, 2020: Global Trends in Renewable Energy Investment Report 2020. Frankfurt School – United Nations Environment Programme (FS-UNEP) Frankfurt, Germany, and Bloomberg New Energy Finance (BNEF), 79 pp. https://www.fs-unep-centre.org/wp-content/uploads/2020/06/GTR_2020.pdf (Accessed November 1, 2021).
FSD Africa, and CBI, 2020: Africa Green Bond Toolkit: A Practical Guide to Issuing Green Bonds for Africa. FSD Africa, and CBI, Nairobi, Kenya and London, UK, 27 pp. https://www.climatebonds.net/standard/taxonomy (Accessed November 1, 2021).
Fuchs, A., K. Gehring, K.G.-J. of the E. Economic, and undefined 2017, 2017: The Home Bias in Sovereign Ratings. J. Eur. Econ. Assoc. , 15(6) , 1386–1423, doi:10.1093/jeea/jvx009.
Fuller, F., L. Zamarioli, B. Kretschmer, A. Thomas, and L. De Marez, 2018: Debt for Climate Swaps: Caribbean Outlook. Climate Analytics, Berlin, Germany, 18 pp. https://climateanalytics.org/media/debt%7B%5C_%7Dfor%7B% 5C_%7Dclimate%7B%5C_%7Dswap%7B%5C_%7Dimpact %7B%5C_%7Dbriefing.pdf (Accessed November 1, 2021).
Furceri, D., M. Ganslmeier, and J.D. Ostry, 2021: Are climate change policies politically costly?IMF, Washington DC, USA, 51 pp. https://www.imf.org/en/Publications/WP/Issues/2021/06/04/Are-Climate-Change-Policies-Politically-Costly-460565 (Accessed November 1, 2021).
Gabor, D., 2019: Securitization for Sustainability: Does it help achieve the Sustainable Development Goals?Heinrich Böll Stiftung, Washington, DC, USA, 30 pp.
Gabor, D., 2021: The Liquidity and Sustainability Facility for African sovereign bonds: who benefits? – Eurodad, Brussels, Belgium. https://www.eurodad.org/the_liquidity_and_sustainability_facility_for_african_sovereign_bonds_who_benefits (Accessed September 22, 2021).
Gaddy, B., V. Sivaram, and F. O’Sullivan, 2016: Venture capital and cleantech: The wrong model for clean energy innovation. MIT Energy Initiative, Cambridge, MA, USA, 22 pp. https://energy.mit.edu/wp-content/uploads/2016/07/MITEI-WP-2016-06.pdf (Accessed November 1, 2021).
Gall, J., 2018: The benefits of community-owned renewable energy projects. University of Saskatchewan, Saskatoon, Canada. https://renewableenergy.usask.ca/news-articles/the-benefits-of-community-owned-renewable-energy-projects.php (Accessed November 1, 2021).
Gallagher, K.P., R. Kamal, J. Jin, Y. Chen, and X. Ma, 2018: Energizing development finance? The benefits and risks of China’s development finance in the global energy sector. Energy Policy, 122, 313–321, doi:10.1016/j.enpol.2018.06.009.
Garbacz, W., D. Vilalta, and L. Moller, 2021: The role of guarantees in blended finance. OECD Development Co-operation Working Papers 97, OECD Publishing, Paris, France, 55 pp.
García de Fonseca, L., Parikh, M., Manghani, R., 2019: Evolucion futura de costos de las energías renovables y almacenamiento en AmericaLatina. IDB, Washington, DC, USA. doi: 10.18235/0002101.
Gazzotti, P. et al., 2021: Persistent inequality in economically optimal climate policies. Nat. Commun. , 12(1) , 3421, doi:10.1038/s41467-021-23613-y.
GCA-AAI, 2020: Integrated Responses To Building Climate And Pandemic Resilience In Africa. GCA, Rotterdam, Netherlands. https://gca.org/programs/africa-adaptation-acceleration-program/ (Accessed October 25, 2021).
GCA, 2019: Adapting to climate change could add $7 trillion to the global economy by 2030. GCA, Rotterdam, Netherlands. Global Center on Adaptation (GCA).
GCF, 2017: Mainstreaming Gender in Green Climate Fund Projects. Green Climate Fund (GCF), Incheon, Republic of Korea, 78 pp. https://www.greenclimate.fund/sites/default/files/document/guidelines-gcf-toolkit-mainstreaming-gender_0.pdf (Accessed November 1, 2021).
GCF, 2019: Facilitating an enabling environment for a Caribbean Green Bond Listingon the Jamaica Stock Exchange. Green Climate Fund (GCF), Incheon, Republic of Korea.
GCF, 2020a: Independent Evaluation of the Green Climate Fund’s Environmental and Social Safeguards (ESS) and the Environmental and Social Management System (ESMS). Green Climate Fund (GCF), Incheon, Republic of Korea, 204 pp. https://www.greenclimate.fund/sites/default/files/document/gcf-b27-13.pdf (Accessed November 1, 2021).
GCF, 2020b: Desert to Power G5 Sahel Facility. Green Climate Fund (GCF), Incheon, Republic of Korea, 19 pp. https://www.greenclimate.fund/sites/default/files/document/25180-afdb-desert-power.pdf (Accessed August 24, 2021).
GCF, 2021: FP163: Sustainable Renewables Risk Mitigation Initiative (SRMI) Facility. Green Climate Fund (GCF), Incheon, Republic of Korea, 72 pp.
Geddes, A., T.S. Schmidt, and B. Steffen, 2018: The multiple roles of state investment banks in low-carbon energy finance: An analysis of Australia, the UK and Germany. Energy Policy, 115 (December 2017), 158–170, doi:10.1016/j.enpol.2018.01.009.
GEF, 2021a: Progress report on the Least Developed Countries Fund and the Special Climate Change Fund. Global Environment Facility (GEF), Washington, DC, USA, 64 pp. https://www.thegef.org/sites/default/files/council-meeting-documents/EN_GEF.LDCF_.SCCF_.30_03_Progress Report on the LDCF and the SCCF.pdf (Accessed November 1, 2021).
GEF, 2021b: Long-term vision on complementarity, coherence, and collaboration between the Green Climate Fund and the Global Environment Facility. Global Environment Facility (GEF), Washington, DC, USA, 10 pp. https://www.thegef.org/sites/default/files/council-meeting-documents/EN_GEF_C.60_08_Long-Term Vision on Complementarity%2C Coherence and Collaboration between the Green Climate Fund and the Global Environment Facility.pdf .
GEF Independent Evaluation Office, 2017: Evaluation on Gender Mainstreaming in the GEF. Global Environment Facility (GEF), Washington, DC, USA, 82 pp. https://www.gefieo.org/evaluations/evaluation-gender-mainstreaming-gef-2017 (Accessed November 1, 2021).
Gelb, S., S. Kalantaryan, S. Mcmahon, and M. Perez Fernandez, 2021: Diaspora finance for development: from remittances to investment . Publications Office of the European Union, Luxembourg, 48 pp.
GEPF, 2019: 2019/2020 Annual Report . GEPF, Pretoria, South Africa, 126 pp. https://www.gepf.co.za/wp-content/uploads/2020/11/GEPF-IR-2020.pdf (Accessed November 1, 2021).
Gertler, M. and N. Kiyotaki, 2010: Financial Intermediation and Credit Policy in Business Cycle Analysis. NYU and Princeton, New York, NY, USA and Princeton, USA. pp. 547–599.
GET FiT Uganda, 2018: GET FiT Uganda - Annual Report 2018. Get Fit Uganda, Kampala, Uganda. https://www.getfit-uganda.org/downloads/ (Accessed November 1, 2021).
GGGI, 2019: Product Analysis of Diverse de-Risking Financial Instruments Available in Indonesia’s Market . 101 pp. Global Green Growth Institute, Seoul, South Korea, http://greengrowth.bappenas.go.id/wp-content/uploads/2019/12/Product-Analysis-of-Diverse-de-Risking-Financial_Report-1.pdf (Accessed August 18, 2021).
Gianfrate, G. and M. Peri, 2019: The green advantage: Exploring the convenience of issuing green bonds. J. Clean. Prod. , 219, doi:10.1016/j.jclepro.2019.02.022.
Giannetti, B.F., F. Agostinho, C.M.V.B. Almeida, and D. Huisingh, 2015: A review of limitations of GDP and alternative indices to monitor human wellbeing and to manage eco-system functionality. J. Clean. Prod. , 87, 11–25, doi:10.1016/j.jclepro.2014.10.051.
Gibon, T., I.Ş. Popescu, C. Hitaj, C. Petucco, and E. Benetto, 2020: Shades of green: Life cycle assessment of renewable energy projects financed through green bonds. Environ. Res. Lett. , 15(10) , doi:10.1088/1748-9326/abaa0c.
Giese, G., L.-E. Lee, D. Melas, Z. Nagy, and L. Nishikawa, 2019: Foundations of ESG Investing: How ESG Affects Equity Valuation, Risk, and Performance. J. Portf. Manag. , 45(5) , 69–83, doi:10.3905/jpm.2019.45.5.069.
Gignac, R. and H.D. Matthews, 2015: Allocating a 2 °C cumulative carbon budget to countries. Environ. Res. Lett. , 10(7) , 75004, doi:10.1088/1748-9326/10/7/075004.
Gillingham, K.T., C.R. Knittel, J. Li, M. Ovaere, and M. Reguant, 2020: The Short-run and Long-run Effects of Covid-19 on Energy and the Environment. Joule, 4(7) , 1337–1341, doi:10.1016/j.joule.2020.06.010.
Giorgi, A. and C. Michetti, 2021: Climate Investment Opportunities: Climate-Aligned Bonds & Issuers 2020. Climate Bonds Initiative, London, UK, 34 pp. https://www.climatebonds.net/files/reports/cbi_climate-aligned_bonds_issuers_2020.pdf (Accessed November 1, 2021).
GISD, 2020: Renewed, Rechargedand Reinforced: Urgent actions to harmonize and scale sustainable finance. Global Investors for Sustainable Development (GISD) Alliance, New York, NY, USA, 45 pp. https://www.un.org/development/desa/financing/sites/www.un.org.development.desa.financing/files/2020-08/Renewed%2C Recharged and Reinforced %28GISD 2020 %29_vF.pdf (Accessed November 1, 2021).
GIZ, 2015: Climate Risk Insurance: For strengthening climate resilience of poor people in vulnerable countries. GIZ, Bonn, Germany, 20 pp.
GIZ, 2017 a: Financing strategies: A missing link to translate NDCs into action. GIZ, Bonn, Germany.
GIZ, 2017 b: The Potential of Green Bonds. A Climate Finance Instrument for the Implementation of Nationally Determined Contributions?GIZ, Bonn, Germany.
GIZ, and World Bank, 2019: Central America & Caribbean Catastrophe Risk Insurance Program. GIZ and World Bank Bonn, Germany, and Washington, DC, USA. 4 pp. https://www.preventionweb.net/files/66323_ 66323factsheet33wbcentralamericaweb.pdf (Accessed November 1, 2021).
GIZ, IFC, and Women’s World Banking, 2017: Mainstreaming Gender and Targeting Women in Inclusive Insurance: Perspectives and Emerging Lessons. A Compendium of Technical Notes and Case Studies. GIZ, IFC, and Women’s World Banking, Bonn and Eschborn, Germany, 96 pp. https://www.ifc.org/wps/wcm/connect/4dbd983e-2ecd-4cde-b63e-191ffb2d48e6/ Full+Women+%7B%5C%25%7D26+Inclusive+Insurance+BMZ%7B%5C _%7DWeb.pdf?MOD=AJPERES%7B%5C&%7DCVID=lK1xhtq (Accessed November 1, 2021).
Global Investor Statement, 2019: Global Investor Statement on Climate Change 2019. IIGCC, London, UK.
Glueck, K. and L. Friedman, 2020: Biden announces $2 trillion climate plan. The New York Times, July 14.
Goldman Sachs, 2021: Goldman Sachs Commits $10 Billion in Investment Capital and $100 Million in Philanthropic Capital To Impact The Lives of One Million Black Women. Goldman Sachs Press Release, March 10, 2021.
Goldstein, B., D. Gounaridis, and J.P. Newell, 2020: The carbon footprint of household energy use in the United States. Proc. Natl. Acad. Sci. , 117(32) , 19122–19130, doi:10.1073/pnas.1922205117.
Golub, A.A. et al., 2018: Escaping the climate policy uncertainty trap: options contracts for REDD+. Clim. Policy, 18(10) , 1227–1234, doi:10.1080/14693062.2017.1422478.
Goodfriend, M., 2011: Money Markets. Annu. Rev. Financ. Econ. , 3(1) , 119–137, doi:10.1146/annurev-financial-102710-144853.
Gore, G. and M. Berrospi, 2019: Rise of controversial transition bonds leads to call for industry standards. Reuters, September.
Gorelick, J., 2018: Supporting the future of municipal bonds in sub-Saharan Africa: the centrality of enabling environments and regulatory frameworks. Environ. Urban. , 30(1) , 103–122, doi:10.1177/0956247817741853.
Gorelick, J. and N. Walmsley, 2020: The greening of municipal infrastructure investments: technical assistance, instruments, and city champions. Green Financ. , 2(2) , 114–134, doi:10.3934/GF.2020007.
Gosens, J. and F. Jotzo, 2020: China’s post-COVID-19 stimulus: No Green New Deal in sight. Environ. Innov. Soc. Transitions, 36, 250–254, doi:10.1016/j.eist.2020.07.004.
Gough, I., 2020: Defining floors and ceilings: the contribution of human needs theory. Sustain. Sci. Pract. Policy, 16(1) , 208–219, doi:10.1080/15487733.2020.1814033.
Goulder, L.H., 1995: Environmental taxation and the double dividend: A reader’s guide. Int. Tax Public Financ. , 2(2) , 157–183, doi:10.1007/BF00877495.
Government of UK, 2016: Appendix 5.2: What is the evidence from the international experience of smart meters?Government of the United Kingdom, London, https://assets.publishing.service.gov.uk/media/56ebdf6540f0b60385000002/Appendix_5.2_-_What_is_the_evidence_from_the_international_experience_of_smart_meters.pdf (Accessed November 1, 2021).
Grafakos, S., K. Trigg, M. Landauer, L. Chelleri, and S. Dhakal, 2019: Analytical framework to evaluate the level of integration of climate adaptation and mitigation in cities. Clim. Change, 154(1–2) , 87–106, doi:10.1007/s10584-019-02394-w.
Grafström, J. and Å. Lindman, 2017: Invention, innovation and diffusion in the European wind power sector. Technol. Forecast. Soc. Change, 114(2017) , 179–191, doi:10.1016/j.techfore.2016.08.008.
Granoff, I., J.R. Hogarth, and A. Miller, 2016: Nested barriers to low-carbon infrastructure investment. Nat. Clim. Change, 6(12) , 1065–1071, doi:10.1038/nclimate3142.
Green, J.F., 2021: Beyond Carbon Pricing: Tax Reform is Climate Policy. Glob. Policy, 12(3) , 372–379, doi:10.1111/1758-5899.12920.
Griffith-Jones, S. and J. Tyson, 2010: Reform of the European Investment Bank: How to Upgrade the EIB’s Role in Development . European Parliament, Brussels, Belgium. 38 pp. http://www.europarl.europa.eu/RegData/etudes/etudes/join/2010/410213/EXPO-DEVE%7B%5C_%7DET(2010)410213%7B%5C_%7DEN.pdf (Accessed November 1, 2021).
Griffith-Jones, S., S. Attridge, and M. Gouett, 2020: Securing climate finance through national development banks.
Griscom, B.W. et al., 2017: Natural climate solutions. Proceedings of the National Academy of Sciences, Washington, DC, USA, 114(44) , 11645–11650, doi:10.1073/pnas.1710465114.Griscom, B.W. et al., 2020: National mitigation potential from natural climate solutions in the tropics. Philos. Trans. R. Soc. B Biol. Sci. , 375(1794) , 20190126, doi:10.1098/rstb.2019.0126.
Gropp, R., C. Gruendl, and A. Guettler, 2014: The Impact of Public Guarantees on Bank Risk-Taking: Evidence from a Natural Experiment*. Rev. Financ. , 18(2) , 457–488, doi:10.1093/rof/rft014.
Grubb, M., 2014: Planetary Economics: Energy, climate change and the three domains of sustainable development . Routledge, Abingdon, UK. 548 pp.
Grubb, M. and D. Newbery, 2018: UK Electricity Market Reform and the Energy Transition: Emerging Lessons. Energy J. , 39(01) , doi:10.5547/01956574.39.6.mgru.
Grubler, A., C. Wilson, and G. Nemet, 2016: Apples, oranges, and consistent comparisons of the temporal dynamics of energy transitions. Energy Res. & Soc. Sci. , 22, 18–25, doi:10.1016/j.erss.2016.08.015.
GSIA, 2019: 2018 Global Sustainable Investment Review. Global Sustainable Investment Alliance (GSIA), 29 pp. http://www.gsi-alliance.org/wp-content/uploads/2019/03/GSIR%7B%5C_%7DReview2018.3.28.pdf (Accessed November 1, 2021).
Gupta, J., A. Rempel, and H. Verrest, 2020: Access and allocation: the role of large shareholders and investors in leaving fossil fuels underground. Int. Environ. Agreements Polit. Law Econ. , 20(2) , 303–322, doi:10.1007/s10784-020-09478-4.
Guthrie, J., 2021: Lex in depth: Examining the slave trade — ‘Britain has a debt to repay.’Financial Times, June 28.
Guzman, M., 2016: Definitional Issues in the IMF Debt Sustainablility Analysis Framework - A Proposal. CIGI Policy Brief No 77, Waterloo, ON, Canada. 8 pp. https://www.cigionline.org/sites/default/files/pb%7B%5C_%7Dno.77%7B%5C_%7Dweb.pdf (Accessed November 1, 2021).
Haas, C. and K. Kempa, 2020: Low-Carbon Investment and Credit Rationing. SSRN Electron. J. , doi:10.2139/ssrn.3521332.
Hachenberg, B. and D. Schiereck, 2018: Are green bonds priced differently from conventional bonds?J. Asset Manag. , 19(6) , doi:10.1057/s41260-018-0088-5.
Hadfield, P. and N. Cook, 2019: Financing the Low-Carbon City: Can Local Government Leverage Public Finance to Facilitate Equitable Decarbonisation?Urban Policy Res. , 37(1) , 13–29, doi:10.1080/08111146.2017.1421532.
Hafner, S., A. Jones, A. Anger-Kraavi, and J. Pohl, 2020: Closing the green finance gap – A systems perspective. Environ. Innov. Soc. Transitions, 34, 26–60, doi:10.1016/j.eist.2019.11.007.
Hainaut, H. and I. Cochran, 2018: The Landscape of domestic climate investment and finance flows: Methodological lessons from five years of application in France. Int. Econ. , 155, 69–83, doi:10.1016/j.inteco.2018.06.002.
Hall, C., 2020: Opinion: The slavery business contributed to the building of modern Britain. Can we make amends?UCL News, June 24.
Hall, N. and Å. Persson, 2018: Global climate adaptation governance: Why is it not legally binding?Eur. J. Int. Relations, 24(3) , 540–566, doi:10.1177/1354066117725157.
Halland, H., A. Dixon, S.Y. In, A. Monk, and R. Sharma, 2021: Mobilising institutional investor capital for climate-aligned development. OECD Development Policy Papers 35, OECD Publishing., Paris, 33 pp.
Hallegatte, S. et al., 2016: Shock Waves: Managing the Impacts of Climate Change on Poverty. World Bank, Washington DC, USA, 207 pp.
Hallegatte, S., A. Vogt-Schilb, M. Bangalore, and J. Rozenberg, 2017: Unbreakable: Building the Resilience of the Poor in the Face of Natural Disasters. The World Bank, Washington, DC, USA, 201 pp.
Hamid, K., M.T. Suleman, S.Z. Ali Shah, and R.S. Imdad Akash, 2017: Testing the Weak Form of Efficient Market Hypothesis: Empirical Evidence from Asia-Pacific Markets. SSRN Electron. J. , doi:10.2139/ssrn.2912908.
Hamwi, M. and I. Lizarralde, 2017: A Review of Business Models towards Service-Oriented Electricity Systems. Procedia CIRP, 64, 109–114, doi:10.1016/j.procir.2017.03.032.
Hanif, I., S.M. Faraz Raza, P. Gago-de-Santos, and Q. Abbas, 2019: Fossil fuels, foreign direct investment, and economic growth have triggered CO2 emissions in emerging Asian economies: Some empirical evidence. Energy, 171, 493–501, doi:10.1016/j.energy.2019.01.011.
Hanlon, J., 2017: Following the donor-designed path to Mozambique’s US$2.2 billion secret debt deal. Third World Q. , 38(3) , 753–770, doi:10.1080/01436597.2016.1241140.
Hanna, R., Y. Xu, and D.G. Victor, 2020: After COVID-19, green investment must deliver jobs to get political traction. Nature, 582(7811) , 178–180, doi:10.1038/d41586-020-01682-1.
Hanto, J. et al., 2021: Effects of decarbonization on the energy system and related employment effects in South Africa. Environ. Sci. Policy, 124, 73–84, doi:10.1016/j.envsci.2021.06.001.
Hanusch, M., S. Hassan, Y. Algu, L. Soobyah, and A. Kranz, 2016: The Ghost of a Rating Downgrade. World Bank, Washington, DC, USA.
Harber, M., 2017: The role of institutional investors in promoting long-term value creation: A South African perspective. African Rev. Econ. Financ. , 9(1) , 272–291.
Hearson, M., 2014: Tax-motivated Illicit Financial Flows. A Guide for Development Practitioners. U4 Issue, 2, 72.
Hellmuth, M.E., D.E. Osgood, U. Hess, A. Moorhead, and H. Bhojwani, 2009: Index insurance and climate risk. International Research Institute for Climate and Society, 122 pp.
Henochsberg, S., 2016: Public debt and slavery: the case of Haiti (1760-1915). Paris School of Economics, Paris, France.
Henriques, I. and P. Sadorsky, 2018: Investor implications of divesting from fossil fuels. Glob. Financ. J. , 38, 30–44, doi:10.1016/j.gfj.2017.10.004.
Henry, M.S., M.D. Bazilian, and C. Markuson, 2020: Just transitions: Histories and futures in a post-COVID world. Energy Res. Soc. Sci. , 68, 101668, doi:10.1016/j.erss.2020.101668.
Hepburn, C., B. O’Callaghan, N. Stern, J. Stiglitz, and D. Zenghelis, 2020a: Will COVID-19 fiscal recovery packages accelerate or retard progress on climate change?Oxford Rev. Econ. Policy, 36(20) , 1–48, doi:10.1093/oxrep/graa015.
Hepburn, C., O’Callaghan, B., Stern, N., Stiglitz, J. and Zenghelis, D., 2020b: Will COVID-19 fiscal recovery packages accelerate or retard progress on climate change? Smith School Working Paper 20-02. https://www.inet.ox.ac.uk/publications/will-covid-19-fiscal-recovery-packages-accelerate-or-retard-progress-on-climate-change/ (Accessed November 1, 2021).
Heredia, L. et al., 2020: Global Asset Management Report: Protect, Adapt and Innovate. Boston Consulting Group, Boston, USA, 23 pp. https://image-src.bcg.com/Images/BCG-Global-Asset-Management-2020-May-2020-r_tcm9-247209.pdf (Accessed November 1, 2021).
Heredia, L. et al., 2021: Global Asset Management 2021: The $100 trillion machine. Boston Consulting Group, Boston, USA, 24 pp. https://web-assets.bcg.com/79/bf/d1d361854084a9624a0cbce3bf07/bcg-global-asset-management-2021-jul-2021.pdf (Accessed November 1, 2021).
Hermann, A., P. Köfer, and J.P. Mairhöfer, 2016: Climate Risk Insurance: New Approaches and Schemes. Allianze Working Paper September 2016, Allianze, Munich, Germany, 1–22 pp.
Herrington, R., 2021: Mining our green future. Nat. Rev. Mater. , 6(6) , 456–458, doi:10.1038/s41578-021-00325-9.
Hickel, J., 2015: Five reasons to think twice about the UN’s sustainable development goals. Africa at LSE, September 23.
High-Level Commission on Carbon Prices, 2017: Report of the high-level commission on carbon prices[Stern, N. and J.E. Stiglitz, (eds.)]. World Bank, Washington, DC, USA, Creative Commons Attribution CC BY 3.0 IGO, 69 pp.
Hilmi, N., S. Djoundourian, W. Shahin, and A. Safa, 2021: Does the ECB policy of quantitative easing impact environmental policy objectives?J. Econ. Policy Reform, 00(00) , 1–13, doi:10.1080/17487870.2020.1855176.
Hirth, L. and J.C. Steckel, 2016: The role of capital costs in decarbonizing the electricity sector. Environ. Res. Lett. , 11(11) , 114010, doi:10.1088/1748-9326/11/11/114010.
HM Treasury and UK DMO, 2021: UK Government Green Financing Framework. HM Treasury and UK DMO, London, UK, 30 pp.
Hodge, G., C. Greve, and M. Biygautane, 2018: Do PPP’s work? What and how have we been learning so far?Public Manag. Rev. , 20(8) , 1105–1121, doi:10.1080/14719037.2018.1428410.
Hoepner, A.G.F., S. Dimatteo, J. Schaul, P.-S. Yu, and M. Musolesi, 2017: Tweeting about Sustainability: can Emotional Nowcasting discourage Greenwashing? Discussion Paper, Henley Business School, University of Reading, Reading, UK. https://ssrn.com/abstract=2924088.
Hong, H., F.W. Li, and J. Xu, 2019: Climate risks and market efficiency. J. Econom. , 208(1) , 265–281, doi:10.1016/j.jeconom.2018.09.015.
Hope, K.R., 2011: Investing in capacity development: towards an implementation framework. Policy Stud. , 32(1) , 59–72, doi:10.1080/01442872.2010.529273.
Hourcade, J.-C., A. Pottier, and E. Espagne, 2018: Social value of mitigation activities and forms of carbon pricing. Int. Econ. , 155, 8–18, doi:10.1016/j.inteco.2018.06.001.
Hourcade, J.-C., D. Dasgupta, and F. Ghersi, 2021a: Accelerating the speed and scale of climate finance in the post-pandemic context. Clim. Policy, 21(10) , 1–15, doi:10.1080/14693062.2021.1977599.
Hourcade, J.-C. et al., 2021b: Scaling up climate finance in the context of Covid-19. Green Climate Fund, Incheon, Republic of Korea, 116 pp.
Hourcade, J.C., B. Perrissin Fabert, and J. Rozenberg, 2012: Venturing into uncharted financial waters: an essay on climate-friendly finance. Int. Environ. Agreements Polit. Law Econ. , 12(2) , 165–186, doi:10.1007/s10784-012-9169-y.
Hove, A., 2020: Current direction for renewable energy in China. Oxford Institute for Energy Studies, Oxford, UK, 8 pp.
Hu, Y., S. Ren, Y. Wang, and X. Chen, 2020: Can carbon emission trading scheme achieve energy conservation and emission reduction? Evidence from the industrial sector in China. Energy Econ. , 85, 104590, doi:10.1016/j.eneco.2019.104590.
Hubacek, K. et al., 2017: Global carbon inequality. Energy, Ecol. Environ. , 2(6) , 361–369, doi:10.1007/s40974-017-0072-9.
Huenteler, J., C. Niebuhr, and T.S. Schmidt, 2016: The effect of local and global learning on the cost of renewable energy in developing countries. J. Clean. Prod. , 128, 6–21, doi:10.1016/j.jclepro.2014.06.056.
Humphrey, C., 2017: He who pays the piper calls the tune: Credit rating agencies and multilateral development banks. Rev. Int. Organ. , 12(2) , 281–306, doi:10.1007/s11558-017-9271-6.
Humphrey, C. and K. Michaelowa, 2019: China in Africa: Competition for traditional development finance institutions?World Dev. , 120, 15–28, doi:10.1016/j.worlddev.2019.03.014.
Hunecke, K. et al., 2019: What role do transaction costs play in energy efciency improvements and how can they be reduced. EECEE Summer Study Proc., European Council for an Energy Efficient Economy, Stockholm, Sweden.
Hynes, W. and S. Scott, 2013: The Evolution of Official Development Assistance: Achievements, Criticisms and a Way Forward. OECD Development Co-operation Working Papers, No. 12, OECD Publishing. Paris, France. doi: 10.1787/5k3v1dv3f024-en.
Hyun, S., D. Park, and S. Tian, 2019: The price of going green: the role of greenness in green bond markets. Account. Financ. , Vol 60 Issue 1, doi:10.1111/acfi.12515.
IATFD, 2016: Developing domestic capital markets. Inter-agency Task Force on Financing for Development (IATFD). https://www.un.org/esa/ffd/wp-content/uploads/2016/01/Developing-domestic-capital-markets_IFC-World-Bank-Group_IATF-Issue-Brief.pdf (Accessed November 1, 2021).
IATFD, 2020: Financing for Sustainable Development Report 2020. Inter-agency Task Force on Financing for Development (IATFD). United Nations Publication, New York, 207 pp.
IATFD, 2021: Financing for Sustainable Development Report 2021. Inter-agency Task Force on Financing for Development (IATFD). United Nations Publication, P.50, New York, NY, USA, 189 pp. https://developmentfinance.un.org/sites/developmentfinance.un.org/files/FSDR_2021.pdf .
ICAEW, 2021: Accounting for financial guarantees in government accounts | ICAEW. Institute of Chartered Accountants in England and Wales (ICAEW), London, UK. https://www.icaew.com/insights/covid-19-global-recovery/fiscal-policy/accounting-for-financial-guarantees-in-government-accounts (Accessed October 30, 2021).
ICEAW, 2012: Sustainable Public Finances: Global Views. Institute of Chartered Accountants in England and Wales (ICAEW). London, UK, 19 pp.
ICMA, 2020a: Sustainable Finance: High-level definitions. International Capital Market Association, Zurich, Switzerland, 7 pp. https://www.icmagroup.org/assets/documents/Regulatory/Green-Bonds/Sustainable-Finance-High-Level-Definitions-May-2020-051020.pdf .
ICMA, 2020b: Bond Market Size. International Capital Market Association, Zurich, Switzerland.
ICMA, 2021: Overview and Recommendations for Sustainable Finance Taxonomies. International Capital Market Association, Zurich, London, Paris, Brussels, Hong Kong, 34 pp. www.icmagroup.org (Accessed August 24, 2021).
IDFC, and GCF, 2020: The Green Climate Fund and the International Development Finance Club: A strategic alliance to realize the full potential of public development banks in financing the green and climate-resilient transition. 28 pp. https://www.greenclimate.fund/document/gcf-idfc-working-paper (Accessed October 27, 2021).
IEA, 2014a: Capturing the Multiple Benefits of Energy Efficiency. OECD/IEA, Paris, France., 224 pp. https://iea.blob.core.windows.net/assets/28f84ed8-4101-4e95-ae51-9536b6436f14/Multiple_Benefits_of_Energy_Efficiency-148x199.pdf (Accessed November 1, 2021).
IEA, 2014b: Africa Energy Outlook: A focus on energy prospects in sub-Saharan Africa. OECD/IEA, Paris, France, 237 pp.
IEA, 2017: World Energy Outlook 2017. Flagship Report, November 2017, IEA, Paris, France.
IEA, 2018: World Energy Balances 2018. In: International Energy Agency, OECD/IEA, Paris, France.
IEA, 2019a: World Energy Investment 2019. Flagship Report, May 2019. OECD, Paris, France 176 pp.
IEA, 2019b: Securing Investments in Low-Carbon Power Generation Sources. OECD, Paris, 16 pp.
IEA, 2019c: Africa Energy Outlook 2019. 288 pp. https://www.iea.org/reports/africa-energy-outlook-2019 (Accessed November 1, 2021).
IEA, 2020a: World Energy Investment 2020. OECD Publishing, Paris, France, 176 pp.
IEA, 2020b: The Oil and Gas Industry in Energy Transitions: Insights from IEA analysis.. OECD Publishing, Paris, France.
IEA, 2020c: Carbon pricing can help put clean energy at the heart of stimulus packages. OECD Publishing, Paris, France, https://www.iea.org/commentaries/carbon-pricing-can-help-put-clean-energy-at-the-heart-of-stimulus-packages (Accessed November 1, 2021).
IEA, 2020d: World Energy Outlook 2020. OECD Publishing, Paris, France.
IEA, 2021a: Financing Clean Energy Transitions in Emerging and Developing Economies. OECD Publishing, Paris, France, 235 pp. https://iea.blob.core.windows.net/assets/6756ccd2-0772-4ffd-85e4-b73428ff9c72/ FinancingCleanEnergyTransitionsinEMDEs_WorldEnergyInve stment2021SpecialReport.pdf (Accessed November 1, 2021).
IEA, 2021b: Net Zero by 2050. OECD Publishing, Paris, France, 224 pp.
IEA, 2021c: World Energy Investment 2021. OECD Publishing, Paris, France, 64 pp.
IEA, 2021d: World energy model documentation. OECD Publishing, Paris, France, 91 pp. https://iea.blob.core.windows.net/assets/bc4936dc-73f1-47c3-8064-0784ae6f85a3/WEM_Documentation_WEO2020.pdf .
IEA, 2021e: World Energy Outlook 2021. IEA Publications, Paris, 383 pp.
IEA, 2021f: The role of critical minerals in clean energy transitions. OECD Publishing, Paris, France, 283 pp. www.iea.org/t&c/ (Accessed September 19, 2021).
IEA, IRENA, UNSD, World Bank, and WHO, 2021: Tracking SDG 7: The Energy Progress Report 2021. IRENA, Washington DC, USA, 228 pp. https://www.irena.org/publications/2021/Jun/Tracking-SDG-7-2021 (Accessed August 18, 2021).
IFC, 2016: Climate Investment Opportunities in Emerging Markets - An IFC Analysis. International Finance Corporation, World Bank Group, Washington, DC, USA, 140 pp. https://www.ifc.org/wps/wcm/connect/59260145-ec2e-40de-97e6-3aa78b82b3c9/3503-IFC-Climate%7B%5C_%7DInvestment%7B%5C_%7DOpportunity-Report-Dec-FINAL.pdf?MOD=AJPERES%7B%5C&%7DCVID=lBLd6Xq (Accessed November 1, 2021).
IFC, 2018: Climate Investment Opportunities in Cities: A IFC Analysis. International Finance Corporation, 176 pp. https://www.ifc.org/wps/wcm/connect/875afb8f-de49-460e-a66a-dd2664452840/201811-CIOC-IFC-Analysis.pdf?MOD=AJPERES&CVID=mthPzYg (Accessed November 1, 2021).
IFC, 2021: Green Bond Technical Assistance Program: Delivering Global Public Goods - Stimulating the Supply of Green Bonds in Emerging Markets. International Finance Corporation, World Bank Group, Washington, DC, USA, 4 pp.
IFC 2018 b, 2018: MCPP Infrastructure: An innovative structure to mobilize institutional investment in emerging market infrastructure loans. International Finance Corporation, World Bank Group, Washington, DC, USA, 1 pp. https://www.ifc.org/wps/wcm/connect/4c9e0868-1232-4212- b4f2-a5c39d177afa/MCPP+Infrastructure+Flyer+2018.pdf?MOD= AJPERES&CVID=mcoa4bt (Accessed November 1, 2021).
IFC 2021: Using Blended Concessional Finance to Invest in Challenging Markets. International Finance Corporation, World Bank Group, Washington, DC, USA, 59 pp. https://www.ifc.org/wps/wcm/connect/ publications_ext_content/ifc_external_publication_site/publications_ listing_page/using+blended+concessional+finance+to+invest+in+challenging+markets (Accessed August 17, 2021).
Igan, D., D. Kirti, and S.M. Peria, 2020: The disconnect between financial markets and the real economy. IMF, Washington D.C., 10 pp.
IIGCC, 2015: Climate finance for developing and emerging countries: Five recommendations to catalyse institutional investment Institutional Investors Group on Climate Change 2. Position paper, IIGCC, London, UK.
IIGCC, 2021: Global framework for investors to achieve net zero emissions alignment launched – $8 trillion investors put it into practice. Press Release, March 10.
IIX, 2020: IIX Accelerates Gender Bond Issuances with Pricing of Women’s Livelihood Bond 3. Press Release, December 7.
IMF, 2009: Balance of Payments and International Investment Position Manual Sixth Edition (BPM6). 6th ed. International Monetary Fund (IMF), Washington, DC, USA, 371 pp.
IMF, 2019: Fiscal Monitor: How to Mitigate Climate Change. International Monetary Fund (IMF), Washington, DC, USA, 96 pp. https://www.imf.org/en/Publications/FM/Issues/2019/10/16/Fiscal-Monitor-October-2019-How-to-Mitigate-Climate-Change-47027 (Accessed November 1, 2021).
IMF, 2020a: Mitigating Climate Change - Growth and Distribution Friendly Strategies. In: World Economic Outlook: A Long and Difficult Ascent , International Monetary Fund (IMF), Washington, DC, USA, pp. 85–113.
IMF, 2020b: World Economic Outlook: A Long and Difficult Ascent . International Monetary Fund (IMF), Washington, DC, USA.
IMF, 2020c: Greening the recovery. Special Series on Fiscal Policies to Respond to COVID-19, (October 2019), International Monetary Fund (IMF), Washington, DC, USA, 1–3.
IMF, 2021a: World Economic Outlook: Managing Divergent Recoveries. International Monetary Fund (IMF), Washington, DC, USA, 170 pp. https://www.imf.org/en/Publications/WEO/Issues/2021/03/23/world-economic-outlook-april-2021 (Accessed November 1, 2021).
IMF, 2021b: IMF Executive Directors Discuss a New SDR Allocation of US$650 billion to Boost Reserves, Help Global Recovery from COVID-19. Press Release March 23, 2021. International Monetary Fund (IMF), Washington, DC, USA.
IMF, 2021c: World Economic Outlook Update (July 2021). International Monetary Fund (IMF), Washington, DC, USA, 21 pp. https://www.imf.org/en/Publications/WEO/Issues/2021/07/27/world-economic-outlook-update-july-2021 (Accessed November 1, 2021).
IMF, 2021d: Reaching Net Zero Emissions. International Monetary Fund (IMF), Washington, DC, USA, 32 pp. https://www.imf.org/external/np/g20/pdf/2021/062221.pdf (Accessed November 1, 2021).
IMF, 2021e: Gross debt position % of GDP. IMF Datamapper. https://www.imf.org/external/datamapper/G_XWDG_G01_GDP_PT@FM/ADVEC/FM_EMG/FM_LIDC.
IMF and World Bank, 2016 : Staff Note for the G20 IFAWG: Development of Local Currency Bond Markets Overview of Recent Developments and Key Themes. IMF, Washington, DC, USA. 33 pp.
IMF and World Bank, 2020 : Enhancing Access to Opportunities. IMF and World BankWashington DC, USA, 70 pp.
IMF and OECD, 2021: Tax Policy and Climate Change: IMF/OECD Report for the G20 Finance Ministers and Central Bank Governors, April 2021, OECD, Italy. 36 pp. https://www.oecd.org/tax/tax-policy/tax-policy-and-climate-change-imf-oecd-g20-report-april-2021.pdf (Accessed November 1, 2021).
IMF and World Bank, 2021 : Guidance Note for Developing Government Local Currency Bond Markets. IMF, Washington DC, USA, 140 pp. https://www.imf.org/en/Publications/analytical-notes/Issues/2021/03/17/Guidance-Note-For-Developing-Government-Local-Currency-Bond-Markets-50256.
In, S.Y. and K. Schumacher, 2021: Carbonwashing: A New Type of Carbon Data-related ESG Greenwashing. Sustainable Finance Initiative, Precourt Institute for Energy, Stanford, CA, USA, 25 pp. https://energy.stanford.edu/sites/g/files/sbiybj9971/f/carbonwashing-_a_new_type_of_carbon_data-related_esg_greenwashing_working_paper.pdf (Accessed November 1, 2021).
Inderst, G., 2021: Financing Development: Private Capital Mobilization and Institutional Investors. ZBW - Leibniz Information Centre for Economics, Kiel, Hamburg, Germany, 41 pp.
Inderst, G. and R. Della Croce, 2013: Pension Fund Investment in Infrastructure: A Comparison between Australia and Canada. OECD, Paris, France, 54 pp.
Institut Louis Bachelier et al., 2020: The Alignment Cookbook: A Technical Review of Methodologies Assessing a Portfolio’s Alignment with Low-carbon Trajectories or Temperature Goal. Institut Louis Bachelier, Paris, France, 173 pp. https://www.louisbachelier.org/wp-content/uploads/2020/10/cookbook.pdf (Accessed November 1, 2021).
Investor Agenda, 2020: The Investor Agenda: A Sustainable Recovery from the COVID-19 Pandemic. The Investor Agenga, https://www.iigcc.org/download/ia-a-sustainable-recovery-from-the-covid-19-pandemic/?wpdmdl=3289%7B%5C&%7Drefresh=5feff7e6a9f471609562086 (Accessed November 1, 2021).
IPA, 2021: Annual Report on Major Projects 2020-21. Infrastructure and Projects Authority, HM Government, Londin, UK, 58 pp.
IPCC, 2012: Managing the Risks of Extreme Events and Disasters to Advance Climate Change Adaptation. [Field, C.B., V. Barros, T.F. Stocker, D. Qin, D.J. Dokken, K.L. Ebi, M.D. Mastrandrea, K.J. Mach, G.-K. Plattner, S.K. Allen, M. Tignor, and P.M. Midgley (eds.)]. Cambridge University Press, Cambridge, UK, and New York, NY, USA, 582 pp.
IPCC, 2014: Climate Change 2014: Impacts, Adaptation, and Vulnerability. Part A: Global and Sectoral Aspects. Contribution of Working Group II to the Fifth Assessment Report of the Intergovernmental Panel on Climate Change[Field, C.B., V.R. Barros, D.J. Dokken, K.J. Mach, and M.D. Mastrandrea, (eds.)]. Cambridge University Press, Cambridge, UK, and New York, NY, USA, 833–868 pp.
IPCC, 2018: Global Warming of 1.5°C: An IPCC special report on the impacts of global warming of 1.5 °C above pre-industrial levels and related global greenhouse gas emission pathways, in the context of strengthening the global response to the threat of climate change[Masson-Delmotte, V., P. Zhai, H.-O. Pörtner, D. Roberts, J. Skea, P.R. Shukla, A. Pirani, W. Moufouma-Okia, C. Péan, R. Pidcock, S. Connors, J.B.R. Matthews, Y. Chen, X. Zhou, M.I. Gomis, E. Lonnoy, T. Maycock, M. Tignor, and T. Waterfield (eds.)]. Cambridge University Press, Cambridge, UK, and New York, NY, USA.
IRENA, 2016: Unlocking Renewable Energy Investment: The Role of Risk Mitigation and Structured Finance. International Renewable Energy Agency, Abu Dhabi, https://www.res4med.org/wp-content/uploads/2017/11/IRENA %7B%5C_%7DRisk%7B%5C_%7DMitigation%7B%5C_% 7Dand%7B%5C_%7DStructured%7B%5C_%7DFinance%7B%5C _%7D2016.pdf (Accessed November 1, 2021).
IRENA, 2018: Community Energy. International Renewable Energy Agency, Abu Dhabi.
IRENA, 2019a: Renewable Power Generation Costs in 2018. International Renewable Energy Agency (IRENA), Abu Dhabi, 88 pp.
IRENA, 2019b: Innovation landscape for a renewable-powered future. International Renewable Energy Agency, Abu Dhabi.
IRENA, 2019c: Business Models. Aggregators - Innovation Landscape Brief . International Renewable Energy Agency, Abu Dhabi.
IRENA, 2019d: Innovation landscape brief: Electric-vehicle smart charging. International Renewable Energy Agency, Abu Dhabi.
IRENA, 2020a: Renewable Power Generation Costs in 2019. International Renewable Energy Agency (IRENA), Abu Dhabi, 143 pp. https://www. irena.org/publications/2020/Jun/Renewable-Power-Costs-in-2019 (Accessed November 1, 2021).
IRENA, 2020b: Power system organisational structures for the renewable energy era. International Renewable Energy Agency, Abu Dhabi.
IRENA, 2020c: Global Renewables Outlook: Energy transformation 2050. International Renewable Energy Agency (IRENA), Abu Dhabi.
IRENA, 2020d: The post-COVID recovery: An agenda for resilience, development and equality. International Renewable Energy Agency (IRENA), Abu Dhabi, 143 pp.
IRENA, 2020e: Renewable energy finance: Sovereign guarantees. IRENA, Abu Dhabi, 14 pp. www.irena.org/publications (Accessed October 29, 2021).
IRENA, 2020f: Business Models: Innovation Landscape Briefs. International Renewable Energy Agency, Abu Dhabi.
IRENA, 2021: World Energy Transitions Outlook: 1.5C Pathway. International Renewable Energy Agency (IRENA), Abu Dhabi, 311 pp.
IRENA and CEM, 2015: Renewable energy auctions - A guide to design. International Renewable Energy Agency (IRENA), Abu Dhabi, 200 pp. https://www.irena.org/publications/2015/Jun/Renewable-Energy-Auctions-A-Guide-to-Design (Accessed November 1, 2021).
Irving, J., 2020: How the COVID-19 crisis is impacting African pension fund approaches to portfolio management . International Finance Corporation, World Bank Group, Washington, D.C., USA. 15 pp. https://www.ifc.org/wps/wcm/connect/61e14b0d-b283-4f8f-8d17-4bce3f54d4a1/African+pension+funds%7B%5C_%7DFINAL-10-9-20.pdf?MOD=AJPERES%7B%5C&%7DCVID=nkeOGIJ (Accessed November 1, 2021).
ISDR, 2009: Global Assessment Report on Disaster Risk Reduction 2009: Risk and Poverty in a Changing Climate. International Strategy for Disaster Reduction (ISDR), Geneva, Switzerland.
ISDR, 2011: Global Assessment Report on Disaster Risk Reduction 2011: Revealing Risk, Redefining Development . International Strategy for Disaster Reduction (ISDR), Geneva, Switzerland.
Ito, H. and R.N. McCauley, 2019: A disaster under-(re)insurance puzzle: Home bias in disaster risk-bearing. BIS Working Paper No 808, Bank for International Settlements, Basel, Switzerland. 40 pp. https://www.bis.org/publ/work808.pdf (Accessed November 1, 2021).
IUCN, 2021: Blue Natural Capital Financing Facility. https://bluenaturalcapital.org/wp2018/wp-content/uploads/2018/10/BNCFF-brochure-FINAL-WEB-small.pdf .
Ivanova, D. and R. Wood, 2020: The unequal distribution of household carbon footprints in Europe and its link to sustainability. Glob. Sustain. , 3, e18, doi:10.1017/sus.2020.12.
Iyer, G.C. et al., 2015: Improved representation of investment decisions in assessments of CO2 mitigation. Nat. Clim. Change, 5(5) , 436–440, doi:10.1038/nclimate2553.
Jaccard, M., 2012: The political acceptability of carbon taxes: lessons from British Columbia. In: Handbook of Research on Environmental Taxation[Milne, J.E. and M.S. Andersen, (eds.)]. Edward Elgar Publishing, Cheltenham, UK, pp. 175–191.
Jachnik, R. and A. Dobrinevski, 2021: Measuring the alignment of real economy investments with climate mitigation objectives. OECD Environment Working Paper, OECD, Paris, France, 71 pp. https://doi.org/10.1787/8eccb72a-en.
Jachnik, R., R. Caruso, and A. Srivastava, 2015: Estimating mobilised private climate finance: Methodological Approaches, Options and Trade-offs. OECD Environment Working Paper, OECD, Paris, France. 66 pp.
Jackson, 2019: DEAL: Seychelles’ sovereign blue bond. International Financial Law Review.World Bank, Washington, D.C., USA.
Jacobsson, S. et al., 2009: EU renewable energy support policy: Faith or facts?Energy Policy, 37(6) , 2143–2146, doi:10.1016/j.enpol.2009.02.043.
Jaeger, J., M.I. Westphal, and C. Park, 2020: Lessons Learned On Green Stimulus: Case studies from the global financial crisis. World Resources Institute, Washington, D.C., USA. 32 pp. https://files.wri.org/s3fs-public/lessons-learned-on-green-stimulus-case-studies-from-the-global-financial-crisis.pdf?5gDebandVTpi8eM8XtXwLE7jjZem2DPI (Accessed November 1, 2021).
Jaffe, A.B., R.G. Newell, and R.N. Stavins, 2004: Economics of Energy Efficiency. In: Encyclopedia of Energy[Cleveland, C.J., (ed.)]. Vol. 2. Elsevier, Amsterdam, The Netherlands, pp. 79–90.
Jagers, S.C. et al., 2020: On the preconditions for large-scale collective action. Ambio, 49(7) , 1282–1296, doi:10.1007/s13280-019-01284-w.
Jenkins, K.E.H., B.K. Sovacool, A. Błachowicz, and A. Lauer, 2020: Politicising the Just Transition: Linking global climate policy, Nationally Determined Contributions and targeted research agendas. Geoforum, 115, 138–142, doi:10.1016/j.geoforum.2020.05.012.
Jensen, L., 2021: An Unprecedented Opportunity to Boost Finance for Development: The Upcoming Special Drawing Rights Allocation. UNDP, New York, NY, USA, 10 pp. https://www.undp.org/publications/unprecedented-opportunity-boost-finance-development#modal-publication-download.
Jones, E.C. and B.D. Leibowicz, 2019: Contributions of shared autonomous vehicles to climate change mitigation. Transp. Res. Part D Transp. Environ. , 72, 279–298, doi:10.1016/j.trd.2019.05.005.
Jordà, Ò., M. Schularick, and A.M. Taylor, 2017: Macrofinancial History and the New Business Cycle Facts. NBER Macroecon. Annu. , 31(1) , 213–263, doi:10.1086/690241.
Jordà, Ò., M. Schularick, A.M. Taylor, and F. Ward, 2019: Global Financial Cycles and Risk Premiums. IMF Econ. Rev. , 67(1) , 109–150, doi:10.1057/s41308-019-00077-1.
Jordà, Ò., S.R. Singh, and A.M. Taylor, 2020: The Long Economic Hangover of Pandemics. Financ. & Dev. , 57(2).
Joskow, P.L., 2007: Market electricity markets and investment in new generating capacity. In: The New Energy Paradigm[Helm, D., (ed.)]. Oxford University Press, Oxford, UK.
Jubilee Debt Campaign, 2019: Transparency of loans to governments: The public’s right to know about their debts. Jubilee Debt Campaign, London, UK, 4 pp. https://jubileedebt.org.uk/wp/wp-content/uploads/2019/04/Transparency-of-loans-to-governments_04.19.pdf (Accessed November 1, 2021).
Juvonen, K., A. Kumar, H. Ben Ayed, and A.O. Marin, 2019: Unleashing the Potential of institutional investors in Africa. ADBG Working Paper No 325, African Development Bank Group, Abidjan, Côte d’Ivoire, 42 pp. https://www.afdb.org/en/documents/publications/working-paper-series/.
Kahn, M. et al., 2019: Long-Term Macroeconomic Effects of Climate Change: A Cross-Country Analysis (July 1, 2019). USC-INET Research Paper No. 19-13SSRN Electronic Journal, Cambridge, MA, USA. doi: 10.2139/ssrn.3428610.
Kahouli-Brahmi, S., 2009: Testing for the presence of some features of increasing returns to adoption factors in energy system dynamics: An analysis via the learning curve approach. Ecol. Econ. , 68(4) , 1195–1212, doi:10.1016/j.ecolecon.2008.08.013.
Kalinowski, W. and H. Chenet, 2020: A “whatever it takes” climate strategy in central banking. Institut Veblen, Paris, France. 28 pp. https://www.veblen-institute.org/IMG/pdf/whatever_it_takes_climatique_eng.pdf (Accessed November 1, 2021).
Kaminker, C. and F. Stewart, 2012: The Role of Institutional Investors in Financing Clean Energy. OECD Working Papers on Finance, Insurance and Private Pensions, No.23, OECD Publishing, Paris, France. 53 pp.
Kaminker, C., O. Kawanishi, F. Stewart, B. Caldecott, and N. Howarth, 2013: Institutional Investors and Green Infrastructure Investments: Selected Case Studies. OECD Working Papers on Finance, Insurance and Private Pensions, No. 35, OECD Publishing, Paris. 23 pp. doi: 10.1787/5k3xr8k6jb0n-en.
Karpf, A. and A. Mandel, 2018: The changing value of the ‘green’ label on the US municipal bond market. Nat. Clim. Change, 8(2) , 161–165, doi:10.1038/s41558-017-0062-0.
Keenan, J.M. and J.T. Bradt, 2020: Underwaterwriting: from theory to empiricism in regional mortgage markets in the U.S. Clim. Change, 162(4) , 2043–2067, doi:10.1007/s10584-020-02734-1.
Keesstra, S. et al., 2018: The superior effect of nature based solutions in land management for enhancing ecosystem services. Sci. Total Environ. , 610–611, 997–1009, doi:10.1016/j.scitotenv.2017.08.077.
Kellett, J. and K. Peters, 2014: Dare to prepare: taking risk seriously. Overseas Development Institute, London, UK, 140 pp.
Kelly, M. and T.M. Hanna, 2019: Democratic ownership in the USA: a quiet revolution. Int. J. Public Pol. , 15(1/2) , 92, doi:10.1504/IJPP.2019.099057.
Kempa, K., U. Moslener, and O. Schenker, 2021: The cost of debt of renewable and non-renewable energy firms. Nat. Energy, 6(2) , 135–142, doi:10.1038/s41560-020-00745-x.
Kern, F. and K.S. Rogge, 2016: The pace of governed energy transitions: Agency, international dynamics and the global Paris agreement accelerating decarbonisation processes?Energy Res. & Soc. Sci. , 22, 13–17, doi:10.1016/j.erss.2016.08.016.
Ketkar, S.L. and D. Ratha, 2010: Diaspora Bonds: Tapping the Diaspora during Difficult Times. J. Int. Commer. Econ. Policy, 01(02) , 251–263, doi:10.1142/S1793993310000147.
Ketterer, J. and A. Powell, 2018: Fi nancing Infrastructure: On the Quest for an Asset-Class. IDB, Washington, DC, USA, 25 pp. doi: 10.18235/0001323.
Ketterer, J.A., G. Andrade, M. Netto, and M.I. Haro, 2019: Transforming Green Bond Markets: Using Financial Innovation an d Technology to Expand Green Bond Issuance in Latin America and the Caribbean. IDB, Washington D.C., 29 pp. doi: 10.18235/0001900.
Khan, M., S. Robinson, R. Weikmans, D. Ciplet, and J.T. Roberts, 2020: Twenty-five years of adaptation finance through a climate justice lens. Clim. Change, 161(2) , 251–269, doi:10.1007/s10584-019-02563-x.
Kissinger, G., A. Gupta, I. Mulder, and N. Unterstell, 2019: Land Use Policy Climate financing needs in the land sector under the Paris Agreement: An assessment of developing country perspectives. Land use policy, 83 (October 2018), 256–269, doi:10.1016/j.landusepol.2019.02.007.
Klenert, D. et al., 2018: Making carbon pricing work for citizens. Nat. Clim. Chang. , 8(8) , 669–677, doi:10.1038/s41558-018-0201-2.
Kling, G., Y. Lo, V. Murinde, and U. Volz, 2018: Climate Vulnerability and the Cost of Debt. SSRN Electron. J. , doi:10.2139/ssrn.3198093.
Klinsky, S. et al., 2017: Why equity is fundamental in climate change policy research. Glob. Environ. Chang. , 44, 170–173, doi:10.1016/j.gloenvcha.2016.08.002.
Klöck, C., N. Molenaers, and F. Weiler, 2018: Responsibility, capacity, greenness or vulnerability? What explains the levels of climate aid provided by bilateral donors?Env. Polit. , 27(5) , 892–916, doi:10.1080/09644016.2018.1480273.
Klusak, P., M. Agarwala, M. Burke, M. Kraemer, and K. Mohaddes, 2021: Rising Temperatures, FallingRatings: The Effect of Climate Change on Sovereign Creditworthiness. Cambridge Working Papers in Economics 2127, Faculty of Economics, University of Cambridge, Cambridge, UK, 50 pp.
Knobloch, F., H. Pollitt, U. Chewpreecha, V. Daioglou, and J.-F. Mercure, 2019: Simulating the deep decarbonisation of residential heating for limiting global warming to 1.5 °C. Energy Effic. , 12(2) , 521–550, doi:10.1007/s12053-018-9710-0.
Knutti, R., 2010: The end of model democracy?Clim. Change, 102(3) , 395–404, doi:10.1007/s10584-010-9800-2.
Koh, J., E. Mazzacurati, and S. Swann, 2016: Bridging the Adaptation Gap: Approaches to Measurement of Physical Climate Risk and Examples of Investment in Climate Adaptation and Resilience. Global Adaptation & Resilience Investment Working Group, 65 pp. http://427mt.com/wp-content/uploads/2016/11/GARI-2016-Bridging-the-Adaptation-Gap.pdf (Accessed November 1, 2021).
Kölbel, J.F., F. Heeb, F. Paetzold, and T. Busch, 2020: Can Sustainable Investing Save the World? Reviewing the Mechanisms of Investor Impact. Organ. Environ. , 33(4) , 554–574, doi:10.1177/1086026620919202.
Kose, M.A., F. Ohnsorge, P. Nagle, and N. Sugawara, 2020: Caught by a Cresting Debt Wave. IMF, Washington, DC, USA, 4 pp.
Kotsantonis, S. and G. Serafeim, 2019: Four Things No One Will Tell You About ESG Data. J. Appl. Corp. Financ. , 31(2) , 50–58, doi:10.1111/jacf.12346.
KPMG, 2015: The Utility as The Network Integrator. KPMG, New York, 13 pp. https://assets.kpmg/content/dam/kpmg/pdf/2016/05/the-utility-as-the-network-integrator.pdf (Accessed November 1, 2021).
Kramer, L., 2017: Why philanthropy must do more on climate change. William and Flora Hewlett Foundation, March 14.
Krawchenko, T.A. and M. Gordon, 2021: How Do We Manage a Just Transition? A Comparative Review of National and Regional Just Transition Initiatives. Sustainability, 13(11) , 6070, doi:10.3390/su13116070.
Kreft, S. and L. Schäfer, 2017: The G20’ s role on climate risk insurance & pooling: Weathering Climate Change through Climate Risk Transfer Solutions.Munich Climate Insurance Initiative, Bonn, Germany, 1–8 pp. http://www.climate-insurance.org/fileadmin/user%7B%5C_%7Dupload/ 20170316%7B%5C_%7DMCII%7B%5C_%7DG20%7B%5C_% 7DPosition%7B%5C_%7D2017.pdf (Accessed November 1, 2021).
Kriegler, E. et al., 2015: Making or breaking climate targets: The AMPERE study on staged accession scenarios for climate policy. Technol. Forecast. Soc. Change, 90, 24–44, doi:10.1016/j.techfore.2013.09.021.
Krogstrup, S. and W. Oman, 2019: Macroeconomic and Financial Policies for Climate Change Mitigation: A Review of the Literature. IMF, Washington, DC, USA, 58 pp. https://www.imf.org/en/Publications/WP/Issues/2019/09/04/Macroeconomic-and-Financial-Policies-for-Climate-Change-Mitigation-A-Review-of-the-Literature-48612 (Accessed November 1, 2021).
Kuhl, L., 2021: Policy making under scarcity: reflections for designing socially just climate adaptation policy. One Earth, 4(2) , 202–212, doi:10.1016/j.oneear.2021.01.008.
Kumar, A., W. Xin, and C. Zhang, 2019: Climate Sensitivity and Predictable Returns. SSRN Electron. J. , doi:10.2139/ssrn.3331872.
Kuramochi, T. et al., 2020: Beyond national climate action: the impact of region, city, and business commitments on global greenhouse gas emissions. Clim. Policy, 20(3) , 275–291, doi:10.1080/14693062.2020.1740150.
Kuzemko, C. et al., 2020: Covid-19 and the politics of sustainable energy transitions. Energy Res. Soc. Sci. , 68, 101685, doi:10.1016/j.erss. 2020.101685.
Kyriakou, V., I. Garagounis, E. Vasileiou, A. Vourros, and M. Stoukides, 2017: Progress in the Electrochemical Synthesis of Ammonia. Catal. Today, 286, 2–13, doi:10.1016/j.cattod.2016.06.014.
Laing, T., L. Taschini, and C. Palmer, 2016: Understanding the demand for REDD+ credits. Environ. Conserv. , 43(4) , 389–396, doi:10.1017/S0376892916000187.
Lamperti, F., V. Bosetti, A. Roventini, and M. Tavoni, 2019: The public costs of climate-induced financial instability. Nat. Clim. Change, 9(11) , 829–833, doi:10.1038/s41558-019-0607-5.
Langhorne, E., 2021: How one pension fund identified investment opportunities in Africa. USAID Invest , July 8. https://www.marketlinks.org/blogs/how-one-pension-fund-identified-investment-opportunities-africa (Accessed November 1, 2021).
Larcker, D.F. and E.M. Watts, 2020: Where’s the greenium?J. Account. Econ. , 69(2–3) , 101312, doi:10.1016/j.jacceco.2020.101312.
Larsen, G., G. Christianson, and N. Amerasinghe, 2019: So Far, Green Bonds Fail to Raise Much Money for Resilience. The Climate Resilience Principles Aim to Change That. World Resources Institute Blog, October 15.
Laskaridis, C., 2021: When push came to shove: COVID-19 and debt crises in low-income countries. Can. J. Dev. Stud. / Rev. Can. d’études du développement , 42(1–2) , 200–220, doi:10.1080/02255189.2021.1894102.
Lawrence, A. and F. Archer, 2021: The project finance law review: Export credit agencies and insurers. Law Review, June 23.
Le De, L., J.C. Gaillard, and W. Friesen, 2013: Remittances and disaster: a review. Int. J. Disaster Risk Reduct. , 4, 34–43, doi:10.1016/j.ijdrr.2013.03.007.
Le Quéré, C. et al., 2020: Temporary reduction in daily global CO2 emissions during the COVID-19 forced confinement. Nat. Clim. Change, 10(7) , 647–653, doi:10.1038/s41558-020-0797-x.
Le Quéré, C. et al., 2021: Fossil CO2 emissions in the post-COVID-19 era. Nat. Clim. Change, 11(3) , 197–199, doi:10.1038/s41558-021-01001-0.
Le Quesne, F. et al., 2017: The role of insurance in integrated disaster & climate risk management: Evidence and lessons learned. United Nations University, Institute for Environment and Human Security (UNU-EHS) UNU-EHS Publication Series Report 2017 No. 22. UNU, Bonn, Germany, 68 pp. http://collections.unu.edu/eserv/UNU:6312/MCII_ ACRI__1710020_Online-meta.pdf (Accessed November 1, 2021).
Leaton, J. and L.L.B.-L. Sussams, 2011: Unburnable carbon: Are the world’s financial markets carrying a carbon bubble? 13th July 2011. Carbon Tracker Initiative, London, UK. 33 pp. https://carbontracker.org/reports/carbon-bubble/ (Accessed November 1, 2021).
Leck, H. and D. Roberts, 2015: What lies beneath: understanding the invisible aspects of municipal climate change governance. Curr. Opin. Environ. Sustain. , 13, 61–67, doi:10.1016/j.cosust.2015.02.004.
Lee, C., A. Betru, and P. Horrocks, 2018: Guaranteeing the goals: Adapting public sector guarantees to unlock blended financing for the U.N. Sustainable Development Goals. Milken Institute and OECD, Santa Monica, CA, USA, and Paris, France, 44 pp.
Lee, I. and Y.J. Shin, 2018: Fintech: Ecosystem, business models, investment decisions, and challenges. Bus. Horiz. , 61(1) , 35–46, doi:10.1016/j.bushor.2017.09.003.
Lefèvre, J., W. Wills, and J.-C. Hourcade, 2018: Combining low-carbon economic development and oil exploration in Brazil? An energy–economy assessment. Clim. Policy, 18(10) , 1286–1295, doi:10.1080/14693062.2018.1431198.
Lehmann, P. et al., 2021: Making the COVID-19 crisis a real opportunity for environmental sustainability. Sustain. Sci. , 16 (6), pp.2137–2145., doi:10.1007/s11625-021-01003-z.
Lei, N., E. Masaneta, and J. Koomey, 2021: Best practices for analyzing the direct energy use of blockchain technology systems: Review and policy recommendations. Energy Policy, Volume 156. doi: 10.1016/j.enpol.2021.112422.
Lindenberg, N. and P. Pauw, 2013: Don’t lump together apples and oranges-Adaptation finance is different from mitigation finance. German Institute of Development and Sustainability, Bonn, Germany, 3 pp. https://www.die-gdi.de/en/the-current-column/article/dont-lump-together-apples-and-oranges-adaptation-finance-is-different-from-mitigation-finance-1/ (Accessed November 1, 2021).
Linquiti, P. and N. Cogswell, 2016: The Carbon Ask: effects of climate policy on the value of fossil fuel resources and the implications for technological innovation. J. Environ. Stud. Sci. , 6(4) , 662–676, doi:10.1007/s13412-016-0397-2.
Liu, W., W. McKibbin, and F. Jaumotte, 2021: Mitigating Climate Change: Growth-Friendly Policies to Achieve Net Zero Emissions by 2050. IMF Working Paper, 2021(195) , 1, doi:10.5089/9781513592978.001.
Liu, Y., L. Wu, and J. Li, 2019: Peer-to-peer (P2P) electricity trading in distribution systems of the future. Electr. J. , 32(4) , 2–6, doi:https://doi.org/10.1016/j.tej.2019.03.002.
Liverman, D.M., 2018: Geographic perspectives on development goals. Dialogues Hum. Geogr. , 8(2) , 168–185, doi:10.1177/2043820618780787.
Livingston, D., V. Sivaram, M. Freeman, and M. Fiege, 2018: Applying Blockchain Technology to Electric Power Systems. Council on Foreign Relations, New York, NY, USA. 37 pp. https://cdn.cfr.org/sites/default/files/report%7B%5C_%7Dpdf/Discussion%7B%5C_ %7DPaper%7B%5C_%7DLivingston%7B%5C_%7Det%7B%5C_ %7Dal%7B%5C_%7DBlockchain%7B%5C_%7DOR%7B%5C _%7D0.pdf (Accessed November 1, 2021).
Long, J., 2021: Crisis Capitalism and Climate Finance: The Framing, Monetizing, and Orchestration of Resilience-Amidst-Crisis. Polit. Gov. , 9(2) , 51–63, doi:10.17645/pag.v9i2.3739.
Lontzek, T.S., Y. Cai, K.L. Judd, and T.M. Lenton, 2015: Stochastic integrated assessment of climate tipping points indicates the need for strict climate policy. Nat. Clim. Change, 5(5) , 441–444, doi:10.1038/nclimate2570.
Lowry, R.C., J.E. Alt, and K.E. Ferree, 1998: Fiscal Policy Outcomes and Electoral Accountability in American States. Am. Polit. Sci. Rev. , 92(4) , 759–774, doi:10.2307/2586302.
LSEG, 2017: Nigeria’s first Diaspora Bond starts trading on London Stock Exchange. London Stock Exchange Group (LSEG), LSEG Press Release, June 29.
LSEG, 2018: London Stock Exchange Africa Advisory Group Report of Recommendations - Developing the Green Bond Market in Africa. London Stock Exchange Group, London, UK, 16 pp. https://www.lseg.com/sites/default/files/content/documents/Africa%7B%5C_%7D GreenFinancing%7B%5C_%7DMWv10%7B%5C_%7D0.pdf (Accessed November 1, 2021).
Lubell, M. and T.H. Morrison, 2021: Institutional navigation for polycentric sustainability governance. Nat. Sustain volume 4, pp 664–671 (2021), doi:10.1038/s41893-021-00707-5.
Lucas, B., 2015: Disaster risk financing and insurance in the Pacific (GSDRC Helpdesk Research Report 1314). GSDRC, Birmingham, 15 pp.http://www.gsdrc.org/wp-content/uploads/2016/01/HDQ1314.pdf (Accessed November 1, 2021).
Lucas, P.L. et al., 2015: Future energy system challenges for Africa: Insights from Integrated Assessment Models. Energy Policy, 86, 705–717, doi:10.1016/j.enpol.2015.08.017.
Luderer, G. et al., 2018: Residual fossil CO2 emissions in 1.5–2 °C pathways. Nat. Clim. Change, 8(7) , 626–633, doi:10.1038/s41558-018-0198-6.
Lujan, B. and G. Silva-Chávez, 2018: Mapping Forest Finance: A Landscape of Available Sources of Finance for REDD+ and Climate Action in Forests. Environmental Defense Fund and Forest Trends, New York, NY, USA and Washington, D.C., USA, 48 pp. https://www.forest-trends.org/wp-content/uploads/2018/04/doc_5734.pdf (Accessed November 1, 2021).
Lumenaza, 2020: Accelerating new energy. Together. https://www.lumenaza.de/en/home/ (Accessed November 1, 2021).
Ma, Z., J.D. Billanes, and B.N. Jørgensen, 2017: Aggregation Potentials for Buildings—Business Models of Demand Response and Virtual Power Plants. Energies, 10(10) , 1646, doi:10.3390/en10101646.
MacAskill, S., E. Roca, B. Liu, R.A. Stewart, and O. Sahin, 2021: Is there a green premium in the green bond market? Systematic literature review revealing premium determinants. J. Clean. Prod. , 280, 124491, doi:10.1016/j.jclepro.2020.124491.
MacFeely, S. and N. Barnat, 2017: Statistical capacity building for sustainable development: Developing the fundamental pillars necessary for modern national statistical systems. Stat. J. IAOS, 33(4) , 895–909, doi:10.3233/SJI-160331.
Maclurcan, D. and J. Hinton, 2019: How on Earth: Flourishing in a Not-for-Profit World by 2050. Post Growth Publishing, 266 pp. doi.org/10.48550/arXiv.1902.01398.
Maffettone, P. and C. Oldani, 2020: COVID‐19: A Make or Break Moment for Global Policy Making. Glob. Policy, 11(4) , 501–507, doi:10.1111/1758-5899.12860.
Maguire, P. et al., 2021: A green growth spurt: State of forest carbon finance 2021. Ecosystem Marketplace Insights Report June 2021, Forest Trends, Washington D.C., USA.
Mahmud, S. and S. Huq, 2018: Report on the Planning Meeting of the LUCCC Partners. The Frati, Bellagio Study and Conference Center of the Rockefeller Foundation, Italy. ICCCAD. 17 pp. http://www.icccad.net/wp-content/uploads/2018/11/Final_LUCCC_Bellagio-Workshop-2018_-Report.pdf (Accessed August 24, 2021).
Maiti, M., 2021: Is ESG the succeeding risk factor?J. Sustain. Financ. Invest. , 11(3) , 199–213, doi:10.1080/20430795.2020.1723380.
Mallucci, E., 2020: Natural Disasters, Climate Change, and Sovereign Risk. Int. Financ. Discuss. Pap. , 2020(1291r1) , 1–34, doi:10.17016/IFDP.2020.1291r1.
Maltais, A. and B. Nykvist, 2020: Understanding the role of green bonds in advancing sustainability. J. Sustain. Financ. Invest. , doi:10.1080/20430795.2020.1724864.
Mamun, A., W. Martin, and S. Tokgoz, 2019: Reforming agricultural support for improved environmental outcomes. IFPRI Discussion Paper, December.
Mandel, A., 2020: Risks on Global Financial Stability Induced by Climate Change. SSRN Electron. J. , doi:10.2139/ssrn.3626936.
Manilla, R.J., 2018: Mission, Money & Markets: Making ‘cents’ of guarantees, the view from a CIO. Kresge Found. , Troy, MI, USA. https://kresge.org/news-views/mission-money-markets-making-cents-of-guarantees-the-view-from-a-cio/ (Accessed October 14, 2021).
Marinoni, O., P. Adkins, and S. Hajkowicz, 2011: Water planning in a changing climate: Joint application of cost utility analysis and modern portfolio theory. Environ. Model. & Softw. , 26(1) , 18–29, doi:10.1016/j.envsoft.2010.03.001.
Markandya, A. and M. González-Eguino, 2019: Integrated Assessment for Identifying Climate Finance Needs for Loss and Damage: A Critical Review. In: Mechler, R., Bouwer, L., Schinko, T., Surminski, S., Linnerooth-Bayer, J. (eds) Los s and Damage from Climate Change. Climate Risk Management, Policy and Governance. Springer, Cham, Switzerland, pp. 343–362. doi: 10.1007/978-3-319-72026-5_14.
Markandya, A., J. Salcone, S. Hussain, A. Mueller, and S. Thambi, 2021: Covid, the Environment and Food Systems: Contain, Cope and Rebuild Better. Front. Environ. Sci. , 9, doi:10.3389/fenvs.2021.674432.
Martinez-Diaz, L., L. Sidner, and J. Mcclamrock, 2019: The Future of Disaster Risk Pooling for Developing Countries: Where Do We Go From Here?Working Paper August 2019, WRI, Washington, DC, USA, 64 pp.
Mathews, J.A. and S. Kidney, 2012: Financing climate-friendly energy development through bonds. Dev. South. Afr. , 29(2) , 337–349, doi:10.1080/0376835X.2012.675702.
Matias, D.M., R. Fernández, M.-L. Hutfils, and M. Winges, 2018: Pro-Poor Climate Risk Insurance – The Role of Community-BasedOrganisations (CBOs). Briefing Paper, German Development Institute, Bonn, Germany, 4 pp. doi: 10.23661/bp19.2018.
Matsumura, W. and Z. Adam, 2019: Fossil fuel consumption subsidies bounced back strongly in 2018. Comment. - IEA, Paris, France.
Matthäus, D. and M. Mehling, 2020: De-risking Renewable Energy Investments in Developing Countries: A Multilateral Guarantee Mechanism. Joule, 4(12) , 2627–2645, doi:10.1016/j.joule.2020.10.011.
Mawdsley, E., 2018: ‘From billions to trillions’: Financing the SDGs in a world ‘beyond aid.’Dialogues Hum. Geogr. , 8(2) , 191–195, doi:10.1177/2043820618780789.
Mazzucato, M. and C.C.R. Penna, 2016: Beyond market failures: the market creating and shaping roles of state investment banks. J. Econ. Policy Reform, 19(4) , 305–326, doi:10.1080/17487870.2016.1216416.
Mbeng Mezui, C.A. and B. Hundal, 2013: Structured Finance: Conditions for Infrastructure Project Bonds in African Markets. African Development Bank Group, Abidjan, Côte d’Ivoire, 420 pp.
McCauley, D. and R. Heffron, 2018: Just transition: Integrating climate, energy and environmental justice. Energy Policy, 119, 1–7, doi:10.1016/j.enpol.2018.04.014.
McCollum, D.L. et al., 2018: Energy investment needs for fulfilling the Paris Agreement and achieving the Sustainable Development Goals. Nat. Energy, 3(7) , 589–599, doi:10.1038/s41560-018-0179-z.
McFarland, B.J., 2015: International Finance for REDD+ Within the Context of Conservation Financing Instruments. J. Sustain. For. , 34(6–7) , 534–546, doi:10.1080/10549811.2015.1017109.
McGlade, C. and P. Ekins, 2015: The geographical distribution of fossil fuels unused when limiting global warming to 2 °C. Nature, 517(7533) , 187–190, doi:10.1038/nature14016.
MCII, 2018: Submission on the type and nature of actions to address loss and damage for which finance may be required. Munich Climate Insurance Initiative (MCII), Bonn, Germany, 12 pp. https://cop23.unfccc.int/sites/default/files/resource/MCII Submission to the Excom_Feb2018.pdf (Accessed November 1, 2021).
McKibbin, W. and D. Vines, 2020: Global Macroeconomic Cooperation in response to the COVID-19 pandemic: a roadmap for the G20 and IMFOxford Review of Economic Policy, Volume 36, Issue Supplement_1, 2020, Pages S297–S337, doi: 10.1093/oxrep/graa032.
McKibbin, W.J. and P.J. Wilcoxen, 2013: A Global Approach to Energy and the Environment. In: Handbook of Computable General Equilibrium Modeling, Handbook of Computable General Equilibrium Modeling. 2013; 1: 995–1068., pp. 995–1068. doi: 10.1016/B978-0-444-59568-3.00015-8McKinsey, 2020a: How the European Union could achieve net-zero emissions at net-zero cost. McKinsey Sustainability, London, UK, https://www.mckinsey.com/capabilities/sustainability/our-insights/how-the-european-union-could-achieve-net-zero-emissions-at-net-zero-cost (Accessed November 1, 2021).
McKinsey, 2020b: Climate change and P&C insurance: The threat and opportunity. McKinsey Sustainability, London, UK, https://www.mckinsey.com/industries/financial-services/our-insights/climate-change-and-p-and-c-insurance-the-threat-and-opportunity (Accessed November 1, 2021).
McManus, R. and F.G. Ozkan, 2015: On the consequences of pro-cyclical fiscal policy. Fisc. Stud. , 36(1) , 29–50, doi:10.1111/j.1475-5890.2015.12044.x.
MDBs, 2018: Multilateral Development Banks (MDBs) Announced a Joint Framework for Aligning their Activities with the Goals of the Paris Agreement. World Bank Press Release, December 3 World Bank, Washington, D.C., USA.
Mechler, R. et al., 2020: Loss and Damage and limits to adaptation: recent IPCC insights and implications for climate science and policy. Sustain. Sci. , 15, doi:10.1007/s11625-020-00807-9.
Meckling, J., N. Kelsey, E. Biber, and J. Zysman, 2015: Winning coalitions for climate policy. Science, 349(6253) , 1170–1171, doi:10.1126/science.aab1336.
MEFIN Network and GI RFPI Asia, 2016: Diagnostic toolkit for insurance against natural catastrophes for MSMEs in the agricultural and mining sectors. GIZ, Bonn, Germany.
Meinshausen, M. et al., 2009: Greenhouse-gas emission targets for limiting global warming to 2 °C. Nature, 458(7242) , 1158–1162, doi:10.1038/nature08017.
Meltzer, J.P., 2016: Financing Low Carbon, Climate Resilient Infrastructure: The Role of Climate Finance and Green Financial Systems. Global Economy & Development Working Paper 96 | September 2016. Brookings Institution, Washington, D.C., USA. doi:10.2139/ssrn.2841918.
Meltzer, J.P., 2018: Blending Climate Funds to Finance Low-Carbon, Climate-Resilient Infrastructure. Global Economy & Development Working Paper 120. Brookings Institution, Washington, D.C., USA doi:10.2139/ssrn.3205293.
Menanteau, P., D. Finon, and M.-L. Lamy, 2003: Prices versus quantities: choosing policies for promoting the development of renewable energy. Energy Policy, 31(8) , 799–812, doi:10.1016/S0301-4215(02)00133-7.
Mengelkamp, E. et al., 2018: Designing microgrid energy markets: A case study: The Brooklyn Microgrid. Appl. Energy, 210, 870–880, doi.org/10.1016/j.apenergy.2017.06.054.
Mercer, 2018: Investment in African Infrastructure: Challenges and Opportunities. Mercer, New York, NY, USA. 42 pp. https://www.mmc.com/content/dam/mmc-web/insights/publications/2018/november/Infrastructure-investing-in-Africa/gl-2018-wealth-investment-opportunities-in-african-infrastructure-summary-report-mercer-1.pdf (Accessed November 1, 2021).
Mercure, J.-F. et al., 2016: Policy-induced energy technological innovation and finance for low-carbon economic growth. European Commission, Brussels, Belgium. 78 pp. https://ec.europa.eu/energy/sites/ener/files/documents/ENER%20Macro-Energy_Innovation_D2%20Final%20%28Ares%20registered%29.pdf (Accessed November 1, 2021).
Mercure, J.-F. et al., 2018a: Macroeconomic impact of stranded fossil fuel assets. Nat. Clim. Change, 8(7) , 588–593, doi:10.1038/s41558-018-0182-1.
Mercure, J.-F., A. Lam, S. Billington, and H. Pollitt, 2018b: Integrated assessment modelling as a positive science: private passenger road transport policies to meet a climate target well below 2 °C. Clim. Change, 151(2) , 109–129, doi:10.1007/s10584-018-2262-7.
Mercure, J.-F. et al., 2019: Modelling innovation and the macroeconomics of low-carbon transitions: theory, perspectives and practical use. Clim. Policy, 19(8) , 1019–1037, doi:10.1080/14693062.2019.1617665.
Mercure, J.-F. et al., 2021: Reframing incentives for climate policy action. Nat. Energy, 6, 1133–1143, doi:10.1038/s41560-021-00934-2.
Mésonnier, J.-S. and B. Nguyen, 2021: Showing off cleaner hands: mandatory climate-related disclosure by financial institutions and the financing of fossil energy. Working Paper Series no. 800, Banque de France, Paris, France.
Micale, V., C. Wetherbee, R. Macquarie, and P. Rosane, 2020: A Proposed Method for Measuring Paris Alignment of New Investment . Climate Policy Initiative, San Francisco, CA, USA. 44 pp. https://www.climatepolicyinitiative.org/wp-content/uploads/2020/12/2.-A-Proposed-Method-for-Measuring-Paris-Alignment-of-New-Investment-3.pdf (Accessed November 1, 2021).
Michaelowa, A., M. Allen, and F. Sha, 2018: Policy instruments for limiting global temperature rise to 1.5°C – can humanity rise to the challenge?Clim. Policy, 18(3) , 275–286, doi:10.1080/14693062.2018.1426977.
Michaelowa, A., I. Shishlov, and D. Brescia, 2019: Evolution of international carbon markets: lessons for the Paris Agreement. Wiley Interdiscip. Rev. Clim. Chang. , 10(6) , doi:10.1002/wcc.613.
Michaelowa, A., S. Hoch, A.-K. Weber, R. Kassaye, and T. Hailu, 2021: Mobilising private climate finance for sustainable energy access and climate change mitigation in Sub-Saharan Africa. Clim. Policy, 21(1) , 47–62, doi:10.1080/14693062.2020.1796568.
Mieu, B., 2021: France begins transfer of €5bn to BCEAO as part of CFA franc reform. The Africa Report, May 5 2021. https://www.theafricareport.com/85566/france-begins-transfer-of-e5bn-to-bceao-as-part-of-cfa-franc-reform/ (Accessed November 1, 2021).
Milbank, C., D. Coomes, and B. Vira, 2018: Assessing the progress of REDD+ projects towards the sustainable development goals. Forests, 9(10) , 589, doi:10.3390/f9100589.
Miles, D., 1993: Testing for Short Termism in the UK Stock Market. Econ. J. , 103(421) , 1379, doi:10.2307/2234472.
Miles, K. and M. Wiedmaier-Pfister, 2018: Applying a gender lens to climate risk finance and insurance. InsuResilience Global Partnership Secretariat, Bonn, Germany, 44 pp.
Millar, R.J. et al., 2017: Emission budgets and pathways consistent with limiting warming to 1.5 °C. Nat. Geosci. , 10(10) , 741–747, doi:10.1038/ngeo3031.
Minniti, M. and W. Naudé, 2010: What Do We Know About The Patterns and Determinants of Female Entrepreneurship Across Countries?Eur. J. Dev. Res. , 22(3) , 277–293, doi:10.1057/ejdr.2010.17.
MIT, 2016: The value of Aggregators in Electricity Systems. MITei working paper, MIT, Cambridge, MA, USA, 28 pp.
Mitchell, T., 2015: Addressing the Financing and Debt Challenges of Commonwealth Small States. Commonwealth Secretariat, London, UK, 12 pp. doi: 10.14217/5js65z34ffvl-en.
Mkandawire, T., 2010: Aid, Accountability, and Democracy in Africa. Soc. Res. 77(2) 1149–1182.
MoE Fiji 2020, 2020: Fiji Sovereign Green Bond Impact Report 2018. MoE Fiji, Suva, Fiji, https://www.jstor.org/stable/23347123 (Accessed November 1, 2021).
Moftakhari, H. et al., 2021: Enabling incremental adaptation in disadvantaged communities: polycentric governance with a focus on non-financial capital. Clim. Policy, 21(3) , 396–405, doi:10.1080/14693062.2020.1833824.
Mok, S., E. Mačiulytė, P.H. Bult, and T. Hawxwell, 2021: Valuing the Invaluable(?)—A Framework to Facilitate Stakeholder Engagement in the Planning of Nature-Based Solutions. Sustainability, 13(5) , 2657, doi:10.3390/su13052657.
Moles-Grueso, S., P. Bertoldi, and B. Boza-Kiss, 2021: Energy Performance Contracting in the Public Sector of the EU - 2020. EUR 30614 EN, Publications Office of the European Union, Luxembourg, 133 pp. doi:10.2760/171970.
Monasterolo, I., 2020: Embedding finance in the macroeconomics of climate change: research challenges and opportunities ahead. CESifo Working Paper, 21(4) , 25–32.
Monasterolo, I. and M. Raberto, 2017: Is There a Role for Central Banks in the Low-Carbon Transition? A Stock-Flow Consistent Modelling Approach. SSRN Electron. J. , doi:10.2139/ssrn.3075247.
Monasterolo, I. and M. Raberto, 2018: The EIRIN Flow-of-funds Behavioural Model of Green Fiscal Policies and Green Sovereign Bonds. Ecol. Econ. , 144 (July 2017), 228–243, doi:10.1016/j.ecolecon.2017.07.029.
Monasterolo, I. and S. Battiston, 2020: Assessing Forward-Looking Climate Risks in Financial Portfolios: A Science-Based Approach for Investors and Supervisors. In: NGFS Occasional paper. Case Studies of Environmental Risk Analysis Methodologies. Central Banks and Supervisors Network for Greening the Financial System (NGFS), pp. 52–72.
Monasterolo, I. and L. de Angelis, 2020: Blind to carbon risk? An analysis of stock market reaction to the Paris Agreement. Ecol. Econ. , 170 (October 2019), 106571, doi:10.1016/j.ecolecon.2019.106571.
Monasterolo, I., S. Battiston, A.C. Janetos, and Z. Zheng, 2017: Vulnerable yet relevant: the two dimensions of climate-related financial disclosure. Clim. Change, 145(3–4) , 495–507, doi:10.1007/s10584-017-2095-9.
Moody’s Investors Service, 2016: CPV Power Plant No.1 Bond SPV (RF) Limited. 9 pp. http://www.verdigris.co.za/wp-content/uploads/2017/12/20160526-Moodys-CPV-Credit-Opinion.pdf (Accessed November 1, 2021).
Moody’s Investors Service, 2020: The Rockefeller Foundation, NY: New Issuer. 8 pp. www.moodys.com.
Moody’s Investors Service, 2021: Government of Ghana - B3 negative: Annual credit analysis. 30 pp.
Morena, E., 2018: L’odeur de l’argent: les fondations philanthropiques dans le débat climatique international. Rev. Int. Strat. , 109(1) , 115, doi:10.3917/ris.109.0115.
Morgan Stanley, 2017: Sustainable Signals New Data from the Individual Investor. Morgan Stanley Institute For Sustainable Investing, New York, NY, USA. 7 pp.
Morita, K. and K. Matsumoto, 2018: Synergies among climate change and biodiversity conservation measures and policies in the forest sector: A case study of Southeast Asian countries. For. Policy Econ. , 87 (September 2017), 59–69, doi:10.1016/j.forpol.2017.10.013.
Moro, A., O. Walker, and A. Hooks, 2018: The Demand for Financing Climate Projects in Cities. C40 Cities Finance Facility, London, UK, 17 pp. https://cff-prod.s3.amazonaws.com/storage/files/QMDd8kN4kaVWSby CrR7zN4NveA1gh9NgOCOscnhG.pdf (Accessed November 1, 2021).
Morse, A., 2015: UK Guarantees scheme for infrastructure. National Audit Office, London, UK, 65 pp.
Moyo, D., 2009: Dead Aid:Why aid is not working. Dead Aid Why aid is not Working and how there is a better Way for AfricaFarrar, Straus and Giroux, New York, NY, USA, pp. 29–47.
Muhmad, S.N. and R. Muhamad, 2020: Sustainable business practices and financial performance during pre- and post-SDG adoption periods: a systematic review. J. Sustain. Financ. Invest. , 11(4) , 291–309, doi:10.1080/20430795.2020.1727724.
Munich RE, 2019: The natural disasters of 2018 in figures: Losses in 2018 dominated by wildfires and tropical storms. Munich RE, Munich, Germany.
Murphy, D. and J.-E. Parry, 2020: Filling the Gap: A review of Multilateral Development Banks’ efforts to scale up financing of climate adaptation. IISD, Manitoba, Canada, 47 pp. https://www.iisd.org/system/files/2020-12/filling-gap-financing-climate-adaptation.pdf (Accessed November 1, 2021).
Muttitt, G. and S. Kartha, 2020: Equity, climate justice and fossil fuel extraction: principles for a managed phase out. Clim. Policy, 20(8) , 1024–1042, doi:10. 1080/14693062.2020.1763900.
Mysiak, J. et al., 2018: Brief communication: Strengthening coherence between climate change adaptation and disaster risk reduction. Nat. Hazards Earth Syst. Sci. , 18(11) , 3137–3143, doi:10.5194/nhess-18-3137-2018.
Nae, T.-M. and N.-A. Panie, 2021: European Green Deal: The Recovery Strategy Addressing Inequalities. J. East. Eur. Res. Bus. Econ. , 2021, 887980, doi:10.5171/2021.887980.
Nakhooda, S. et al., 2014a: Climate Finance: Is it making a difference?ODI, London, UK.
Nakhooda, S. et al., 2014b: Ten things to know about Climate Finance in 2014. ODI briefing/policy papers December 5 2014, ODI, London, UK.
Nanayakkara, M. and S. Colombage, 2019: Do investors in Green Bond market pay a premium? Global evidence. Appl. Econ. , 51(40) , 4425–4437, doi:10.1080/00036846.2019.1591611.
NAP Global Network, 2017: Financing National Adaptation Plan (NAP) Processes: Contributing to the achievement of nationally determined contribution (NDC) adaptation goals. NAP Globa Netowrk, Winnipeg, Manitoba, Canada, 74 pp. http://napglobalnetwork.org/wp-content/uploads/2017/08/napgn-en-2017-financing-nap-processes-contributing-to-the-achievement-of-ndc-goals.pdf .
Naqvi, A. and E. Stockhammer, 2018: Directed Technological Change in a Post-Keynesian Ecological Macromodel. Ecol. Econ. , 154 (June), 168–188, doi:10.1016/j.ecolecon.2018.07.008.
Naran, B. et al., 2021: Global landscape of climate finance 2021. Climate Policy Initiative, London, UK, 55 pp. https://www.climatepolicyinitiative.org/wp-content/uploads/2021/10/Global-Landscape-of-Climate-Finance-2021.pdf (Accessed November 1, 2021).
Narassimhan, E., K.S. Gallagher, S. Koester, and J.R. Alejo, 2018: Carbon pricing in practice: a review of existing emissions trading systems. Clim. Policy, 18(8) , 967–991, doi:10.1080/14693062.2018.1467827.
Nassiry, D., 2018: The Role of Fintech in Unlocking Green Finance: Policy Insights for Developing Countries. ADB Institute, Tokyo, Japan, 26 pp. https://www.adb.org/publications/role-fintech-unlocking-green-finance (Accessed November 1, 2021).
Nathwani, J. and D.M. Kammen, 2019: Affordable Energy for Humanity: A Global Movement to Support Universal Clean Energy Access. Proc. IEEE, 107(9) , 1780–1789, doi:10.1109/JPROC.2019.2918758.
National Infrastructure Commission (NIC), 2021: UK National Infrastructure Assessment. https://nic.org.uk/studies-reports/national-infrastructure-assessment/ (Accessed August 18, 2021).
Natixis, 2019: Natixis rolls out its Green Weighting Factor and becomes the first bank to actively manage its balance sheet’s climate impact. Groupe BCPE, Paris, France. https://natixis.groupebpce.com/natixis/en/green-weighting-factor-and-climate-trajectory-rqaz5_111931.html (Accessed November 1, 2021).
Nauman, B., 2020: Green bonds set to keep flying off shelves in 2020. Financial Times, January 7.
NDC Partnership, 2020: Adaptation and NDCs: From Analysis and Planning to Action and Ambition Raising (Extended Report). NDP Partnership, Washington DC, USA, 22 pp. https://ndcpartnership.org/sites/default/files/Extended_Report-Adaptation_and_NDCs_From_Analysis_and_Planning_to_Action_and_Ambition_Raising_October-2020.pdf (Accessed November 1, 2021).
NEA, 1989: Projected costs of generating electricity from power stations for commissioning in the period 1995-2000. OECD, Paris, France. https://inis.iaea.org/search/search.aspx?orig%7B%5C_%7Dq=RN:21072727 (Accessed November 1, 2021).
Nedopil, C., T. Dordi, and O. Weber, 2021: The nature of global green finance standards-evolution, differences, and three models. Sustainability, 13(7) , doi:10.3390/su13073723.
Negreiros, P. et al., 2021: The State of Cities Climate Finance. June.
Nelson, D., M. Huxham, S. Muench, and B. O’Connell, 2016: Policy and investment in German renewable energy. Climate Policy Initiative, San Francisco, USA. 9 pp. https://climatepolicyinitiative.org/wp-content/uploads/2016/04/Policy-and-investment-in-German-renewable-energy-Summary.pdf (Accessed November 1, 2021).
Newell, P. and D. Mulvaney, 2013: The political economy of the ‘just transition.’Geogr. J. , 179(2) , 132–140, doi:10.1111/geoj.12008.
Ng, T.H. and J.Y. Tao, 2016: Bond financing for renewable energy in Asia. Energy Policy, 95, 509–517, doi:10.1016/j.enpol.2016.03.015.
NGFS, 2019: A call for action Climate change as a source of financial risk. Central Banks and Supervisors Network for Greening the Financial System (NGFS), 42 pp. https://www.ngfs.net/sites/default/files/medias/documents/synthese_ngfs-2019_-_17042019_0.pdf (Accessed November 1, 2021).
NGFS, 2020: Annual Report 2019. Central Banks and Supervisors Network for Greening the Financial System (NGFS), Paris, France, 9 pp. https://www.ngfs.net/sites/default/files/medias/documents/ngfs_annual_report_2019.pdf (Accessed November 1, 2021).
Nhamo, G. and S. Nhamo, 2016: Paris (COP21) Agreement: Loss and damage, adaptation and climate finance issues. Int. J. African Renaiss. Stud. - Multi-, Inter- Transdiscipl. , 11(2) , 118–138, doi:10.1080/18186874.2016.1212479.
Nicol, M., I. Shishlov, and I. Cochran, 2017: Green Bonds: what contribution to the Paris Agreement and how to maximize it?Institute for Climate Economics, Paris, France, 12 pp. https://www.i4ce.org/wp-core/wp-content/uploads/2017/12/2017-I4CE-Green-Bonds-Energy-Transition-Exec-Sum.pdf (Accessed November 1, 2021).
Nicol, M., I. Cochran, and I. Shishlov, 2018a: Green Bonds: Improving their contribution to the low-carbon and climate resilient transition. Institute for Climate Economics, Paris, France, https://www.i4ce.org/download/green-bonds-improving-their-contribution/.
Nicol, M., I. Cochran, and I. Shishlov, 2018b: Green Bonds: Improving their contribution to the low-carbon and climate resilient transition. Institute for Climate Economics, Paris, France, 57 pp. https://www.i4ce.org/download/green-bonds-improving-their-contribution/ (Accessed November 1, 2021).
NOAA NCEI, 2019: Billion-Dollar Weather and Climate Disasters: Overview. NOAA National Centers for Environmental Information (NCEI), Washington, D.C., USA. Nordhaus, W., 2015: Climate Clubs: Overcoming Free-riding in International Climate Policy. Am. Econ. Rev. , 105(4) , 1339–1370, doi:10.1257/aer.15000001.
Nordhaus, W., 2018: Projections and uncertainties about climate change in an era of minimal climate policies. Am. Econ. J. Econ. Policy, 10(3) , 333–360, doi:10.1257/pol.20170046.
Nordhaus, W.D., 2007: A review of the Stern Review on the economics of climate change. J. Econ. Lit. , 45(3) , 686–702, doi:10.1257/jel.45.3.686.
Nordpool, 2021: Annual Review 2020: Navigating a changed world. Nordpool, Lysaker, Norway, 17 pp. https://www.nordpoolgroup.com/49eea7/global assets/download-center/annual-report/annual-review-2020.pdf (Accessed November 1, 2021).
Nyfors, T. et al., 2020: Ecological Sufficiency in Climate Policy: Towards Policies for Recomposing Consumption. Futura, (3) , 1–23.
NZAM, 2020: Net Zero Asset Managers Initiative. https://www.netzeroassetmanagers.org/ (Accessed December 1, 2020).
O’Callaghan, B.J., 2021: Are We Building Back Better?: Evidence from 2020 and Pathways for Inclusive Green Recovery Spending. UNEP, Geneva, Switzerland, 57 pp. https://wedocs.unep.org/bitstream/handle/20.500.11822/35281/AWBBB.pdf (Accessed November 1, 2021).
Obregon, L., 2018: Empire, Racial Capitalism and International Law: The Case of Manumitted Haiti and the Recognition Debt. Leiden J. Int. Law, 31(3) , 597–615, doi:10.1017/S0922156518000225.
Obstfeld, M. and E.M. Truman, 2021: The new SDR allocation will benefit all countries. Realtime Economic Issues Watch, March 25.
ODI, 2018: Clean energy project preparation facilities: Mapping the global landscape. ODI, London, UK, 39 pp. https://www.odi.org/publications/11229-clean-energy-project-preparation-facilities (Accessed November 1, 2021).
OECD-DAC, 2021: OECD Blended Finance and Impact Week, Delivering on the 2030 Agenda in the COVID-19 era. OECD Publishing, Paris, France, 18 pp.
OECD, 2015a: Climate Finance in 2013-14 and the USD 100 billion Goal. OECD Publishing, Paris, France, 68 pp.
OECD, 2015b: Aligning Policies for a Low-carbon Economy. OECD Publishing, Paris, France, 242 pp.
OECD, 2015c: Green Investment Banks: Scaling up Private Investment in Low-carbon, Climate-resilient Infrastructure. OECD Publishing, Paris, France, 19 pp. http://www.oecd.org/environment/cc/Green-Investment-Banks-POLICY-PERSPECTIVES-web.pdf (Accessed November 1, 2021).
OECD, 2016: OECD DAC Rio Markers for Climate: Handbook. OECD Publishing, Paris, France, 34 pp.
OECD, 2017a: Pension markets in focus 2017. OECD Publishing, Paris, France, 38 pp. https://www.oecd.org/daf/fin/private-pensions/Pension-Markets-in-Focus-2017.pdf (Accessed November 1, 2021).
OECD, 2017b: Investing in Climate, Investing in Growth. OECD Publishing, Paris, France, 314 pp.
OECD, 2018a: Private Philanthropy for Development, OECD Publishing, Paris, France.
OECD, 2018b: OECD Companion to the Inventory of Support Measures for Fossil Fuels 2018. OECD Publishing, Paris, France.
OECD, 2019a: Climate Finance Provided and Mobilised by Developed Countries in 2013-2017. OECD Publishing, Paris, 48 pp.
OECD, 2019b: DAC: Amounts Mobilised from the Private Sector for Development, OECD Publishing, Paris, France.
OECD, 2019c: Blockchain Technologies as a Digital Enabler for Sustainable Infrastructure. OECD Publishing, Paris, France, 4 pp. https://www.financialcapability.gov.au/files/blockchain-technologies-as-a-digital-enabler-for-sustainable-infrastructure.pdf (Accessed November 1, 2021).
OECD, 2019d: Biodiversity: Finance and the Economic and Business Case for Action. A report prepared by the OECD for the French G7 Presidency and the G7 Environment Ministers’ Meeting, 5-6 May 2019. OECD Publishing, Paris, France. 96 pp. http://www.oecd.org/environment/resources/biodiversity/G7-report-Biodiversity-Finance-and-the-Economic-and-Business-Case-for-Action.pdf (Accessed November 1, 2021).
OECD, 2020a: Climate Change Adaptation and Disaster Risk Reduction. OECD Publishing, Paris, France.
OECD, 2020b: Climate Finance Provided and Mobilised by Developed Countries in 2013-18. OECD Publishing, Paris, France.
OECD, 2020c: Amounts mobilised from the private sector for development – OECD Publishing, Paris, France. https://www.oecd.org/dac/financing-sustainable-development/development-finance-standards/mobilisation.htm (Accessed October 21, 2021).
OECD, 2021a: OECD Secretary-General Tax Report to G20 Finance Ministers and Central Bank Governors – April 2021. OECD Publishing, Paris, France, 100 pp. https://www.oecd.org/tax/oecd-secretary-general-tax-report-g20-finance-ministers-april-2021.pdf (Accessed November 1, 2021).
OECD, 2021b: OECD Economic Outlook, Volume 2021 Issue 1. OECD Publishing, Paris, France, 218 pp.
OECD, 2021c: Climate change and long term fiscal sustainability. OECD Publishing, Paris, France. 46 pp. https://www.oecd.org/gov/budgeting/scoping-paper-on-fiscal-sustainability-and-climate-change.pdf (Accessed November 1, 2021).
OECD, 2021d: OECD Science, Technology and Innovation Outlook 2020. OECD, Paris, France, 207 pp.
OECD and Bloomberg, 2015: Green bonds Mobilising the debt capital markets for a low-carbon transition. OECD Publishing, Paris, France. 24 pp.
OECD and World Bank, 2016 : Climate and Disaster Resilience Financing in Small Island Developing States. OECD Publishing, Paris, France, 70 pp.
Olusoga, D., 2015: The history of British slave ownership has been buried: now its scale can be revealed. The Guardian, July 12.
Omolo, N., P. Mafongoya, O. Ngesa, and K. Voi, 2017: Gender and Resilience to Climate Variability in Pastoralists Livelihoods System: Two Case Studies in Kenya. Sustain. Dev. , 10(2) , 218–227.
Osabuohien, E.S., J.O. Ejemeyovwi, O.B. Ihayere, C.M.W. Gitau, and F.M. Oyebola, 2021: Post-Pandemic Renewable Energy Development in Sub-Saharan Africa. Sustain. Clim. Change, 14(3) , 183–192, doi:10.1089/scc.2020.0077.
Osama, A., N. Eltouny, F. Adel, and M. Adel, 2021: Needs of African countries related to implementing the UN Framework Convention on Climate Change and the Paris Agreement . UNFCCC, Abidjan, Côte d’Ivoire, 179 pp.https://unfccc.int/sites/default/files/resource/NeedsReport_African counties_AfDB_FINAL.pdf (Accessed November 1, 2021).
Oseni, M.O. and M.G. Pollitt, 2016: The promotion of regional integration of electricity markets: Lessons for developing countryies. Energy Policy, 88, 628–638, doi:10.1016/j.enpol.2015.09.007.
Ouazad, A. and M. Kahn, 2019: Mortgage Finance and Climate Change: Securitization Dynamics in the Aftermath of Natural Disasters. National Bureau of Economic Research, Cambridge, MA, USA, 56 pp.
Oxford Economics, 2017: Global infrastructure outlook: Infrastructure investment needs 50 countries, 7 sectors to 2040. Oxford Economics, Sydney, Australia, 213 pp. https://cdn.gihub.org/outlook/live/methodology/Global+Infrastructure+Outlook+-+July+2017.pdf (Accessed November 1, 2021).
Padigala, B. and S. Kraleti, 2014: Financing low carbon urban development through clean development mechanism. Int. J. Environ. Sci. , 5(1) , 98–116, doi:10.6088/ijes.2014050100009.
Pahle, M. et al., 2018: Sequencing to ratchet up climate policy stringency. Nat. Clim. Change, 8(10) , 861–867, doi:10.1038/s41558-018-0287-6.
Pai, S., H. Zerriffi, J. Jewell, and J. Pathak, 2020: Solar has greater techno-economic resource suitability than wind for replacing coal mining jobs. Environ. Res. Lett. , 15(3) , 034065, doi:10.1088/1748-9326/ab6c6d.
Painter, M., 2020: An inconvenient cost: The effects of climate change on municipal bonds. J. Financ. Econ. , 135(2) , 468–482, doi:10.1016/j.jfineco.2019.06.006.
Panda, A. and S. Surminski, 2020: Climate and disaster risk insurance in low income countries: Reflections on the importance of indicators and frameworks for monitoring the performance and impact of CDRI.Centre for Climate Change Economics and Policy Working Paper 377/Grantham Research Institute on Climate Change and the Environment Working Paper 348. London School of Economics and Political Science, London, UK.
Panizza, U. and F. Taddei, 2020: Local Currency Denominated Sovereign Loans A Portfolio Approach to Tackle Moral Hazard and Provide Insurance. IHEID Working Papers 09-2020, Economics Section, The Graduate Institute of International Studies, Geneva, Switzerland.
Paris21, 2018: Istanbul Programme of Action (2011-2020). Preliminary findings. 19 pp. Paris21, Paris, France. https://www.un.org/ohrlls/sites/www.un.org.ohrlls/files/istanbul-programme-of-action-2011-2020-preliminary-findings-el-iza-mohamedou-paris-21-secretariat.pdf (Accessed November 1, 2021).
Partridge, C. and F.R. Medda, 2020: The evolution of pricing performance of green municipal bonds. J. Sustain. Financ. & Invest. , 10(1) , 44–64, doi:10.1080/20430795.2019.1661187.
Paul, H., 2019: Market solutions to help climate victims fail human rights test . ActionAid International, Johannesburg, South Africa, 60 pp.
Pauw, P., K. Mbeva, and H. van Asselt, 2019: Subtle differentiation of countries’ responsibilities under the Paris Agreement. Palgrave Commun. , 5(1) , 86, doi:10.1057/s41599-019-0298-6.
Pauw, W.P. et al., 2016: NDC Explorer. UNFCCC, Bonn, Germany, doi:10.23661/ndc_explorer_2016_1.0.
Pauw, W.P., P. Castro, J. Pickering, and S. Bhasin, 2020: Conditional nationally determined contributions in the Paris Agreement: foothold for equity or Achilles heel?Clim. Policy, 20(4) , 468–484, doi:10.1080/14693062.2019. 1635874.
Peake, S. and P. Ekins, 2017: Exploring the financial and investment implications of the Paris Agreement. Clim. Policy, 17(7) , 832–852, doi:10.1080/14693062.2016.1258633.
Pearson, A.R., C.G. Tsai, and S. Clayton, 2021: Ethics, morality, and the psychology of climate justice. Curr. Opin. Psychol. , 42, 36–42, doi:10.1016/j.copsyc.2021.03.001.
Peltzman, S., 1992: Voters as Fiscal Conservatives. Q. J. Econ. , 107(2) , 327–361, doi:10.2307/2118475.
Pereira dos Santos, P. and M. Kearney, 2018: Multilateral Development Banks’ Risk Mitigation Instruments for Infrastructure Investment . IDB, Washington DC, USA, 40 pp. doi: 10.18235/0001008.
Pereira Dos Santos, P., 2018: Introductory Guide to Infrastructure Guarantee Products from Multilateral Development Banks. IDB, Washington, DC, USA, 48 pp. doi: 10.18235/0001517.
Pereira, J., 2017: Blended Finance: What it is, how it works and how it is used. Oxfam, Oxford, 51 pp. https://www.oxfam.org/en/research/blended-finance-what-it-how-it-works-and-how-it-used (Accessed September 25, 2021).
Perera, L., C. Jubb, and S. Gopalan, 2019: A comparison of voluntary and mandated climate change-related disclosure. J. Contemp. Account. & Econ. , 15(2) , 243–266, doi:10.1016/j.jcae.2019.100157.
Perez, C., 2009: The double bubble at the turn of the century: technological roots and structural implications. Cambridge J. Econ. , 33(4) , 779–805, doi:10.1093/cje/bep028.
Peterson, L. and J. Skovgaard, 2019: Bureaucratic politics and the allocation of climate finance. World Dev. , 117, 72–97, doi:10.1016/j.worlddev.2018.12.011.
Pfaff, N., Altun, O., and Jia, Y., 2021: Overview and Recommendations for Sustainable Finance Taxonomies. International Capital Market Association, Zurich, Switzerland.
Pickering, J., C. Betzold, and J. Skovgaard, 2017: Special issue: managing fragmentation and complexity in the emerging system of international climate finance. Int. Environ. Agreements Polit. Law Econ. , 17(1) , 1–16, doi:10.1007/s10784-016-9349-2.
Pickup, L and Mantero, C, 2017: Transport Infrastructure: Expert group report . Final Report On ‘Transport Accessibility For The EU Outermost Regions’ European Commission, Brussels, Belgium. https://ec.europa.eu/regional_policy/sources/policy/themes/outermost-regions/pdf/transport_report_en.pdf (Accessed November 1, 2021).
PIDG, 2019: Five-Year Strategic Plan 2019-2023. Private Infrastructure Development Group, London, UK, 56 pp. https://www.pidg.org/wp-content/uploads/2020/09/PIDG-Five-Year-Strategic-Plan%7B%5C_ %7D2019-2023%7B%5C_%7Dpublished%7B%5C_%7Dpages.pdf (Accessed November 1, 2021).
Piketty, P., 2020: Confronting racism, repairing history. Le Monde Blog., June 16, 2021.
Pincus, J.A., 1963: The Cost of Foreign Aid. Rev. Econ. Stat. , 45(4) , 360, doi:10.2307/1927920.
Pindyck, R.S., 2013: Climate change policy: What do the models tell us?J. Econ. Lit. , 51(3) , 860–872, doi:10.1257/jel.51.3.860.
Pingali, P., A. Aiyar, M. Abraham, and A. Rahman, 2019: Transforming Food Systems for a Rising India. Springer International Publishing, Cham, Switzerland.
Plank, D.N., 1993: Aid, debt, and the end of sovereignty: Mozambique and its donors. J. Mod. Afr. Stud. , Volume 31, Issue 3, pp. 407 - 430, doi:10.1017/S0022278X00012015.
Pollitt, H. and J.-F. Mercure, 2018a: The role of money and the financial sector in energy-economy models used for assessing climate and energy policy. Clim. Policy, 18(2) , 184–197, doi:10.1080/14693062.2016.1277685.
Pollitt, H. and J.-F. Mercure, 2018b: The role of money and the financial sector in energy-economy models used for assessing climate and energy policy. Clim. Policy, 18(2) , 184–197, doi:10.1080/14693062.2016.1277685.
Pollitt, H., R. Lewney, B. Kiss-Dobronyi, and X. Lin, 2021: Modelling the economic effects of COVID-19 and possible green recovery plans: a post-Keynesian approach. Clim. Policy, 21(10) , 1257–1271, doi:10.1080/14693062.2021.1965525.
Polzin, F., 2017: Mobilizing private finance for low-carbon innovation – A systematic review of barriers and solutions. Renew. Sustain. Energy Rev. , 77 (April), 525–535, doi:10.1016/j.rser.2017.04.007.
Polzin, F., P. von Flotow, and L. Klerkx, 2016: Addressing barriers to eco-innovation: Exploring the finance mobilisation functions of institutional innovation intermediaries. Technol. Forecast. Soc. Change, 103, 34–46, doi:10.1016/j.techfore.2015.10.001.
Prag, A., D. Röttgers, and I. Scherrer, 2018: State-Owned Enterprises and the Low-Carbon Transition. OECD Environment Working Papers, No. 129, OECD Publishing, Paris, France, 57 pp. doi: 10.1787/06ff826b-en.
PwC, 2014: The road ahead: Gaining momentum from energy transformation., PwC global power and utilities, London, UK, https://www.pwc.com/gx/en/utilities/publications/assets/pwc-the-road-ahead.pdf (Accessed November 1, 2021).
PwC, 2015: Africa Asset Management 2020. 136 pp. PwC Asset Management, London, UK, http://www.amafrica2020.com/amafrica2020/docs/am-africa- 2020.pdf (Accessed November 1, 2021).
PWYF, 2020: Aid Transparency Index 2020. Publish What You Find, London, UK, 29 pp.
Qin, Q., F. Liang, L. Li, and Y.M. Wei, 2017: Selection of energy performance contracting business models: A behavioral decision-making approach. Renew. Sustain. Energy Rev. , 72 (February 2016), 422–433, doi:10.1016/j.rser.2017.01.058.
Rainforest Action Network et al., 2020: Banking on Climate Change - Fossil Fuel Finance Report 2020. Rainforest Action Network, San Francisco, CA, USA.
Ramlee, S. and B. Berma, 2013: Financing gap in Malaysian small-medium enterprises: A supply-side perspective. South African J. Econ. Manag. Sci. , 16(5) , 115–126.
Rainforest Action Network et al., 2021: Banking on climate chaos. Rainforest Action Network, San Francisco, CA, USA. 157 pp. https://www.ran.org/wp-content/uploads/2021/03/Banking-on-Climate-Chaos-2021.pdf (Accessed November 1, 2021).
Reboredo, J.C., 2018: Green bond and financial markets: Co-movement, diversification and price spillover effects. Energy Econ. , 74, 38–50, doi:10.1016/j.eneco.2018.05.030.
Reilly, J.M., Y.-H.H. Chen, and H.D. Jacoby, 2021: The COVID-19 effect on the Paris agreement. Humanit. Soc. Sci. Commun. , 8(1) , 16, doi:10.1057/s41599-020-00698-2.
Reisch, L.A. et al., 2021: Mitigating climate change via food consumption and food waste: A systematic map of behavioral interventions. J. Clean. Prod. , 279, 123717, doi:10.1016/j.jclepro.2020.123717.
Rempel, A. and J. Gupta, 2020: Conflicting commitments? Examining pension funds, fossil fuel assets and climate policy in the organisation for economic co-operation and development (OECD). Energy Res. Soc. Sci. , 69, 101736, doi:10.1016/J.ERSS.2020.101736.
REN21, 2016: Renewables 2016 Global Status Report . REN21 Secretariat., Paris, France.
REN21, 2019: Renewables 2019 Global Status Report . REN21 Secretariat., Paris, France. 336 pp.
Rendall, M., 2021: Public debt and intergenerational ethics: how to fund a clean technology ‘Apollo program’?21(7) , 976–982, doi:10.1080/14693062.2021.1935679.
Resano, J.R.M. and S. Gallego, 2021: G-20 Debt Relief Initiatives for Low-Income Countries During the Pandemic. Economic Bulletin, Banco de España, issue 3/2021, Madrid, Spain, 12 pp.
REScoop, 2020: Mutual for Energy Communities. REScoop, Antwerp, Belgium.
Research and Markets, 2017: Virtual Power Plant Market - Industry Forecast, 2017-2023. Allied Market Research, Portland, OR, USA.
Roberts, J.T. and R. Weikmans, 2017: Postface: fragmentation, failing trust and enduring tensions over what counts as climate finance. Int. Environ. Agreements Polit. Law Econ. , 17(1) , 129–137, doi:10.1007/s10784-016-9347-4.
Roberts, J.T. et al., 2021: Rebooting a failed promise of climate finance. Nat. Clim. Change, 11(3) , 180–182, doi:10.1038/s41558-021-00990-2.
Robins, N. and J. Rydge, 2020: Why a just transition is crucial for effective climate action. Vivid Economics, London, UK. https://www.unpri.org/inevitable-policy-response/why-a-just-transition-is-crucial-for-effective-climate-action/4785.article (Accessed November 1, 2021).
Rochedo, P.R.R. et al., 2021: Is Green Recovery Enough? Analysing the Impacts of Post-COVID-19 Economic Packages. Energies, 14(17) , 5567, doi:10.3390/en14175567.
Rockefeller Foundation and Shujog, 2016: IIX women’s livelihood bond. IIX sustainability bonds: Changing finance, financing change. Rockefeller Foundation, Shujog Opportunity for Impact, Singapore, 57 pp.
Rode, J. et al., 2019: Why ‘blended finance’ could help transitions to sustainable landscapes: Lessons from the Unlocking Forest Finance project.’Ecosyst. Serv. , 37 (March), 100917, doi:10.1016/j.ecoser.2019.100917.
Rodríguez-Caballero, C.V. and J.E. Vera-Valdés, 2020: Long-lasting economic effects of pandemics: Evidence on growth and unemployment. Econometrics, 8(3) , 1–16, doi:10.3390/econometrics8030037.
Roncoroni, A., S. Battiston, L.O.L. Escobar Farfan, and S. Martinez-Jaramillo, 2020: Climate risk and financial stability in the network of banks and investment funds.
Roos, M., 2021: Financing the climate transition: London Stock Exchange extends its Sustainable Bond Market. London Stock Exchange News and Insights, February 19.
Rosenow, J. and N. Eyre, 2016: A post mortem of the Green Deal: Austerity, energy efficiency, and failure in British energy policy. Energy Res. & Soc. Sci. , 21, 141–144, doi:10.1016/j.erss.2016.07.005.
Roth, N., T. Thiele, and M. von Unger, 2019: Blue Bonds: financing resilience of coastal ecosystems. BNCFF, Gland, Switzerland. 68 pp. https://www.4climate.com/dev/wp-content/uploads/2019/04/Blue-Bonds_final.pdf (Accessed November 1, 2021).
Röttgers, D. and B. Anderson, 2018: Power struggle: Decarbonising the electricity sector. OECD Environment Working Paper No. 139, OECD, Paris, France. 51 pp.
Rozenberg, J. and M. Fay, 2019: Beyond the Gap: How Countries Can Afford the Infrastructure They Need while Protecting the Planet . World Bank, Washington DC, USA, 175 pp.
Rudebusch, G.D., 2019: Climate Change and the Federal Reserve. FRBSF Economic Letter. FRBSF, San Francisco, USA. https://www.frbsf.org/economic-research/files/el2019-09.pdf .
Ruger, J.P. and R. Horton, 2020: Justice and health: The Lancet–Health Equity and Policy Lab Commission. Lancet , 395(10238) , 1680–1681, doi:10.1016/S0140-6736(20)30928-4.
Saadi Sedik, T. and R. Xu, 2020: A Vicious Cycle: How Pandemics Lead to Economic Despair and Social Unrest . Working Paper No. 2020/216, IMF, Washington, D.C., USA.
Sachs, J.D. and A.M. Warner, 2001: The curse of natural resources. Eur. Econ. Rev. , 45(4–6) , 827–838, doi:10.1016/S0014-2921(01)00125-8.
Saez, E. and G. Zucman, 2020: The Rise of Income and Wealth Inequality in America: Evidence from Distributional Macroeconomic Accounts. J. Econ. Perspect. , 34(4) , 3–26, doi:10.1257/jep.34.4.3.
Saha, D. and S. D’Almeida, 2017: Green Municipal Bonds. In Finance for City Leaders Handbook: Improving Municipal Finance to Deliver Better Services[Kamiya, Macro and L.-Y. Zhang, (eds.)]. UN-Habitat, Nairobi, Kenya. 98–118 pp.
Saldanha, C., 2006: Rethinking Capacity Development. Int. Public Manag. Rev. , 7(2).
Sandler, T., 1998: Global and Regional Public Goods: A Prognosis for Collective Action. Fisc. Stud. , 19(3) , 221–247, doi:10.1111/j.1475-5890.1998.tb00286.x.
Sandler, T., 2015: Collective action: fifty years later. Public Choice, 164(3–4) , 195–216, doi:10.1007/s11127-015-0252-0.
Sardo, M.C., 2020: Responsibility for climate justice: Political not moral. Eur. J. Polit. Theory, doi:10.1177/1474885120955148.
SBN, 2018: Sustainable Banking Network Creating Green Bond Markets – Insights, Innovations, and Tools from Emerging Markets. Sustainable Banking NetworkWashington DC, USA, 74 pp. https://www.ifc.org/wps/wcm/connect/topics%7B%5C_%7Dext%7B%5C_%7Dcontent/ifc%7B%5C_%7Dexternal%7B%5C_%7Dcorporate%7B%5C_%7Dsite/sustainability-at-ifc/publications/publications%7B%5C_%7D report%7B%5C_%7Dsbngreenbond2018 (Accessed November 1, 2021).
Schaeffer, M. et al., 2014: Loss and Damage in Africa. UNECA/ACPC, Addis Ababa, Ethiopia, 59 pp. https://climateanalytics.org/media/uneca__2014__loss_and_damage_in_africa.pdf (Accessed November 1, 2021).
Schaer, C. and N. Kuruppu, 2018: Private-sector action in adaptation: Perspectives on the role of micro, small and medium size enterprises. UNEP DTU Partnership, Copenhagen, Denmark, 198 pp. https://backend.orbit.dtu.dk/ws/files/162053774/MSME_Adaptation_updated_WEB.pdf (Accessed November 1, 2021).
Schäfer, L., E. Waters, S. Kreft, and M. Zissener, 2016: Making climate risk insurance work for the most vulnerable: Seven guiding principles. Unu-Ehs Publication Series Policy Report 2016 No.1, UNU-EHS, Bonn, Germany, 60 pp. https://collections.unu.edu/eserv/UNU:5830/MCII_ProPoor_161031_Online_meta.pdf (Accessed November 1, 2021).
Schäfer, L., K. Warner, and S. Kreft, 2019: Exploring and Managing Adaptation Frontiers with Climate Risk Insurance. In: Loss and Damage from Climate Change, Climate Risk Management, Policy and Governance. Springer, Cham, Luxemburg, pp. 317–341. doi: 10.1007/978-3-319-72026-5_13
Schalatek, L., 2015: From Innovative Mandate to Meaningful Implementation: Ensuring Gender-Responsive Green Climate Fund (GCF) Projects and Programs, Washington, DC, USA, 35 pp.
Schalatek, L., 2018: Gender and Climate Finance. 8 pp. Heinrich Böll Stiftung, Washington D.C., USA ttps://www.odi.org/sites/odi.org.uk/files/resource-documents/11046.pdf (Accessed November 1, 2021).
Schalatek, L., 2020: Gender and Climate Finance. Heinrich Böll Stiftung, Washington DC, USA, 8 pp. https://climatefundsupdate.org/wp-content/uploads/2021/03/CFF10-ENG-2020-Digital.pdf (Accessed November 1, 2021).
Scherer, F.M., D. Harhoff, and J. Kukies, 2000: Uncertainty and the size distribution of rewards from innovation. J. Evol. Econ. , 10(1–2) , 175–200, doi:10.1007/s001910050011.
Scherer, N., 2017: How to Advance Regional Climate Risk Insurances. Policy Brief, Climate Diplomacy, Berlin, Germany.
Scheuer, F. and J. Slemrod, 2021: Taxing Our Wealth. J. Econ. Perspect. , 35(1) , 207–230, doi:10.1257/jep.35.1.207.
Scheyvens, R., G. Banks, and E. Hughes, 2016: The Private Sector and the SDGs: The Need to Move Beyond ‘Business as Usual.’Sustain. Dev. , 24(6) , 371–382, doi:10.1002/sd.1623.
Schiff, H. and H. Dithrich, 2017: Scaling the use of guarantees in U.S. community investing. Global Impact Investing Network, New York, NY, USA, 54 pp.
Schleich, J., X. Gassmann, C. Faure, and T. Meissner, 2016: Making the implicit explicit: A look inside the implicit discount rate. Energy Policy, 97, 321–331, doi:10.1016/j.enpol.2016.07.044.
Schletz, M.C., S. Konrad, F. Staun, and D.D.R. Desgain, 2017: Taking stock of the (I)NDCs of developing countries: regional (I)NDC coverage of mitigation sectors and measures. UNEP, Nairobi, Kenya, 42p.
Schmidt-Traub, G. and J.D. Sachs, 2015: The Roles of Public and Private Development Finance. Sustainable Development Solutions Network, New Work, NY, USA. https://irp -cdn.multiscreensite.com/be6d1d56/files/uploaded/The-Roles-of-Public-and-Private-Development-Finance.pdf (Accessed November 1, 2021).
Schmidt, T.S., 2014: Low-carbon investment risks and de-risking. Nat. Clim. Change, 4(4) , 237–239, doi:10.1038/nclimate2112.
Schmidt, T.S. et al., 2019: Adverse effects of rising interest rates on sustainable energy transitions. Nat. Sustain. , 2(9) , 879–885, doi:10.1038/s41893-019-0375-2.
Schneeweiss, A., 2019: Great Expectations Credibility and Additionality of Green Bonds. Südwind, Bonn, Germany. doi: 10.13140/RG.2.2.15563.64808.
Schoenmaker, D., 2021: Greening monetary policy. Clim. Policy, 21(4) , 581–592, doi:10.1080/14693062.2020.1868392.
Schoenmaker, D. and G. Zachmann, 2015: Can a Global Climate Risk Pool Help the Most Vulnerable Countries?Bruegel, Brussels, Belgium. 8 pp.
Scholtens, B., 2017: Why Finance Should Care about Ecology. Trends Ecol. & Evol. , 32(7) , 500–505, doi:10.1016/j.tree.2017.03.013.
Schroeder, S., 2021: A Kaleckian wealth tax to support a Green New Deal. Econ. Labour Relations Rev. , 32(2) , 190–208, doi:10.1177/10353046211017350.
Schueffel, P., 2018: Taming the Beast: A Scientific Definition of Fintech. SSRN Electron. J. , 4(4) , 32–54, doi:10.2139/ssrn.3097312.
Schumacher, K., 2020: The Shape of Green Fixed Income Investing to Come. J. Environ. Invest. , 10(1) , doi:10.2139/ssrn.3663308.
Schwanitz, V.J., F. Piontek, C. Bertram, and G. Luderer, 2014: Long-term climate policy implications of phasing out fossil fuel subsidies. Energy Policy, 67, 882–894, doi:10.1016/j.enpol.2013.12.015.
Scott, S., 2015: The accidental birth of “official development assistance.” OECD, Paris, France.
Scott, S., 2017: The grant element method of measuring the concessionality of loans and debt relief . Working Paper No. 339, OECD, Paris, France.
Scott, Z., C. Simon, J. McConnell, P.S. Villanueva, 2017: Independent Evaluation of African Risk Capacity (ARC) Final Inception Report. Commissioned by FCDO (ex DFID) and undertaken by Oxford Policy Management, Oxford, UK, 85 pp.
SEADRIF, 2018: Southeast Asia Disaster Risk Insurance Facility., Singapore, 17 pp. https://www.financialprotectionforum.org/file/1754/download? token=7Mcw2NT6.
Searchinger, T.D. et al., 2020: Revising Public Agricultural Support to Mitigate Climate Change. Working Paper, World Bank, Washington, D.C., USAdoi: 10.1596/33677.
SEDA, 2020: Malaysia’s 1st Pilot Run of Peer-to-Peer (P2P) Energy Trading. SEDA, Putrajaya, Malaysia.
Seddon, N. et al., 2020: Understanding the value and limits of nature-based solutions to climate change and other global challenges. Philos. Trans. R. Soc. B Biol. Sci. , 375(1794) , 20190120, doi:10.1098/rstb.2019.0120.
Sellers, S., 2016: Gender and Climate Change: A closer look at existence evidence. Global Gender and Climate Alliance and Women’s Environment and Development Organisation, New York, NY, USA. 27 pp.
SEforALL and CPI, 2020: Energizing finance: Understanding the landscape 2020. Sustainable Energy for All (SEforALL), Vienna, Austria, Washington, DC and New York, NY, USA, 109 pp. https://www.seforall.org/system/files/2020-11/EF-2020-UL-ES-SEforALL.pdf (Accessed November 1, 2021).
Semieniuk, G., E. Campiglio, J. Mercure, U. Volz, and N.R. Edwards, 2021: Low‐carbon transition risks for finance. WIREs Clim. Change, 12(1) , e678, doi:10.1002/wcc.678.
Serdeczny, O., 2019: Non-economic Loss and Damage and the Warsaw International Mechanism. pp. 205–220. In: Mechler, R., Bouwer, L., Schinko, T., Surminski, S., Linnerooth-Bayer, J. (eds) Loss and Damage from Climate Change. Climate Risk Management, Policy and Governance. Springer, Cham, Switzerland, doi: 10.1007/978-3-319-72026-5_8.
Serebrisky, T., A. Suárez-Alemán, D. Margot, and M.C. Ramirez, 2015: Financing Infrastructure in Latin America and the Caribbean: How, How Much and by Whom?IDB, Washington, D.C., 30 pp. https://publications.iadb.org/en/financing-infrastructure-latin-america-and-caribbean-how-how-much-and-whom (Accessed October 30, 2021).
Serenelli, L., 2021: Italy records high demand for first green bond offering. March 4, 2021. IPE. https://www.ipe.com/news/italy-records-high-demand-for-first-green-bond-offering/10051279.article (Accessed November 1, 2021).
Sewell, M., 2011: History of the Efficient Market Hypothesis. Research note 11(04). UCL Department of Computer Science, London, UK.
Shakhovskoy, M., C. Colina, and M.C. Höök, 2019: Pathways to Prosperity: Rural and Agricultural Finance State of the Sector Report . 60 pp. https://isfadvisors.org/wp-content/uploads/2019/11/2019_RAF-State-of-the-Sector-10.pdf (Accessed November 1, 2021).
Shan, Y. et al., 2021: Impacts of COVID-19 and fiscal stimuli on global emissions and the Paris Agreement. Nat. Clim. Chang. , 11(3) , 200–206, doi:10.1038/s41558-020-00977-5.
Shapiro, J., 2020: The Environmental Bias of Trade Policy. NBER WORKING PAPER 26845, NBER, Cambridge, MA, USA. doi: 10.3386/w26845.
Sharma, V., V. Orindi, C. Hesse, J. Pattison, and S. Anderson, 2014: Supporting local climate adaptation planning and implementation through local governance and decentralised finance provision. Dev. Pract. , 24(4) , 579–590, doi:10.1080/09614524.2014.907240.
Shi, L., 2017: Masala bond programme: Nurturing a local currency bond market . EMCompass, no. 30;. International Finance Corporation, Washington, DC, USA. https://openknowledge.worldbank.org/handle/10986/30356 (Accessed November 1, 2021). 3 pp. https://openknowledge.worldbank.org/bitstream/handle/10986/30356/112690-BRI-EMCompass-Note-30-Masala-Bond-Program-PUBLIC.pdf?sequence=1&isAllowed=y.
Shishlov, I., M. Nicol, and I. Cochran, 2018: Environmental integrity of green bonds: stakes, status and next steps. Institute for Climate Economics, Paris, France, 39 pp. https://www.i4ce.org/wp-core/wp-content/uploads/2018/03/I4CE-GreenBondsProgram-Environmental-Integrity-web.pdf (Accessed November 1, 2021).
Silva, A.C. et al., 2020: Staff Note for the G20 International Financial Architecture Working Group: Recent Development on Local Currency Bond Markets in Emerging Economies. World Bank, Washington DC, USA, 30 pp. http://documents.worldbank.org/curated/en/129961580334830825/Staff-Note-for-the-G20-International-Financial-Architecture-Working-Group-IFAWG-Recent-Developments-On-Local-Currency-Bond-Markets-In-Emerging-Economies (Accessed November 1, 2021).
Silver, J., 2015: The potentials of carbon markets for infrastructure investment in sub-Saharan urban Africa. Curr. Opin. Environ. Sustain. , 13, 25–31, doi:10.1016/j.cosust.2014.12.004.
Singh, M.K., V. Kekatos, and C. Liu, 2019: Optimal Distribution System Restoration with Microgrids and Distributed Generators. 2019 IEEE Power Energy Society General Meeting (PESGM) , 1–5.
Singh, N., J. Finnegan, and K. Levin, 2016: MRV 101: Understanding Measurement, Reporting, and Verification of Climate Change Mitigation. WRI, Washington, DC, USA, 27 pp. https://files.wri.org/d8/s3fs-public/MRV_101_0.pdf (Accessed November 1, 2021).
Smart Energy International, 2018: Global trends in smart metering. December 31, 2018. Smart Energy International. Maarssen, Netherlands.
Smith, G., 2021: Where credit is due: how Africa’s debt can be a benefit, not a burden. C Hurst & Co Publishers Ltd, London, UK, 240 pp.
Smoke, P., 2019: Improving Subnational Government Development Finance in Emerging and Developing Economies: Toward a Strategic Approach. Working Paper No: 921. ADBI, Metro Manila, Philippines.
Soanes, M., N. Rai, P. Steele, C. Shakya, and J. Macgregor, 2017: Delivering real change: Getting international climate finance to the local level. International Institute for Environment and Development (IIED), 47 pp.
Sonnen, 2020: What is the sonnen community? Sonnen GmbH, Wildpoldsried, Germany. https://sonnengroup.com/sonnencommunity/ (Accessed November 1, 2021).
Sovacool, B.K., 2016: How long will it take? Conceptualizing the temporal dynamics of energy transitions. Energy Res. Soc. Sci. , 13, 202–215, doi:10.1016/j.erss.2015.12.020.
SSE, 2018: 2018 Report On Progress: A paper prepared for the Sustainable Stock Exchanges 2018 Global Dialogue. Sustainable Stock Exchanges Initiative, New York, NY, USA. 47 pp.
Stadelmann, M., A. Michaelowa, and J.T. Roberts, 2013: Difficulties in accounting for private finance in international climate policy. Clim. Policy, 13(6) , 718–737, doi:10.1080/14693062.2013.791146.
Stanny, E., 2018: Reliability and Comparability of GHG Disclosures to the CDP by US Electric Utilities. Soc. Environ. Account. J. , 38(2) , 111–130, doi:10.1080/0969160X.2018.1456949.
Statistica, 2021: Value of venture capital financing worldwide in 2020, by region (in billion U.S. dollars). Statistica, Hamburg, Germany. https://www.statista.com/statistics/1095957/global-venture-capita-funding-value-by-region/.
Steckel, J.C. and M. Jakob, 2018: The role of financing cost and de-risking strategies for clean energy investment. Int. Econ. , 155 (September 2017), 19–28, doi:10.1016/j.inteco.2018.02.003.
Steele, W., L. Mata, and H. Fünfgeld, 2015: Urban climate justice: creating sustainable pathways for humans and other species. Curr. Opin. Environ. Sustain. , 14, 121–126, doi:10.1016/j.cosust.2015.05.004.
Steffen, B., 2019: Estimating the Cost of Capital for Renewable Energy Projects. Energy Economics 88 (2020): 104783 9 pp. doi: 10.1016/j.eneco.2020.104783.
Steffen, B., T. Matsuo, D. Steinemann, and T.S. Schmidt, 2018: Opening new markets for clean energy: The role of project developers in the global diffusion of renewable energy technologies. Bus. Polit. , 20(4) , 553–587, doi:10.1017/bap.2018.17.
Steffen, B., F. Egli, M. Pahle, and T.S. Schmidt, 2020: Navigating the Clean Energy Transition in the COVID-19 Crisis. Joule, 4(6) , 1137–1141, doi:10.1016/j.joule.2020.04.011.
Stehle, F., 2021: Governing Climate Change: Polycentricity in Action?Glob. Environ. Polit. , 21(1) , 157–159, doi:10.1162/glep_r_00596.
Stender, F., U. Moslener, and W.P. Pauw, 2019: More than money: does climate finance support capacity building?Appl. Econ. Lett. , 27(15) , 1247–1251, doi:10.1080/13504851.2019.1676384.
Stern, N., 2008: The Economics of Climate Change. American Economic Review, 98 (2): 1-37. 37 pp. doi: 10.1257/aer.98.2.1.
Stern, N. and J. Stiglitz, 2021: The Social Cost of Carbon, Risk, Distribution, Market Failures: An Alternative Approach. NBER WORKING PAPER 28472, Cambridge, MA, USA, 75 pp. DOI 10.3386/w28472.
Stiglitz, J. and H. Rashid, 2020: Averting Catastrophic Debt Crises in Developing Countries: Extraordinary challenges call for extraordinary measures. Policy Insight 104, CEPR, Washington, D.C., USA 29 pp. https://cepr.org/sites/default/files/policy_insights/PolicyInsight104.pdf (Accessed November 1, 2021).
Stockholm Green Digital Finance, 2017: Unlocking the Potential of Green Fintech. Stockholm Green Digital Finance Insight Brief #1 2017, Stockholm, Sweden.12 pp.
Streck, C., 2016: Mobilizing Finance for redd+ After Paris. J. Eur. Environ. & Plan. Law, 13(2) , 146–166, doi:10.1163/18760104-01302003.
Streck, C., 2020: Who owns REDD+? carbon markets, carbon rights and entitlements to REDD+ finance. Forests, 11(9) , 1–15, doi:10.3390/f11090959.
Stritzke, S. et al., 2021: Results-Based Financing (RBF) for Modern Energy Cooking Solutions: An Effective Driver for Innovation and Scale?Energies, 14(15) , 4559, doi:10.3390/EN14154559.
Stubbington, T., 2021: UK’s debut ‘green gilt’ sale draws blockbuster demand. Financial Times, September 21.
Studart, R. and K. Gallagher, 2015: Guaranteeing finance for sustainable infrastructure: A proposal. In: Moving the trillions a debate on positive pricing of mitigation actions[Sirkis, A. et al., (eds.)]. Brasil no Clima, pp. 91–113.
Suatmadi, A.Y., F. Creutzig, and I.M. Otto, 2019: On-demand motorcycle taxis improve mobility, not sustainability. Case Stud. Transp. Policy, 7(2) , 218–229, doi:10.1016/j.cstp.2019.04.005.
Sudmant, A., S. Colenbrander, A. Gouldson, and N. Chilundika, 2017a: Private opportunities, public benefits? The scope for private finance to deliver low-carbon transport systems in Kigali, Rwanda. Urban Clim. , 20, 59–74, doi:10.1016/j.uclim.2017.02.011.
Sudmant, A.H. et al., 2017b: Understanding the case for low-carbon investment through bottom-up assessments of city-scale opportunities. Clim. Policy, 17(3) , 299–313, doi:10.1080/14693062.2015.1104498.
Sulich, A., M. Rutkowska, and Ł. Popławski, 2020: Green jobs, definitional issues, and the employment of young people: An analysis of three European Union countries. J. Environ. Manage. , 262, 110314, doi:10.1016/j.jenvman.2020.110314.
Summers, L.H., 2015: Demand Side Secular Stagnation. Am. Econ. Rev. , 105(5) , 60–65, doi:10.1257/aer.p20151103.
Summers, L.H., 2016: The age of secular stagnation: What it is and what to do about it. Foreign Affairs, March/April 2016. https://www.foreignaffairs.com/articles/united-states/2016-02-15/age-secular-stagnation (Accessed November 1, 2021).
Sumner, A., C. Hoy, and E. Ortiz-Juarez, 2020: Estimates of the impact of COVID-19 on global poverty. WIDER Working Paper 2020/43. UNU-WIDER, Helsinki, Finland, doi:10.35188/UNU-WIDER/2020/800-9.
Sussams, L. and J. Leaton, 2017: Expect the Unexpected: The Disruptive Power of Low-carbon Technology. Carbon Tracker, London, UK.
Sussams, L., A. Grant, and M. Gagliardi, 2015: The US Coal Crash – Evidence for Structural Change. Carbon Tracker Initiative, London, UK, 50 pp. http://www.carbontracker.org/report/the-us-coal-crash/ (Accesed November 1, 2021).
Svartzman, R., P. Bolton, M. Despres, L.A. Pereira Da Silva, and F. Samama, 2021: Central banks, financial stability and policy coordination in the age of climate uncertainty: a three-layered analytical and operational framework. Clim. Policy, 21(4) , 563–580, doi:10.1080/14693062.2020.1862743.
Sweerts, B., F.D. Longa, and B. van der Zwaan, 2019: Financial de-risking to unlock Africa’s renewable energy potential. Renew. Sustain. Energy Rev. , 102, 75–82, doi:10.1016/j.rser.2018.11.039.
Swiss Re Institute, 2019: Natural catastrophes and man-made disasters in 2018: “secondary” perils on the frontline. No 2/2019. Swiss Re Institute, Zurich, Switzerland.
Tan, C., 2019: Creative cocktails or toxic brews? Blended finance and the regulatory framework for sustainable development. In: Sustainable Trade, Investment and Finance, [Gammage and Novitz (eds.)] Edward Elgar Publishing, Cheltenham, UK, pp. 300–330.
Tang, D.Y. and Y. Zhang, 2020: Do shareholders benefit from green bonds?J. Corp. Financ. , 61, doi:10.1016/j.jcorpfin.2018.12.001.
Tang, S. and D. Demeritt, 2018: Climate Change and Mandatory Carbon Reporting: Impacts on Business Process and Performance. Bus. Strateg. Environ. , 27(4) , 437–455, doi:10.1002/bse.1985.
Tapscott, D. and R. Kirkland, 2016: How Blockchains could Change the World. Interview, May 6, 2016. McKinsey and Company, London, UK.
TCFD, 2017: Recommendations of the Task Force on Climate-related Financial Disclosures. FSB, Basel, Switzerland, https://www.fsb-tcfd.org/wp-content/uploads/2017/06/FINAL-TCFD-Report-062817.pdf (Accessed November 1, 2021).
TCFD, 2019: The Task Force on Climate-related Financial Disclosures Status Report . FSB, Basel, Switzerland. 135 pp.
TCFD, 2020: Task Force on Climate-related Financial Disclosures: 2020 Status Report . FSB, Basel, Switzerland. 114 pp. https://assets.bbhub.io/company/sites/60/2020/09/2020-TCFD%7B%5C_%7DStatus-Report.pdf .
TCFD Portfolio Alignment Team, 2021: Measuring portfolio alignment: Technical report . FSB, Basel, Switzerland. 8 pp. https://www.tcfdhub.org/wp-content/uploads/2021/10/20211005-PAT-Summary-of-Responses.pdf (Accessed November 1, 2021).
TCX, 2020: Annual Report. TCX protection against currency risk. TCX Investment Management Company, Amsterdam, The Netherlands, 78 pp.
TEG, 2019: Taxonomy Technical Report .EU Technical Expert Group On Sutainable Finance, Brussels, Belgium.
The 2° Investing Initiative, 2017: Out of the Fog: Quantifiying the alignment of Swiss pension funds and insurances with the Paris Agreement . 2 Degrees Investing Initiative, Paris, France, 49 pp. https://2degrees-investing.org/out-of-the-fog-quantifiying-the-alignment-of-swiss-pension-funds-and-insurances-with-the-paris-agreement/ (Accessed November 1, 2021).
The 2° Investing Initiative and Wüest Partner, 2020: Bridging the Gap: Measuring progress on the climate goal alignment and climate actions of Swiss Financial Institutions. 2 Degrees Investing Initiative, Paris, France, 104 pp. https://2degrees-investing.org/wp-content/uploads/2020/11/Bridging-the-Gap.pdf (Accessed November 1, 2021).
The Economist, 2017: Kenya launches the world’s first mobile-only sovereign bond. June 29, 2017. The Economist .
The Economist, 2021: Haiti’s lack of preparedness makes bad disasters worse. August 18, 2021. The Economist .
The Food and Land Use Coalition, 2019: Growing Better: Ten Critical Transitions to Transform Food and Land Us e. The Food and Land Use Coalition, London, 236 pp. https://www.foodandlandusecoalition.org/wp-content/uploads/2019/09/FOLU-GrowingBetter-GlobalReport.pdf .
Thiele, T., M. von Unger, and A. Mohan, 2021: MDB Engagement: Mainstreaming blue nature-based solutions into infrastrucure finance. BNCFF, Gland, Switzerland.
Thomä, J., 2018: The stranding of upstream fossil fuel assets in the context of the transition to a low-carbon economy. In: Stranded Assets and the Environment [Caldecott, B (ed.)], Routledge, Abingdon, UK, and New York, NY, pp. 111–124.
Timilsina, G.R., C. de Gouvello, M. Thioye, and F.B. Dayo, 2010: Clean Development Mechanism Potential and Challenges in Sub-Saharan Africa. Mitig. Adapt. Strateg. Glob. Change, 15(1) , 93–111, doi:10.1007/s11027-009-9206-5.
Timsit, A., 2020: The blueprint the US can follow to finally pay reparations. Quartz, October 13.
TNFD, 2021: TNFD: Nature in scope. Taskforce on Nature-related Financial Disasters (TNFD), 1–26 pp. https://tnfd.global/wp-content/uploads/2021/07/TNFD-Nature-in-Scope-2.pdf .
TNO, 2016: PowerMatcher, Matching energy supply and demand to expand smart energy potential., The Hague, The Netherlands.
Tolliver, C., A.R. Keeley, and S. Managi, 2019: Green bonds for the Paris agreement and sustainable development goals. Environ. Res. Lett. , 14(6) , 64009, doi:10.1088/1748-9326/ab1118.
Tolliver, C., A.R. Keeley, and S. Managi, 2020a: Policy targets behind green bonds for renewable energy: Do climate commitments matter?Technol. Forecast. Soc. Change, 157, 120051, doi:10.1016/j.techfore.2020.120051.
Tolliver, C., A.R. Keeley, and S. Managi, 2020b: Drivers of green bond market growth: The importance of Nationally Determined Contributions to the Paris Agreement and implications for sustainability. J. Clean. Prod. , 244, 118643, doi:10.1016/J.JCLEPRO.2019.118643.
Torres, E. and R. Zeidan, 2016: The life-cycle of national development banks: The experience of Brazil’s BNDES. Q. Rev. Econ. Financ. , 62, 97–104, doi:10.1016/J.QREF.2016.07.006.
Toxopeus, H. and F. Polzin, 2017: Characterizing nature-based solutions from a business model and financing perspective. Naturvation, Berlin, Germany.
Toxopeus, H. and F. Polzin, 2021: Reviewing financing barriers and strategies for urban nature-based solutions. J. Environ. Manage. , 289 (August 2020), 112371, doi:10.1016/j.jenvman.2021.112371.
Trinks, A., B. Scholtens, M. Mulder, and L. Dam, 2018: Fossil Fuel Divestment and Portfolio Performance. Ecol. Econ. , 146, 740–748, doi:10.1016/j.ecolecon.2017.11.036.
Tuhkanen, H., 2020: Green bonds: a mechanism for bridging the adaptation gap? Stockholm Environment Institute, Stockholm, Sweden, 23 pp. https://www.sei.org/wp-content/uploads/2020/02/sei-working-paper-green-bonds-tuhkanen.pdf .
Tuhkanen, H. and G. Vulturius, 2020: Are green bonds funding the transition? Investigating the link between companies’ climate targets and green debt financing. J. Sustain. Financ. Invest. , Abingdon, UK, doi:10.1080/20430795.2020.1857634. pp. 1–23.
TWAS, 2021: TWAS Annual reports. The World Academy of Sciences, Trieste, Italy, 44 pp. https://twas.org/publications/annual-reports (Accessed October 24, 2021).
UBS, 2017: Mobilizing private wealth for public good. UBS, New York, NY, USA. 38 pp. https://www.longfinance.net/media/documents/ubs-wef-2017- whitepaper-mobilizing-private-wealth-for-public-good1.pdf (Accessed August 18, 2021).
UKERC, 2014: Low carbon jobs: The evidence for net job creation from policy support for energy efficiency and renewable energy.UK Energy Research Centre, London, UK. https://d2e1qxpsswcpgz.cloudfront.net/uploads/2020/03/low-carbon-jobs.pdf (Accessed November 1, 2021).
Umar, Z., Y. Manel, Y. Riaz, and M. Gubareva, 2021: Return and volatility transmission between emerging markets and US debt throughout the pandemic crisis. Pacific-Basin Financ. J. , 67, 101563, doi:10.1016/j.pacfin.2021.101563.
UN, 2009: Report of the Fourth United Nations Conference on the Least Developed Countries. Instanbul Programme of Action (IPoA) : Istanbul, Turkey, 9-13 May 2011. United Nations, New York, NY, USA, 125 pp. https://undocs.org/en/A/CONF.219/7 (Accessed October 27, 2021).
UN, 2015 a: Addis Ababa Action Agenda of the Third International Conference on Financing for Development , Addis Ababa, Ethiopia, 13-16thJuly 2015. United Nations, New York, NY, USA. 37 pp.
UN, 2015 b: Sendai Framework for Disaster Risk Reduction 2015-2030. UN, Geneva, Switzerland, 35 pp.
UN, 2015 c: SIDS Accelerated Modalities of Action (SAMOA) Pathway. UN-OHRLLS, Apia, Samoa, 30 pp. https://www.un.org/ga/search/view_doc.asp?symbol=A/RES/69/15&Lang=E.
UN, 2019: Roadmap for Financing the 2030 Agenda for Sustainable Development 2019-2021.United Nations, New York, NY, USA, 57 pp.
UN, 2020: 2020 Voluntary National Reviews Synthesis Report . UN, New York, NY, USA, 102 pp. https://sustainabledevelopment.un.org/content/documents/27027VNR_Synthesis_Report_2020.pdf (Accessed August 19, 2021).
UN and ECB, 2015: Financial Production, Flows and Stocks in the System of National Accounts - Series F No. 113 (Studies in Methods - Handbook of National Accopunting). Department of Economics and Social Affairs, New York, NY, USA.
UN, 2015: Addis Ababa Action Agenda of the Third International Conference on Financing for Development . UNCTAD, Addis Ababa, Ethiopia, 37 pp. https://unctad.org/meetings/en/SessionalDocuments/ares69d313%7B%5C_%7Den.pdf .
UN CDF, 2020a: Making finance work for the poor: Supporting SDG achievement in the last mile (Annual Report 2019). UN, New York, NY, USA, 40 pp.
UN CDF, 2020b: The SDG500 Platform Investment Opportunity. UNCDF, New York, NY, USA. https://www.uncdf.org/article/5311/the-sdg500-platform-investment-opportunity (Accessed September 21, 2021).
UN CDF, 2021a: Harnessing the true power of capital: Unlocking the growth potential of the last mile. UNCDF, New York, NY, USA, 51 pp.
UN CDF, 2021b: Cambodia Stock Exchange: Identifying Key Bottlenecks. UNCDF, New York, NY, USA. 13 pp. https://www.uncdf.org/article/6866/cambodia-stock-exchange--identifying-key-bottlenecks (Accessed November 1, 2021).
UN ESCAP, 2015: Tapping Capital Markets & Institutional Investors for Infrastructure Development . UN ESCAP, Bangkok, Thailand.
UN PRI, 2020: Annual Report 2020. UN PRI, London, UK. https://www.unpri.org/pri/about-the-pri/annual-report (Accessed December 23, 2020).
UN-Convened Net-Zero Asset Owner Alliance, 2021: Inaugural 2025 target setting protocol. 75 pp. https://www.unepfi.org/wordpress/wp-content/uploads/2021/01/Alliance-Target-Setting-Protocol-2021.pdf .
UNDP, 2015: A Methodological Guidebook: Climate Public Expenditure and Institutional Review (CPEIR). UNDP, Bangkok, Thailand, 72 pp.
UNECA, 2018: Africa Sustainable Development Report 2018[African Union Commission, UN Economic Commission of Africa, African Development Bank, and UN Development Programme, (eds.)]. UN ECA, Addis Ababa, Ethiopia, 154 pp.
UNEP, 2011: Innovative Climate Finance Products - Examples from the UNEP Bilateral Finance Institutions Climate Change Working Group. United Nations Environment Programme (UNEP), 28 pp.
UNEP, 2016: Adaptation Finance Gap Report 2016. United Nations Environment Programme (UNEP), Nairobi, Kenya, 50 pp.
UNEP, 2018: Adaptation Gap Report 2018. United Nations Environment Programme (UNEP), Nairobi, Kenya, 104 pp. https://www.unenvironment.org/resources/adaptation-gap-report (Accessed November 1, 2021).
UNEP, 2019: Emissions Gap Report 2019. United Nations Environment Programme (UNEP), Nairobi, Kenya, 81 pp.
UNEP, 2021: Adaptation Gap Report 2020. United Nations Environment Programme (UNEP), Nairobi, Kenya, 99 pp.
UNEP, WEF, ELD, and Vivid Economics, 2021: State of Finance for Nature. United Nations Environment Programme (UNEP), Nairobi, Kenya, 60 pp. https://www.unep.org/resources/state-finance-nature (Accessed November 1, 2021).
UNEP DTU, 2017: Overcoming Barriers to Investing in Energy Efficiency. UNEP DTU, Copenhagen, Denmark. 42 pp.
UNEP FI, 2018: Extending our Horizons: Assessing Credit Risk and Opportunity in a Changing Climate. UNEP FI, Geneva, Switzerland. 76 pp. https://www.unepfi.org/publications/banking-publications/extending-our-horizons/ (Accessed November 1, 2021).
UNEP Inquiry, 2016a: Inquiry into the Design of a Sustainable Financial System: Definitions and Concepts – Background Note. UNEP, Nairobi, Kenya. 19 pp. https://unepinquiry.org/publication/definitions-and-concepts-background-note/ (Accessed November 1, 2021).
UNEP Inquiry, 2016b: Greening the banking system; taking stock of G20 green banking market practice. UNEP, Geneva, Switzerland, 30 pp.
UNESCAP, 2017: Economic and Social Survey of Asia and the Pacific 2017, UNESCAP, Bangkok, Thailand.
UNFCCC, 2008: Mechanisms to manage financial risks from direct impacts of climate change in developing countries. United Nations Framework Convention on Climate Change (UNFCCC), Bonn, Germany. 114 pp.https://unfccc.int/resource/docs/2008/tp/09.pdf .
UNFCCC, 2009: Report of the Conference of the Parties on its fifteenth session, held in Copenhagen from 7 to 19 December 2009. Part Two: Action taken by the Conference of the Parties at its fifteenth session. United Nations Framework Convention on Climate Change (UNFCCC). https://unfccc.int/sites/default/files/resource/docs/2009/cop15/eng/11a01.pdf .
UNFCCC, 2010: Part Two: Action taken by the Conference of the Parties at its fifteenth session. United Nations Framework Convention on Climate Change (UNFCCC), Copenhagen, Denmark, 43 pp. https://unfccc.int/resource/docs/2009/cop15/eng/11a01.pdf (Accessed November 1, 2019).
UNFCCC, 2014a: 2014 Biennial Assessment and Overview of Climate Finance Flows Technical Report . United Nations Framework Convention on Climate Change (UNFCCC), Bonn, Germany. https://unfccc.int/files/cooperation_and_support/financial_mechanism/standing_committee/application/pdf/2014_biennial_assessment_and_overview_of_climate_finance_flows_report_web.pdf (Accessed November 1, 2021).
UNFCCC, 2014b: Introduction to Climate Finance. United Nations Framework Convention on Climate Change (UNFCCC), Bonn, Germany. https://unfccc.int/topics/introduction-to-climate-finance (Accessed November 1, 2021).
UNFCCC, 2015: Adoption of the Paris Agreement . United Nations Framework Convention on Climate Change. United Nations Framework Convention on Climate Change (UNFCCC), Paris, France, 32 pp. https://unfccc.int/resource/docs/2015/cop21/eng/l09r01.pdf (Accessed November 1, 2021).
UNFCCC, 2017: Report on the independent review of the effective implementation of the Climate Technology Centre and Network. United Nations Framework Convention on Climate Change (UNFCCC), Bonn, Gernamy.
UNFCCC, 2018a: 2018 Biennial Assessment and Overview of Climate Finance Flows Technical Report . UN Standing Committee on Finance, United Nations Framework Convention on Climate Change (UNFCCC), Bonn, Germany. https://unfccc.int/sites/default/files/resource/2018%20BA%20Technical%20Report%20Final.pdf (Accessed November 1, 2019).
UNFCCC, 2018b: Solidarity and Just Transition Silesia Declaration. United Nations Framework Convention on Climate Change (UNFCCC), Katowice, Poland, 3 pp. https://cop24.gov.pl/fileadmin/user_upload/Solidarity_and_Just_Transition_Silesia_Declaration_2_.pdf (Accessed November 1, 2021).
UNFCCC, 2019a: Interim NDC registry. United Nations Framework Convention on Climate Change (UNFCCC), Bonn, Germany. https://unfccc.int/news/ndc-interim-registry (Accessed November 1, 2021).
UNFCCC, 2019b: Report of the Conference of the Parties on its twenty-fourth session, held in Katowice from 2 to 15 December 2018. United Nations Framework Convention on Climate Change (UNFCCC), Katowice, Poland, 46 pp. https://unfccc.int/sites/default/files/resource/cma2018_3_add2_new_advance.pdf#page=18 (Accessed November 1, 2021).
UNFCCC, 2019c: Opportunities and options for adaptation finance, including in relation to the private sector. United Nations Framework Convention on Climate Change (UNFCCC) Bonn, Germany. https://unfccc.int/sites/default/files/resource/tp2019%7B%5C_%7D03E.pdf (Accessed November 1, 2021).
UNFCCC, 2019d: 25 Years of Adaptation Under the UNFCCC. United Nations Framework Convention on Climate Change (UNFCCC), Bonn, Germany, 34 pp. https://unfccc.int/sites/default/files/resource/AC_25 Years of Adaptation Under the UNFCCC_2019.pdf (Accessed November 1, 2021).
UNFCCC, 2020: ME SOLshare: Peer-to-Peer Smart Village Grids | Bangladesh. United Nations Framework Convention on Climate Change (UNFCCC).
UNFCCC, 2021: UNFCC Universities Climate Change Partnership. United Nations Framework Convention on Climate Change (UNFCCC), Bonn, Germany. https://www4.unfccc.int/sites/NWPStaging/Pages/university-partnerships.aspx (Accessed November 1, 2021).
Unruh, G.C., 2002: Escaping carbon lock-in. Energy Policy, 30(4) , 317–325, doi:10.1016/S0301-4215(01)00098-2.
UNU-INRA, 2019: Africa’s Development In The Age Of Stranded Assets. UNU-INRA, Ghana. https://i.unu.edu/media/inra.unu.edu/publication/5247/DIscussion-paper-Africas-Development-in-the-age-of-stranded-Assets_INRAReport2019.pdf (Accessed November 1, 2021).
Ürge-Vorsatz, D. et al., 2018: Locking in positive climate responses in cities. Nat. Clim. Chang. , 8(3) , 174–177, doi:10.1038/s41558-018-0100-6.
US DoJ, 2009: Charting the future course of international technical assistance at the Federal Trade Commission and U.S. Department of Justice.
US DoJ, 2019: Mozambique’s Former Finance Minister Indicted Alongside Other Former Mozambican Officials, Business Executives, and Investment Bankers in Alleged $2 Billion Fraud and Money Laundering Scheme that Victimized U.S. Investors | OPA | Department of Justice. https://www.justice.gov/opa/pr/mozambique-s-former-finance-minister-indicted-alongside-other-former-mozambican-official s (Accessed August 21, 2021).
US GCRP, 2018a: Impacts, Risks, and Adaptation in the United States: The Fourth National Climate Assessment, Volume II. [Reidmiller, D.R., C.W. Avery, D.R. Easterling, K.E. Kunkel, K.L.M. Lewis, T.K. Maycock, and B.C. Stewart, (eds.)]., Washington, DC,.
US GCRP, 2018b: Fourth National Climate Assessment Volume II Impacts, Risks, and Adaptation in the United States Report-in-Brief ., Washington, D.C., 1515 pp. https://nca2018.globalchange.gov/downloads/NCA4%7B %5C_%7D2018%7B%5C_%7DFullReport.pdf .
V20, 2020: Sustainable Insurance Facility (SIF): Solutions to build resilient micro, small and medium enterprises. Vulnerable Twenty Group, Geneva, Switzerland. 18 pp. https://climate-insurance.org/wp-content/uploads/2020/04/SIF_Kick-Off_Summary_Sept_2019.pdf (Accessed November 1, 2021).
V20, 2021: The V20-led Sustainable Insurance Facility at a Glance. Vulnerable Twenty Group, Geneva, Switzerland. 30 pp. https://climate-insurance.org/wp-content/uploads/2021/01/The-V20-led-SIF-at-a-Glance_January-2021.pdf (Accessed November 1, 2021).
van der Gaast, W., R. Sikkema, and M. Vohrer, 2018: The contribution of forest carbon credit projects to addressing the climate change challenge. Clim. Policy, 18(1) , 42–48, doi:10.1080/14693062.2016.1242056.
van der Ploeg, F. and A. Rezai, 2020: Stranded Assets in the Transition to a Carbon-Free Economy. Annu. Rev. Resour. Econ. , 12(1) , 281–298, doi:10.1146/annurev-resource-110519-040938.
van der Zwaan, B., T. Kober, F.D. Longa, A. van der Laan, and G. Jan Kramer, 2018: An integrated assessment of pathways for low-carbon development in Africa. Energy Policy, 117, 387–395, doi:10.1016/j.enpol.2018.03.017.
Vedeld, T., H. Hofstad, H. Solli, and G.S. Hanssen, 2021: Polycentric urban climate governance: Creating synergies between integrative and interactive governance in Oslo. Environ. Policy Gov. , 31(4) , 347–360, doi:10.1002/eet.1935.
Verkooijen, P., 2019: Adapting to climate change could add $7 trillion to the global economy by 2030. GCA Blog, September 10.
Vivid Economics, 2020: Greenness of Stimulus Index - Vivid Economics. https://www.vivideconomics.com/casestudy/greenness-for-stimulus-index/ (Accessed November 1, 2021).
Volz, U. et al., 2020: Climate Change and Sovereign Risk., London, Tokyo, Singapore, Berkeley, 133 pp
Volz, U. et al., 2021: Debt relief for a green and inclusive recovery: Securing private-sector participation and creating policy space for sustainable development . Boston University Global Development Policy Center, the Heinrich Böll Foundation and the Centre for Sustainable Finance at SOAS, University of London, Boston, MA, USA, Berlin, Germany, and London, UK, 42 pp. https://www.boell.de/sites/default/files/2021-07/E-PAPER - Debt Relief for a Green and Inclusive Recovery.pdf?dimension1=division_ip (Accessed November 1, 2021).
Vona, F., G. Marin, and D. Consoli, 2018: Measures, drivers and effects of green employment: evidence from US local labor markets, 2006–2014. J. Econ. Geogr. , 19(5) , 1021–1048, doi:10.1093/jeg/lby038.
Vyas, S., V. Seifert, L. Schaefer, and S. Kreft, 2019: Climate Risk Insurance Solutions: Understanding the Drivers of Cost-effectivess. Munich Climate Insurance Initiative, Bonn, Germany, 57 pp. https://www.insuresilience.org/wp-content/uploads/2019/03/MCII-Discussion-Paper-3_Understanding-cost-effectiveness.pdf (Accessed November 1, 2021).
Wagner, K., 2021: Apologies for historical atrocities fall short of a proper reckoning. Financial Times, June 4.
Walsh, G., I. Ahmed, J. Said, and M.F.E. Maya, 2021: A Just Transition for Africa: Championing a Fair and Prosperous Pathway to Net Zero. Tony Blair Institute for Climate Change, London, UK. 28 pp. https://institute.global/advisory/just-transition-africa- (Accessed October 15, 2021).
Wamsler, C. et al., 2020: Environmental and climate policy integration: Targeted strategies for overcoming barriers to nature-based solutions and climate change adaptation. J. Clean. Prod. , 247, 119154, doi:10.1016/j.jclepro.2019.119154.
Wang, H. and C. Yee, 2020: Climate Tech’s Four Valleys of Death and Why We Must Build a Bridge. RMI, June 17.
Warland, L. and A. Michaelowa, 2015: Can debt for climate swaps be a promising climate finance instrument? Lessons from the past and recommendations for the future. Perspectives, Zurich, doi: 10.5167/uzh-159661.
Warner, K., 2020: Climate justice: Who bears the burden and pays the price?Soc. Altern. , 39(2) , 19–25.
Watson, C. and L. Schalatek, 2019: The Global Climate Finance Architecture.. Overseas Development Institute, London, UK, and Heinrich Böll Stiftung North America, Washington DC, USA. 6.
Watson, C. and L. Schalatek, 2020: The global climate finance architecture. Overseas Development Institute, London, UK, and Heinrich Böll Stiftung North America, Washington DC, USA, 6 pp. https://climatefundsupdate.org/publications/the-global-climate-finance-architecture-2/ (Accessed November 1, 2021).
Watson, C. and L. Schalatek, 2021: Climate Finance Thematic Briefing: REDD+ Finance. Overseas Development Institute, London, UK, and Heinrich Böll Stiftung North America, Washington DC, USA. 1–4 pp. https://climatefundsupdate.org/wp-content/uploads/2021/03/CFF5-ENG-2020-Digital.pdf (Accessed November 1, 2021).
Watson, C., A. Caravani, T. Mitchell, J. Kellett, and K. Peters, 2015: Finance for reducing disaster risk: 10 things to know. Overseas Development Institute, London, UK, 18 pp. https://cdn.odi.org/media/documents/9480.pdf (Accessed November 1, 2021).
Watts, J.D., L. Tacconi, S. Irawan, and A.H. Wijaya, 2019: Village transfers for the environment: Lessons from community-based development programs and the village fund. For. Policy Econ. , 108 (January), 101863, doi:10.1016/j.forpol.2019.01.008.
WBCSD, 2016: Corporate renewable power purchase agreements (PPAs). World Business Council for Sustainable Development (WBCSD). https://www.wbcsd.org/Programs/Climate-and-Energy/Energy/REscale/Corporate-renewable-power-purchase-agreements-PPAs (Accessed November 1, 2021).
WEF, 2013: The Green Investment Report: The ways and means to unlock private finance for green growth. World Economic Forum, Geneva, Switzerland, 40 pp.
Weikmans, R. and J.T. Roberts, 2019: The international climate finance accounting muddle: is there hope on the horizon?Clim. Dev. , 11(2) , 97–111, doi:10.1080/17565529.2017.1410087.
Weiss, M., M. Junginger, M.K. Patel, and K. Blok, 2010: A review of experience curve analyses for energy demand technologies. Technol. Forecast. Soc. Change, 77(3) , 411–428, doi:10.1016/j.techfore.2009.10.009.
Weitzman, M.L., 2014: Fat tails and the social cost of carbon. American Economic Review, 104, 544–546.
WFP, 2020: Amid COVID-19 crises, Germany donates to protect African countries with climate insurance. World Food Programme, Berlin, Germany. https://www.wfp.org/news/amid-covid-19-crises-germany-donates-protect-african-countries-climate-insurance (Accessed November 1, 2021).
White, R. and S. Wahba, 2019: Addressing constraints to private financing of urban (climate) infrastructure in developing countries. Int. J. Urban Sustain. Dev. , 11(3) , 245–256, doi:10.1080/19463138.2018.1559970.
Williams, M., 2015: Gender and Climate Change Financing: Coming out of the margin. 1st ed. Routledge, London, UK, 554 pp.
Williams, T., 2015: Where the Hell Is All the Climate Funding? Inside Philanthropy, April 22, 2015. Santa Monica, CA, USA. https://www.insidephilanthropy.com/home/2015/4/22/where-the-hell-is-all-the-climate-funding.html (Accessed November 1, 2021).
Willis Towers Watson, 2020: The world’s largest asset managers - 2020. Thinking Ahead Institute, London, UK. 56 pp. https://www.thinkingaheadinstitute.org/research-papers/the-worlds-largest-asset-managers-2020/ (Accessed August 16, 2021).
Wills, S.E., L.W. Senbet, and W. Simbanegavi, 2016: Sovereign Wealth Funds and Natural Resource Management in Africa: Table A1: J. Afr. Econ. , 25 (suppl 2), ii3–ii19, doi:10.1093/jae/ejw018.
WMO, 2019: Tropical Cyclone Idai hits Mozambique. World Meteorological Organization (WMO), Geneva, Switzerland.
Wolfrom, L. and M. Yokoi-Arai, 2016: Financial instruments for managing disaster risks related to climate change. OECD J. Financ. Mark. Trends, 2015(1) , 25–47, doi:10.1787/fmt-2015-5jrqdkpxk5d5.
Wong, G.Y. et al., 2019: Narratives in REDD+ benefit sharing: examining evidence within and beyond the forest sector. Clim. Policy, 19(8) , 1038–1051, doi:10.1080/14693062.2019.1618786.
Woods, K., 2016: How rising insurance costs are squeezing small Irish businesses dry. Fora, July 24, 2016. Ireland.
Wooldridge, P.D., 2001: The emergence of new benchmark yield curves. BIS Quarterly Review. December 2001. Bank for International Settlements (BIS), Basel, Switzerland.
World Bank, 2009: The World Bank Group guarantee instruments 1990-2007: An independent evaluation. World Bank, Washington DC, USA, 115 pp.
World Bank, 2015: Pacific Catastrope Risk Insurance Pilot: Lessons Learned and Next Steps. World Bank, Washington, D.C., USA.
World Bank, 2016: Making Climate Finance Work in Agriculture. World Bank, Washington, D.C., USA.
World Bank, 2017: The Potential Role of Enhanced Bond Structures in Forest Climate Finance. World Bank, Washington, DC, USA, 95 pp.
World Bank, 2018a: MDB Methodology for Private Investment Mobilization: Reference Guide. 17 pp.
World Bank, 2018b: Blockchain and emerging digital technologies for enhancing post-2020 climate markets. World Bank, Washington, DC, USA, 32 pp. http://documents.worldbank.org/curated/en/94298152146429692 7/Blockchain-and-emerging-digital-technologies-for-enhancing-post-2020-climate-markets (Accessed November 1, 2021).
World Bank, 2019a: Southeast Asia Disaster Risk Insurance Facility (SEADRIF) Technical Briefing for Japanese Insurance Industry. Feature Story, January 17, 2019.
World Bank, 2019b: Leveraging Economic Migration for Development: A Briefing for the World Bank Board. World Bank, Washington, DC, USA, 83 pp.
World Bank, 2020: Capital Markets Development: A Primer for Policymakers. World Bank Group, Washington DC, USA, 23 pp. https://openknowledge.worldbank.org/handle/10986/36058 (Accessed August 18, 2021).
World Bank, 2021 : Power Purchase Agreements (PPAs) and Energy Purchase Agreements (EPAs). World Bank, Washington, D.C., USA. https://ppp.worldbank.org/public-private-partnership/sector/energy/energy-power-agreements/power-purchase-agreements (Accessed November 1, 2021).
World Bank and IMF, 2001: Developing Government Bond Markets: A Handbook. World Bank, Washington DC, USA, 440 pp.
World Bank, Clean Cooking Alliance, and ESMAP, 2021: Understanding market-based solutions and access to finance options for clean-cooking technologies in Bangladesh. World Bank Group, Washington DC, USA, and Dhaka, Bangladesh, 74 pp. https://documents1.worldbank.org/curated/en/311561624871430872/pdf/Understanding-Market-Based-Solutions-and-Access-to-Finance-Options-for-Clean-Cooking-Technologies-in-Bangladesh.pdf (Accessed September 21, 2021).
World Bank Data, 2020a: Gross Domestic Product (current US$). https://data.worldbank.org/indicator/NY.GDP.MKTP.CD.
World Bank Data, 2020b: Gross Capital Formation (current US$). https://data.worldbank.org/indicator/NY.GDP.MKTP.CD.
World Bank Group, 2019: State and Trends of Carbon Pricing 2019. World Bank Group, Washington, DC, USA. https://openknowledge.worldbank.org/handle/10986/31755 (Accessed November 1, 2021).
World Bank Group, 2020: State and Trends of Carbon Pricing 2020. World Bank Group, Washington, DC, USA, 105 pp. https://openknowledge.worldbank.org/handle/10986/33809 (Accessed November 1, 2021).
World Energy Council, 2019: World Energy Scenarios 2019: Exploring Innovation Pathways to 2040. World Energy Council, London, 148 pp. https://www.worldenergy.org/assets/downloads/Scenarios_Report_FINAL_for_website.pdf (Accessed November 1, 2021).
Wright, C., 2011: Export Credit Agencies and Global Energy: Promoting National Exports in a Changing World. Glob. Policy, 2(sup1) , 133–143, doi:10.1111/J.1758-5899.2011.00132.X.
Yadav, P., A.P. Heynen, and D. Palit, 2019: Energy for Sustainable Development Pay-As-You-Go financing: A model for viable and widespread deployment of solar home systems in rural India. Energy Sustain. Dev. , 48, 139–153, doi:10.1016/j.esd.2018.12.005.
Yanai, R.D. et al., 2020: Improving uncertainty in forest carbon accounting for REDD+ mitigation efforts. Environ. Res. Lett. , 15, 124002.
Yeo, S., 2019: Where climate cash is flowing and why it’s not enough. Nature, 573(7774) , 328–331, doi:10.1038/d41586-019-02712-3.
Yescombe, E.R., 2017: Public-Private Partnerships in Sub-Saharan Africa - Case Studies for Policymakers 2017. UONGOZI Institute, Dar es Salaam, Tanzania. https://www.africaportal.org/publications/public-private-partner ships-in-sub-saharan-africa-case-studies-for-policymakers-2017/ (Accessed November 1, 2021).
Zamarioli, L.H., P. Pauw, M. König, and H. Chenet, 2021: The climate consistency goal and the transformation of global finance. Nat. Clim. Change, 11(7) , 578–583, doi:10.1038/s41558-021-01083-w.
Zancanella, P., P. Bertoldi, and B. Boza-Kiss, 2016: Demand response status in EU Member States. European Commission Joint Research Centre, Luxembourg, 153 pp.
Zenghelis, D. and N. Stern, 2016: The importance of looking forward to manage risks: submission to the Task Force on Climate-Related Financial Disclosures. The London School of Economics and Political Science, and the Grantham Research Institute on Climate Change and the Environment, London, UK.
Zerbib, O.D., 2019: The effect of pro-environmental preferences on bond prices: Evidence from green bonds. J. Bank. Financ. , 98, doi:10.1016/j.jbankfin.2018.10.012.
Zhan, C. and M. de Jong, 2018: Financing eco cities and low carbon cities: The case of Shenzhen International Low Carbon City. J. Clean. Prod. , 180, 116–125, doi:10.1016/j.jclepro.2018.01.097.
Zhan, C., M. de Jong, and H. de Bruijn, 2018: Funding Sustainable Cities: A Comparative Study of Sino-Singapore Tianjin Eco-City and Shenzhen International Low-Carbon City. Sustainability, 10(11) , 4256, doi:10.3390/su10114256.
Zhang, H., M. Duan, and Z. Deng, 2019: Have China’s pilot emissions trading schemes promoted carbon emission reductions?– the evidence from industrial sub-sectors at the provincial level. J. Clean. Prod. , 234, 912–924, doi:10.1016/j.jclepro.2019.06.247.
Zhang, W. and X. Pan, 2016: Study on the demand of climate finance for developing countries based on submitted INDC. Adv. Clim. Chang. Res. , 7(1–2) , 99–104, doi:10.1016/j.accre.2016.05.002.
Zhang, Y., 2021: Accelerating Access to Clean Cooking Will Require a Heart-Head-and-Hands Approach. Development , 65, 59–62, doi:10.1057/s41301-021-00297-x.
Zografos, C. and P. Robbins, 2020: Green Sacrifice Zones, or Why a Green New Deal Cannot Ignore the Cost Shifts of Just Transitions. One Earth, 3(5) , 543–546, doi:10.1016/j.oneear.2020.10.012.
1 The term Investment ‘Needs’ used in the chapter means equal to the term Investment Requirement used in SPM.
2 Most of climate finance stays within national borders, especially private climate flows (over 90%). Reasons are national policy support, differences in regulatory standards, exchange rate, political and governance risks, to information market failures.
3 In modelled pathways, regional investments are projected to occur when and where they are most cost-effective to limit global warming. The model quantifications help to identify high-priority areas for cost-effective investments, but do not provide any indication on who would finance the regional investments.
4 In the chapter, USD units are used as reported in the original sources in general. Some monetary quantities have been adjusted selectively for achieving comparability by deflating the values to constant USD2015. In such cases, the unit is explicitly expressed as USD2015.
5 In the chapter, USD units are used as reported in the original sources in general. Some monetary quantities have been adjusted selectively for achieving comparability by deflating the values to constant USD2015. In such cases, the unit is explicitly expressed as USD2015.
6 In the chapter, USD units are used as reported in the original sources in general. Some monetary quantities have been adjusted selectively for achieving comparability by deflating the values to constant USD2015. In such cases, the unit is explicitly expressed as USD2015.
7 The term Investment ‘Needs’ used in the chapter means equal to the term Investment Requirement used in SPM.
8 In modelled pathways, regional investments are projected to occur when and where they are most cost-effective to limit global warming. The model quantifications help to identify high-priority areas for cost-effective investments, but do not provide any indication on who would finance the regional investments.
9 In the chapter, USD units are used as reported in the original sources in general. Some monetary quantities have been adjusted selectively for achieving comparability by deflating the values to constant US Dollar 2015. In such cases, the unit is explicitly expressed as USD2015.
10 Those under the UNFCCC, such as the GCF through its USD3 million per country readiness and preparatory support programme, the Least Developed Countries Fund (LDCF) and the Special Climate Change Fund (SCCF), the Pilot Program for Climate Resilience (PPCR) and the Adaptation for Smallholder Agriculture Programme (ASAP) are focused on supporting the preparatory process of the NAPs. But the Adaptation Fund will support the implementation of concrete projects up to USD10 million per country.
11 According to the climate bonds initiative, total green bond finance raised in 2018 was USD168.5 billion across 44 countries (UNFCCC 2019c).
12 In context, while belonging to grey literature, reports from financial supervisors or non- academic stakeholders can be of interest for what they document in terms of changes in perception and incentives among the market players and hence of the dynamics of climate finance flows.
13 In the chapter, USD units are used as reported in the original sources in general. Some monetary quantities have been adjusted selectively for achieving comparability by deflating the values to constant USD2015. In such cases, the unit is explicitly expressed as USD2015.
14 According to the V20, ‘the term “climate-smart” captures the need for two types of climate-related insurance products for MSMEs in vulnerable economies: (1) Climate risk insurance (2) Insurance products which enable low carbon investments, and thereby contribute to increased efficiencies through cost-savings from cheaper low-carbon technologies’ (V20 2021).
15 GSIA is an international collaboration of membership-based sustainable investment organisations.
16 Notably, the GCF provides guidance to Accredited Entities submitting funding proposals on the inclusion of an initial gender and social assessment during the project planning, preparation and development stage and a gender and social inclusion action plan at the project preparation stage.
17 The Women’s Livelihood Bond (WLB) series has been on the market since 2017 when WLB1 was launched. WLB2 issuance of USD12 million arrived January 2020. WLB3 was launched December 2020 to support 180,000 underserved women and women entrepreneurs in the Asia Pacific region to respond, to recover from, and to build resilience in the aftermath of the COVID-19 pandemic (Rockfeller Foundation and Shujog 2016; IIX 2020).


