Chapter 4: Mitigation and development pathways in the near- to mid-term


This chapter should be cited as:
Lecocq, F., H. Winkler, J.P. Daka, S. Fu, J.S. Gerber, S. Kartha, V. Krey, H. Lofgren, T. Masui, R. Mathur, J. Portugal-Pereira, B. K. Sovacool, M. V. Vilariño, N. Zhou, 2022: Mitigation and development pathways in the near- to mid-term. In IPCC, 2022: Climate Change 2022: Mitigation of Climate Change. Contribution of Working Group III to the Sixth Assessment Report of the Intergovernmental Panel on Climate Change[P.R. Shukla, J. Skea, R. Slade, A. Al Khourdajie, R. van Diemen, D. McCollum, M. Pathak, S. Some, P. Vyas, R. Fradera, M. Belkacemi, A. Hasija, G. Lisboa, S. Luz, J. Malley, (eds.)]. Cambridge University Press, Cambridge, UK and New York, NY, USA. doi: 10.1017/9781009157926.006
Executive Summary 
This chapter focuses on accelerating mitigation and on shifting development pathways to increased sustainability, based on literature particularly at national scale. While previous WGIII assessments have discussed mitigation pathways, focus on development pathways is more recent. The timeframe is the near term (now up to 2030) to mid-term (2030 to 2050), complementing Chapter 3 on the long term (from 2050 onward).
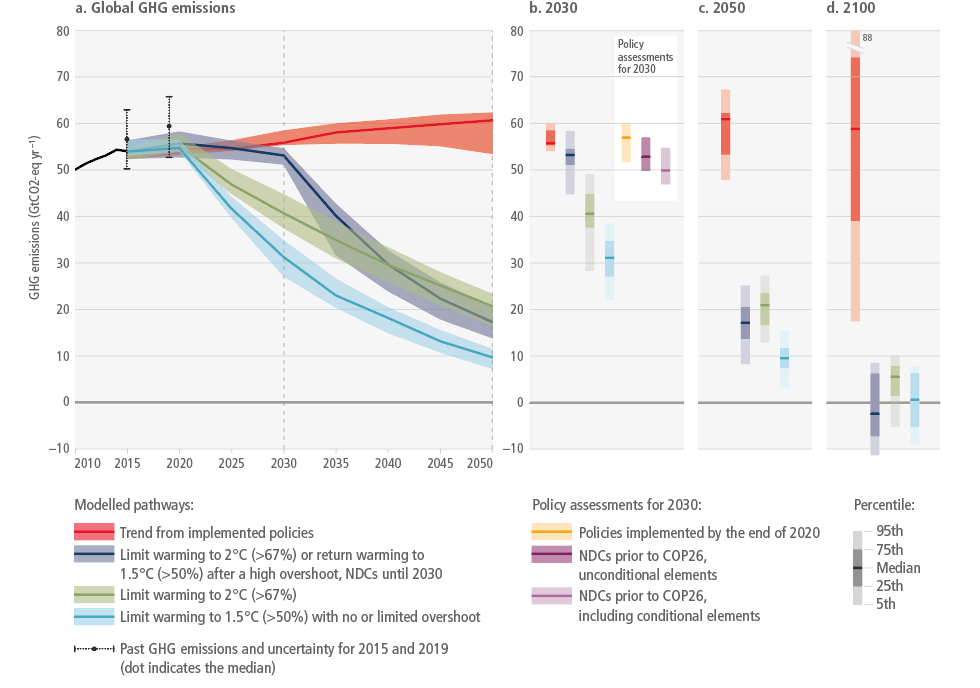
An emissions gap persists, exacerbated by an implementation gap, despite mitigation efforts including those in near-universal nationally determined contributions (NDCs). The ‘emissions gap’ is understood as the difference between the emissions with NDCs in 2030, and mitigation pathways consistent with the temperature goals. In general, the term ‘implementation gap’ refers to the difference between goals on paper and how they are achieved in practice. In this report, the term refers to the gap between mitigation pledges contained in national determined contributions, and the expected outcome of existing policies. There is considerable literature on country-level mitigation pathways, including but not limited to NDCs. Country distribution of this literature is very unequal (robust evidence, high agreement). Current policies lead to median global greenhouse gas (GHG) emissions of 57 GtCO2-eq with a full range of 52–60 by 2030. NDCs with unconditional and conditional elements 1 lead to 53 (50–57) and 50 (47–55) GtCO2-eq, respectively (medium evidence, medium agreement) (Table 4.3). This leaves estimated emissions gaps in 2030 between projected outcomes of unconditional elements of NDCs and emissions in scenarios that limit warming to 1.5°C (>50%) with no or limited overshoot of 19–26 GtCO2-eq, and 10–16 GtCO2-eq for scenarios that limit warming to 2°C (>67%) with immediate action. When conditional elements of NDCs are included, these gaps narrow to 16–23 GtCO2-eq and 6–14 GtCO2-eq, respectively. {Cross-Chapter Box 4, Figure 1}
Studies evaluating up to 105 updated NDCs submitted by October 2021 indicate that emissions in conditional NDCs have been reduced by 4.5 (2.7–6.3) GtCO2-eq, but only closes the emission gaps by about one-third to 2°C and about 20% to 1.5°C compared to the original NDCs submitted in 2015/16 (medium evidence, medium agreement). The magnitude of these emission gaps calls into question whether current development pathways and efforts to accelerate mitigation are adequate to achieve the Paris mitigation objectives. In addition, an implementation gap exists between the projected emissions of ‘current policies’ and the projected emissions resulting from the implementation of the unconditional and conditional elements of NDCs, and is estimated to be around and 7 GtCO2-eq in 2030, respectively (medium evidence, medium agreement), with many countries requiring additional policies and associated climate action to meet their autonomously determined mitigation targets as specified under the first NDCs (limited evidence). There is, furthermore, a potential difference between mitigation targets set in NDCs ex ante and what is achieved ex post . A limited number of studies assess the implementation gaps of conditional NDCs in terms of finance, technology and capacity building support. The disruptionstriggered by the COVID-19 epidemic increase uncertainty over range of projections relative to pre-COVID-19 literature. As indicated by a growing number of studies at the national and global level, how large near- to mid-term emissions implications of the COVID-19 pandemic are, to a large degree depends on how stimulus or recovery packages are designed. {4.2, 4.2.2.5, Cross-Chapter Box 4}
Given the gaps, there is a need to explore accelerated mitigation (relative to NDCs and current policies). There is increasing understanding of the technical content of accelerated mitigation pathways, differentiated by national circumstances, with considerable though uneven literature at country-level (medium evidence, high agreement). Transformative technological and institutional changes for the near term include demand reductions through efficiency and reduced activity, rapid decarbonisation of the electricity sector and low-carbon electrification of buildings, industry and transport (robust evidence, medium agreement). A focus on energy use and supply is essential, but not sufficient on its own – the land sector and food systems deserve attention. The literature does not adequately include demand-side options and systems analysis, and captures the impact from non-CO2GHGs with medium confidence. Countries and regions will have different starting points for transition pathways. Some factors include climate conditions resulting in different heating and cooling needs, endowments with different energy resources, patterns of spatial development, and political and economic conditions. {4.2.5}
Accelerated mitigation alone may run into obstacles. If such obstacles are rooted in underlying structural features of society, then transforming such structures helps remove obstacles, which amounts to shifting development pathways. Various actors have developed an increasing number of mitigation strategies up to 2050 (mid-term). A growing number of such strategies aim at net zero GHG or CO2 emissions, but it is not yet possible to draw global implications due to the limited size of sample (medium evidence, low agreement). Non-state actors are also engaging in a wide range of mitigation initiatives. When adding up emission reduction potentials, sub-national and non-state international cooperative initiatives could reduce up to about 20 GtCO2-eq in 2030 (limited evidence, medium agreement). Yet perceived or real conflicts between mitigation and other Sustainable Development Goals (SDGs) can impede such action. If undertaken without precaution, accelerated mitigation is found to have significant implications for development objectives and macroeconomic costs at country level. For example, most country-level mitigation modelling studies in which GDP is an endogenous variable report negative impacts of mitigation on GDP in 2030 and 2050, relative to the reference. In all reviewed studies, however, GDP continues to grow even with mitigation(robust evidence, high agreement). The literature finds that employment effect of mitigation policies tends to be limited on aggregate, but can be significant at sectoral level (limited evidence, medium agreement). Detailed design of mitigation policies is critical for distributional impacts and avoiding lock-in (robust evidence, high agreement), though further research is needed in that direction. {4.2.3, 4.2.4, 4.2.6}
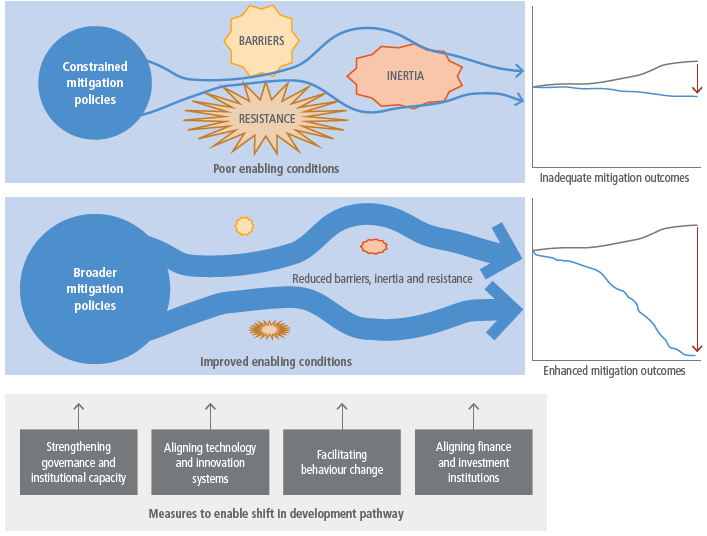
Shifting development pathways towards sustainability offers ways to (i) broaden the range of levers and enablers that a society can use to provide enabling conditions and accelerate mitigation; and (ii) increase the chances of advancing at the same time towards mitigation and towards other development goals. The way countriesdevelop determines their capacity to accelerate mitigation and achieve other sustainable development objectives simultaneously (medium-robust evidence, medium agreement). Yet meeting ambitious mitigation and development goals cannot be achieved through incremental change, hence the focus on shifting development pathways (robust evidence, medium agreement). Though development pathways result from the actions of a wide range of actors, it is possible to shift development pathways through policies and enhancing enabling conditions (limited evidence, medium agreement). For example, policies such as those listed in Table 4.12 are typically associated with broader objectives than greenhouse gas mitigation. They are generally conceived and implemented in the pursuit of overall societal development objectives, such as job creation, macroeconomic stability, economic growth, and public health and welfare. In some countries, such policies are framed as part of a just transition. However, they can have major influence on mitigative capacity, and hence can be seen as tools to broaden mitigation options, as illustrated by the Illustrative Mitigation Pathway ‘Shifting Pathways’ (medium evidence, medium agreement). There are practical options to shift development pathways in ways that advance mitigation and other sustainable development objectives, supporting political feasibility, increase resources to meet multiple goals, and reduce emissions (limited evidence, high agreement). Concrete examples assessed in this chapter include high employment and low emissions structural change, fiscal reforms for mitigation and social contract, combining housing policies to deliver both housing and transport mitigation, and change economic, social and spatial patterns of development of the agriculture sector provide the basis for sustained reductions in emissions from deforestation. These examples differ by context. Examples in other chapters include transformations in energy, urban, building, industrial, transport, and land-based systems, changes in behaviour and social practices, as well as transformational changes across whole economies and societies. Coordinated policy mixes would need to coordinate multiple actors – individuals, groups and collectives, corporate actors, institutions and infrastructure actors – to deepen decarbonisation and shift pathways towards sustainability. Shifts in one country may spill over to other countries. Shifting development pathways can jointly support mitigation and adaptation. Some studies explore the risks of high complexity and potential delay attached to shifting development pathways. {4.3, 4.3.1, 4.3.2, 4.4.2, 4.4.3, 4.4.1.7–4.4.1.10, Figure 4.7, Cross-Chapter Box 5, 5.8, Box 6.2, 8.2, 8.3.1, 8.4, 9.8.1, 9.8.2, 10.4.1, Cross-Chapter Box 5, Cross-Chapter Box 7, Cross-Chapter Box 12}
The literature identifies a broad set of enabling conditions that can both foster shifting development pathways and accelerated mitigation, along five categories (medium evidence, high agreement). Policy integration is a necessary component of shifting development pathways, addressing multiple objectives. To this aim, mobilising a range of policies is preferable to single policy instruments (robust evidence, high agreement). Governance for climate mitigation and shifting development pathways is enhanced when tailored to national and local contexts. Improved institutions and governance enable ambitious climate action and help bridge implementation gaps (medium evidence, high agreement). Given that strengthening institutions may be a long term endeavour, it needs attention in the near ter m. Accelerated mitigation and shifting development pathways necessitates both redirecting existing financial flows from high- to low-emissions technologies and systems and to provide additional resources to overcome current financial barriers (robust evidence, high agreement). Opportunities exist in the near term to close the finance gap. At the national level, public finance for actions promoting the SDG agenda helps broaden the scope of mitigation (medium evidence, medium agreement). Changes in behaviour and lifestyles are important to move beyond mitigation as incremental change, and when supporting shifts to more sustainable development pathways will broadening the scope of mitigation (medium evidence, medium agreement). The direction of innovation matters (robust evidence, high agreement). The necessary transformational changes are likely to be more acceptable if rooted in the development aspirations of the economy and society within which they take place. {4.4.1, 4.4.1.2, 4.4.1.3, 4.4.1.4, 4.4.1.5, 4.4.1.6, Figure 4.8, 15.2.2}
Equity can be an important enabler of deeper ambition for accelerated mitigation, dealing with the distribution of costs and benefits and how these are shared as per social contracts, national policy and international agreements. Transition pathways have distributional consequences such as large changes in employment and economic structure (robust evidence, high agreement). In that regard, the just transition concept has become an international focal point tying together social movements, trade unions, and other key stakeholders to ensure equity is better accounted for in low-carbon transitions. Effectiveness of cooperative action and the perception of fairness of such arrangements are closely related, in that pathways that prioritise equity and allow broad stakeholders participation can enable broader consensus for the transformational change implied by deeper mitigation efforts (robust evidence, medium agreement). Hence, equity is a concept that is instrumentally important. {4.5, Figure 4.9}
In sum, this chapter suggests that the immediate tasks are to broaden and deepen mitigation in the near term if the global community is to deliver emission reductions at the scale required to keep temperature well below 2°C and pursue efforts at 1.5°C. Deepening mitigation means more rapid decarbonisation. Shifting development pathways to increased sustainability (SDPS) broadens the scope of mitigation. Putting the enabling conditions above in place supports both. Depending on context, some enabling conditions such as shifting behaviour may take time to establish, underscoring the importance of early action. Other enabling conditions, such as improved access to financing, can be put in place in a relatively short time frame, and can yield results rapidly.
Accelerating mitigation: The literature points to well-understood policy measures and technologies for accelerating mitigation, though the balance depends on country specificities: (i) decarbonising electricity supply to produce net zero CO2, including renewable energy, (ii) radically more efficient use of energy than today; (iii) electrification of end-uses including transport; (iv) dramatically lower use of fossil fuels than today; (v) converting other uses to low- or zero-carbon fuels (e.g., hydrogen, bioenergy, ammonia) in hard-to-decarbonise sectors; (vi) promote bioenergy, demand reduction, dietary changes, and policies, incentives, and rules for mitigation in the land sector; and (vii) setting and meeting ambitious targets to reduce methane and other short-lived climate forcers. Charting just transitions to net zero may provide a vision, which policy measures can help achieve. Though there is increasing experience with pricing carbon directly or indirectly, decision-makers might consider a broader toolbox of enablers and levers that is available in domains that have not traditionally been considered climate policy. {4.5, Annex II.IV.11}
Broadening opportunities by focusing on development pathways and considering how to shift them: Some of the policy measures may yield rapid results, whereas other, larger transformations may take longer. If we are to overcome obstacles, a near-term priority is to put in place the enabling conditions to shifting development pathways to increased sustainability. Learning from the examples above, focusing on SDPS also provides a broader set of tools to accelerating mitigation and achieve other sustainable development goals. Consider climate whenever you make choices about development, and vice versa. {4.4.1}
4.1Introduction
The recent IPCC Report on Global Warming of 1.5°C (SR1.5) made clear that the next three decades are critical if we are to achieve the long-term mitigation goal of the Paris Agreement (IPCC 2018a). The present chapter assesses the literature on mitigation and development pathways over that timeframe, in the near (up to 2030) and mid-term (up to 2050).
It considers three questions: (i) Where are we heading now? That is, what is the current state of affairs with respect to climate mitigation and how did we get here? (ii) Where do we want to go? For example, what state of affairs would meet the objectives of the Paris Agreement and achieving the Sustainable Development Goals (SDGs)? and (iii) How do we bring about this shift? In other words, what interventions are at societies’ disposal to bring about the necessary change in an equitable manner?
Where are we heading now?Despite the drop in emissions due to the COVID-19 crisis, the gap between projected emissions based on Nationally Determined Contributions (NDCs) in 2030 and emissions pathways compatible with the long term temperature goal set in the Paris Agreement remains large (Section 4.2.2). In addition to this persistent emissions gap, we face an implementation gap, as current policies are insufficient to achieve mitigation targets in NDCs, and sufficient international support is not yet available to developing countries who have requested and quantified support needs. Continuing along a development pathway characterised by the same underlying drivers, structural obstacles and insufficient enabling conditions that led to high emissions will not address the problem (robust evidence, high agreement).
The analysis of the gap is conducted together with Chapter 3 (Cross-Chapter Box 4 in this chapter). Chapter 3 is working backward, assessing mitigation in the long term (beyond 2050 up to 2100) to draw the near- and mid-term implications of long-term temperature and mitigations goals. Chapter 4, on the other hand, works forward from current and planned mitigation (including NDCs) (Sections 4.2.1 and 4.2.2) and from current development paths to assess the implications for near- and mid-term greenhouse gases (GHG) emissions and development goals. Some countries, regions, cities, communities and non-state actors are taking leadership in implementing more ambitious action (Section 4.2.3). This chapter also assesses national low emission development strategies (Section 4.2.4).
Where do we want to go? Technical alternatives and policy options exist to bridge the emissions and implementation gaps, and the literature illustrates these with a wide range of accelerated techno-economic pathways that deepen decarbonisation closer to the pace and scale required (Section 4.2.5), and examines their impacts on other development objectives (Section 4.2.6). In practice, however, scaling up at the broader, deeper, and faster level required to meet climate goals while advancing other development objectives regularly faces prohibitive obstacles (Section 4.2.7). Mitigation policies grafted on to existing development pathways are unlikely to achieve rapid and deep emission reductions.
Secondly, even if carefully designed, climate policies to accelerate mitigation may have adverse consequences for other development objectives. As a complement to mitigation action, taking action to shift development pathways towards sustainability broadens the range of mitigation options, while increasing the possibility to meet other development priorities at the same time (medium evidence, high agreement).
Development pathways and shifting them to increased sustainability are introduced in Chapter 1, and constitute a thread throughout the report (see ‘development pathways’ in Annex I: Glossary). The AR6 WGII Report highlights the related concept of climate resilient development pathways (AR6 WGII, Chapter 18). Cross-Chapter Box 5 in this chapter – on shifting sustainable pathway towards sustainability – elaborates on the concept. The influence of development pathways on emissions and mitigative capacity is discussed in Chapter 2. Chapter 3 assesses modelling of shifts in development pathways, illustrated by the illustrative mitigation pathway called ‘shifting pathways’. The importance of behavioural change as societies make decisions that intentionally shift their future development pathway is emphasised in Chapter 5. The systems Chapters (6–12) take sectoral perspectives, while pathways that are sustainable are the specific focus of Chapter 17.
How can one shift development pathway and accelerate mitigation? The literature does not provide a complete handbook for shifting development pathways and accelerating mitigation. The literature does, however, shed light on some of the underlying dynamics. Shifting development pathways can be necessitated by the existence of pervasive obstacles that prove prohibitive to reaching mitigation and other development objectives (Section 4.2.7). Deliberate measures taken to facilitate the shifting of development pathways and accelerated mitigation involve putting in place key enabling conditions that help overcome those obstacles (Figure 4.6) – improving governance and institutional capacity, fostering behavioural change and technological innovation, designing and implementing adequate policy, and finance. Just transitions, while they will differ by context, are critical to identifying and avoiding or addressing inequitable distributive consequences (robust evidence, high agreement).
Enabling conditions necessary to accelerate mitigation and shift development pathways are discussed in depth in Chapters 5, 13, 14, 15 and 16. In addition, Chapters 13 and 14 detail the policy instruments that could help shift development pathways and accelerate the scale and pace of mitigation, while Chapter 4 describes those in broad strategies terms. Chapter 13 adds more texture on institutional and governance machinery; policy choice, design and implementation; as well as policy formulation processes, actors and structure across scales.
Since development pathways and mitigation options depend to large extent on national objectives and circumstances, this chapter is primarily concerned with literature at national level (or in the case of the European Union, at regional level), while Chapter 3 is primarily concerned with literature at global scale. The national scale selected in this chapter requires attention as national mitigation pathways cannot be linked directly to global mitigation goals (Box 4.2). This chapter is also concerned mostly with economy-wide development and mitigation pathways, as distinct from detailed sectoral work that is assessed in the systems Chapters 6 to 12. The present chapter also assesses literature on non-state action.
Chapter 4 draws on five major strands of literature: (i) an emerging literature on development pathways – conceptual, empirical, and model-based, including at the national and sub-national scales; (ii) a rapidly expanding, model-based, literature on mitigation pathways in the near- and mid-term (Lepault and Lecocq 2021); (iii) studies of NDCs and mid-century strategies; (iv) a broader literature on transformation and shifts in development pathways, including from non-climate literatures; and (v) a significant literature on equity, including just transitions. This is supported by a database of country-level mitigation scenarios at country level assembled for the preparation of this chapter (Annex III, Table I.10 and I.11).
The chapter builds on past IPCC reports. In AR5, all mitigation pathways were assessed in a single chapter (Clarke et al. 2014), which focused mostly on the long term. IPCC Special Report on Global Warming of 1.5°C (SR1.5) included a chapter on mitigation pathways compatible with the temperature goal in the Paris Agreement (Rogelj et al. 2018a), mostly at the global level. It also considered strengthening mitigation (de Coninck et al. 2018) in the context of poverty, inequality and sustainable development (Roy et al. 2018). Development pathways have also been explored, albeit less frequently, in past IPCC reports starting with the Special Report on Emissions Scenarios (Nakicenovic et al. 2000). Some early framing of development pathways was included in the Third Assessment Report (Banuri et al. 2001), further developed in the Fourth Assessment Report (Sathaye et al. 2007). An extended discussion of climate change and equity was conducted in AR5 (Fleurbaey et al. 2014).
Chapter 4 examines mitigation within the broader context of development pathways, and examines how shifting development pathways can have a major impact on mitigative capacity and broadening mitigation options. It is organised as follows.
Section 4.2 demonstrates that collective mitigation actions fall short of pathways that keep in reach the Paris temperature goals in the long term. Section 4.3 introduces development pathways (given its relative novelty in IPCC assessments), considers the implications of mitigation for development and vice versa, and articulates an approach on both accelerating mitigation and shifting development pathways.
Section 4.4 discusses how to shift development pathway and accelerate the scale and pace of mitigation, what levers are available to policymakers, and how policies may intersect with adaptation goals. It points out that development pathways also drive adaptation and adaptative capacity, and discusses various risks associated with shifting development pathways and accelerated mitigation strategies.
Finally, equity and just transitions are recurring themes in the chapter, specifically in relation to accelerating mitigation and shifting development pathways toward sustainability. In Section 4.2.2.7, equity is discussed in the context of Parties’ assertions regarding the fairness of their NDCs, alongside reflections from academic scholarship on the ethical underpinnings of these assertions and of various quantitative analyses of equitable effort-sharing. Section 4.2.6 discusses certain distributional implications of domestic mitigation efforts, such as shifts in employment. Sections 4.2.7 and 4.3 note the relevance of potential distributional impacts as an obstacle to climate action, as well as the inequitable distribution of decision-making authority. Finally, Section 4.5 recognises the structural relationship between equity and climate, explores just transitions as an international focal point tying together social movements, trade unions, and other stakeholders, and thus an instrumental role in establishing consensus.
4.2Accelerating Mitigation Actions Across Scales
4.2.1Mitigation Targets and Measures in Nationally Determined Contributions
A central instrument of the Paris Agreement is the NDCs, submitted by each country, and reflecting national efforts to reduce GHG emissions and build resilience to the impacts of climate change. Every five years, collective progress will be compared against long-term goals of the Paris Agreement. Considering the outcome of a global stocktake, countries will prepare subsequent NDCs, showing progression in their ambition and enhancing international cooperation (UNFCCC 2015a).
Prior to COP21, in 2015, most countries submitted their Intended Nationally Determined Contributions (INDCs), which included mitigation targets for 2025 or 2030. INDCs become first NDCs on ratification and/or after national governments’ revision, and by 11 October 2021, the official NDC registry contained 194 first NDCs with 105 new and updated NDCs from 132 Parties to the Paris Agreement, covering 53% of the total global emissions in 2019 of 52.4 GtCO2-eq without land use, land-use change and forestry (LULUCF), and 13 second NDCs. Most of the Parties that submitted new or updated NDCs have demonstrated increased ambition in addressing climate change. Moreover, though some countries have not submitted their updated NDCs yet, they have already announced their updated NDC goals somewhere. Countries will take the first stock in 2023 based on their progression towards achieving the objectives of Paris Agreement (UNFCCC 2015a, 2018a; SB Chairs 2021) (Section 14.3.2.5).
Submitted NDCs vary in content, scope and background assumptions. First NDCs contain mitigation targets, and in many cases also provisions about adaptation. The mitigation targets range from economy-wide absolute emission reduction targets to strategies, plans and actions for low-emission development. Baseline years vary from 1990 to 2015 and in almost all NDCs the targeted time frame is 2030, with a few specified periods of until 2025, 2035, 2040 or 2050. Around 43% of the mitigation targets in first NDCs are expressed in terms of deviation below business-as-usual by a specified target year, either for the whole economy or for specific sectors, while around 35% include fixed-level targets (either reductions or limitations compared to base years), and another 22% refer to intensity targets (in terms of GHG, CO2 or energy) or policies and measures, with an increasing number of Parties moving to absolute emission reduction targets in their new or updated NDCs (UNFCCC 2016a, 2021). Some developing countries’ NDCs include unconditional elements, while others include conditional ones, the latter with higher ambition if finance, technology and capacity building support from developed countries is provided (UNFCCC 2016a). 2 In some NDCs, the additional mitigation is quantified, in others not (Figure 14.2).
Most first NDCs cover all specific sectors, including LULUCF, and communicate specific targets for individual sub-sectors to support their overall mitigation targets. Concrete actions and priority areas are more detailed in the energy sector, with increased share of renewable energies and energy efficiency being highlighted in the majority of NDCs. Given the uncertainty behind LULUCF emission and removal accounting (Grassi et al. 2017; Jian et al. 2019), several countries state that their accounting framework will only be defined in later NDCs. The GHG included and the global warming potentials (GWPs) used to aggregate emissions also vary across NDCs. Most countries only refer to carbon dioxide, methane and nitrous oxide emissions aggregated based on IPCC AR2 or AR4 metrics, while few NDCs also include fluorinated gases and use IPCC AR5 GWPs. The shares of Parties that indicate possible use of at least one type of voluntary cooperation and set qualitative limits on their use have both nearly doubled in new or updated NDCs.
There is considerable literature on country-level mitigation pathways, including but not limited to NDCs. Country distribution of this literature is very unequal (robust evidence, high agreement). In particular, there is a growing literature on (I)NDCs, with a wide scope which includes estimate of emissions levels of NDCs (Section 4.2.2.2); alignment with sustainable development goals (Caetano et al. 2020; Campagnolo and Davide 2019; Fuso Nerini et al. 2019; Antwi-Agyei et al. 2018); ambition (Höhne et al. 2018; Vogt-Schilb and Hallegatte 2017; Hermwille et al. 2019); energy development (Scott et al. 2018); and the legality of downgrading NDCs (Rajamani and Brunnée 2017). Other studies note that many NDCs contain single-year mitigation targets, and suggest that a multi-year trajectory is important for more rigorous monitoring (Elliott et al. 2017; Dagnet et al. 2017).
The literature also points out that beyond the ‘headline numbers’, information in (I)NDCs is difficult to analyse (Pauw et al. 2018). Information for ‘clarity, transparency and understanding’ is to be communicated with NDCs, although initial guidance was not specific (UNFCCC 2014). While the adoption of the Paris rule-book provided some greater specificity (UNFCCC 2018b,c), the information included in the NDCs remains uneven. Many NDCs omit important mitigation sectors and do not adequately provide details on costs and financing of implementation (Pauw et al. 2018). Countries are also invited to explain how their NDCs are fair and ambitious, though the way this has been done so far has been criticised as insufficiently rigorous (Winkler et al. 2018).
4.2.2Aggregate Effects of NDCs and Other Mitigation Efforts Relative to Long-term Mitigation Pathways
4.2.2.1Introduction
Near-term mitigation targets submitted as part of NDCs to the UNFCCC, as well as currently implemented policies, provide a basis for assessing potential emissions levels up to 2030 at the national, regional and global level. The following sections present an evaluation of the methods used for assessing projected emissions under NDCs and current policies (Section 4.2.2.2), and the results of these assessments at global, regional and national level assessing a broad available literature based on first NDC submissions from 2015/16 and pre-COVID economic projections (Section 4.2.2.3). The impacts of the COVID-19 pandemic and related government responses on emissions projections are then discussed in Section 4.2.2.4 and the implications of updated NDCs submitted in 2020/21 on emissions follow in Section 4.2.2.5. Section 4.2.2.6 presents an assessment of the so-called ‘implementation gap’ between what currently implemented policies are expected to deliver and what the ambitions laid out under the full implementation of the NDCs are projected to achieve. Finally, a comparison of ambitions across different countries or regions (Section 4.2.2.7) is presented and the uncertainties of projected emissions associated with NDCs and current policies are estimated, including a discussion of measures to reduce uncertainties in the specification of NDCs (Section 4.2.2.8).
The literature reviewed in this section includes globally comprehensive assessments of NDCs and current policies, both peer-reviewed and non-peer-reviewed (but not unpublished model results) as well as synthesis reports by the UNFCCC Secretariat, government reports and national studies.
The aggregate effects of NDCs provide information on where emissions might be in 2025/2030, working forward from their recent levels. Chapter 3 of this report works backwards from temperature goals, defining a range of long-term global pathways consistent with 1.5°C, 2°C and higher temperature levels. By considering the two together, it is possible to assess whether NDCs are collectively consistent with 1.5°C, 2°C and other temperature pathways (Cross-Chapter Box 4 in this chapter).
4.2.2.2Methods to Project Emissions Under NDCs and Current Policies
A variety of different methods are used to assess emissions implications of NDCs and current policies over the time horizon to 2025 or 2030. Some of these projections were explicitly submitted as part of an official communication to UNFCCC (e.g., Biennial Report, Biennial Update Reports or National Communications) while the majority is from independent studies.
Methods that are used in independent studies (but that can also underlie the official communications) can broadly be separated into two groups:
1. system modelling studies which analyse policies and targets in a comprehensive modelling framework such an integrated assessment, energy systems or integrated land-use model to project emissions (or other indicators) of mitigation targets in NDCs and current policies, either at the national or global scale (noting some differences in the systems); and
2. hybrid approaches that typically start out with emissions pathways as assessed by other published studies (e.g., the IEA World Energy Outlook, national emissions pathways such as those specified in some NDCs) and use these directly or apply additional modifications to them.
System modelling studies are conducted at global, regional and national scales. Global models provide an overview, are necessary for assessment of global phenomena (e.g., temperature change), can integrate climate models and trade effects. National models typically include more details on sectors, technology, behaviour and intersectoral linkages, but often use simplifying assumptions for international trade (e.g., the Armington elasticity approach). Critically, they can also better reflect local socio-economic and political conditions and their evolution (i.e., national development pathways). A variety of modelling paradigms are found, including optimisation and simulation models, myopic and with foresight, monolithic and modular (Annex III: Scenarios and Modelling Methods).
Among the hybrid approaches, three broader categories can be distinguished, (i) direct use of official emission projection as part of submitted NDC or other communication to UNFCCC, (ii) historical trend extrapolation of emissions based on inventory data, possibly disaggregated by sector and emission species, and (iii) use of Reference/Business-As-Usual pathways from an independent published study (e.g., IEA WEO). In all cases, the reductions are then estimated on top of the resulting emission trajectory. Note that globally comprehensive studies may vary the approach used depending on the country.
Beyond the method applied, studies also differ in a number of dimensions, including (i) their spatial resolution and coverage, (ii) their sectoral resolution and coverage, (iii) the GHGs that are included in the assessment, the GWPs (or other metrics) to aggregate them, the emissions inventory (official vs independent inventory data) and related accounting approaches used as a starting point for the projections, (iv) the set of scenarios analysed (Reference/Business-As-Usual, Current Policies, NDCs, etc.), and (v) the degree to which individual policies and their impact on emissions are explicitly represented (Table 4.1).
First, the studies are relevant to different spatial levels, ranging from macro-scale regions with globally comprehensive coverage to national level (Section 4.2.2.3) and sub-national and company level in a few cases (Section 4.2.3). It is important to recognise that globally comprehensive studies typically resolve a limited number of countries individually, in particular those that contribute a high share to global emissions, but have poor resolution of remaining countries or regions, which are assessed in aggregate terms. Conversely, studies with high resolution of a particular country tend to treat interactions with the global scale in a limited way. The recent literature includes attempts to provide a composite global picture from detailed national studies (Bataille et al. 2016a; Deep Decarbonization Pathways Project 2015; Roelfsema et al. 2020).
A second dimension in which the studies are different is their comprehensiveness of covering different emitting sectors. Some studies focus on the contribution of a single sector, for example the agriculture, forestry and other land use (AFOLU) sector (Fyson and Jeffery 2019; Grassi et al. 2017) or the energy system (including both energy supply and demand sectors), to emission reductions as specified in the NDC. Such studies give an indication of the importance of a given sector to achieving the NDC target of a country and can be used as a benchmark to compare to comprehensive studies, but adding sectoral contributions up represents a methodological challenge.
Third, GHG coverage is different across studies. Some focus on CO2 only, while others take into account the full suite of Kyoto gases (CO2, CH4, N2O, HFCs, PFCs and SF6). For the latter, different metrics for aggregating GHGs to a CO2-equivalent metric are being used, typically GWP 100 from different IPCC assessments (Table 4.1).
Fourth, studies typically cover a set of scenarios, though how these scenarios are defined varies widely. The literature reporting IAM results often includes Nationally Determined Contribution (NDC), which are officially communicated, and Current Policies (CP) as interpreted by modellers. Studies based on national modelling, by contrast, tend to define scenarios reflecting very different national contexts. In both cases, modellers typically include so-called No Policy Baseline scenarios (alternatively referred to as Reference or Business-as-Usual scenarios) which do not necessarily reflect currently implemented policies and thus are not assessed as reference pathways (Section 4.2.6.1). There are also various approaches to considering more ambitious action compared to the CP or NDC projections that are covered in addition.
Fifth, studies differ in the way they represent policies (current or envisioned in NDCs), depending on their internal structure. For example, a subsidy to energy efficiency in buildings may be explicitly modelled (e.g., in a sectoral model that represents household decisions relative to building insulation), represented by a proxy (e.g., by an exogenous decrease in the discount rate households use to make choices), or captured by its estimated outcome (e.g., by an exogenous decrease in the household demand for energy, say in an energy system model or in a compact CGE). Detailed representations (such as the former example) do not necessarily yield more accurate results than compact ones (the latter example), but the set of assumptions that are necessary to represent the same policy will be very different.
Finally, policy coverage strongly varies across studies with some just implementing high level targets specified in policy documents and NDCs while others represent the policies with the largest impact on emissions and some looking at very detailed measures and policies at sub-national level. In addition, in countries with rapidly evolving policy environments, slightly different cut-off dates for the policies considered in an emission projection can make a significant difference for the results (Dubash et al. 2018).
The challenges described above are dealt with in the assessment of quantitative results in Section 4.2.2.3 by (i) comparing national studies with country-level results from global studies to understand systematic biases; (ii) comparing economy-wide emissions (including AFOLU) as well as energy-related emissions; (iii) using different emission metrics including CO2 and Kyoto GHG emissions where the latter have been harmonised to using AR6 GWP100 metrics; and (iv) tracking cut-off dates of implemented policies and NDCs used in different references (Table 4.SM.1). The most notable differences in quantitative emission estimates related to current policies and NDCs relate to the COVID-19 pandemic and its implications and to the updated NDCs mostly submitted since early 2020 which are separately dealt with in Sections 4.2.2.4 and 4.2.2.5, respectively.
In addition to assessing the emissions outcomes of NDCs, some studies report development indicators, by which they mean a wide diversity of socio-economic indicators (Jiang et al. 2013; Chai and Xu 2014; Delgado et al. 2014; La Rovere et al. 2014a; Zevallos et al. 2014; Benavides et al. 2015; Altieri et al. 2016; Bataille et al. 2016a; Zou et al. 2016; Paladugula et al. 2018; Parikh et al. 2018; Yang et al. 2021), share of low-carbon energy (Bertram et al. 2015; Riahi et al. 2015), renewable energy deployment (Roelfsema et al. 2018), production of fossil fuels (SEI et al. 2020) or investments into low-carbon mitigation measures (McCollum et al. 2018) to track progress towards long-term temperature goals.
Table 4.1 | Assessment of projected 2030 emissions of current policies based on pre-COVID assumptions and original NDCs submitted in 2015/16 for 28 individual countries/regions and the world. The table compares projected emissions from globally comprehensive studies, national studies and, when available, official communications to UNFCCC using different emission sources (fossil fuels, AFOLU sector) and different emission metrics (CO2, Kyoto GHGs). The comparison allows identifying potential biases across the ranges and median estimates projected by the different sets of studies.
Region a | GHG share [%]b | Type c | # estimates d | Current Policies 2030 emissions | NDC 2030 emissions (conditional/unconditional) | ||||
CO2 only [GtCO2] median (min–max)f | Kyoto GHGs e[GtCO2-eq] median (min–max)f | CO2 only [GtCO2] median (min–max)f | Kyoto GHGs e[GtCO2-eq] median (min–max)f | ||||||
incl. AFOLUg | fossil fuels | incl. AFOLUg | incl. AFOLUg | fossil fuels | incl. AFOLUg | ||||
World | 100 | global | 93 | 43 (38–51) | 37 (33–45) | 60 (54–68) | 40 (35–45)/ 37 (35–39) | 32 (26–39)/ 31 (27–37) | 54 (50–60)/ 57 (49–63) |
CHN | 27 | global | 76 | 12 (9.7–15) | 11 (8.4–14) | 15 (12–18) | – /11 (9.8–13) | – /8.8 (6.9–13) | – /14 (13–16) |
national | 13 | 12 (12–12) | 11 (9.2–13) | 15 (13–15) | – /12 (11–12) | – /11 (10–11) | – /15 (13–16) | ||
USAh | 12 | global | 71 | 4.9 (4.4–6.6) | 4.6 (3.5–6.5) | 5.9 (4.9–6.6) | – /3.8 (3.3–4.1) | – /3.9 (3.1–5.3) | – /4.6 (4–5.1) |
national | 5 | 4.1 | 4.5 (4.1–4.9) | 5.9 (5.2–6.7) | – /3.4 | – /3.5 | – /4.3 | ||
EUi | 8.1 | global | 24 | 2.7 (2.1–3.5) | 2.6 (2.1–3.3) | 3.4 (2.6–4.7) | – /2.6 (2.1–2.8) | – /2.4 (2.1–2.7) | – /3.2 (2.6–3.7) |
national | 3 | 3.1 | 2.6 | – /2.5 | |||||
official | 3 | 3.2 (2.8–3.7) | |||||||
IND | 7.1 | global | 79 | 3.7 (3–4.5) | 3.2 (2.5–4.5) | 4.7 (4.1–6.4) | 3.3 (3.1–4.4)/4 | 3.3 (2.4–5.6)/3.8 (2.9–5.6) | 5 (4.2–6.4)/5.8 (4.9–6.1) |
national | 9 | 3.4 (3.3–4) | 3.4 (2.9–3.9) | 5.5 (5–5.7) | 3.4 (3.2–3.6)/3.2 | 3.4 (3.2–3.5)/2.9 | 5.1/4.9 | ||
RUS | 4.5 | global | 66 | 1.7 (0.84–2) | 1.6 (1.5–2) | 2.3 (1.6–3.3) | – /1.7 (0.85–1.9) | – /1.6 (1.2–1.9) | – /2.6 (1.9–3.1) |
national | 6 | 1.5 (1.5–1.5) | 2.6 | – /1.5 (1.5–1.5) | – /2.5 | ||||
official | 2 | 2.1 | – /2.7 | ||||||
BRA | 2.5 | global | 69 | 1.1 (0.79–1.7) | 0.5 (0.28–1.1) | 1.8 (1.4–2.7) | – /0.94 (0.52–1.5) | – /0.38 (0.097–0.86) | – /1.3 (1.2–2.5) |
national | 4 | 0.59 | 0.47 | 1.8 | – /0.51 | – /0.47 | – /1.2 | ||
official | 1 | – /1.2 | |||||||
JPN | 2.4 | global | 66 | 1.2 (0.94–1.3) | 1.1 (0.67–1.3) | 1.2 (0.95–1.3) | – /1 (0.9–1.2) | – /0.83 (0.65–1.2) | – /1 (0.95–1.2) |
national | 16 | 1.1 (1.1–1.6) | 1.1 (1.1–1.5) | 1.3 (1.2–1.7) | – /0.93 (0.91–1.2) | – /0.93 (0.87–1.1) | – /1 (1–1.3) | ||
official | 1 | – /1 | |||||||
IDN | 2.2 | global | 25 | 1.1 (0.79–2) | 0.62 (0.51–0.89) | 1.7 (1.4–2.4) | 0.93 (0.76–1.4)/0.99 | 0.53 (0.45–0.66)/0.68 (0.6–0.77) | 1.8 (1.3–2.1)/2.1 (1.5–2.2) |
official | 2 | 1.9 (1.8–1.9)/2.2 | |||||||
CAN | 1.5 | global | 67 | 0.58 (0.4–0.8) | 0.43 (0.38–0.72) | 0.68 (0.51–1) | – /0.43 (0.34–0.67) | – /0.43 (0.31–0.64) | – /0.53 (0.49–0.82) |
national | 2 | 0.54 | 0.71 | – /0.41 | – /0.54 | ||||
official | 2 | 0.67 | |||||||
MEX | 1.5 | global | 31 | 0.61 (0.54–1.3) | 0.48 (0.3–0.56) | 0.82 (0.72–1.7) | 0.54 (0.48–1)/0.46 | 0.43 (0.27–0.54)/0.33 (0.26–0.42) | 0.65 (0.62–1.4)/0.73 (0.63–0.79) |
official | 2 | 0.62/0.76 | |||||||
SAU | 1.5 | global | 6 | 0.7 (0.57–0.82) | 0.61 (0.48–0.74) | 1 (0.7–1.1) | 0.7 (0.58–0.82)/ – | 0.62 (0.49–0.74)/ – | 0.83 (0.7–0.96)/ – |
KOR | 1.4 | global | 64 | 0.69 (0.55–0.76) | 0.67 (0.42–0.91) | 0.72 (0.68–0.81) | – /0.57 (0.5–0.65) | – /0.4 (0.26–0.61) | – /0.57 (0.5–0.69) |
national | 4 | 0.78 (0.75–0.81) | 0.73 (0.7–0.76) | 0.86 (0.83–0.89) | – /0.62 (0.51–0.72) | – /0.58 (0.49–0.67) | – /0.68 (0.56–0.8) | ||
official | 1 | ||||||||
AUS | 1.1 | global | 16 | 0.42 (0.34–0.49) | 0.34 (0.28–0.46) | 0.54 (0.46–0.69) | – /0.36 (0.28–0.43) | – /0.3 (0.24–0.41) | – /0.44 (0.39–0.52) |
national | 3 | 0.55 | |||||||
official | 2 | 0.52 (0.51–0.52) | |||||||
TUR | 1.1 | global | 18 | 0.44 (0.44–0.49) | 0.4 (0.34–0.43) | 0.6 (0.51–0.83) | – /0.44 (0.44–0.49) | – /0.4 (0.27–0.43) | – /0.94 (0.55–1) |
official | 1 | – /0.93 | |||||||
ZAF | 1.1 | global | 26 | 0.49 (0.35–0.62) | 0.36 (0.23–0.56) | 0.64 (0.45–0.85) | – /0.4 (0.27–0.55) | – /0.35 (0.21–0.44) | 0.41/0.58 (0.39–0.65) |
official | 1 | – /0.52 (0.41–0.64) | |||||||
VNM | 0.92 | global | 2 | 0.61/0.77 | |||||
national | 4 | 0.36 | 0.28 | 0.32 (0.28–0.36)/0.36 | 0.26 (0.24–0.28)/0.28 | ||||
GBR | 0.86 | global | 4 | 0.37 | 0.33 (0.3–0.37) | – /0.37 | – /0.33 (0.3–0.37) | ||
FRA | 0.85 | global | 4 | 0.22 | 0.32 (0.24–0.4) | – /0.22 | – /0.32 (0.24–0.4) | ||
THA | 0.84 | global | 5 | 0.41 (0.41–0.41) | 0.44/0.47 | ||||
national | 3 | 0.43 | 0.4 | 0.58 | 0.35/0.36 | 0.32/0.34 | 0.43/0.46 | ||
ARG | 0.76 | global | 22 | 0.33 (0.17–0.52) | 0.2 (0.15–0.35) | 0.51 (0.33–0.75) | 0.25 (0.17–0.46)/0.25 | 0.21 (0.18–0.23)/0.15 (0.14–0.16) | 0.39 (0.32–0.69)/0.51 (0.33–0.52) |
national | 2 | 0.42 (0.41–0.43) | – /0.19 | ||||||
official | 2 | 0.4/0.52 | |||||||
KAZ | 0.71 | global | 3 | 0.45 | 0.28/0.32 | ||||
UKR | 0.52 | global | 2 | 0.42 (0.42–0.42) | – /0.54 | ||||
PHL | 0.48 | global | 3 | 0.24 | 0.082/ – | ||||
COL | 0.4 | global | 5 | 0.23 (0.23–0.23) | 0.26 (0.26–0.26)/0.29 (0.29–0.29) | ||||
ETH | 0.31 | global | 5 | 0.022 | 0.23 (0.19–0.27) | – /0.023 | 0.16 (0.15–0.16)/ – | ||
MAR | 0.21 | global | 5 | 0.11 (0.087–0.13) | 0.13 (0.1–0.15)/0.13 (0.1–0.15) | ||||
KEN | 0.18 | global | 5 | 0.022 | 0.13 (0.11–0.14) | – /0.023 | 0.11 (0.11–0.11)/ – | ||
SWE | 0.13 | global | 4 | –0.012 | 0.03 (0.029–0.031) | – /–0.012 | – /0.03 (0.028–0.032) | ||
PRT | 0.12 | global | 2 | 0.045 | 0.036 | – /0.045 | – /0.036 | ||
national | 1 | – /0.023 | |||||||
CHE | 0.094 | global | 1 | – /0.026 | |||||
national | 1 | 0.027 | 0.025 | ||||||
MDG | 0.065 | global | 1 | 0.033/ – | |||||
national | 3 | 0.071 | 0.0059 | 0.07 (0.068–0.071)/ – | 0.0043 (0.0026–0.0059)/ – | ||||
Notes: aCountries are abbreviated by their ISO 3166-1 alpha-3 letter codes. EU denotes the European Union. b2018 Share of global Kyoto GHG emissions, excluding FOLU emissions, based on 2019 GHG emissions from Chapter 2 (Minx et al. 2021; Crippa et al. 2021). cType distinguishes between independent globally comprehensive studies (that also provide information at the country/region level), independent national studies and official communications via Biennial Reports, Biennial Update Reports or National Communications. dDifferent estimates from one study (e.g., data from multiple models or minimum and maximum estimates) are counted individually, if available. eGHG emissions expressed in CO2-eq emission using AR6 100-year GWPs (see Section 2.2.2 for a discussion of implications for historical emissions). GHG emissions from scenario data is recalculated from individual emission species using AR6 100-year GWPs. GHG emissions from studies that do provide aggregate GHG emissions using other GWPs are rescaled using 2019 GHG emissions from Chapter 2 (Minx et al. 2021; Crippa et al. 2021). f If more than one value is available, a median is provided and the full range of estimates (in parenthesis). To avoid a bias due to multiple estimates provided by the same model, only one estimate per model, typically the most recent update, is included in the median estimate. In the full range, multiple estimates from the same model might be included, in case these reflect specific sensitivity analyses of the ‘central estimate’ (e.g., Baumstark et al. 2021; Rogelj et al. 2017). gNote that AFOLU emissions from national GHG inventories and global/national land use models are generally different due to different approaches to estimate the anthropogenic CO2 sink (Grassi et al. 2018, 2021) (Section 7.2.3 and Cross-Chapter Box 6 in Chapter 7). hThe estimates for USA are based on the first NDC submitted prior to the withdrawal from the Paris Agreement, but not including the updated NDC submitted following its re-entry. iThe EU estimates are based on the 28 member states up until 31 January 2020, i.e., including UK.
4.2.2.3Projected Emissions Under NDCs and Current Policies by 2025/2030
The emissions projections presented in this section relate to the first NDCs, as communicated in 2015 and 2016, and on which an extensive literature exists. New and updated NDCs, mostly submitted since the beginning of 2020, are dealt with in Section 4.2.2.5. Similarly, the implications of COVID-19 and the related government responses on emissions projections is specifically dealt with in Section 4.2.2.4.
Table 4.1 presents the evidence base for the assessment of projected emissions of original NDCs and current policies until 2030. It covers 31 countries and regions responsible for about 82% of global GHG emission (excluding FOLU CO2 emissions) and draws quantitative estimates from more than 40 studies (Table 4.SM.1 in the Supplementary Material to this chapter). The table allows comparing emission projections from national and globally comprehensive studies as well as official communications by countries to the UNFCCC at the national/regional level. The global aggregates presented in Table 4.1 derive from globally comprehensive studies only and are not the result of aggregating country projections up to the global level. As different studies report different emission indicators, the table includes four different indicators: CO2 and GHG emissions, including or excluding AFOLU emissions. Where possible, multiple indicators are included per study.
Globally comprehensive studies
The UNFCCC Secretariat has assessed the aggregate effect of NDCs multiple times. The first report considered the intended NDCs in relation to 2°C (UNFCCC 2015b), whereas the second considered NDCs also in relation to 1.5°C (UNFCCC 2016b). New submissions and updates of NDCs in 2020/21 are assessed in Section 4.2.2.5. A number of globally comprehensive studies (den Elzen et al. 2016; Luderer et al. 2016; Rogelj et al. 2016, 2017; Vandyck et al. 2016; Rose et al. 2017; Baumstark et al. 2021) which estimate aggregate emissions outcomes of NDCs and current policies have previously been assessed in Cross-Chapter-Box 11 of IPCC SR1.5.
According to the assessment in this report, studies projecting emissions of current policies based on pre-COVID assumptions lead to median global GHG emissions of 60 GtCO2-eq with a full range of 54–68 by 2030 and original unconditional and conditional NDCs submitted in 2015/16 to 57 (49–63) and 54 (50–60) GtCO2-eq, respectively (robust evidence, medium agreement) (Table 4.1). Globally comprehensive and national-level studies project emissions of current policies and NDCs to 2025 and 2030 and, in general, are in good agreement about projected emissions at the country level.
These estimates are close to the ones provided by the IPCC SR1.5, Cross-Chapter-Box 11, and the UNEP emissions gap report (UNEP 2020a). 3
National studies
A large body of literature on national and regional emissions projections, including official communications of as part of the NDC submissions and independent studies exist. A subset of this literature provides quantitative estimates for the 2030 timeframe. As highlighted in Section 4.2.1, the number of independent studies varies considerably across countries with an emphasis on the largest emitting countries. This is reflected in Table 4.1 (see also Table 4.SM.1). Despite smaller differences between globally comprehensive and national studies for a few countries, there is generally good agreement between the different types of studies, providing evidence that these quantitative estimates are fairly robust.
Sectoral studies
Sectoral studies are essential to understand the contributions of concrete measures of NDCs and current policies. For example, approximately 98% of NDCs include the energy sector in their mitigation contributions, of which nearly 50% include a specific target for the share of renewables, and about 5% aim at increasing nuclear energy production (Stephan et al. 2016). Transport is covered explicitly in 75% of NDCs, although specific targets for the sector exist in only 21% of NDCs (PPMC and SLoCaT 2016). Measures or targets for buildings are referred to explicitly in 27% of NDCs (GIZ 2017). Additionally, 36% of NDCs include targets or actions that are specific to the agriculture sector (FAO 2016). LULUCF (mitigation) is included in 80% of all submitted NDCs, while 59% include adaptation and 29% refer to REDD+.
Greater sectoral expertise and involvement will be critical to accomplishing development and climate goals due to enhanced availability of information and expertise on specific sectoral options, greater ease of aligning the NDCs with sectoral strategies, and greater awareness among sector-level decision-makers and stakeholders (Fekete et al. 2015; NDC Partnership 2017). Sector-specific studies are assessed in the sectoral Chapters (6 to 11) of this report.
4.2.2.4Estimated Impact of COVID-19 and Governmental Responses on Emissions Projections
The impacts of COVID-19 and national governments’ economic recovery measures on current (Section 2.2.2) and projected emissions of individual countries and globally under current policies scenarios until 2030 may be significant, although estimates are highly uncertain and vary across the few available studies. The analyses published to date (October 2021) are based on limited information about how COVID-19 has affected the economy and hence GHG emissions across countries so far in 2020, and also based on assumptions about COVID-19’s longer term impact. Moreover, the comparison of pre- and post-COVID-19 projections captures the impact of COVID-19 as well as other factors such as the consideration of recently adopted policies not related to COVID-19, and methodological changes.
Across different studies (Kikstra et al. 2021; IEA 2020; Dafnomilis et al. 2021; Pollitt et al. 2021; UNEP 2020a; Climate Action Tracker 2020; Keramidas et al. 2021; Dafnomilis et al. 2020), the impact of the general slowdown of the economy due to the COVID-19 pandemic and its associated policy responses would lead to a reduced estimate of global GHG emissions in 2030 of about 1 to 5 GtCO2-eq, equivalent to 1.5–8.5%, compared to the pre-COVID-19 estimates (Table 4.SM.2). Nascimento et al. (2021) analyse the impacts of COVID-19 on current policy emission projections for 26 countries and regions and find a large range of emission reduction – between –1% and –21% – across these.
As indicated by a growing number of studies at the national and global level, how large near- to mid-term emissions implications of the COVID-19 pandemic are to a large degree depends on how stimulus or recovery packages are designed (Forster et al. 2020; Gillingham et al. 2020; IEA 2020; Le Quéré et al. 2020; Malliet et al. 2020; Wang et al. 2020; Obergassel et al. 2021; Pollitt et al. 2021; UNEP 2020a).
Four studies (Climate Action Tracker 2021; den Elzen et al. 2021; JRC 2021; Riahi et al. 2021) provide an update of the current policies assessment presented in Section 4.2.2.3 by taking into account the effects of COVID-19 as well as potential updates of policies. The resulting GHG emissions in 2030 are estimated to be 57 GtCO2-eq with a full range of 52 to 60 GtCO2-eq (Table 4.2). This is a reduction of about 3 GtCO2-eq or 5% compared to the pre-COVID estimates from Section4.2.2.3.
Table 4.2 | Projected global GHG emissions of current policies by 2030.
Study | Cut-off date | Kyoto GHGs a[GtCO2-eq] median (min–max)b | References |
Climate Action Tracker | 8/2020 | 54 (52–56) | |
PBL | 11/2020 | 58 | |
JRC – GECO | 12/2019 | 57 | |
ENGAGEc | 7/2019 | 57 (52–60) | |
Total d | 57 (52–60) |
Notes: aGHG emissions expressed in CO2-eq emission using AR6 100-year GWPs. GHG emissions from studies that provide aggregate GHG emissions using other GWPs are rescaled using 2019 GHG emissions from Chapter 2 (Minx et al. 2021; Crippa et al. 2021). bIf a range is available from a study, a median is provided in addition to the range. cRange includes estimates from four models: GEM-E3, MESSAGEix-GLOBIOM, POLES, REMIND-MAgPIE, based on sensitivity analysis. dTo avoid a bias due to multiple estimates provided by the same model, only one estimate per model, typically the most recent update, is included in the median estimate for the total.
4.2.2.5Estimated Impact of New and Updated NDCs on Emissions Projections
The number of studies estimating the emissions implications of new and updated NDCs and announced mitigation pledges that can be used for the quantitative assessment is limited to four (Table 4.3) (Climate Action Tracker 2021; den Elzen et al. 2021; Meinshausen et al. 2021; JRC 2021). One other study includes a limited number of NDC updates (Riahi et al. 2021) and another (UNFCCC 2021) excludes LULUCF emissions. They are therefore not directly comparable to the other two. In addition, the UNEP Emissions Gap Report 2021 (UNEP 2021) in itself is assessment of almost the same studies included here. The evidence base for the updated NDC assessment is thus considerably smaller compared to that of the assessment of emissions implications of original NDCs presented in Section 4.2.2.3. However, it is worthwhile to note that the earlier versions of the studies summarised in Table 4.2 and Table 4.3 are broadly representative for the emissions range implied by the pre-COVID-19 current policies and original NDCs of the full set of studies shown in Table 4.1, therefore building confidence in estimates.
An additional challenge lies in the fact that these studies do not all apply the same cut-off date for NDC updates, potentially leading to larger systematic deviations in the resulting emission estimates. Another complication is the fact that publicly announced mitigation pledges on global 2030 emissions that have not been officially submitted to the UNFCCC NDC registry yet, have been included in several of the studies to anticipate their impact on emission levels (see notes toTable 4.3). In addition to the updates of NDC targets, most of the new studies also include impacts of COVID-19 on future emission levels (as discussed in Section4.2.2.4) which may have led to considerable downward revisions of emission trends unrelated to NDCs. Table 4.3 presents the emission estimates of the four studies that form the basis of the quantitative assessment presented here and three other studies to compare with.
Comparing the emission levels implied by the new and updated NDCs as shown in Table 4.3 with those estimated by the original NDCs from the same studies (as included in Table 4.1), a downward revision of 3.8 (3.0–5.3) GtCO2-eq of the central unconditional NDC estimates and of 4.5 (2.7–6.3) GtCO2-eq of the central conditional NDC estimate emerges (medium evidence, medium agreement). The emissions gaps between temperature limits and new and updated NDCs are assessed in Cross-Chapter Box 4 below. New and updated unconditional NDCs reduce the median gap with emissions pathways that limit warming to 2°C (>67%) in 2030 by slightly more than 20%, from a median gap of 17 GtCO2-eq (9–23) to 13 (10–16). New and updated conditional NDCs reduce the median gap with emissions pathways that limt warming to 2°C (>67%) in 2030 by about one third, from 14 GtCO2-eq (10–20) to 9 (6–14). New and updated unconditional NDCs reduce the median gap with emissions pathways that limit warming to 1.5°C (>50%) with no or limited overshoot in 2030 by about 15%, from a median gap of 27 GtCO2-eq (19–32) to 22 GtCO2-eq (19–26). New and updated conditional NDCs reduce the median gap with emissions pathways that limit warming to 1.5°C (>50%) with no or limited overshoot in 2030 by about 20%, from a median gap of 24 GtCO2-eq (20–29) to 19 GtCO2-eq (16–23). Box 4.1 discusses the adaptation gap.
Globally, the implementation gap between projected emissions of current policies and the unconditional and conditional new and updated NDCs is estimated to be around 4 and 7 GtCO2-eq in 2030, respectively (medium evidence, medium agreement) (Tables 4.2 and 4.3), with many countries requiring additional policies and associated climate action to meet their mitigation targets as specified under the NDCs (limited evidence) (Section 4.2.2.6). It should be noted that the implementation gap varies considerably across countries, with some having policies in place estimated to be sufficient to achieve the emission targets their NDCs, some where additional policies may be required to be sufficient, as well as differences between the policies in place and action on the ground.
Table 4.3 | Projected global GHG emissions of new and updated NDCs by 2030.
Study | Cut-off date | Kyoto GHGs a[GtCO2-eq] | References | |||
Historical | Median (min–max)b2030 | |||||
2015 | 2019 | Unconditional NDCs | Conditional NDCs | |||
Climate Action Tracker c | 5/2021 | 51 | 52 | 50 | 47 | |
PBLd | 9/2021 | 52 | 54 | 53 (51–55) | 52 (49–53) | |
JRC – GECOe | 10/2021 | 51 | 48 | |||
Meinshausen et al. f | 10/2021 | 54 | 56 | 55 (54–57) | 53 (52–55) | |
Total g | 53 (50–57) | 50 (47–55) | ||||
Other studies for comparison | ||||||
UNEP EGRh | 9/2021 | 53 (50–55) | 50 (47–53) | |||
UNFCCC Secretariat i | 7/2021 | 57 (55–58) | 54 (52–56) | |||
ENGAGEj | 3/2021 | 51 (49–53) | ||||
Notes: aGHG emissions expressed in CO2-eq emission using AR6 100-year GWPs. GHG emissions from studies that provide aggregate GHG emissions using other GWPs are rescaled using 2019 GHG emissions from Chapter 2 (Minx et al. 2021; Crippa et al. 2021). Note that due to slightly different system boundaries across historical emission datasets as well as data uncertainties (Chapter 2, SM2.2) relative change compared to historical emissions should be calculated vis-à-vis the historical emissions data used by a particular study. bIf a range is available from a study, a median is provided in addition to the range. cAnnounced mitigation pledges on global 2030 emissions of China and Japan included. dAnnounced mitigation pledges of China, Japan, Republic of Korea included. eAnnounced mitigation pledge of Korea not included. f Announced mitigation pledges of China and Republic of Korea not included, emissions from international aviation and shipping not included. gRanges across four studies are calculated using the median and the full range including the minimum and maximum of studies if available. hUNEP EGR 2021 estimate listed for comparison, but since largely relying on the same studies not included in range estimate. iNDCs submitted until 30 July included, announcements not included, excluding LULUCF emissions. jNDC updates of Brazil, EU and announcement of China included as a sensitivity analysis compared to original NDCs.
4.2.2.6Tracking Progress in Implementing and Achieving NDCs
Under the Enhanced Transparency Framework, countries will transition from reporting biennial reports (BRs) and biennial update reports (BURs) to reporting biennial transparency reports (BTRs) starting, at the latest, by December 2024. Each Party will be required to report information necessary to track progress made in implementing and achieving its NDC under the Paris Agreement (UNFCCC 2018b). Thus, no official data exists yet on tracking progress of individual NDCs.
Meanwhile, there is some literature at global and national level that aims at assessing whether countries are on track or progressing towards implementing their NDCs and to which degree the NDCs collectively are sufficient to reach the temperature targets of the Paris agreement (Rogelj et al. 2016; Quéré et al. 2018; Höhne et al. 2018; Roelfsema et al. 2020; den Elzen et al. 2019; Höhne et al. 2020). Most of these studies focus on major emitters such as G20 countries and with the aim to inform countries to strengthen their ambition regularly, for example, through progress of NDCs and as part of the global stocktake (Höhne et al. 2018; Peters et al. 2017). However, a limited number of studies assess the implementation gaps of conditional NDCs in terms of finance, technology and capacity building support. Some authors conclude that finance needed to fulfil conditional NDCs exceeds available resources or the current long-term goal for finance (USD100 billion yr –1) (Pauw et al. 2019); others assess financial resources needed for forest-related activities (Kissinger et al. 2019) (Section 15.4.2). The literature suggests that consistent and harmonised approach to track progress of countries towards their NDCs would be helpful (Peters et al. 2017; Höhne et al. 2018; den Elzen et al. 2019), and negotiations on a common tabular format are expected to conclude during COP26 in November 2021.
With an implementation gap in 2030 of 4 to 7 GtCO2-eq (Section 4.2.2.5), many countries will need to implement additional policies to meet their self-determined mitigation targets as specified under the NDCs. Studies that assess the level of projected emissions under current policies indicate that new policies (that have been implemented since the first assessment of the NDCs in 2015 and are thus covered in more recent projections) have reduced projections, by about two GtCO2-eq since the adoption of the Paris Agreement in 2015 to 2019 (Climate Action Tracker 2019; UNEP 2020a; den Elzen et al. 2019).
4.2.2.7Literature on Fairness and Ambition of NDCs
Most countries provided information on how they consider their NDCs to be fair and ambitious in the NDCs submitted to UNFCCC and many of these NDCs refer to specific national circumstances such as social, economic and geographical factors when outlining why they are fair and ambitious. Further, several Parties provided information on specific criteria for evaluating fairness and ambition, including criteria relating to: responsibility and capability; share of emissions; development and/or technological capacity; mitigation potential; cost of mitigation actions; the degree of progression or stretching beyond the current level of effort; and the link to objectives and global goals (UNFCCC 2016a).
According to its Article 2.2, the Paris Agreement will be implemented to reflect equity and the principle of common but differentiated responsibilities and respective capabilities, in the light of different national circumstances, the latter clause being new, added to the UNFCCC principle (Voigt and Ferreira 2016; Rajamani 2017). Possible different interpretations of equity principles lead to different assessment frameworks (Lahn and Sundqvist 2017; Lahn 2018).
Various assessment frameworks have been proposed to analyse fair share ranges for NDCs. The literature on equity frameworks including quantification of national emissions allocation is assessed in section 4.5 (Sections 13.4.2, 14.3.2 and 14.5.3). Recent literature has assessed equity, analysing how fairness is expressed in NDCs in a bottom-up manner (Mbeva and Pauw 2016; Cunliffe et al. 2019; Winkler et al. 2018). Some studies compare NDC ambition level with different effort sharing regimes and which principles are applied to various countries and regions (Peters et al. 2015; Pan et al. 2017; Robiou Du Pont et al. 2017; Holz et al. 2018; Robiou du Pont and Meinshausen 2018; van den Berg et al. 2019). Others propose multi-dimensional evaluation schemes for NDCs that combine a range of indicators, including the NDC targets, cost-effectiveness compared to global models, recent trends and policy implementation into consideration (Aldy et al. 2017; Höhne et al. 2018). Yet other literature evaluates NDC ambition against factors such as technological progress of energy efficiency and low-carbon technologies (Jiang et al. 2017; Kuramochi et al. 2017; Wakiyama and Kuramochi 2017), synergies with adaptation plans (Fridahl and Johansson 2017), the obligations to deploy carbon dioxide removal technologies like bioenergy with carbon capture and storage (BECCS) in the future implied by their near-term emission reductions where they are not reflected on in the first NDCs (Peters and Geden 2017; Fyson et al. 2020; Pozo et al. 2020; Mace et al. 2021). Others identify possible risks of unfairness when applying GWP* as emissions metric at national scale (Rogelj and Schleussner 2019). A recent study on national fair shares draws on principles of international environmental law, excludes approaches based on cost and grandfathering, thus narrowing the range of national fair shares previously assessed, and apply this to the quantification of national fair share emissions targets (Rajamani et al. 2021).
4.2.2.8Uncertainty in Estimates
There are many factors that influence the global aggregated effects of NDCs. There is limited literature on systematically analysing the impact of uncertainties on the NDC projections with some exception (Rogelj et al. 2017; Benveniste et al. 2018). The UNEP Gap Report (UNEP 2017a) discusses uncertainties of NDC estimates in some detail. The main factors include variations in overall socio-economic development; uncertainties in GHG inventories; conditionality; targets with ranges or for single years; accounting of biomass; and different GHG aggregation metrics (e.g., GWP values from different IPCC assessments). In addition, when mitigation effort in NDCs is described as measures that do only indirectly translate into emission reductions, assumptions necessary for the translation come into play (Doelle 2019). For a more elaborate discussion of uncertainties in NDCs (Section 14.3.2).
Some studies assume successful implementation of all of the NDCs’ proposed measures, sometimes including varying assumptions to account for some of the NDC features which are subject to assumed conditions related to finance and technology transfer. Countries ‘shall pursue domestic mitigation measures’ under Article 4.2 of the Paris Agreement (UNFCCC 2015a), but they are not legally bound to the result of reducing emissions (Winkler 2017a). Some authors consider this to be a lack of a strong guarantee that mitigation targets in NDCs will be implemented (Nemet et al. 2017). Others point to growing extent of national legislation to provide a legal basis for action (Iacobuta et al. 2018) (Section 13.2). These factors together with incomplete information in NDCs mean there is uncertainty about the estimates of anticipated 2030 emission levels.
The aggregation of targets results in large uncertainty (Rogelj et al. 2017; Benveniste et al. 2018). In particular, clarity on the contributions from the land use sector to NDCs is needed ‘to prevent high LULUCF uncertainties from undermining the strength and clarity of mitigation in other sectors’ (Fyson and Jeffery 2019). Methodological differences in the accounting of the LULUCF anthropogenic CO2 sink between scientific studies and national GHG inventories (as submitted to UNFCCC) further complicate the comparison and aggregation of emissions of NDC implementation (Grassi et al. 2018, 2021) (Section 7.2.3 and Cross-Chapter Box 6 in Chapter 7). This uncertainty could be reduced with clearer guidelines for compiling future NDCs, in particular when it comes to mitigation efforts not expressed as absolute economy-wide targets (Doelle 2019), and explicit specification of technical details, including energy accounting methods, harmonised emission inventories (Rogelj et al. 2017) and finally, increased transparency and comparability (Pauw et al. 2018).
Cross-Chapter Box 4 | Comparison of NDCs and current policies with the 2030 GHG Emissions from Long-term Temperature Pathways
Authors: Edward Byers (Austria/Ireland), Michel den Elzen (the Netherlands), Céline Guivarch (France), Volker Krey (Germany/Austria), Elmar Kriegler (Germany), Franck Lecocq (France), Keywan Riahi (Austria), Harald Winkler (South Africa)
Introduction
The Paris Agreement (PA) sets a long-term goal of holding the increase of global average temperature to ‘well below 2°C above pre-industrial levels’ and pursuing efforts to limit the temperature increase to 1.5°C above pre-industrial levels. This is underpinned by the ‘aim to reach global peaking of greenhouse gas emissions as soon as possible’ and ‘achieve a balance between anthropogenic emissions by sources and removals by sinks of GHG in the second half of this century’ (UNFCCC 2015a). The PA adopts a bottom-up approach in which countries determine their contribution to reach the PA’s long-term goal. These national targets, plans and measures are called ‘nationally determined contributions’ or NDCs.

Cross-Chapter Box 4, Figure 1: Global GHG emissions of modelled pathways (funnels in Panel a, and associated bars in Panels b, c, d) and projected emission outcomes from near-term policy assessments for2030 (Panel b).
Panel a shows global GHG emissions over 2015–2050 for four types of assessed modelled global pathways:
–Trend from implemented policies: Pathways with projected near-term GHG emissions in line with policies implemented until the end of 2020 and extended with comparable ambition levels beyond 2030 (29 scenarios across categories C5–C7, Table SPM.2).
–Limit to 2°C (>67%) or return warming to 1.5°C (>50%) after a high overshoot, NDCs until 2030: Pathways with GHG emissions until 2030 associated with the implementation of NDCs announced prior to COP26, followed by accelerated emissions reductions likely to limit warming to 2°C (C3b, Table SPM.2) or to return warming to 1.5°C with a probability of 50% or greater after high overshoot (subset of 42 scenarios from C2, Table SPM.2).
–Limit to 2°C (>67%) with immediate action: Pathways that limit warming to 2°C (>67%) with immediate action after 2020 (C3a, Table SPM.2).
–Limit to 1.5°C (>50%) with no or limited overshoot: Pathways limiting warming to 1.5°C with no or limited overshoot (C1, Table SPM.2 C1). All these pathways assume immediate action after 2020.
Past GHG emissions for 2010–2015 used to project global warming outcomes of the modelled pathways are shown by a black line 4 and past global GHG emissions in 2015 and 2019 as assessed in Chapter 2 are shown by whiskers.
Panels b, c and d show snapshots of the GHG emission ranges of the modelled pathways in 2030, 2050, and 2100, respectively. Panel b also shows projected emissions outcomes from near-term policy assessments in 2030 from Chapter 4.2 (Tables 4.2 and 4.3; median and full range). GHG emissions are in CO2-equivalent using GWP100 from AR6 WGI. {3.5, 4.2, Table 4.2, Table 4.3, Cross-Chapter Box 4 in Chapter 4}
The NDCs are a central instrument of the PA to achieve its long-term goal. It thus combines a global goal with a country-driven (bottom-up) instrument to a hybrid climate policy architecture to strengthen the global response to climate change. All signatory countries committed to communicating nationally determined contributions including mitigation targets, every five years. While the NDCs mostly state targets, countries are also obliged to pursue domestic mitigation measures to achieve the objectives. The literature examines the emissions outcome of the range of policies implemented to reach these targets.
Emissions gap
A comparison between the projected emission outcomes of current policies, the NDCs (which include unconditional and conditional elements, Section 4.2.1) and mitigation pathways acting immediately, i.e. from 2020 onwards, on reaching different temperature goals in the long-term (Section 3.3.3) allows identifying different ‘emission gaps’ in 2030 (Cross-Chapter Box 4, Figure 1). First, the implementation gap between ‘current policies’ and unconditional and conditional NDCs is estimated to be around 4 and 7 GtCO2-eq in 2030, respectively (Section 4.2.2 and Tables 4.2 and 4.3). Second, the comparison of unconditional (conditional) NDCs and long-term mitigation pathways that limit warming to 2°C (>67%) or lower gives rise to a 2030 median emissions gap of 19–26 GtCO2-eq (16–23 GtCO2-eq) for limiting end-of-century warming to 1.5°C (>50%) with no or limited overshoot and 10–16 GtCO2-eq (6–14 GtCO2-eq) for limiting warming to 2°C (>67%). 5 GHG emissions of NDCs are broadly consistent with 2030 emission levels of cost-effective long-term pathways staying below 2.5°C (scenarios category C5, Table 3.2, Chapter 3).
Other ‘gap indicators’
Beyond the quantification of different GHG emissions gaps, there is an emerging literature that identifies gaps between current policies, NDCs and long-term temperature in terms of other indicators, including for example the deployment of low-carbon energy sources, energy efficiency improvements, fossil fuel production levels or investments into mitigation measures (Roelfsema et al. 2020; McCollum et al. 2018; SEI et al. 2020).
A 2030 gap in the contribution of low-carbon energy sources to the energy mix in 2030 between current policies and cost-effective long-term temperature pathways is calculated to be around 7percentage-points (2°C) and 13percentage-points (1.5°C) by Roelfsema et al. (Roelfsema et al. 2020). The same authors estimate an energy intensity improvement gap 10% and 18% for 2030 between current policies pathways and 2°C and 1.5°C pathways, respectively. SEI et al. (2020) estimates the ‘fossil fuel production gap’, by which they mean ‘the level of countries’ planned fossil fuel production expressed in their carbon content to be 120% and 50% higher compared to the fossil fuel production consistent with 1.5°C and 2°C pathways, respectively, as assessed in IPCC SR1.5 (Rogelj et al. 2018a).
Cross-Chapter Box 4
The methodology used for this estimation is very similar to how emissions gaps are derived (SEI et al. 2019). The gap of global annual average investments in low-carbon energy and energy efficiency in 2030 between following current policy on the one hand and achieving the NDCs, the 2°C and 1.5°C targets on the other hand, is estimated to be approximately USD 130, 320, or 480 billion per year (McCollum et al. 2018).
It is important to note that such comparisons are less straight forward as the link between long-term temperature goals and these indicators is less pronounced compared to the emission levels themselves; they are therefore associated with greater uncertainty compared to the emissions gap.
Box 4.1 | Adaptation gap and NDCs
NDCs have been an important driver of national adaptation planning, with cascading effects on sectors and sub-national action, especially in developing countries. Yet, only 40 developing countries have quantifiable adaptation targets in their current NDCs; 49 countries include quantifiable targets in their national legislation (UNEP 2018a).
Working Group II contribution to this Assessment finds that the overall extent of adaptation-related responses in human systems is low ( high confidence) and that there is limited evidence on the extent to which adaptation-related responses in human systems are reducing climate risk (O’Neill et al. 2020). Thus there is an adaptation gap (UNEP 2018a), and bridging that gap requires enablers including institutional capacity, planning and investment (UNEP 2016). Estimates of adaptation costs vary greatly across studies. Recent studies based on climate change under RCP8.5 report adaptation costs for developing countries of up to 400 billion (300 billion in RCP2.6) USD2005 in 2030 (New et al. 2020). Of the NDCs submitted in 2015, 50 countries estimated adaptation costs of USD39 billion annually. Both public and private finance for adaptation is increasing, but remains insufficient and constitutes a small fraction (4–8%) of total climate finance which is mostly aimed at mitigation. The pledge of developed countries of mobilising finance for developing countries to address adaptation needs globally as part of the Paris Agreement are insufficient. By 2030 the adaptation needs are expected to be three to six times larger than what is pledged, further increasing towards 2050 (UNEP 2016; New et al. 2020).
4.2.3Mitigation Efforts in Sub-national and Non-state Action Plans and Policies
The decision adopting the Paris Agreement stresses the importance of ‘stronger and more ambitious climate action’ by non-government and sub-national stakeholders, ‘including civil society, the private sector, financial institutions, cities and other sub-national authorities, local communities and indigenous peoples’ (UNFCCC 2015a). The Marrakech Partnership for Global Action, launched in the 2016 UNFCCC Conference of Parties by two ‘high-level champions,’ further formalised the contributions of non-government and sub-national actors taking action through seven thematic areas (e.g., energy, human settlements, industry, land-use, etc.) and one cross-cutting area (resilience). Since then, non-state actors, for example, companies and civil society, and sub-national actors, such as cities and regions, have emerged to undertake a range of largely voluntary carbon mitigation actions (Hsu et al. 2018, 2019) both as individual non-state actors (NSAs in the following) and through national and international cooperative initiatives, or ICIs (Hsu et al. 2018). ICIs take a variety of forms, ranging from those that focus solely on non-state actors to those that engage national and even local governments. They can also range in commitment level, from primarily membership-based initiatives that do not require specific actions to those that require members to tackle emissions reductions in specific sectors or aim for transformational change.
Quantification of the (potential) impact of these actions is still limited. Almost all studies estimate the potential impact of the implementation of actions by NSAs and ICIs, but do not factor in that they may not reach their targets. The main reason for this is that there is very limited data currently available from individual actors (e.g., annual GHG inventory reports) and initiatives to assess their progress towards their targets. A few studies have attempted to assess progress of initiatives by looking into the initiatives’ production of relevant outputs (Chan et al. 2018). Quantification does not yet cover all commitments and only a selected number of ICIs are analysed in the existing literature. Most of these studies exclude commitments that are not (self-)identified as related to climate change mitigation, those that are not connected to international networks, or those that are communicating in languages other than English.
Non state action could make significant contributions to achieving the Paris climate goals (limited evidence, high agreement). However, efforts to measure the extent to which non-state and sub-national actors go beyond national policy are still nascent (Hsu et al. 2019; Kuramochi et al. 2020) and we do not fully understand the extent to which ambitious action by non-state actors is additional to what national governments intend to do. Sub-national and non-state climate action may also have benefits in reinforcing, implementing, or piloting national policy, in place of or in addition to achieving additional emissions reductions (Broekhoff et al. 2015; Heidrich et al. 2016; Hsu et al. 2017).
Quantification of commitments by individual NSAs are limited to date. Attempts to quantify aggregate effects in 2030 of commitments by individual non-state and sub-national actors are reported by (Hsu et al. 2019; Kuramochi et al. 2020). Kuramochi et al. (2020) estimate potential mitigation by more than 1,600 companies, around 6,000 cities and many regions (cities assessed have a collective population of 579 million, and regions 514 million). Individual commitments by these sub-national regions, cities and companies could reduce GHG emissions in 2030 by 1.2 to 2.0 GtCO2-eq yr –1 compared to current national policies scenario projections, reducing projected emissions by 3.8–5.5% in 2030, if commitments are fully implemented and do not lead to weaker mitigation actions by others (Figure 4.1 left). In several countries, NSA commitments could potentially help meet or exceed national mitigation targets.
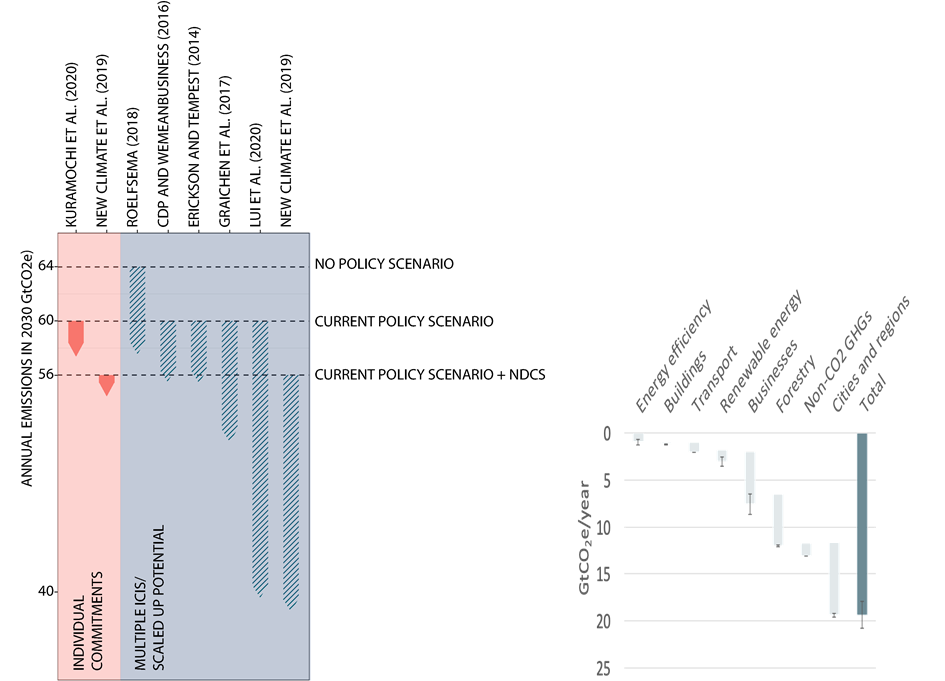
Figure 4.1 | Emissions reduction potential for non-state and sub-national actors by 2030. Source: data in left panel from Hsu et al. (2020), right panel from Lui et al. (2020).
Quantification of potential emission reductions from international cooperative initiatives have been assessed in several studies, and recently synthesised (Hsu et al. 2020; Lui et al. 2021), with some initiatives reporting high potential. In Table 4.4 and Figure 4.1, we report estimates of the emissions reductions from 19 distinct sub-national and non-state initiatives to mitigate climate change. The table shows wide ranges of potential mitigation based on current, target or potential membership, as well as a wide diversity of actors and membership assumptions. Current membership reflects the number of non-state or sub-national actors that are presently committed to a particular initiative; while targeted or potential membership represents a membership goal (e.g., increasing from 100 to 200 members) that an initiative may seek to achieve (Kuramochi et al. 2020). When adding up emission reduction potentials, sub-national and non-state international cooperative initiatives could reduce up to about 20 Gt of CO2-eq in 2030 (limited evidence, medium agreement). Chapter 8 also presents data on the savings potential of cities and it suggests that these could reach 2.3 GtCO2-eq annually by 2030 and 4.2 GtCO2-eq annually for 2050.
Non-state action may be broader than assessed in the literature so far, though subject to uncertainty. The examples in Table 4.4 and Figure 4.1 do not include initiatives that target the emissions from religious organisations, colleges and universities, civic and cultural groups, and, to some extent, households, and in this sense may underestimate sub-national potential for mitigating emissions, rather than overestimate it. That said, the estimates are contingent on assumptions that sub-national and non-state actors achieve commitments – both with respect to mitigation and in some cases membership – and that these actions are not accounted for in nor lead to weakening of national actions.
Care is to be taken not to depict these efforts as additional to action within national NDCs, unless this is clearly established (Broekhoff et al. 2015). There are potential overlaps between individual NSAs and ICIs, and across ICIs. Kuramochi et al. (2020) propose partial and conservative partial effect methods to avoid double counting when comparing ambition, a matter that merits further attention. As the diversity of actions increased, the potential to count the same reductions multiple times increases.
Equally important to note here is that none of the studies reviewed in Figure 4.1 quantified the potential impact of financial sector actions, for example, divestment from emission intensive activities (Section 15.3 has a more detailed discussion of how financial actors and instruments are addressing climate change). Moreover, only a limited number of studies on the impact of actions by diverse actors go beyond 2050 (Table 4.4), which may reflect analysts’ recognition of the increasing uncertainties of longer time horizons. Accurate accounting methods can help to avoiding counting finance multiple times, and methods across mitigation and finance would consider counting carbon market flows and the tons reduced. As Table 4.4 and Figure 4.1 indicate, activities by businesses have potential to significantly contribute to global mitigation efforts. For example, the SBTi (Science Based Targets initiative) encourages companies to pledge to reduce their emissions at rates which according to SBTi would be compatible with global pathways to well below 2°C or 1.5°C, with various methodologies being proposed (Andersen et al. 2021; Faria and Labutong 2019). Readers may note, however, that the link between emissions by individual actors and long-term temperature goals cannot be inferred without additional assumptions (Box 4.2). In the energy sector, some voluntary initiatives are also emerging to stop methane emissions associated with oil and gas supply chains. The Oil and Gas Methane Partnership (OGMP) is a voluntary initiative lead by the Climate and Clean Air Coalition, which has recently published a comprehensive framework for methane detection, measurement and reporting (UNEP 2020b).
Initiatives made up of cities and sub-national regions have an especially large potential to reduce emissions, due to their inclusion of many actors, across a range of different geographic regions, with ambitious emissions reduction targets, and these actors’ coverage of a large share of emissions (Kuramochi et al. 2020). Hsu et al. (2019) find largest potential in that area. Several sub-national regions like California and Scotland have set zero emission targets (Höhne et al. 2019), supported by short- and medium-term interim goals (Scottish Government 2020b; State of California 2018). Sharing of effort across global and sub-global scales has not been quantified, though one study suggests that non-state actors have increasingly adopted more diverse framings, including vulnerability, human rights and transformational framings of justice (Shawoo and McDermott 2020). Initiatives focused on forestry have high emissions reduction potential due to the current high deforestation rates, and due to the ambitious targets of many of these forestry initiatives, such as the New York Declaration on Forests’ goal to end deforestation by 2030 (Höhne et al. 2019; Lui et al. 2021), although the Initiative acknowledges that insufficient progress has to-date been made towards this goal (NYDF Assessment Partners 2020). On the other hand, uncertainties in global forest carbon emissions (and therefore potential reductions) are high and despite a multitude of initiatives in the sector, actually measured deforestation rates have not declined since the initiative was announced in 2014 (Sections 7.2 and 7.3.1). Moreover, not all initiatives are transparent about how they plan to reach their goals and may also rely on offsets.
Initiatives focused on non-CO2 emissions, and particularly on methane, can achieve sizable reductions, in the order of multiple GtCO2-eq yr –1 (Table 4.4). The Global Cement and Concrete Association (formerly the Cement Sustainability Initiative), has contributed to the development of consistent energy and emissions reporting from member companies. The CSI also suggested possible approaches to balance GHG mitigation and the issues of competitiveness and leakage (Cook and Ponssard 2011). The member companies of the GCCA (CSI) have become better prepared for future legislation on managing GHG emissions and developed management competence to respond to climate change compared to non-member companies in the cement sector (Busch et al. 2008; Global Cement and Concrete Association 2020). Accordingly, the cement industry has developed some roadmaps to reach net zero GHG around 2050 (Sanjuán et al. 2020).
It is also important to note that individual NSAs and ICIs that commit to GHG mitigation activities are often scarce in many crucial and ‘hard-to-abate’ sectors, such as iron and steel, cement and freight transport (Chapters 10 and 11). Sub-national and non-state action efforts could help these sectors meet an urgent need to accelerate the commercialisation and uptake of technical options to achieve low zero emissions (Bataille 2020).
Table 4.4 | Emissions reduction potential for sub-national and non-state international cooperative initiatives by 2030.
Sector | Leading actor | Name | Scale | Target(s) | 2030 emissions reduction potential compared to no policy, current policies or NDC baseline (GtCO2-eq yr –1) | Membership assumptions | |
Min | Max | ||||||
Energy efficiency | Intergovernmental (UNEP) | United for Efficiency (U4E) | Global (focus on developing countries) | Members to adopt policies for energy-efficient appliances and equipment | 0.6 | 1.25 | Current membership |
Energy efficiency | Intergovernmental | Super-efficient Equipment and Appliance Deployment (SEAD) Initiative | Global | Members to adopt current policy best practices for energy efficiency product standards | 0.5 | 1.7 (excl. China) | Current membership |
Buildings | Business | Architecture 2030 | Global (focus on North America) | New buildings and major renovations shall be designed to meet an energy consumption performance standard of 70% below the regional (or country) average/median for that building type and to go carbon-neutral in 2030 | 0.2 | 0.2 | Current membership |
Transport | Business (aviation sector) | Collaborative Climate Action Across the Air Transport World (CAATW) | Global | Two key objectives: (i) 2% annual fuel efficiency improvement through 2050, (ii) stabilise net carbon emissions from 2020 | 0.3 | 0.6 | Current membership |
Transport | Business | Lean and Green | Europe | Member companies to reduce CO2 emissions from logistics and freight activity by at least 25% over a five-year period | 0.02 | 0.02 | Current membership |
Transport | Hybrid | Global Fuel Economy Initiative (GFEI) | Global | Halve the fuel consumption of the LDV fleet in 2050 compared to 2005 | 0.5 | 1.0 | Current membership |
Transport | Business | Below50 LCTPi a | Global | Replace 10% of global transportation fossil fuel use with low-carbon transport fuels by 2030 | 0.5 | 0.5 | Scaled-up global potential |
Renewable energy | Business | European Technology & Innovation Platform Photovoltaic (ETIP PV) | Europe | Supply 20% of electricity from solar Photovoltaic PV technologies by 2030 | 0.2 | 0.5 | Current membership |
Renewable energy | Intergovernmental (African Union) | Africa Renewable Energy Initiative (AREI) | Africa | Produce 300 gigawatt (GW) of electricity for Africa by 2030 from clean, affordable and appropriate forms of energy | 0.3 | 0.8 | Current membership |
Renewable energy | Hybrid | Global Geothermal Alliance (GGA) | Global | Achieve a five-fold growth in the installed capacity for geothermal power generation and a more than two-fold growth in geothermal heating by 2030 | 0.2 | 0.5 | Targeted capacity |
Renewable energy | Business | REscale LCTPi a | Global | Support deployment of 1.5 TW of additional renewable energy capacity by 2025 in line with the IEA’s 2°C scenario | 5 | 5 | Scaled-up global potential |
Renewable energy | Business | RE100 initiative | Global | 2,000 companies commit to source 100% of their electricity from renewable sources by 2030 | 1.9 | 4 | Targeted membership |
Forestry | Hybrid | Bonn Challenge/Governors’ Climate and Forests Task Force (GCFTF)/New York Declaration on Forests (NYDF) | Global | End forest loss by 2030 in member countries and restore 150 million hectares of deforested and degraded lands by 2020 and an additional 200 million hectares by 2030 | 3.8 | 8.8 | Scaled-up global potential |
Non-CO2 emissions | Government | Climate & Clean Air Coalition (CCAC) | Global | Members to implement policies that will deliver substantial short-lived climate pollutants (SLCP) reductions in the near to medium-term (i.e., by 2030) for HFCs and methane | 1.4 | 3.8 | Current membership |
Non-CO2 emissions | Intergovernmental (World Bank) | Zero Routine Flaring | Global | Eliminate routine flaring no later than 2030 | 0.4 | 0.4 | Current membership |
Multisectoral | Cities and regions | Under2 Coalition | Global | Local governments (220 members) aim to limit their GHG emissions by 80 to 95% below 1990 levels by 2050 | 4.6 | 5 | Current membership |
Multisectoral | Cities and regions | Global Covenant of Mayors for Climate & Energy (GCoM) | Global | Member cities have a variety of targets (+9,000 members) | 1.4 | 1.4 | Current membership |
Multisectoral | Cities and regions | C40 Cities Climate Leadership Group (C40) | Global | 94 member cities have a variety of targets, aiming for 1.5°C compatibility by 2050. The network carries two explicit goals: (i) to have every C40 city develop a climate action plan before the end of 2020 (Deadline 2020), which is to ‘deliver action consistent with the objectives of the Paris Agreement’ and (ii) to have cities achieve emissions neutrality by 2050 | 1.5 | 3 | Current membership |
Agriculture | Business | Climate Smart Agriculture (CSA) LCTPi a | Global | Reducing agricultural and land-use change emissions from agriculture by at least 50% by 2030 and 65% by 2050. 24 companies and 15 partners | 3.7 | 3.7 | Scaled-up global potential |
Multisectoral | Business | Science Based Targets initiative (SBTi) | Global | By 2030, 2000 companies have adopted a science-based target in line with a 2°C temperature goal | 2.7 | 2.7 | Targeted membership |
Source: Hsu et al. (2020). Note aAs of December 2020 most of the Low Carbon Technology Partnerships (LCTPi) initiatives are defunct, except the Climate Smart Agriculture programme.
4.2.4Mid-century Low-emission Strategies at the National Level
An increasing amount of literature describes mitigation pathways for the mid-term (up to 2050). We assess literature reflecting on the UNFCCC process (Section 4.2.4.1), other official plans and strategies (Section 4.2.4.2) and academic literature on mid-century low-emission pathways at the national level (Section 4.2.4.3). After the Paris Agreement and the IPCC SR1.5 Report, the number of academic papers analysing domestic emission pathways compatible with the 1.5°C limit has been increasing. Governments have developed an increasing number of mitigation strategies up to 2050. Several among these strategies aim at net zero CO2 or net zero GHG, but it is not yet possible to draw global implications due to the limited size of sample (limited evidence, limited agreement).
Box 4.2| Direct Links Between an Individual Actor’s Mitigation Efforts in the Near Term and Global Temperature Goals in the Long Term Cannot be Inferred: Making direct links requires clear distinctions of spatial and temporal scales (Robertson 2021; Rogelj et al. 2021) and explicit treatment of ethical judgements made (Klinsky et al. 2017a; Holz et al. 2018; Klinsky and Winkler 2018 ; Rajamani et al. 2021)
The literature frequently refers to national mitigation pathways up to 2030 or 2050 using long-term temperature limits in the Paris Agreement (i.e., ‘2°C’ or ‘1.5°C scenario’). Without additional information, such denomination is incorrect. Working Group I reaffirmed ‘with high confidence the AR5 finding that there is a near-linear relationship between cumulative anthropogenic CO2 emissions and the global warming they cause’ (WGI SPM AR6). It is not the function of any single country’s mitigation efforts, nor any individual actor’s. Emission pathways of individual countries or sectors in the near to mid-term can only be linked to a long-term temperature with additional assumptions specifying (i) the GHG emissions and removals of other countries up the mid-term; and (ii) the GHG emissions and removals of all countries beyond the near and mid-term. For example, a national mitigation pathway can be labelled ‘2°C compatible’ if it derives from a global mitigation pathway consistent with 2°C via an explicit effort sharing scheme across countries (Sections 4.2.2.6 and 4.5).
4.2.4.1GHG Mitigation Target Under UNFCCC and Paris Agreement
The Paris Agreement requests that Parties should strive to formulate and communicate long-term low GHG development strategies by 2020. (Note that by ‘long-term’, the UNFCCC means 2050, which is the end point of the ‘mid-term’ horizon range in the present report.) As of August 25, 2021, 31 countries and the European Union had submitted low-emissions development strategies (LEDS) (Table 4.5).
By 2018, most long-term strategies targeted 80% emissions reduction in 2050 relative to a reference (1990, 2000 or 2005). After IPCC SR1.5 was published, the number of the countries aiming at net zero CO2 or GHG emissions has been increasing. 6
Table 4.5 | Countries having submitted long-term low-GHG emission development strategy (as of 25 August 2021).
Country | Date submitted | GHG reduction target |
USA | Nov. 16, 2016 | 80% reduction of GHG in 2050 compared to 2005 level |
Mexico | Nov. 16, 2016 | 50% reduction of GHG in 2050 compared to 2000 level |
Canada | Nov. 17, 2016 | 80% reduction of GHG in 2050 compared to 2005 level |
Germany | Nov. 17, 2016 Rev. Apr. 26, 2017 Rev. May 4, 2017 | GHG neutrality by 2050 (Old target: 80–95% reduction of GHG in 2050 compared to 1990 level) |
France | Dec. 28, 2016 Rev. Apr. 18, 2017 Rev. Feb. 8, 2021 | Achieving net zero GHG emissions by 2050 (Old target: 75% reduction of GHG in 2050 compared to 1990 level) |
Benin | Dec. 12, 2016 | Resilient to climate change and low-carbon intensity by 2025 |
Czech Republic | Jan. 15, 2018 | 80% reduction of GHG in 2050 compared to 1990 level |
UK | April 17, 2018 | 80% reduction of GHG in 2050 compared to 1990 level |
Ukraine | July 30, 2018 | 66–69% reduction of GHG in 2050 compared to 1990 level |
Republic of the Marshall Islands | Sept. 25, 2018 | Net zero GHG emissions by 2050 |
Fiji | Feb. 25, 2019 | Net zero carbon by 2050 as central goal, and net negative emissions in 2041 under a Very High Ambition scenario |
Japan | June 26, 2019 | 80% reduction of GHG in 2050, and decarbonised society as early as possible in the 2nd half of 21st century |
Portugal | Sept. 20, 2019 | Carbon neutrality by 2050 |
Costa Rica | Dec. 12, 2019 | Decarbonised economy with net zero emissions by 2050 |
European Union | March 6, 2020 | Net zero GHG emissions by 2050 |
Slovakia | March 30, 2020 | Climate neutrality by 2050, with decarbonisation targets implying reduction of at least 90% compared to 1990 (not taking into account removals) |
Singapore | March 31, 2020 | Halving emissions from its peak to 33 MtCO2-eq by 2050, with a view to achieving net zero emissions as soon as viable in the second half of the century |
South Africa | Sep. 23, 2020 | Net zero carbon economy by 2050 |
Finland | Oct. 5, 2020 | Carbon neutrality by 2035; 87.5–90% reduction of GHG in 2050 to 1990 level (excluding land use sector) |
Norway | Nov. 25, 2020 | Being a low-emission society by 2050 |
Latvia | Dec. 9, 2020 | Climate neutrality by 2050 (non-reducible GHG emissions are compensated by removals in the LULUCF sector) |
Spain | Dec. 10, 2020 | Climate neutrality by 2050 |
Belgium | Dec. 10, 2020 | Carbon neutrality by 2050 (Walloon Region); Full climate neutrality (Flemish Region), and the European target of carbon neutrality by 2050 (Brussels-Capital Region) |
Austria | Dec. 11, 2020 | Climate-neutral by no later than 2050 |
Netherlands | Dec. 11, 2020 | Reduction of GHG emissions by 95% by 2050 compared to 1990 level. |
Sweden | Dec. 11, 2020 | Zero net emissions of GHG into the atmosphere latest by 2045 |
Denmark | Dec. 30, 2020 | Climate neutrality by 2050 |
Republic of Korea | Dec. 30, 2020 | Carbon neutrality by 2050 |
Switzerland | Jan. 28, 2021 | 2050 net zero GHG |
Guatemala | July 6, 2021 | 59% reduction of projected emissions by 2050 |
Indonesia | July 22, 2021 | 540 MtCO2-eq by 2050, and with further exploring opportunity to rapidly progress towards net zero emission in 2060 or sooner |
Slovenia | Aug. 23, 2021 | Net zero emissions or climate neutrality by 2050 |
‘rev.’ = ‘date revised’
4.2.4.2Other National Emission Pathways to Mid-century
At the 2019 Climate Action Summit, 77 countries indicated their aim to reach net zero CO2 emissions by 2050, more the number of countries having submitted LEDS to the UNFCCC. Table 4.6 lists the countries that have a national net zero by 2050 target in laws, strategies or other documents (The Energy and Climate Intelligence Unit 2019). Bhutan and Suriname already have achieved net negative emissions. France second ‘low-carbon national strategy’ adopted in 2020 has an objective of GHG neutrality by 2050. Net zero is also the basis of the recent revision of the official notional price of carbon for public investment in France (Quinet et al. 2019). The Committee on Climate Change of the UK analyses sectoral options and concludes that delivering net zero GHG by 2050 is technically feasible but highly challenging (Committee on Climate Change 2019). For Germany, three steps to climate neutrality by 2050 are introduced: first, a 65% reduction of emissions by 2030; second, a complete switch to climate-neutral technologies, leading to a 95% cut in emissions, all relative to 1990 levels by 2050; and third balancing of residual emissions through carbon capture and storage (Prognos et al. 2020). In addition to the countries in Table 4.6, EU reported the net zero GHG emission pathways by 2050 under Green Deal (European Commission 2019). China and South Korea, have made announcements of carbon neutrality before 2060 and net zero GHG emission by 2050, respectively (UN 2020a,b). In the case of Japan, the new target to net zero GHG emission by 2050 was announced in 2020 (UN 2020c). As of August 25, 2021, a total 121 countries participate in the ‘Climate Ambition Alliance: Net Zero 2050’, together with businesses, cities and regions.
Table 4.6 | Countries with a national net zero CO2or GHG target by 2050 (as of 25 August 2021).
Country | Target year | Target status | Source |
Suriname | Achieved | Suriname INDC | |
Bhutan | Achieved | Royal Government of Bhutan National Environment Commission | |
Germany | 2045 | In Law | KSG |
Sweden | 2045 | In Law | Climate Policy Framework |
European Union | 2050 | In Law | European Climate Law |
Japan | 2050 | In Law | Japan enshrines PM Suga’s 2050 carbon neutrality promise into law |
United Kingdom | 2050 | In Law | The Climate Change Act |
France | 2050 | In Law | Energy and Climate Law |
Canada | 2050 | In Law | Canadian Net Zero Emissions Accountability Act |
Spain | 2050 | In Law | New Law |
Denmark | 2050 | In Law | The Climate Act |
New Zealand | 2050 | In Law | Zero Carbon Act |
Hungary | 2050 | In Law | Climate Ambition Alliance: Net Zero 2050 |
Luxembourg | 2050 | In Law | Climate Ambition Alliance: Net Zero 2050 |
South Korea | 2050 | Proposed Legislation | Speeches and Statements by the President |
Ireland | 2050 | Proposed Legislation | Climate Action and Low Carbon Development (Amendment) Bill 2021 |
Chile | 2050 | Proposed Legislation | Chile charts path to greener, fairer future |
Fiji | 2050 | Proposed Legislation | Draft Climate Law |
Note: In addition to the above list, the numbers of ‘In Policy Document’ and ‘Target Under discussion’ as Target status are 37 countries and 79 countries, respectively.
4.2.4.3Mid-century Low Emission Strategies at the National Level in the Academic Literature
Since the 2000s, an increasing number of studies have quantified the emission pathways to mid-century by using national scale models. In the early stages, the national emission pathways were mainly assessed in the developed countries such as Germany, UK, France, the Netherlands, Japan, Canada, and USA. For example, the Enquete Commission in Germany identified robust and sustainable 80% emission reduction pathways (Deutscher Bundestag 2002). In Japan, 2050 Japan Low-Carbon Society scenario team (2008) assessed the 70% reduction scenarios in Japan, and summarised the necessary measures to ‘Dozen Actions towards Low-Carbon Societies’.
Among developing countries, China, India, South Africa assessed their national emission pathways. For example, detailed analysis was undertaken to analyse pathways to China’s goal for carbon neutrality (EFC 2020). In South Africa, a Scenario Building Team (2007) quantified the Long Term Mitigation Scenarios for South Africa.
Prior to COP21, most of the literature on mid-century mitigation pathways at the national level was dedicated to pathways compatible with a 2°C limit (see Box 4.2 for a discussion on the relationship between national mitigation pathways and global, long-term targets). After COP21 and the IPCC SR1.5, literature increasingly explored just transition to net zero emissions around 2050. This literature reflects on low-emissions development strategies (cognate with SDPS, Section 4.3.1) and policies to get to net zero CO2 or GHG emissions (Garg and Waisman 2021) (Cross-Chapter Box 5 in this chapter).
Figure 4.2 provides a snapshot of this literature. For a selected set of countries, it shows the mid-century emission pathways at national scale that have been registered in the International Institute for Applied Systems Analysis (IIASA) national mitigation scenario database built for the purpose of this Report (Annex III.3.3). Overall, the database contains scenarios for 50 countries. Total GHG emission are the most comprehensive information to assess the pathways on climate mitigation actions, but energy-related CO2 emissions are the most widely populated data in the scenarios. As a result, Figure 4.2 shows energy-related CO2 emission trajectories. Scenarios for EU countries show reduction trends even in the reference scenario, whereas developing countries and non-European developed countries such as Japan and USA show emissions increase in the reference. In most countries plotted onFigure 4.2, studies have found that reaching net zero energy related CO2 emissions by 2050 is feasible, although the number of such pathways is limited.

Figure 4.2 | Energy related CO2emission pathways to mid-century from existing studies. Source of the historical data: Greenhouse Gas Inventory Data of UNFCCC (https://di.unfccc.int/detailed_data_by_party)
The literature underlines the differences induced by the shift from ‘2°C scenarios’ (typically assumed to imply mitigation in 2050 around 80% relative to 1990) to ‘1.5°C scenarios’ (typically assumed to imply net zero CO2 or GHG emissions in 2050) (Box 4.2). For Japan, Oshiro et al. (2018) shows the difference between the implications of a 2°C scenario (80% reduction of CO2 in 2050) and a 1.5°C scenario (net zero CO2 emission in 2050), suggesting that for a net zero CO2 emission scenario, BECCS is a key technology. Their sectoral analysis aims in 2050 at negative CO2 emissions in the energy sector, and near-zero emissions in the buildings and transport sectors, requiring energy efficiency improvement and electrification. To do so, drastic mitigation is introduced immediately, and, as a result, the mitigation target of Japan’s current NDC is considered not sufficient to achieve a 1.5°C scenario. Jiang et al. (2018) also show the possibility of net negative emissions in the power sector in China by 2050, indicating that biomass energy with carbon capture and storage (CCS) must be adopted on a large scale by 2040. Samadi et al. (2018) indicate the widespread use of electricity-derived synthetic fuels in end-use sectors as well as behavioural change for the 1.5°C scenario in Germany.
In addition to those analyses, Vishwanathan et al. (2018b), Chunark and Limmeechokchai (2018) and Pradhan et al. (2018b) build national scenarios in India, Thailand and Nepal, respectively, compatible with a global 1.5°C. Unlike the studies mentioned in the previous paragraph, they translate the 1.5°C goal by introducing in their model a carbon price trajectory estimated by global models as sufficient to achieve the 1.5°C target. Because of the high economic growth and increase of GHG emissions in the reference case, CO2 emissions in 2050 do not reach zero. Finally, the literature also underlines that to achieve a 1.5°C target, mitigation measures relative to non-CO2 emissions become important, especially in developing countries where the share of non-CO2 emissions is relatively high. (La Rovere et al. 2018) treat mitigation actions in AFOLU sector.
Chapter 3 reported on multi-model analyses, comparison of results using different models, of global emissions in the long term. At the national scale, multi-model analyses are still limited, though such analyses are growing as shown in Table 4.7. By comparing the results among different models and different scenarios in a country, the uncertainties on the emission pathways including the mitigation measures to achieve a given emission target can be assessed.
Another type of multi-model analysis is international, in other words, different countries join the same project and use their own national models to assess a pre-agreed joint mitigation scenario. By comparing the results of various national models, such projects help highlight specific features of each country. More robust mitigation measures can be proposed if different types of models participate. These activities can also contribute to capacity building in developing countries.
Table 4.7 | Examples of research projects on country-level mitigation pathways in the near to medium-term under the multi-nat ional analyses.
Project name | Features |
DDPP (Deep Decarbonisation Pathways Project) | 16 countries participated and estimated the deep decarbonisation pathways from the viewpoint of each country’s perspective using their own models (Waisman et al. 2019). |
COMMIT (Climate Policy assessment and Mitigation Modelling to Integrate national and global Transition pathways) | This research project assessed the country contributions to the target of the Paris Agreement (COMMIT 2019). |
MAPS (Mitigation Action Plans and Scenarios) | The mitigation potential and socio-economic implications in Brazil, Chile, Colombia and Peru were assessed (Delgado et al. 2014; Zevallos et al. 2014; Benavides et al. 2015; La Rovere et al. 2018). The experiences of the MAPS programme suggests that co-production of knowledge by researchers and stakeholders strengthens the impact of research findings, and in depth studies of stakeholder engagement provide lessons (Boulle et al. 2015; Raubenheimer et al. 2015; Kane and Boulle 2018), which can assist building capacity for long-term planning in other contexts (Calfucoy et al. 2019). |
CD-LINKS (Linking Climate and Development Policies – Leveraging International Networks and Knowledge Sharing) | The complex interplay between climate action and development at both the global scale and some national perspectives were explored. The climate policies for G20 countries up to 2015 and some levels of the carbon budget are assessed for short-term and long-term, respectively (Rogelj et al. 2017). |
APEC Energy Demand and Supply Outlook | Total 21 APEC countries assessed a 2°C scenario scenario which follows the carbon emissions reduction pathway included in the IEA Energy Technology Perspectives (IEA 2017) by using the common framework (APERC 2019). |
Low-Carbon Asia Research Project | The low-carbon emission scenarios for several countries and cities in Asia were assessed by using the same framework (Matsuoka et al. 2013). The mitigation activities were summarised into 10 actions toward Low Carbon Asia to show a guideline to plan and implement the strategies for an LCS in Asia (Low-Carbon Asia Research Project 2012). |
CLIMACAP–LAMP | This is an inter-model comparison exercise that focused on energy and climate change mitigation in Latin America (Clarke et al. 2016). |
DDPP-LAC (Latin American Deep Decarbonisation Pathways project) | Six countries in Latin America analysed the activities in agriculture, forestry and other land use (AFOLU) commonly (Bataille et al. 2020). |
MILES (Modelling and Informing Low-Emission Strategies) | This is an international research project which covers five countries and one region in order to build capacity and knowledge on low-emissions development strategies both at a national and global level, by investigating the concrete implications of INDCs for the low-carbon transformation by and beyond 2030 (Spencer et al. 2015). |
4.2.5What Is to Be Done to Accelerate Mitigation?
4.2.5.1Overview of Accelerated Mitigation Pathways
The literature reports an increasing number of accelerated mitigation pathways that are beyond NDCs in different regions and countries. There is increasing understanding of the technical content of such pathways, though the literature remains limited on some dimensions, such as demand-side options, systems analysis, or mitigation of AFOLU non-CO2GHGs. The present section describes insights from this literature.
Overall, the literature shows that pathways considered consistent with below 2°C (>67%) or 1.5°C (Box 4.2) – including inter alia 80% reduction of GHG emissions in 2050 relative to 1990 or 100% renewable electricity scenarios – are technically feasible (Lund and Mathiesen 2009; Mathiesen et al. 2011; Esteban and Portugal-Pereira 2014; Young and Brans 2017; Esteban et al. 2018; Child et al. 2019; Hansen et al. 2019). They entail increased end-use energy efficiency, significant increases in low-carbon energy, electrification, other new and transformative technologies in demand sectors, adoption of carbon capture and sequestration (CCS) to reduce gross emissions, and contribution to net negative emissions through carbon dioxide removal (CDR) and carbon sinks. For these pathways to be realised, the literature assumes higher carbon prices, combined in policy packages with a range of other policy measures.
The most recent literature also reflects on accelerated mitigation pathways aiming at reaching net zero CO2 emissions or net zero GHG emissions by 2050 (Section 4.2.4 and Table 4.6; see Glossary entries on ‘net zero CO2 emissions’ and ‘net zero GHG emissions’). Specific policies, measures and technologies are needed to reach such targets. These include, broadly, decarbonising electricity supply, including through low-carbon energy, radically more efficient use of energy than today; electrification of end-uses (including transport/electric vehicles); dramatically lower use of fossil fuels than today; converting other uses to low- or zero-carbon fuels (e.g., hydrogen, bioenergy, ammonia) in hard-to-decarbonise sectors; and setting ambitious targets to reduce methane and other short-lived climate forcers (SLCFs).
Accelerated mitigation pathways differ by countries, depending inter alia on sources of emissions, mitigation opportunities and economic context. In China, India, Japan and other Southeast Asian countries, more aggressive action related to climate change is also motivated by regional concerns over health and air quality related to air pollutants and SLCFs (Ashina et al. 2012; Aggarwal 2017; Kuramochi et al. 2017; Xunzhang et al. 2017; Dhar et al. 2018; Jiang et al. 2018; Oshiro et al. 2018; China National Renewable Energy Centre 2019; Energy Transitions Commission and Rocky Mountain Institute 2019; Khanna et al. 2019). Studies of accelerated mitigation pathways in North America tend to focus on power sector and imported fuel decarbonisation in the US , and on electrification and demand-side reductions in Canada (Vaillancourt et al. 2017; Hodson et al. 2018; Victor et al. 2018; Bahn and Vaillancourt 2020; Hammond et al. 2020; Jayadev et al. 2020). In Latin America, many pathways emphasise supply-side mitigation measures, finding that replacing thermal power generation and developing bioenergy (where resources are available) utilisation offers the greatest mitigation opportunities (Herreras Martínez et al. 2015; Nogueira de Oliveira et al. 2016; Arango-Aramburo et al. 2019; Delgado et al. 2020; Lap et al. 2020). The European Union member states (EU-28) recently announced 2050 climate neutrality goal is explored by pathways that emphasise complete substitution of fossil fuels with electricity generated by low-carbon sources, particularly renewables; demand reductions through efficiency and conservation, and novel fuels and end-use technologies (Prognos et al. 2020). The limited literature so far on Africa’s future pathways suggest those could be shaped by increasing energy access and mitigating the air pollution and health effects of relying on traditional biomass use, as well as cleaner expansion of power supply alongside end-use efficiency improvements (Hamilton and Kelly 2017; Oyewo et al. 2019, 2020; Ven et al. 2019; Wright et al. 2019; Forouli et al. 2020).
Though they differ across countries, accelerated mitigation pathways share common characteristics as follows. First, energy efficiency, conservation, and reducing energy use in all energy demand sectors (buildings, transport, and industry) are included in nearly all literature that addresses future demand growth (Ashina et al. 2012; Saveyn et al. 2012; Schmid and Knopf 2012; Chiodi et al. 2013; Deetman et al. 2013; Jiang et al. 2013; Thepkhun et al. 2013; Schiffer 2015; Altieri et al. 2016; Jiang et al. 2016; McNeil et al. 2016; Nogueira de Oliveira et al. 2016; Chilvers et al. 2017; Elizondo et al. 2017; Fragkos et al. 2017; Jacobson et al. 2017, 2019; Kuramochi et al. 2017; Oshiro et al. 2017a; Ouedraogo 2017; Shahiduzzaman and Layton 2017; Vaillancourt et al. 2017; Hanaoka and Masui 2018; Hodson et al. 2018; Lee et al. 2018; Lefèvre et al. Oshiro et al. 2018; 2018; Capros et al. 2019; Dioha et al. 2019; Duscha et al. 2019;Khanna et al. 2019; Kato and Kurosawa 2019; Nieves et al. 2019; Sugiyama et al. 2019; Zhou et al. 2019; Dioha and Kumar 2020).
Similarly, electrification of industrial processes (up to 50% for EU and China) and transport (e.g., 30–60% for trucks in Canada), buildings, and district heating and cooling are commonplace (Ashina et al. 2012; Massetti 2012; Saveyn et al. 2012; Chiodi et al. 2013; Deetman et al. 2013; Fragkos et al. 2017; Oshiro et al. 2017b; Vaillancourt et al. 2017; Xunzhang et al. 2017; Jiang et al. 2018; Mittal et al. 2018; Oshiro et al. 2018; Capros et al. 2019; Zhou et al. 2019; Hammond et al. 2020).
Third, lower emissions sources of energy, such as nuclear, renewables, and some biofuels, are seen as necessary in all pathways. However, the extent of deployment depends on resource availability. Some countries have set targets of up to 100% renewable electricity, while others such as Brazil rely on increasing biomass up to 40–45% of total or industry energy consumption by 2050.
Fourth, CCS and CDR are part of many of the national studies reviewed (Ashina et al. 2012; Massetti 2012; Jiang et al. 2013; Thepkhun et al. 2013; Herreras Martínez et al. 2015; van der Zwaan et al. 2016; Chilvers et al. 2017; Solano Rodriguez et al. 2017; Xunzhang et al. 2017; Kuramochi et al. 2018; Mittal et al. 2018; Oshiro et al. 2018; Roberts et al. 2018b; Vishwanathan et al. 2018b; Kato and Kurosawa 2019). CCS helps reduce gross emissions but does not remove CO2 from the atmosphere, unless combined with bioenergy (BECCS). CO2 removal from sources with no identified mitigation measures is considered necessary to help achieve economy-wide net negative emissions (Massetti 2012; Deetman et al. 2013; Solano Rodriguez et al. 2017).
Each option is assessed in more detail in the following sections.
4.2.5.2Accelerated Decarbonisation of Electricity Through Renewable Energy
Power generation could decarbonise much faster with scaled up deployment of renewable energy and storage. Both technologies are mature, available, and fast decreasing in costs, more than for many other mitigation options. Models continuously underestimate the speed at which renewables and storage expand. Higher penetration of renewable energy in the power sector is a common theme in scenarios. Some studies provide cost optimal electricity mix under emission constraints, while others explicitly explore a 100% renewables or 100% emission free electricity sector (Box 4.3).
Figure 4.3 shows an increasing share of renewable electricity in most countries historically, with further increases projected in many decarbonisation pathways. Targets for very high shares of renewable electricity generation – up to 100% – are shown for a number of countries, with the global share projected to range from 60% to 70% for 1.5°C with no overshoot (C0) to below 2°C (C4) scenarios. Countries and states that have set 100% renewables targets include Scotland for 2020 (Scottish Government 2021), Austria (2030), Denmark (2035) and California (2045) (Figure 4.3).

Figure 4.3 | Historical and projected levels and targets for the share of renewables in electricity generation. Sources: IEA energy balances for past trends, IPCC AR6 scenario dataset including national model and regional versions in global models (10th to 90th percentile of 1.5°C with no overshoot (C0) to below 2°C (C4) scenarios), national/regional sources.
While 100% renewable electricity generation by 2050 is found to be feasible, it is not without issues. For example, (Jacobson et al. 2017, 2019) find it feasible for 143 countries with only a 9% average increase in economic costs (considering all social costs) if annual electricity demand can be reduced by 57%. Others state that challenges exist with speed of expansion, ensuring sufficient supply at all times or higher costs compared to other alternatives (Clack et al. 2017). In-depth discussion of net zero electricity systems can be found in Section 6.6.
Box 4.3 | Examples of High-renewable Accelerated Mitigation Pathways
Many accelerated mitigation pathways include high shares of renewable energy, with national variations. In Europe, some argue that the EU 2050 net zero GHG emissions goal can be met with 100% renewable power generation, including use of renewable electricity to produce hydrogen, biofuels (including imports), and synthetic hydrocarbons, but will require significant increases in transmission capacity (Duscha et al. 2019; Zappa et al. 2019). Capros et al. (2019) explore a 1.5°C compatible pathway that includes 85% renewable generation, with battery, pumped hydro, and chemical storage for variable renewables. High-renewable scenarios also exist for individual Member States. In France, for example, Krakowski et al. (2016) propose a 100% renewable power generation scenario that relies primarily on wind (62%), solar PV (26%) and oceans (12%). To reach this aim, integration into the European grid is of vital importance (Brown et al. 2018). While debated, incremental costs could be limited regardless of specific assumptions of future costs of individual technologies (Shirizadeh et al. 2020). In Germany, similarly, 100% renewable electricity systems are found feasible by numerous studies (Oei et al. 2020; Thomas Klaus et al. 2010; Wuppertal-Institut 2021; Hansen et al. 2019).
In South Africa, it is found that long-term mitigation goals could be achieved with accelerated adoption of solar PV and wind generation, if the electricity sector decarbonises by phasing-out coal entirely by 2050, even if CCS is not feasible before 2025 (Altieri et al. 2015; Beck et al. 2013). Abundant solar PV and wind potential, coupled with land availability suggest that more than 75% of power generation could ultimately originate from solar PV and wind (Oyewo et al. 2019; Wright et al. 2019).
For the US, share of renewables in power generation in 2050 in accelerated mitigation scenarios vary widely, 40% in (Hodson et al. 2018; Jayadev et al. 2020), more than half renewable and nuclear in (Victor et al. 2018) to 100% in Jacobson et al. (2017, 2019).
Box 4.3
Under cost optimisation scenarios for Brazil, electricity generation, which is currently dominated by hydropower, could reach 100% by adding biomass (Köberle et al. 2020). Other studies find that renewable energy, including biomass, could account for more than 30% of total electricity generation (Nogueira de Oliveira et al. 2016; Portugal-Pereira et al. 2016).
In Colombia, where hydropower resources are abundant and potential also exist for solar and wind, a deep decarbonisation pathway would require 57% renewable power generation by 2050 (Arango-Aramburo et al. 2019) while others find 80% would be possible (Delgado et al. 2020).
In Asia, Japan could have up to 50% variable renewable electricity supply to reduce CO2 emissions by 80% by 2050 in some of its deep mitigation scenarios ( Kato and Kurosawa 2019; Sugiyama et al. 2019; Ju et al. 2021; Shiraki et al. 2021; Silva Herran and Fujimori 2021). One view of China’s 1.5°C pathway includes 59% renewable power generation by 2050 (Jiang et al. 2018). One view of India’s 1.5°C pathway also includes 52% renewable power generation, and would require storage needs for 35% of generation (Parikh et al. 2018).
4.2.5.3Bioenergy Plays Significant Role in Resource Abundant Countries in Latin America and Parts of Europe
Bioenergy could account for up to 40% of Brazil’s total final energy consumption, and a 60% share of fuel for light-duty vehicles by 2030 (Lefèvre et al. 2018), and is considered most cost-effective in transport and industrial applications (Lap et al. 2020). BECCS in the power sector is also considered cost-effective option for supply-side mitigation (Borba et al. 2012; Herreras Martínez et al. 2015; Lucena et al. 2016).
Bioenergy also plays a prominent role in some EU countries’ deep decarbonisation strategies. Domestic biomass alone can help Germany meet its 95% CO2 reduction by 2050 goal, and biomass and CCS together are needed to reduce CO2 by 80% by 2050 in the Netherlands (Mikova et al. 2019). Studies suggest that mitigation efforts in France include biofuels and significant increases in biomass use, including up to 45% of industry energy by 2050 for its net GHG neutrality goal (Doumax-Tagliavini and Sarasa 2018; Capros et al. 2019). Increased imports may be needed to meet significant increases in EU’s bioenergy use, which could affect energy security and the sustainability of bioenergy production outside of the EU (Mandley et al. 2020; Daioglou et al. 2020).
While BECCS is needed in multiple accelerated mitigation pathways, large-scale land-based biological CDR may not prove as effective as expected, and its large-scale deployment may result in ecological and social impacts, suggesting it may not be a viable carbon removal strategy in the next 10–20 years (Vaughan and Gough 2016; Boysen et al. 2017; Dooley and Kartha 2018). The effectiveness of BECCS could depend on local contexts, choice of biomass, fate of initial aboveground biomass and fossil-fuel emissions offsets – carbon removed through BECCS could be offset by losses due to land-use change (Harper et al. 2018; Butnar et al. 2020; Calvin et al. 2021). Large-scale BECCS may push planetary boundaries for freshwater use, exacerbate land-system change, significantly alter biosphere integrity and biogeochemical flows (Heck et al. 2018; Fuhrman et al. 2020; Stenzel et al. 2021; Ai et al. 2021). (Sections 7.4 and 12.5)
4.2.5.4CCS May Be Needed to Mitigate Emissions From the Remaining Fossil Fuels That Cannot Be Decarbonised, but the Economic Feasibility of Deployment Is Not Yet Clear
CCS is present in many accelerated mitigation scenarios in the literature. In Brazil, (Nogueira de Oliveira et al. 2016) consider BECCS and CCS in hydrogen generation more feasible than CCS in thermal power plants, with costs ranging from USD70–100 per tCO2. Overall, (van der Zwaan et al. 2016) estimate that 33–50% of total electricity generation in Latin America could be ultimately covered by CCS. In Japan, CCS and increased bioenergy adoption plus waste-to-energy and hydrogen-reforming from fossil fuel are all considered necessary in the power sector in existing studies, with potential up to 200 MtCO2 yr –1 (Ashina et al. 2012; Oshiro et al. 2017a; Kato and Kurosawa 2019; Sugiyama et al. 2021). In parts of the EU, after 2030, CCS could become profitable with rising CO2 prices (Schiffer 2015). CDR is seen as necessary in some net GHG neutrality pathways (Capros et al. 2019) but evidence on cost-effectiveness is scarce and uncertain (European Commission 2013). For France and Sweden, (Millot et al. 2020) include CCS and BECCS to meet net zero GHG emissions by 2050. For Italy, (Massetti 2012) propose a zero-emission electricity scenario with a combination of renewable and coal, natural gas, and BECCS.
In China, an analysis concluded that CCS is necessary for remaining coal and natural gas generation out to 2050 (Jiang et al. 2018; Energy Transitions Commission and Rocky Mountain Institute 2019). Seven to 10 CCS projects with installed capacity of 15 GW by 2020 and total CCS investment of 105 billion RMB (2010 RMB) are projected to be needed by 2050 under a 2°C compatible pathway according to (Jiang et al. 2013, 2016; Lee et al. 2018). Under 1.5°C pathway, an analysis found China would need full CCS coverage of the remaining 12% of power generation from coal and gas power and 250 GW of BECCS (Jiang et al. 2018). Combined with expanded renewable and nuclear development, total estimated investment in this study is 5% of China’s total GDP in 2020, 1.3% in 2030, and 0.6% in 2050 (Jiang et al. 2016).
Views regarding feasibility of CCS can vary greatly for the same country. In the case of India’s electricity sector for instance, some studies indicate that CCS would be necessary (Vishwanathan et al. 2018a), while others do not – citing concerns around its feasibility due to limited potential sites and issues related to socio-political acceptance – and rather point to very ambitious increase in renewable energy, which in turn could pose significant challenges in systematically integrating renewable energy into the current energy systems (Viebahn et al. 2014; Mathur and Shekhar 2020). Some limitations of CCS, including uncertain costs, lifecycle and net emissions, other biophysical resource needs, and social acceptance are acknowledged in existing studies (Viebahn et al. 2014; Jacobson 2019; Mathur and Shekhar 2020; Sekera and Lichtenberger 2020).
While national mitigation portfolios aiming at net zero emissions or lower will need to include some level of CDR, the choice of methods and the scale and timing of their deployment will depend on the ambition for gross emission reductions, how sustainability and feasibility constraints are managed, and how political preferences and social acceptability evolve (Cross-Chapter Box 8). Furthermore, mitigation deterrence may create further uncertainty, as anticipated future CDR could dilute incentives to reduce emissions now (Grant et al. 2021), and the political economy of net negative emissions has implications for equity (Mohan et al. 2021).
4.2.5.5Nuclear Power Is Considered Strategic for Some Countries, While Others Plan to Reach Their Mitigation Targets Without Additional Nuclear Power
Nuclear power generation is developed in many countries, though larger-scale national nuclear generation does not tend to associate with significantly lower carbon emissions (Sovacool et al. 2020). Unlike other energy sources such as wind and PV solar, levelised costs of nuclear power has been rising in the last decades (Grubler 2010; Gilbert et al. 2017; Portugal-Pereira et al. 2018). This is mainly due to overrun of overnight construction costs related to delays in project approvals and construction, and more stringent passive safety measures, which increases the complexity of systems. After the Fukushima Daiichi accident in Japan, nuclear programs in several countries have been phased out or cancelled (Carrara 2020; Huenteler et al. 2012; Kharecha and Sato 2019; Hoffman and Durlak 2018). Also the compatibility of conventional prresurised water reactors and boiling water reactors with large proportion of renewable energy in the grid it is yet to be fully understood.
Accelerated mitigation scenarios offer contrasting views on the share of nuclear in power generation. In the USA, (Victor et al. 2018) build a scenario in which nuclear contributes 23% of CO2 emission reductions needed to reduce GHG emissions by 80% from 2005 levels by 2050. Deep power sector decarbonisation pathways could require a two-folded increase in nuclear capacity according to (Jayadev et al. 2020) for the USA, and nearly a ten-fold increase for Canada, but may be difficult to implement (Vaillancourt et al. 2017). For China to meet a 1.5°C pathway or achieve carbon neutrality by 2050, nuclear may represent 14–28% of power generation in 2050 according to (Jiang et al. 2018; China National Renewable Energy Centre 2019; Energy Transitions Commission and Rocky Mountain Institute 2019). For South Korea, Hong et al. (2014) and Hong and Brook (2018) find that increasing nuclear power can help complement renewables in decarbonising the grid. Similarly, India has put in place a three-stage nuclear programme which aims to enhance nuclear power capacity from the current level of 6 GW to 63 GW by 2032, if fuel supply is ensured (GoI 2015). Nuclear energy is also considered necessary as part of accelerated mitigation pathways in Brazil, although it is not expected to increase significantly by 2050 even under stringent low-carbon scenarios (Lucena et al. 2016). France developed its nuclear strategy in response to energy security concerns after the 1970s oil crisis, but has committed to reducing nuclear’s share of power generation to 50% by 2035 (Millot et al. 2020). Conversely, some analysis find deep mitigation pathways, including net zero GHG emissions and 80–90% reduction from 2013 levels, feasible without additional nuclear power in EU-28 and Japan respectively, but assuming a combination of bio- and novel fuels and CCS or land-use based carbon sinks (Kato and Kurosawa 2019; Duscha et al. 2019).
Radically more efficient use of energy than today, including electricity, is a complementary set of measures, explored in the following.
4.2.5.6Efficient Cooling, SLCFs and Co-benefits
In warmer climate regions undergoing economic transitions, improving the energy efficiency of cooling and refrigeration equipment is often important for managing peak electricity demand and can have co-benefits for climate mitigation as well as SLCF reduction, as expected in India, Africa, and Southeast Asia in the future.
Air conditioner adoption is rising significantly in low- and middle-income countries as incomes rise and average temperatures increase, including in Southeast Asian countries such as Thailand, Indonesia, Vietnam, and the Philippines, as well as Brazil, Pakistan, Bangladesh, and Nigeria (Biardeau et al. 2020). Cooling appliances are expected to increase from 3.6 billion to 9.5 billion by 2050, though up to 14 billion could be required to provide adequate cooling for all (Birmingham Energy Institute 2018). Current technology pathways are not sufficient to deliver universal access to cooling or meet the 2030 targets under the SDGs, but energy efficiency, including in equipment efficiency like air conditioners, can reduce this demand and help limit additional emissions that would further exacerbate climate change (Biardeau et al. 2020; Dreyfus et al. 2020; UNEP and IEA 2020). Some countries (India, South Africa) have started to recognise the need for more efficient equipment in their mitigation strategies (Altieri et al. 2016; Ouedraogo 2017; Paladugula et al. 2018).
One possible synergy between SLCF and climate change mitigation is the simultaneous improvement in energy efficiency in refrigeration and air-conditioning equipment during the hydrofluorocarbon (HFC) phase-down, as recognised in the Kigali Amendment to the Montreal Protocol. The Kigali Amendment and related national and regional regulations are projected to reduce future radiative forcing from HFCs by about half in 2050 compared to a scenario without any HFC controls, and to reduce future global average warming in 2100 from a baseline of 0.3°C–0.5°C to less than 0.1°C, according to a recent scientific assessment of a wide literature (World Meteorological Organization 2018). If ratified by signatories, the rapid phase-down of HFCs under the Kigali Amendment is possible because of extensive replacement of high-global warming potential (GWP) HFCs with commercially available low-GWP alternatives in refrigeration and air-conditioning equipment. Each country’s choices of alternative refrigerants will likely be determined by energy efficiency, costs, and refrigerant toxicity and flammability. National and regional regulations will be needed to drive technological innovation and development (Polonara et al. 2017).
4.2.5.7Efficient Buildings, Cooler in Summer, Warmer in Winter, Towards Net Zero Energy
Most accelerated mitigation pathway scenarios include significant increase in building energy efficiency. Countries in cold regions, in particular, often focus more on building sector GHG emissions mitigation measures such as improving building envelopes and home appliances, and electrifying space heating and water heating.
For example, scenarios for Japan project continued electrification of residential and commercial buildings to 65% and 79% respectively by 2050 to reach 70–90% CO2 reduction from 2013 levels (Kato and Kurosawa 2019). Similarly, a mitigation pathway for China compatible with 1.5°C would require 58% to 70% electrification of buildings according to (Jiang et al. 2018; China National Renewable Energy Centre 2019 E; nergy Transitions Commission and Rocky Mountain Institute 2019). For the EU-28 to reach net carbon neutrality, complete substitution of fossil fuels with electricity (up to 65% share), district heating, and direct use of solar and ambient heat are projected to be needed for buildings, along with increased use of solar thermal and heat pumps for heating (Duscha et al. 2019). In the UK and Canada, improved insulation to reduce energy demand and efficient building appliances and heating systems are important building strategies needed to reduce emissions to zero by 2050 (Vaillancourt et al. 2017; Chilvers et al. 2017; Roberts et al. 2018a). In Ireland, achieving 80–95% emissions reduction below 1990 levels by 2050 also requires changes in building energy technology and efficiency, including improving building envelopes, fuel switching for residential buildings, and replacing service-sector coal use with gas and renewables according to (Chiodi et al. 2013). In South Africa, improving industry and building energy efficiency is also considered a key part of mitigation strategies (Altieri et al. 2016; Ouedraogo 2017).
In addition, an increasing number of countries have set up net zero energy building targets (Table 4.8) (Höhne et al. 2020). Twenty-seven countries have developed roadmap documents for NZEBs, mostly in developed countries in Europe, North America, and Asia-Pacific, focusing on energy efficiency and improved insulation and design, renewable and smart technologies (Mata et al. 2020). The EU, Japan and the USA (the latter for public buildings only) have set targets for shifting new buildings to 100% near-zero energy buildings by 2030, with earlier targets for public buildings. Scotland has a similar target for 2050 (Höhne et al. 2020). Technologies identified as needed for achieving near-zero energy buildings vary by region, but include energy-efficient envelope components, natural ventilation, passive cooling and heating, high performance building systems, air heat recovery, smart and information and communication technologies, and changing future heating and cooling supply fuel mixes towards solar, geothermal, and biomass (Mata et al. 2020). Sub-national regions in Spain, USA, Germany, and Mexico have set local commitments to achieving net zero carbon new buildings by 2050, with California having the most ambitious aspirational target of zero net energy buildings for all new buildings by 2030 (Höhne et al. 2020). The EU is also targeting the retrofitting of 3% of existing public buildings to zero-energy, with emphasis on greater thermal insulation of building envelopes (Höhne et al. 2020; Mata et al. 2020). China’s roadmaps have emphasised insulation of building envelope, heat recovery systems in combination with renewable energy, including solar, shallow geothermal, and air source heat pumps (Mata et al. 2020).
Table 4.8 | Targets by countries, regions, cities and businesses on decarbonising the building sector.
Countries | Sub-national Regions | Cities | Businesses | |
Shift to 100% (near-)zero energy buildings for new buildings | 3 | 6 | >28 | >44 |
Fully decarbonise the building sector | 1 | 6 | >28 | >44 |
Phase out fossil fuels (for example, gas) for residential heating | 1 | – | >3 | |
Increase the rate of zero-energy renovations | 1 (public buildings) |
Source: Höhne et al. (2020), supplementary information. https://newclimate.org/ambitiousactions.
4.2.5.8Electrifying Transport
Electrification of transport in tandem with power sector decarbonisation is expected to be a key strategy for deep CO2 mitigation in many countries. Passenger transport and light duty freight can already be electrified, but electrifying heavy-duty road transport and fuel switching in aviation and shipping are much more difficult and have not been addressed in most of the recent research.
In Germany, widespread electrification of private vehicles is expected by 2030 (Schmid and Knopf 2012) while for the EU-28, 50% overall transport electrification (excluding feedstock) and 75% electrification of road transport is needed to reach net carbon neutrality according to (Duscha et al. 2019). In addition, novel fuels such as hydrogen, synthetic hydrocarbons and sustainable biogenic fuels are needed to decarbonise aviation and water transport to achieve net carbon neutrality (Duscha et al. 2019).
In India, electrification, hydrogen, and biofuels are key to decarbonising the transport sector (Dhar et al. 2018; Mittal et al. 2018; Vishwanathan et al. 2018b; Mathur and Shekhar 2020). Under a 1.5°C scenario, nearly half of the light-duty passenger vehicle stock needs to be electrified according to (Parikh et al. 2018). In China, a 1.5°C-compatible pathway would require electrification of two-fifths of transport (Jiang et al. 2018; China National Renewable Energy Centre 2019).
Similarly, in Canada, electrification of 59% of light-duty trucks and 23% of heavy-duty trucks are needed as part of overall strategy to reduce CO2 emissions by 80% by 2050. In addition, hydrogen is expected to play a major role by accounting for nearly one-third of light-duty trucks, 68% of heavy-duty trucks, and 33% of rail by 2050 according to Hammond et al. (2020).
4.2.5.9Urban Form Meets Information Technology
Beyond technological measures, some densely populated countries including Germany, Japan, and India are exploring using information technology/internet of things (IOT) to support mode-shifting and reduce mobility demand through broader behaviour and lifestyle changes (Ashina et al. 2012; Canzler and Wittowsky 2016; Aggarwal 2017; Dhar et al. 2018; Vishwanathan et al. 2018b). In Japan, accelerated mitigation pathways consider the use of information technology and internet of things (IoT) to transform human behaviour and transition to a sharing economy (Ashina et al. 2012; Oshiro et al. 2017a, 2018). In Germany, one study points to including electromobility information and communication technologies in the transport sector as key (Canzler and Wittowsky 2016) while another emphasise shifting from road to rail transport, and reduced distances travelled as other possible transport strategies (Schmid and Knopf 2012). India’s transport sector strategies also include use of information technology and the internet, a transition to a sharing economy, and increasing infrastructure investment (Dhar et al. 2018; Vishwanathan et al. 2018b). Behaviour and lifestyle change along with stakeholder integration in decision-making are considered key to implementing new transport policies (Aggarwal 2017; Dhar et al. 2018).
4.2.5.10Industrial Energy Efficiency
Industrial energy efficiency improvements are considered in nearly all countries but for countries where industry is expected to continue to be a key sector, new and emerging technologies that require significant R&D investment, such as hydrogen and CCS, make ambitious targets achievable.
In China, for example, non-conventional electrical and renewable technologies, including low-grade renewable heat, biomass use for high-temperature heat in steel and cement sectors, and additional electrification in glass, food and beverage, and paper and pulp industries, are part of scenarios that achieve 60% reduction in national CO2 emission by 2050 (Khanna et al. 2019; Zhou et al. 2019), in addition to increased recycled steel for electric arc furnaces and direct electrolysis or hydrogen-based direct reduction of iron and CCS utilisation in clinker and steel-making (Jiang et al. 2018; China National Renewable Energy Centre 2019). Similarly, in India, (Vishwanathan and Garg 2020) point to the need for renewable energy and CCS to decarbonise the industrial sector. In EU-28, net CO2 neutrality can only be reached with 92% reduction in industrial emissions relative to 1990, through electrification, efficiency improvement and new technologies such as hydrogen-based direct reduction of steel, low-carbon cement and recycling (Duscha et al. 2019). Both China and EU see 50% of industry electrification by 2050 as needed to meet 1.5°C and net carbon neutrality pathways (Jiang et al. 2018; Capros et al. 2019).
Aggressive adoption of technology solutions for power sector decarbonisation coupled with end-use efficiency improvements and low-carbon electrification of buildings, industry and transport provides a pathway for accelerated mitigation in many key countries, but will still be insufficient to meet zero emission/1.5°C goals for all countries. Although not included in a majority of the studies related to pathways and national modelling analysis, energy demand reduction through deeper efficiency and other measures such as lifestyle changes and system solutions that go beyond components, as well as the co-benefits of the reduction of short-lived pollutants, needs to be evaluated for inclusion in future zero emission/1.5°C pathways.
4.2.5.11Lowering Demand, Downscaling Economies
Studies have identified socio-technological pathways to help achieve net zero CO2 and GHG targets at national scale, that in aggregate are crucial to keeping global temperature below agreed limits. However, most of the literature focuses on supply-side options, including carbon dioxide removal mechanisms (BECCS, afforestation, and others) that are not fully commercialised (Cross-Chapter Box 8 in Chapter 12). Costs to research, deploy, and scale up these technologies are often high. Recent studies have addressed lowering demand through energy conversion efficiency improvements, but few studies have considered demand reduction through efficiency (Grubler et al. 2018) and the related supply implications and mitigation measures.
Five main drivers of long-term energy demand reduction that can meet the 1.5°C target include quality of life, urbanisation, novel energy services, diversification of end-user roles, and information innovation (Grubler et al. 2018). A Low Energy Demand scenario requires fundamental societal and institutional transformation from current patterns of consumption, including: decentralised services and increased granularity (small-scale, low-cost technologies to provide decentralised services), increased use value from services (multi-use vs single use), sharing economies, digitalisation, and rapid transformation driven by end-user demand. This approach to transformation differs from the status quo and current climate change policies in emphasising energy end-use and services first, with downstream effects driving intermediate and upstream structural change.
Radical low-carbon innovation involves systemic, cultural, and policy changes and acceptance of uncertainty in the beginning stages. However, the current dominant analytical perspectives are grounded in neoclassical economics and social psychology, and focus primarily on marginal changes rather than radical transformations (Geels et al. 2018). Some literature is beginning to focus on mitigation through behaviour and lifestyle changes, but specific policy measures for supporting such changes and their contribution to emission reductions remain unclear (Section 4.4.2 and Chapter 5).
4.2.5.12Ambitious Targets to Reduce Short-lived Climate Forcers, Including Methane
Recent research shows that temperature increases are likely to exceed 1.5°C during the 2030s and 2°C by mid-century unless both CO2 and short-lived climate forcers (SLCFs) are reduced (Shindell et al. 2017; Rogelj et al. 2018a). Because of their short lifetimes (days to a decade and a half), SLCFs can provide fast mitigation, potentially avoiding warming of up to 0.6°C at 2050 and up to 1.2°C at 2100 (Ramanathan and Xu 2010; Xu and Ramanathan 2017). In Asia especially, co-benefits of drastic CO2 and air pollution mitigation measures reduce emissions of methane, black carbon, sulphur dioxide, nitrogen oxide, and fine particulate matter by approximately 23%, 63%, 73%, 27%, and 65% respectively in 2050 as compared to 2010 levels. Including the co-benefits of reduction of climate forcing adds significantly to the benefits reducing air pollutants (Hanaoka and Masui 2018).
To achieve net zero GHG emissions implies consideration of targets for non-CO2 gases. While methane emissions have grown less rapidly than CO2 and F-gases since 1990 (Chapter 2), the literature urges action to bring methane back to a pathway more in line with the Paris goals (Nisbet et al. 2020). Measures to reduce methane emissions from anthropogenic sources are considered intractable – where they sustain livelihoods – but also becoming more feasible, as studies report the options for mitigation in agriculture without undermining food security (Wollenberg et al. 2016; Frank et al. 2017; Nisbet et al. 2020). The choice of emission metrics has implications for SLCF (Cain et al. 2019) (Cross-Chapter Box 2 in Chapter 2). Ambitious reductions of methane are complementary to, rather than substitutes for, reductions in CO2 (Nisbet et al. 2020).
Rapid SLCF reductions, specifically of methane, black carbon, and tropospheric ozone have immediate co-benefits including meeting sustainable development goals for reducing health burdens of household air pollution and reversing health- and crop-damaging tropospheric ozone (Jacobson 2002, 2010). SLCF mitigation measures can have regional impacts, including avoiding premature deaths in Asia and Africa and warming in central and northern Asia, southern Africa, and the Mediterranean (Shindell et al. 2012). Reducing outdoor air pollution could avoid 2.4 million premature deaths and 52 million tonnes of crop losses for four major staples (Haines et al. 2017). Existing research emphasises climate and agriculture benefits of methane mitigation measures with relatively small human health benefits (Shindell et al. 2012). Research also predicts that black carbon mitigation could substantially benefit global climate and human health, but there is more uncertainty about these outcomes than about some other predictions (Shindell et al. 2012). Other benefits to SLCF reduction include reducing warming in the critical near term, which will slow amplifying feedbacks, reduce the risk of non-linear changes, and reduce long-term cumulative climate impacts – like sea-level rise – and mitigation costs (Hu et al. 2017; UNEP and WMO 2011; Rogelj et al. 2018a; Xu and Ramanathan 2017; Shindell et al. 2012).
4.2.5.13 System Analysis Solutions Are Only Beginning to Be Recognised in Current Literature on Accelerated Mitigation Pathways, and Rarely Included in Existing National Policies or Strategies
Most models and studies fail to address system impacts of widespread new technology deployment, for example: (i) material and resources needed for hydrogen production or additional emissions and energy required to transport hydrogen; or (ii) materials, resources, grid integration, and generation capacity expansion limits of a largely decarbonised power sector and electrified transport sector. These impacts could limit regional and national scale-ups.
Systemic solutions are also not being sufficiently discussed, such as low-carbon materials; light-weighting of buildings, transport, and industrial equipment; promoting circular economy, recyclability and reusability, and addressing the food-energy-water nexus. These solutions reduce demand in multiple sectors, improve overall supply chain efficiency, and require cross-sector policies. Using fewer building materials could reduce the need for cement, steel, and other materials and thus the need for production and freight transport. Concrete can also be produced from low-carbon cement, or designed to absorb CO2 from the atmosphere. Few regions have developed comprehensive policies or strategies for a circular economy, with the exception of the EU and China, and policies in the EU have only emerged within the last decade. While China’s circular economy policies emphasises industrial production, water, pollution and scaling-up in response to rapid economic growth and industrialisation, EU’s strategy is focused more narrowly on waste and resources and overall resource efficiency to increase economic competitiveness (McDowall et al. 2017).
Increased bioenergy consumption is considered in many 1.5°C and 2°C scenarios. System thinking is needed to evaluate bioenergy’s viability because increased demand could affect land and water availability, food prices, and trade (Sharmina et al. 2016). To adequately address the water-energy-food nexus, policies and models must consider interconnections, synergies, and trade-offs among and within sectors, which is currently not the norm (Section 12.4).
A systems approach is also needed to support technological innovation. This includes recognising unintended consequences of political support mechanisms for technology adoption and restructuring current incentives to realise multi-sector benefits. It also entails assimilating knowledge from multiple sources as a basis for policy and decision-making (Hoolohan et al. 2019).
Current literature does not explicitly consider systematic, physical drivers of inertia, such as capital and infrastructure needed to support accelerated mitigation (Pfeiffer et al. 2018). This makes it difficult to understand what is needed to successfully shift from current limited mitigation actions to significant transformations needed to rapidly achieve deep mitigation.
4.2.6Implications of Accelerated Mitigation for National Development Objectives
4.2.6.1Introduction
This section examines how accelerated mitigation may impact the realisation of development objectives in the near- and mid-term. It focuses on three objectives discussed in the literature, sustaining economic growth (Section 4.2.6.2), providing employment (Section 4.2.6.3), and alleviating poverty and ensuring equity (Section 4.2.6.4). It complements similar review performed at global level in Section 3.6. For a comprehensive survey of research on the impact of mitigation in other areas (including air quality, health, and biodiversity), see Karlsson et al. (2020).
4.2.6.2Mitigation and Economic Growth in the Near- and Mid-term
A significant part of the literature assesses the impacts of mitigation on GDP, consistent with policymakers’ interest in this variable. It must be noted upfront that computable equilibrium models, on which our assessments are mostly based, capture the impact of mitigation on GDP and other core economic variables while typically overlooking other effects that may matter (like improvements in air quality). Second, even though GDP (or better, GDP per capita) is not an indicator of welfare (Fleurbaey and Blanchet 2013), changes in GDP per capita across countries and over time are highly correlated with changes in welfare indicators in the areas of poverty, health, and education (Gable et al. 2015). The mechanisms linking mitigation to GDP outlined below would remain valid even with alternative indicators of well-being (Section 5.2.1). Third, another stream of literature criticises the pursuit of economic growth as a goal, instead advocating a range of alternatives and suggesting modelling of post-growth approaches to achieve rapid mitigation while improving social outcomes (Hickel et al. 2021). In the language of the present chapter, these alternatives constitute alternative development pathways.
Most country-level mitigation modelling studies in which GDP is an endogenous variable report negative impacts of mitigation on GDP in 2030 and 2050, relative to the reference (robust evidence, high agreement), for example (Nong et al. 2017) for Australia, (Chen et al. 2013) for Brazil, (Dai et al. 2016; Li et al. 2017; Dong et al. 2018; Mu et al. 2018a; Zhao et al. 2018; Cui et al. 2019) for China, (Álvarez-Espinosa et al. 2018) for Colombia, (Fragkos et al. 2017) for the EU, (Mittal et al. 2018) for India, (Fujimori et al. 2019) for Japan, (Veysey et al. 2014) for Mexico, (Pereira et al. 2016) for Portugal, (Alton et al. 2014; van Heerden et al. 2016) for South Africa, (Chunark et al. 2017) for Thailand, (Acar and Yeldan 2016) for Turkey, (Roberts et al. 2018b) for the UK, (Zhang et al. 2017; Chen and Hafstead 2019) for USA, (Nong 2018) for Vietnam (Figure 4.4). The downward relationship between mitigation effort and emissions is strong in studies up to 2030, much weaker for studies looking farther ahead. In all reviewed studies, however, GDP continues to grow even with mitigation. It may be noted that none of the studies assessed above integrates the benefits of mitigation in terms of reduced impacts of climate change or lower adaptation costs. This is not surprising since these studies are at national or regional scale and do not extend beyond 2050, whereas the benefits depend on global emissions and primarily occur after 2050. Discussion on reduced impacts is provided in Section 3.6.2 and Cross-Working Group Box 1 in Chapter 3.

Figure 4.4 | GDP against emissions in country-level modelling studies, in variations relative to reference.
Two major mechanisms interplay to explain the impact of mitigation on GDP. First, the carbon constraint imposes reduced use of a production factor (fossil energy), thus reducing GDP. In the simulations, the mechanism at work is that firms and households reduce their use of GHG-intensive goods and services in response to higher prices due to reduced fossil energy use. Second, additional investment required for mitigation partially crowds out productive investment elsewhere (Fujimori et al. 2019), except in Keynesian models in which increased public investment actually boosts GDP (Pollitt et al. 2015; Landa Rivera et al. 2016; Bulavskaya and Reynès 2018). Magnitude and duration of GDP loss depend on the stringency of the carbon constraint, the degree of substitutability with less-GHG-intensive goods and services, assumptions about costs of low-carbon technologies and their evolution over time (e.g., Duan et al. 2018; van Meijl et al. 2018; Cui et al. 2019) and decisions by trading partners, which influence competitiveness impacts for firms (Alton et al. 2014; Fragkos et al. 2017) ( high evidence, high agreement).
In the near term, presence of long-lived emissions intensive capital stock, and rigidities in the labour market (Devarajan et al. 2011) and other areas may increase impacts of mitigation on GDP. In the mid-term, on the other hand, physical and human capital, technology, institutions, skills or location of households and activities are more flexible. The development of renewable energy may help create more employment and demands for new skills, particularly in the high-skill labour market (Helgenberger, S. et al., 2019). In addition, cumulative mechanisms such as induced technical change or learning by doing on low-emissions technologies and process may reduce the impacts of mitigation on GDP.
Country-level studies find that the negative impacts of mitigation on GDP can be reduced if pre-existing economic or institutional obstacles are removed in complement to the imposition of the carbon constraint (robust evidence, high agreement). For example, if the carbon constraint takes the form of a carbon tax or of permits that are auctioned, the way the proceeds from the tax (or the revenues from the sales of permits) are used is critical for the overall macroeconomic impacts (Chen et al. 2013). (For a detailed discussion of different carbon pricing instruments, including the auctioning of permits, see Section 13.6.3).
Figure 4.5 shows that depending on the choice of how to implement a carbon constraint, the same level of carbon constraint can yield very different outcomes for GDP. The potential for mitigating GDP implications of mitigation through fiscal reform is discussed in Section 4.4.1.8.
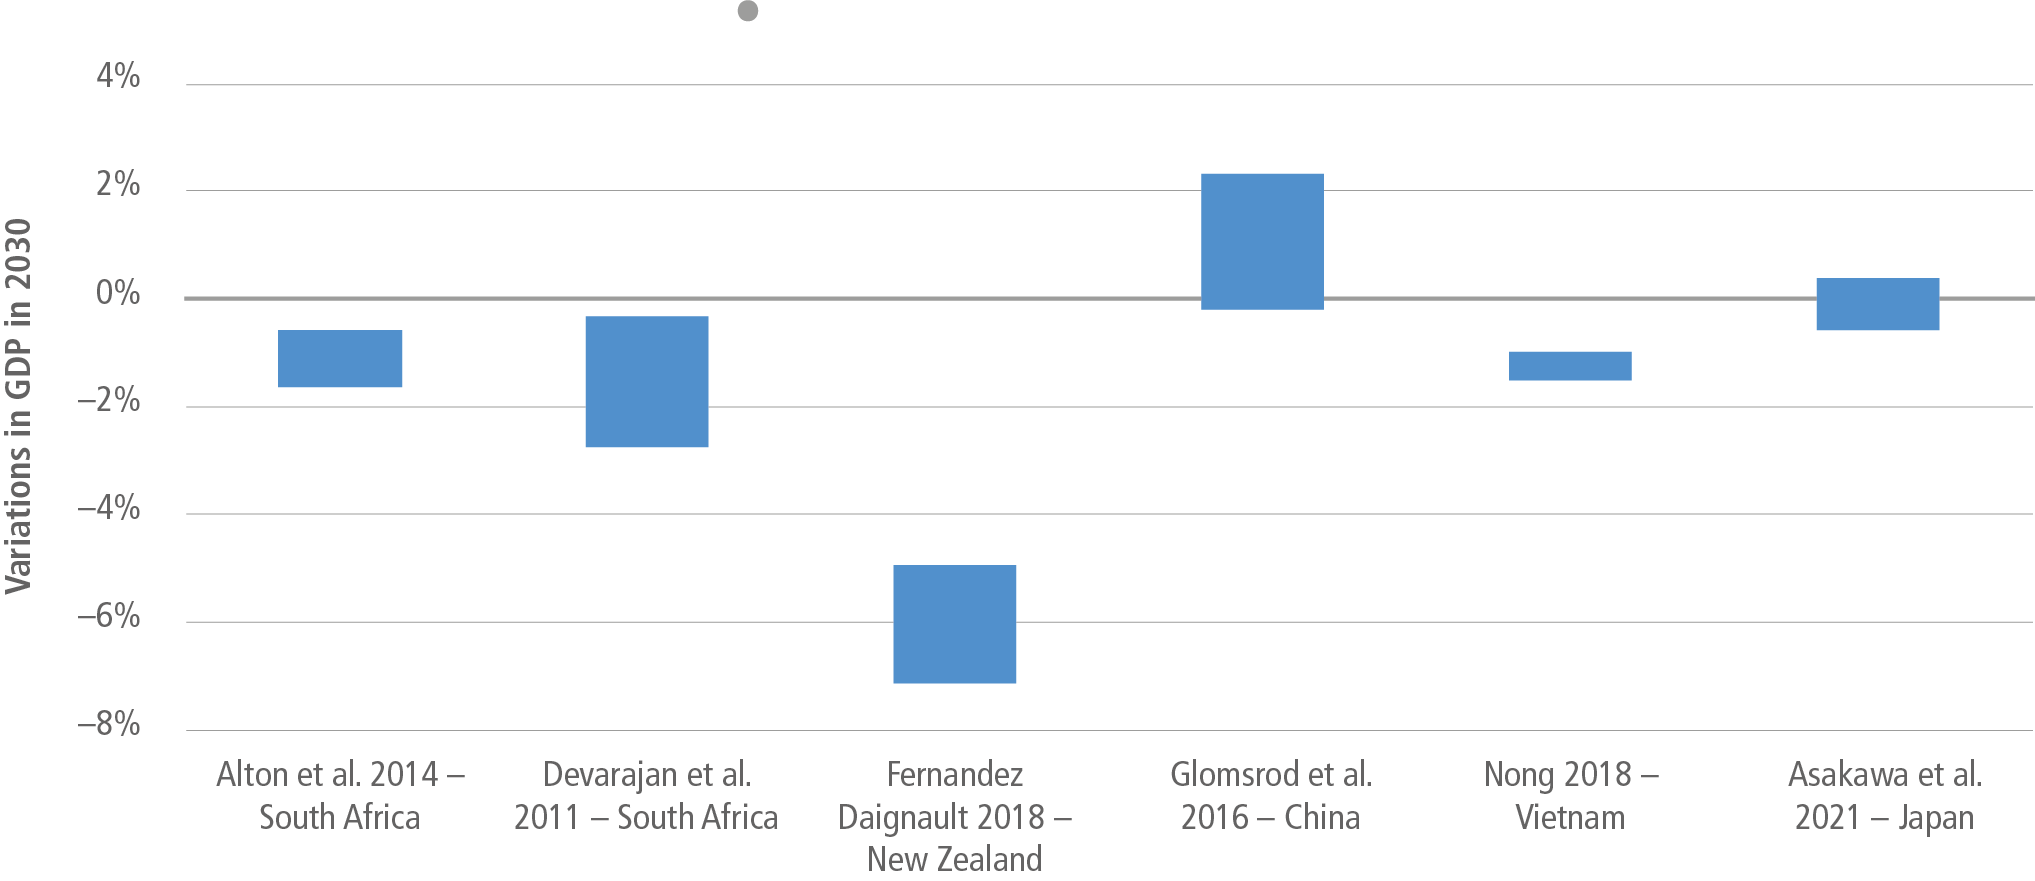
Figure 4.5 | Illustrative ranges of variations in GDP relative to reference in 2030 associated with introduction of carbon constraint, depending on modality of policy implementation. Source: based on Alton et al. (2014); Devarajan et al. (2011); Fernandez and Daigneault (2018); Glomsrød et al. (2016); Nong (2018); Asakawa et al. (2021). Stringency of carbon constraint is not comparable across the studies.
More generally, mitigation costs can be reduced by proper policy design if the economy initially is not on the efficiency frontier (Grubb 2014), defined as the set of configurations within which the quality of the environment and economic activity cannot be simultaneously improved given current technologies – such improvements in policy design may include reductions in distortionary taxes. Most of the studies which find that GDP increases with mitigation in the near term precisely assume that the economy is initially not on the frontier. Making the economy more efficient – in other words, lifting the constraints that maintain the economy in an interior position – creates opportunities to simultaneously improve economic activity and reduce emissions. Table 4.9 describes the underlying assumptions in a selection of studies.
Finally, marginal costs of mitigation are not always reported in studies of national mitigation pathways. Comparing numbers across countries is not straightforward due to exchange rate fluctuations, differing assumptions by modellers in individual country studies, etc. The database of national mitigation pathways assembled for this Report – which covers only a fraction of available national mitigation studies in the literature – shows that marginal costs of mitigation are positive, with a median value of 101 USD2010 tCO2–1 in 2030, 244 in 2040 and 733 in 2050 for median mitigation efforts of 21%, 46% and 76% relative to business-as-usual respectively. Marginal costs increase over time along accelerated mitigation pathways, as constraints become tighter, with a non-linearity as mitigation reaches 80% of reference emissions or more. Dispersion across and within countries is high, even in the near term but increases notably in the mid-term (medium evidence, medium agreement).
Table 4.9 | Examples of country-level modelling studies finding positive short-term outcome of mitigation on GDP relative to baseline.
Reference | Country/region | Explanation for positive outcome of mitigation on GDP |
Antimiani et al. (2016) | European Union | GDP increases relative to reference only in the scenario with global cooperation on mitigation. |
Kenya | The mitigation scenario introduces cheaper (geothermal) power generation units than in BAU (in which thermal increases). Electricity prices actually decrease. | |
Indonesia | Coal sector with low productivity is forced into BAU. Mitigation redirects investment towards sectors with higher productivity. | |
Saudi Arabia | Renewable energy penetration assumed to free oil that would have been sold at publicly subsidised price on the domestic market to be sold internationally at market price. | |
China | Analyse impacts of feed-in tariffs to renewables, find positive short-run impacts on GDP; public spending boost activity in the RE sector. New capital being built at faster rate than in reference increases activity more than activity decreases due to lower public spending elsewhere. | |
India | Savings adjust to investment and fixed unemployment is considered target of public policy, thereby limiting impact of mitigation on GDP relative to other economic variables (consumption, terms of trade). | |
China | Power generation plan in the baseline is assumed not cost minimising. |
4.2.6.3Mitigation and Employment in the Short- and Medium-term
Numerous studies have analysed the potential impact of carbon pricing on labour markets. Chateau et al. (2018) and OECD (2017a) find that the implementation of green policies globally (defined broadly as policies that internalise environmental externalities through taxes and other tools, shifting profitability from polluting to green sectors) need not harm total employment, and that the broad skill composition (low, high- and medium-skilled jobs) of emerging and contracting sectors is very similar, with the largest shares of job creation and destruction at the lowest skill level. To smoothen the labour market transition, they conclude that it may be important to reduce labour taxes, to compensate vulnerable households, and to provide education and training programs, the latter making it easier for labour to move to new jobs. Consistent with this, other studies that simulate the impact of scenarios with more or less ambitious mitigation policies (including 100% reliance on renewable energy by 2050) find relatively small (positive or negative) impacts on aggregate global employment that are more positive if labour taxes are reduced but encompass substantial losses for sectors and regions that today are heavily dependent on fossil fuels (Arndt et al. 2013; Huang et al. 2019; Vandyck et al. 2016; Jacobson et al. 2019). Among worker categories, low-skilled workers tend to suffer wage losses as they are more likely to have to reallocate, something that can come at a cost in the form of a wage cut (assuming that workers who relocate are initially less productive than those who already work in the sector). The results for alternative carbon revenue recycling schemes point to trade-offs: a reduction in labour taxes often leads to the most positive employment outcomes while lump-sum (uniform per-capita) transfers to households irrespective of income yield a more egalitarian outcome.
The results from country-level studies using CGE models tend be similar to those at global level. Aggregate employment impacts are small and may be positive especially if labour taxes are cut, see for example, Telaye et al. (2019) for Ethiopia,(Kolsuz and Yeldan (2017) for Turkey, Fragkos et al. (2017) for the EU, and Mu et al. (2018b) for China. On the other hand, sectoral reallocations away from fossil-dependent sectors may be substantial, see for example, Alton et al. (2014) for South Africa or Huang et al. (2019) for China. Targeting of investment to labour-intensive green sectors may generate the strongest employment gains, see, for example, Perrier and Quirion (2018) for France, van Meijl et al. (2018) for the Netherlands, and Patrizio et al. 2(018) for the USA. Changes in skill requirements between emerging and declining sectors appear to be quite similar, involving smaller transitions than during the IT revolution (Bowen et al. 2018).
In sum, the literature suggests that the employment impact of mitigation policies tends to be limited on aggregate, but can be significant at the sectoral level (medium evidence, medium agreement) and that cutting labour taxes may limit adverse effects on employment (limited evidence, medium agreement). Labour market impacts, including job losses in certain sectors, can be mitigated by equipping workers for job changes via education and training, and by reducing labour taxes to boost overall labour demand (Stiglitz et al. 2017) (Section 4.5).
Like most of the literature on climate change, the above studies do not address gender aspects. These may be significant since the employment shares for men and women vary across sectors and countries.
4.2.6.4Mitigation and Equity in the Near and Mid-term
Climate mitigation may exacerbate socio-economic pressures on poorer households (Jakob et al. 2014). First, the price increase in energy-intensive goods and services – including food (Hasegawa et al. 2018) – associated with mitigation may affect poorer households disproportionally (Bento 2013), and increase the number of energy-poor (Berry 2019). Second, the mitigation may disproportionally affect low-skilled workers (see previous section). Distributional issues have been identified not only with explicit price measures (carbon tax, emission permits system, subsidy removal), but also with subsidies for renewables (Borenstein and Davis 2016), and efficiency and emissions standards (Davis and Knittel 2019; Bruegge et al. 2019; Levinson 2019; Fullerton and Muehlegger 2019).
Distributional implications, however, are context specific, depending on consumption patterns (initially and ease of adjusting them in response to price changes) and asset ownership (see for example analysis of energy prices in Indonesia by Renner et al. 2019). In an analysis of the distributional impact of carbon pricing based on household expenditure data for 87 low- and middle-income countries, Dorband et al. (2019) find that, in countries with a per-capita income of up to USD15,000 per capita (purchasing power parity (PPP) adjusted), carbon pricing has a progressive impact on income distribution and that there may be an inversely U-shaped relationship between energy expenditure shares and per-capita income, rendering carbon pricing regressive in high-income countries, in other words, in countries where the capacity to pursue compensatory policies tends to be relatively strong.
The literature finds that the detailed design of mitigation policies is critical for their distributional impacts (robust evidence, high agreement). For example, Vogt-Schilb et al. (2019) suggest to turn to cash transfer programs, established as some of the most efficient tools for poverty reduction in developing countries. In an analysis of Latin America and the Caribbean, they find that allocation of 30% of carbon revenues would suffice to compensate poor and vulnerable households on average, leaving the rest for other uses. This policy tool is not only available in countries with relatively high per-capita incomes: in Sub-Saharan Africa, where per-capita incomes are relatively low, cash transfer programs have been implemented in almost all countries (Beegle et al. 2018, p. 57), and are found central to the success of energy subsidy reforms (Rentschler and Bazilian 2017). In the same vein, Böhringer et al. (2021) finds that recycling of revenues from emissions pricing in equal amounts to every household appeals as an attractive strategy to mitigate regressive effects and thereby make stringent climate policy more acceptable on societal fairness grounds. However, distributional gains from such recycling may come at the opportunity cost of not reaping efficiency gains from reductions in the taxes that are most distortionary (Goulder et al. 2019).
Distributional concerns related to climate mitigation are also prevalent in developed countries, as demonstrated, for instance, by France’s recent yellow-vest movement, which was ignited by an increase in carbon taxes. It exemplifies the fact that, when analysing the distributional effects of carbon pricing, it is not sufficient to consider vertical redistribution (i.e., redistribution between households at different incomes levels but also horizontal redistribution (i.e., redistribution between households at similar incomes which is due to differences in terms of spending shares and elasticities for fuel consumption). Compared to vertical redistribution, it is more difficult to devise policies that effectively address horizontal redistribution (Cronin et al. 2019; Pizer and Sexton 2019; Douenne 2020). However, it has been shown ex post that transfer schemes considering income levels and location could have protected or even improved the purchasing power of the bottom half of the population (Bureau et al. 2019). Investments in public transportation may reduce horizontal redistribution if it makes it easier for households to reduce fossil fuel consumption when prices increase (see Sections 4.4.1.5 and 4.4.1.9). Similarly, in relation to energy use in housing, policies that encourage investments that raise energy efficiency for low-income households may complement or be an alternative to taxes and subsidies as a means of simultaneously mitigating and reducing fuel poverty (Charlier et al. 2019). From a different angle, public acceptance of the French increase in the carbon tax could also have been enhanced via a public information campaign could have raised public acceptance of the carbon tax increase (Douenne and Fabre 2020). (See Section 4.4.1.8 for a discussion of this and other factors that influence public support for carbon taxation.)
4.2.7Obstacles to Accelerated Mitigation and How Overcoming Them Amounts to Shifts in Development Pathways
As outlined in Sections 4.2.3, 4.2.4, 4.2.5 and 4.2.6 there is improved understanding since AR5 of what accelerated mitigation would entail in the coming decades. A major finding is that accelerated mitigation pathways in the near to mid-term appear technically and economically feasible in most contexts. Chapter 4, however, cannot stop here. Section 4.2.2 has documented an important policy gap for current climate pledges, and Cross-Chapter Box 4 in this chapter shows an even larger ambition gap between current pledges and what would be needed in the near term to be on pathways consistent with below 2°C, let alone 1.5°C. In other words, while the implementation of mitigation policies to achieve updated NDC almost doubles the mitigation efforts, and notwithstanding the widespread availability of the necessary technologies, this doubling of effort merely narrows the gap to pathways consistent with 2°C by at most 20%.
Obstacles to the implementation of accelerated mitigation pathways can be grouped in four main categories (Table 4.10). The first set of arguments can be understood through the lens of cost-benefit analysis of decision-makers, as they revolve around the following question: Are costs too high relative to benefits? More precisely, are the opportunity costs – in economics terms, what is being forfeited by allocating scarce resources to mitigation – justified by the benefits for the decision-maker (whether individual, firm, or nation)? This first set of obstacles is particularly relevant because accelerated mitigation pathways imply significant effort in the short-run, while benefits in terms of limited warming accrue later and almost wholly to other actors. However, as discussed in Sections 3.6 and 4.2.6, mitigation costs for a given mitigation target are not carved in stone. They strongly depend on numerous factors, including the way mitigation policies have been designed, selected, and implemented, the processes through which markets have been shaped by market actors and institutions, and nature of socially- and culturally-determined influences on consumer preferences. Hence, mitigation choices that might be expressed straightforwardly as techno-economic decisions are, at a deeper level, strongly conditioned by underlying structures of society.
A second set of likely obstacles in the short-term to accelerated mitigation revolves around undesirable distributional consequences, within and across countries. As discussed in Section 4.2.6.3, the distributional implications of climate policies depend strongly on their design, the way they are implemented, and on the context into which they are inserted. Distributional implications of climate policies have both ethics and equity dimensions, to determine what is desirable/acceptable by a given society in a given context, notably the relative power of different winners and losers to have their interests taken into account, or not, in the relevant decision-making processes. Like costs, distributional implications of accelerated mitigation are rooted in the underlying socio-political-institutional structures of a society.
A third set of obstacles are about technology availability and adoption. Lack of access even to existing cost-effective mitigation technologies remains an important issue, particularly for many developing countries, and even in the short-term. Though it relates most directly to techno-economic costs, technology availability raises broader issues related to the socio-technical systems within which innovation and adoption are embedded, and issues of technology availability are inherently issues of systemic failure (Section 16.3). The underlying legal, economic and social structures of the economy are central to the different stages of socio-transition processes (Cross-Chapter Box 12 in Chapter 16).
The last set of obstacles revolves around the unsuitability of existing structures to accelerated mitigation. We include here all forms of established structures, material (e.g., physical capital) or not (institutions, social norms, patterns of individual behaviour), that are potentially long-lived and limit the implementation of accelerated mitigation pathways. Typically, such structures exist for reasons other than climate change and climate mitigation, including the distribution of power among various actors. Modifying them in the name of accelerated climate mitigation thus requires to deal with other non-climate issues as well. For example, resolving the landlord-tenant dilemma, an institutional barrier to the deployment of energy efficiency in building, opens fundamental questions on private property in buildings.
Acommon thread in the discussion above is that the obstacles to accelerated mitigation are to a large degree rooted in the underlying structural features of societies. As a result, transforming those underlying structures can help to remove those obstacles, and thus facilitate the acceleration of mitigation. This remark is all the more important that accelerated mitigation pathways, while very different across countries, all share three characteristics: speed of implementation, breadth of action across all sectors of the economy, and depth of emission reduction achieving more ambitious targets. Transforming those underlying structures amounts to shifting a society’s development pathway (Figure 4.6). In the following Sections 3 and 4, we argue that it is thus necessary to recast accelerated mitigation in the broader context of shifting development pathways, and that doing so opens up additional opportunities to (i) overcome the obstacles outlined above, and also (ii) combine climate mitigation with other development objectives.

Figure 4.6 | Obstacles to mitigation (top panel) and measures to remove these obstacles and enable shift in development pathways (lower panel).
Table 4.10 | Objections to accelerated mitigation and where they are assessed inthe WG3 report.
Category | Main dimensions | Location in AR6 WGIII report where objection is assessed and solutions are discussed |
Costs of mitigation | Marginal, sectoral or macroeconomic costs of mitigation too high; scarce resources could/should be used for other development priorities; mitigation benefits are not worth the costs (or even non-existent); lack of financing | Sections 3.6, 4.2.6, 12.2; Chapter 15, Chapter 17 |
Distributional implications | Risk of job losses; diminished competitiveness; inappropriate impact on poor/vulnerable people; negative impact on vested interests | Section 4.5; Chapter 5, Chapter 13, Chapter 14 |
Lack of technology | Lack of suitable technologies; lack of technology transfer; unfavourable socio-political environment | Section 4.2.5, Chapter 16 |
Unsuitable ‘structures’ | Inertia of installed capital stock; inertia of socio-technical systems; inertia to behaviour change; unsuitable institutions | Section 3.5; Chapter 5, Chapter 13 |
4.3 Shifting Development Pathways
4.3.1Framing of Development Pathways
4.3.1.1What are Development Pathways?
The term development pathway is defined in various ways in the literature, and these definitions invariably refer to the evolution over time of a society’s defining features. A society’s development pathway can be described, analysed, and explained from a variety of perspectives, capturing a range of possible features, trends, processes, and mechanisms. It can be examined in terms of specific quantitative indicators, such as population, urbanisation level, life expectancy, literacy rate, GDP, carbon dioxide emission rate, average surface temperature, etc. Alternately, it can be described with reference to trends and shifts in broad socio-political or cultural features, such as democratisation, liberalisation, colonisation, globalisation, consumerism, etc. Or, it can be described in a way that highlights and details a particular domain of interest; for example, as an ‘economic pathway’, ‘technological pathway’, ‘demographic pathway’, or others. Any such focused description of a pathway is more limited, by definition, than the general and encompassing notion of a development pathway.
Development pathways represent societal evolution over time, and can be assessed retrospectively and interpreted in a historical light, or explored prospectively by anticipating and assessing alternative future pathways. Development pathways, and prospective development pathways in particular, can reflect societal objectives, as in ‘low-emission development pathways’, ‘climate-resilient development pathways’, ‘sustainable development pathways’, ‘inclusive development pathway’, and as such can embed normative assumptions or preferences, or can reflect potential dystopian futures to be avoided. A national development plan (Section 4.3.2) is a representation of a possible development pathway for a given society reflecting its objectives, as refracted through its development planning process.
One approach for exploring shifts in future development pathways is through scenarios. Some examples of scenario exercises in the literature are provided in Table 4.11.
Different narratives of development pathways can have distinct and even competing focuses such as economic growth, shifts in industrial structure, technological determinism, and can embody alternative framings of development itself (from growth to well-being, see Chapter 5), and of sustainable development in particular (Sections 1.6 and 17.1). Scenario exercises are structured undertakings to explore alternative future development pathways, often drawing on stakeholder input and accepting the deep and irreducible uncertainty inherent in societal development into the future (Schweizer and Kriegler 2012; Kahane 2012; Raskin and Swart 2020). The results of scenario explorations, including modelling exercises, thus help clarify the characteristics of a particular future pathway, in light of a particular set of assumptions and choice of indicators for assessment. Processes of developing scenarios can inform choices by decision makers of various kinds.
Scenarios are useful to clarify societal objectives, understand constraints, and explore future shifts. Scenario exercises are effective when they enable multi-dimensional assessment, and accommodate divergent normative viewpoints (Kowarsch et al. 2017). Such processes might take into account participants’ explicit and implicit priorities, values, disciplinary backgrounds, and world views. The process of defining and describing a society’s development pathway contributes to the ongoing process of understanding, explaining and defining the historical and contemporary meaning and significance of a society. The imagination of facilitated stakeholder process combined with the rigour of modelling helps improve understanding of constraints, trade-offs, and choices. ‘Scenario analysis offers a structured approach for illuminating the vast range of possibilities. A scenario is a story, told in words and numbers, describing the way events might unfold. If constructed with rigor and imagination, scenarios help us to explore where we might be headed, but more, offering guidance on how to act now to direct the flow of events toward a desirable future’ (Raskin et al. 2002). Scenario processes are valuable for the quantitative and qualitative insights they can provide, and also for the role they can play in providing a forum and process by which diverse institutions and even antagonistic stakeholders can come together, build trust, improve understanding, and ultimately converge in their objectives (Kane and Boulle 2018; Dubash 2021).
Table 4.11 | Prospective development pathways at global, national and local scale.
Scale | Process and publication | Description of development pathways |
Global | IPCC Special Report on Emission Scenarios (Nakicenovic et al. 2000) | Four different narrative storylines describing relationships between driving forces and the evolution of emission scenarios over the 21st century. |
Global | Shared Socio-economic Pathways (SSPs) | Five narratives describing alternative socio-economic developments, including sustainable development, regional rivalry, inequality, fossil-fuelled development, and middle-of-the-road development, using alternative long-term projections of demographics, human development, economy and lifestyle, policies and institutions, technology, and environment and natural resources. |
Global | Income inequality projections for SSPs (Rao et al. 2019) | Alternative development pathways that explore several drivers of rising or falling inequality. |
Global | Futures of Work | Eight possible visions of the future of work in the year 2030, based on different combinations of three core variables: the rate of technological change and its impact on business models, the evolution of learning among the current and future workforce, and the magnitude of labour mobility across geographies – all of which are likely to strongly influence the nature of work in the future. |
National | Mont Fleur Scenarios | Four socio-political scenarios intended to explore possible futures of a newly post-apartheid South Africa, which included three dark prophecies and one bright vision which reportedly influenced the new leadership. |
National | Mitigation Action Plans and Scenarios (MAPS) (Winkler et al. 2017; Raubenheimer et al. 2015) | Mitigation and development-focused scenarios for Brazil, Chile, Peru, and Colombia, entailing linked sectoral and economy modelling including socio-economic implications, combined with intensive stakeholder engagement. |
National | Deep Decarbonisation Pathways (Bataille et al. 2016a; Waisman et al. 2019) | Mitigation-focused scenarios for sixteen countries from each country’s perspective, carried out by local institutes using national models. The common method is a tool for decision-makers in each context to debate differing concrete visions for deep decarbonisation, seek consensus on near-term policy packages, with aim to contribute to long-term global decarbonisation. |
Local | New Lenses on Future Cities | Six city archetypes used to create scenarios to help understand how cities could evolve through more sustainable urbanisation processes and become more efficient, while coping with major development challenges in the past. |
4.3.1.2 Shifting Development Pathways
Development pathways evolve as the result of the countless decisions and actions at all levels of societal structure, as well due to the emergent dynamics within and between institutions, cultural norms, socio-technological systems, and the biogeophysical environment. Society can choose to make decisions and take actions with the shared intention of influencing the future development pathway toward specific agreed objectives.
The SDGs provide a lens on diverse national and local development objectives. Humankind currently faces multiple sustainability challenges that together present global society with the challenge of assessing, deliberating, and attempting to bring about a viable, positive future development pathway. Ecological sustainability challenges include reducing GHG emissions, protecting the ozone layer, controlling pollutants such as aerosols and persistent organics, managing nitrogen and phosphorous cycles, etc. (Steffen et al. 2015), which are necessary to address the rising risks to biodiversity and ecosystem services on which humanity depends (IPBES 2019a). Socio-economic sustainability challenges include conflict, persistent poverty and deprivation, various forms of pervasive and systemic discrimination and deprivation, and socially corrosive inequality. The global adoption of the SDGs and their underlying indicators (UN 2017, 2018 and 2019) reflect a negotiated prioritisation of these common challenges.
Figure 4.7 illustrates the process of shifting development pathways. The lines illustrate different possible development pathways through time, some of which (shown here toward the top of the figure) remove obstacles to the adoption and effective implementation of sustainable development policies, and thus give access to a rich policy toolbox for accelerating mitigation and achieving SDGs. Other development pathways (shown here toward the bottom of the figure) do not overcome, or even reinforce the obstacles to adopting and effectively implementing sustainable development policies, and thus leave decision-makers with more limited policy toolbox (Section 4.2.7 and Figure 4.6). A richer tool box enables faster, deeper and broader mitigation.

Figure 4.7 | Shifting development pathways to increased sustainability: choices by a wide range of actors at key decision points on development pathways can reduce barriers and provide more tools to accelerate mitigation and achieve other Sustainable Development Goals.
The development pathways branch and branch again, signifying how a diversity of decision-makers (policymakers, organisations, investors, voters, consumers, etc.) are continuously making choices that influence which of many potential development pathways society follows. Some of these choices fall clearly within the domain of mitigation policy. For example, what level carbon price, if any, should be imposed? Should fossil fuel subsidies be removed? Most decisions, of course, fall outside the direct domain of mitigation policy. Shifting development pathways toward sustainability involves this broader realm of choices beyond mitigation policy per se, and requires identifying those choices that are important determinants of the existing obstacles to accelerating mitigation and meeting other SDGs. Addressing these choices coherently shifts the development pathway away from a continuation of existing trends.
4.3.1.3Expanding the Range of Policies and Other Mitigative Options
Shifting development pathways aims to influence the ultimate drivers of emissions (and development generally), such as the systemic and cultural determinants of consumption patterns, the political systems and power structures that govern decision-making, the institutions and incentives that guide and constrain socio-technical innovation, and the norms and information platforms that shape knowledge and discourse, and culture, values and needs (Raskin et al. 2002). These ultimate drivers determine the mitigative capacity of a society.
Decision-makers might usefully consider a broader palette of policies and measures as part of an overall strategy to meet climate goals and other sustainable development goals (Section 4.3.2 and Table 4.12). This is consistent with the fact that mitigation is increasingly understood to be inseparable from broader developmental goals, which can be facilitated by policy coherence and integration with broader objectives and policies sectorally and societally. This is supported by other observations that mitigation measures based on conventional climate policy instruments, such as emissions taxes or permits, price incentives such as feed-in tariffs for low-carbon electricity generation, and fuel economy standards, and building codes, which aim to influence the proximate drivers of emissions alone will not achieve the long-term goals of the Paris Agreement (Méjean et al. 2015; Rogelj et al. 2016; IPCC 2018a; UNEP 2018). An approach of shifting development pathways to increased sustainability (SDPS) broadens the scope for mitigation.
4.3.1.4An Approach of SDPS Helps Manage Trade-offs Between Mitigation and Other SDGs
Beyond removing structural obstacles to accelerated mitigation, broadening the approach to policies that facilitate shifts in development pathways also helps manage the potential trade-offs between mitigation and other development objectives discussed in Section 4.2.7.
Systematic studies of the 17 SDGs have found the interactions among them to be manifold and complex (Nilsson et al. 2016; Pradhan et al. 2017; Weitz et al. 2018; Fuso Nerini et al. 2019). Addressing them calls for interventions affecting fundamental, interconnected, structural features of global society (International Panel on Social Progress 2018; TWI2050 – The World in 2050 2018), such as to our physical infrastructure (e.g., energy, water, industrial, urban infrastructure) (Waage et al. 2015; Adshead et al. 2019; Chester 2019; Mansell et al. 2019; Thacker et al. 2019; ), our societal institutions (e.g., educational, public health, economic, innovation, and political institutions) (Ostrom 2010; Kläy et al. 2015; Messner 2015; Sachs et al. 2019), and behavioural and cultural tendencies (e.g., consumption patterns, conventional biases, discriminatory interpersonal and intergroup dynamics, and inequitable power structures) (Esquivel 2016; Sachs et al. 2019). These observations imply that attempt to address each SDG in isolation, or as independent technical challenges, would be insufficient, as would incremental, marginal changes. In contrast, effectively addressing the SDGs is likely to mean significant disruption of long-standing trends and transformative progress to shift development pathways to meet al. the SDGs, including climate action, beyond incremental changes targeted at addressing mitigation objectives in isolation. In other words, mitigation conceived as incremental change is not enough. Transformational change has implications for equity in its multiple dimensions ( Steffen and Stafford Smith 2013; Klinsky et al. 2017a; Leach et al. 2018) including just transitions (Section 4.5).
Working Group II examines climate resilient development pathways (CRDP) – continuous processes that imply deep societal changes and/or transformation, so as to strengthen sustainable development, efforts to eradicate poverty and reduce inequalities while promoting fair and cross-scalar capacities for adaptation to global warming and reduction of GHG emissions in the atmosphere. Transformative action in the context of CRDP specifically concerns leveraging change in the five dimensions of development (people, prosperity, partnership, peace, planet) (AR6 WGII, Chapter 18).
Section 4.3.2 provides more details on the way development pathways influence emissions and mitigative capacity. Section 4.3.3 provides examples of shifts in development pathways, as well as of policies that might facilitate those. Cross-Chapter Box 5 in this chapter details the links between SDPS and sustainability.
4.3.2Implications of Development Pathways for Mitigation and Mitigative Capacity
4.3.2.1Countries Have Different Development Priorities
At the global level, the SDGs adopted by all the United Nations Member States in 2015 are delineated with a view to end poverty, protect the planet and ensure that all people enjoy peace and prosperity by 2030. The 17 SDGs are integrated and imply that development must balance social, economic and environmental sustainability.
While all countries share the totality of the SDGs, development priorities differ across countries and over time. These priorities are strongly linked to local contexts, and depend on which dimensions of improvements in the well-being of people are considered the most urgent.
Development priorities are reflected in the decisions that actors within societies make, such as policy choices by governments and parliaments at all levels, votes over competing policy platforms by citizens, or selection of issues that non-state actors push for. Multiple objectives range from poverty eradication to providing energy access, addressing concerns of inequality, providing education, improving health, cleaning air and water, improving connectivity, sustaining growth and providing jobs, among others. For example, eradicating poverty and reducing inequality is a key development priority across many countries, such as Brazil (Grottera et al. 2017), Indonesia (Irfany and Klasen 2017), India (GoI 2015), South Africa (Winkler 2018) and other low- and middle-income countries (Dorband et al. 2019). Reducing inequality relates not only to income, but also to other dimensions such as in access to energy services (Tait 2017), gender, education, racial and ethnic profiles (Andrijevic et al. 2020), and thereby assumes relevance in both developing and developed countries. The development priorities of many poor countries and communities with low capacities to adapt, has been focused more on reducing poverty, providing basic infrastructure, education and improving health, rather than on mitigation (Chimhowu et al. 2019).
4.3.2.2The Nature of National Development Plans Is Changing
Governments are increasingly resorting to the development of national plans to build institutions, resources, and risk/shock management capabilities to guide national development. The number of countries with a national development plan has more than doubled, from about 62 in 2006 (World Bank 2007) to 134 plans published between 2012 and 2018 (Chimhowu et al. 2019). The comeback of planning may be linked to increased consideration given to sustainability, which is by construction forward-looking and far ranging, and therefore requires state and civil society to prepare and implement plans at all levels of governance. Governments are increasingly engaging in the development and formulation of national plans in an organised, conscious and continual attempt to select the best available alternatives to achieve specific goals.
A systematic assessment of 107 national development plans and 10 country case studies provides useful insights regarding the type and content of the plans (Chimhowu et al. 2019). development plans are increasingly focusing on mobilising action across multiple actors and multiple dimensions to enhance resilience and improve the ability to undertake stronger mitigation actions. Various initiatives such as the World Summit for Children in 1990; the Heavily Indebted Poor Country initiative that started offering debt relief in exchange for commitments by beneficiary states to invest in health, education, nutrition and poverty reduction in 1996; and push towards Comprehensive Development Frameworks seem to have catalysed the development of national actions plans across countries to estimate, measure and track investments and progress towards SDGs.
The most recent development plans also tend to differ from the earlier ones in terms of their approach. Complexity science has over the years argued for new forms of planning based on contingency, behaviour change, adaptation and constant learning (Colander and Kupers 2016; Ramalingam, 2013), and new plans have increasingly focused on increasing resilience of individuals, organisations and systems (Hummelbrunner and Jones, 2013). Finally, alongside short-term (typically five year) plans with operational purpose, countries have also expressed visions of their development pathways over longer time horizons, via, for example, Voluntary National Reviews submitted in the context of the UN High Level Political Forum on Sustainable Development.
National development plans are also increasingly more holistic in their approach, linking closely with SDGs and incorporating climate action in their agendas. For instance, the Low Carbon Development Initiative (LCDI), launched in 2017 by the Government of Indonesia, seeks to identify the development policies that can help Indonesia achieve multiple (social, economic, and environmental) goals simultaneously along with preserving and improving the country’s natural resources (Bappenas 2019). Likewise, Nepal’s Fifteenth Plan (five-year) recognises the need for climate mitigation and adaptation and corresponding access to international finance and technologies. The plan suggests mobilisation of foreign aid in the climate change domain in line with Nepal’s priorities and its inclusion in the country’s climate-friendly development programs as the key opportunities in this regard (Nepal 2020).
China’s development plans have evolved over time from being largely growth oriented, and geared largely towards the objectives of addressing poverty, improving health, education and public well-being to also including modernisation of agriculture, industry and infrastructure, new forms of urbanisation and a clear intent of focusing on innovation and new drivers of development (Central Compilation & Translation Press 2016). China’s 14th Five Year Plan not only seeks to promote high quality development in all aspects and focus on strengthening the economy in the global industrial chain, but also includes a vision of an ‘ecological civilisation’, which had been developed (CPC-CC 2015) and analysed earlier (He 2016; Xiao and Zhao 2017). It seeks to enhance China’s climate pledge to peak CO2 emissions by 2030 and achieve carbon neutrality by 2060 through more vigorous policies and measures. Development plans tie in multiple development priorities that evolve and broaden over time as societies develop, as exemplified inter alia by the history of development plans in India (Box 4.4).
Box 4.4 | India’s National Development Plan
India’s initial national development plans focused on improving the living standards of its people, increasing national income and food self-sufficiency. Accordingly, there was a thrust towards enhancing productivity of the agricultural and industrial sectors. While the main focus was on maintaining high economic growth and industrial productivity, poverty eradication, employment and inclusive growth remained important priorities. The National Action Plan on Climate Change with eight National Missions focusing on mitigation as well as adaptation was launched in 2008 integrating climate change considerations in planning and decision-making (MoEF 2008). The 12th Five-Year Plan (2012–2017) also brought in a focus on sustainability and mentioned the need for faster, sustainable and inclusive growth. The National Institution for Transforming India (NITI Aayog) was set up in 2017 replacing the erstwhile Planning Commission, with a renewed focus towards bringing innovation, technology, enterprise and efficient management together at the core of policy formulation and implementation. However, while India has moved away from its Five-Year Plans, decision-making is more dynamic, with a number of sector-specific initiatives and targets focused on integrating sustainability dimensions through a series of policies and measures supporting resource efficiency, improved energy access, infrastructure development, low-carbon options and building resilient communities, among other objectives (MoEFCC 2018, 2021). India’s overall development pathway currently has a strong focus on achieving robust and inclusive growth to ensure balanced development across all regions and states and across sectors. There is a thrust on embracing new technologies while fostering innovation and upskilling, modernisation of agriculture, improving regional and interpersonal equity, bridging the gap between public and private sector performance, by focusing on efficient delivery of public services, rooting out corruption and black economy, formalising the economy and expanding the tax base, improving the ease of doing business, nursing the stressed commercial banking sector back to a healthy state, and stopping leakages through direct benefit transfers, among other measures (GoI 2015, 2018; MoEFCC 2021).
4.3.2.3Development Pathways Shape Emissions and Capacities to Mitigate
Analysis in the mitigation literature often frames mitigation policy as having development co-benefits, the main objective being climate stabilisation. This misses the point that development drives emissions, and not vice versa, and it is the overall development approach and policies that determine mitigation pathways (Munasinghe 2007). A large body of literature supports the fact that development pathways have direct and, just as importantly, indirect implications for GHG emissions (Nakicenovic et al. 2000; Winkler 2017b), through multiple channels, such as the nature of economic activity, spatial patterns of development, degree of inequality, and population growth.
Economic structure: Chapter 2 notes that overall, affluence (GDP per capita), economic growth and population growth have remained the main upward drivers of CO2 emissions from fossil-fuel combustion in the past decade, with energy efficiency the main countervailing force (Lin and Liu 2015; Wang and Feng 2017) (Section 2.4). A major component of the development pathway of a country is precisely the nature of the economic activities on which the country relies (e.g., agriculture and mining, heavy industry, services, high-tech products, etc.) as well as the way it articulates its economy with the rest of the World (e.g., export-led growth vs import substitution strategies). Hence, the development pathway ultimately drives the underlying structure of the economy, and to a large degree the relationship between activity and GHG emissions.
At country level, however, the picture is more nuanced. Both India and China show signs of relative decoupling between GDP and emissions because of structural change (Chen et al. 2018a). Sumabat et al. (2016) indicate that economic growth had a negative impact on CO2 emissions in Philippines. Baek and Gweisah (2013) find that CO2 emissions tend to drop monotonously as incomes increased. Lantz and Feng (2006) also indicate that per capita GDP is not related to CO2 emissions in Canada. Other studies point to an emerging consensus that the relationship between CO2 emissions and economic indicators depends on the level of development of countries (Nguyen and Kakinaka 2019; Sharma 2011). While some literature indicates that absolute decoupling of economic growth and GHG emissions has occurred in some countries (Le Quéré et al. 2019), a larger systematic review found limited evidence of this (Haberl et al. 2020).
Looking ahead, choices about the nature of economic activities are expected to have significant implications for emissions. For example, a development pathway that focuses on enhancing economic growth based on manufacturing is likely to lead to very different challenges for mitigation compared to one that focuses on services-led growth. (Quéré et al. 2018) find that choices about whether or not to export offshore oil in Brazil will have significant implications for the country’s GHG emissions. Similarly, in China, transforming industrial structure towards tertiary sectors (Kwok et al. 2018) and restructuring exports towards higher value-added products (Wu et al. 2019) are expected to have significant implications for GHG emissions.
Spatial patterns of development: Chapter 2 notes that rapid urbanisation in developing and transition countries leads to increased CO2 emissions, the substantial migration of rural populations to urban areas in these countries being the main factor leading to increased levels of income and expenditure of new urban dwellers which in turn leads to increased personal carbon footprints and overall emissions (Section 2.4). Urbanisation, and more broadly spatial patterns of development, are in turned driven to a large part by development choices, such as, inter alia, spatial provision of infrastructure and services, choices regarding the agriculture and forestry sector, land-use policies, support to regional/local development, among others (World Bank 2009). For example, Dorin (2017) points out that if agriculture sectors in Africa and India follow the same development path that developed countries have followed in the past, namely increased labour productivity through enlargement and robotisation of farms, then unprecedented emigrations of rural workers towards cities or foreign countries will ensue, with large-scale social, economic and environmental consequences. Looking ahead, a development pathway that encourages concentrated influx of people to large urban centres will lead to very different energy and infrastructure consumption patterns than a pathway that prioritises the development of smaller, self-contained towns and cities.
Degree of inequality: Chapter 2 notes that while eradicating extreme poverty and providing universal access to modern energy services to poor populations across the globe has negligible implications for emissions growth, existing studies on the role of poverty and inequality as drivers of GHG emissions provide limited evidence that under certain contexts greater inequality can lead to a deterioration in environmental quality and may be associated with higher GHG emissions (Section 2.4). In fact, factors affecting household consumption-based emissions include household size, age, education attainment, employment status, urban vs rural location and housing stock (Druckman and Jackson 2015). There is evidence to indicate that at the household level, the increase in emissions from additional consumption of the lower income households could be larger than the reduction in emissions from the drop in consumption from the high income households (Sager 2019). Accordingly, as countries seek to fulfil the objective of reducing inequality, there are possibilities of higher increase in emissions (Sager 2019).
Since reducing inequality, as noted above, is globally one of the main development priorities, a large body of literature focuses on the compatibility of climate change mitigation and reduction in economic inequality (Baek and Gweisah 2013; Auffhammer and Wolfram 2014; Berthe and Elie 2015; Hao et al. 2016; Grunewald et al. 2017; Wiedenhofer et al. 2017). However, the use of narrow approaches or simple methods of studying the relationships of income inequality and emissions by looking at correlations, may miss important linkages. For example, the influence of inequality on social values such as status and civic mindedness and non-political interests that shape environmental policy can influence overall consumption and its environmental impacts (Berthe and Elie 2015). Moreover, inequalities may also be reflected in gender, education, racial and ethnic profiles and could accordingly be associated with the level of emissions and mitigation prospects (Andrijevic et al. 2020).
The Illustrative Mitigation Pathways (IMP) developed for this Report (Box 3.1 and Section 3.2.5) provide another example of how development pathways influence mitigative capacity. Precisely, IMP1.5-SP (Shifting Pathways) and 1.5-Ren (Renewables) lead to the same long-term temperature, but differ in underlying socio-economic conditions. The former is based on Shared Socio-economic Pathway (SSP) 1 (sustainable development), whereas the latter is based on SSP2 (middle of the road). Comparing 1.5-Ren to 1.5-SP can thus be interpreted as a numerical translation of trying the reach the same long-term temperature goal without and with shifting development pathways towards sustainability. Data shows that the global price of carbon necessary to remain on target is 40–50% lower in the latter relative to the former, thus indicating that mitigation is cheaper with a shift in development pathway towards sustainability. Other cost indicators (e.g. consumption loss or GDP loss) tell the same story. Since both IMPs were computed using the same underlying model, the comparison is even more robust.
In sum, development pathways can lead to different emission levels and different capacities and opportunities to mitigate (medium evidence, high agreement). Thus, focusing on shifting development pathways can lead to larger systemic sustainability benefits.
4.3.2.4Integrating Mitigation Considerations Requires Non-marginal Shifts in Development Pathways
Concerns about mitigation are already being introduced in national development plans, as there is evidence that development strategies and pathways can be carefully designed so as to align towards multiple priorities and achieve greater synergistic benefits. For example, India’s solar programme is a key element in its NDC that can in the long run, not only provide energy security and contribute to mitigation, but can simultaneously contribute to economic growth, improved energy access and additional employment opportunities, if appropriate policies and measures are carefully planned and implemented. However, the environmental implications of the transition need to be carefully examined with regard to the socio-economic implications in light of the potential of other alternatives like green hydrogen, nuclear or carbon capture, use and storage (CCUS). Similarly, South Africa National Development Plan (2011) also integrates transition to low-carbon as part of the country development objectives (Box 4.5).
Box 4.5 | South Africa’s National Development Plan
South Africa adopted its first National Development Plan (NDP) in 2011 (NPC 2011), the same year in which the country adopted climate policy (RSA 2011) and hosted COP17 in Durban. Chapter 5 of the NDP addresses environmental sustainability in the context of development planning, and specifically ‘an equitable transition to a low-carbon economy’ (NPC 2011). The chapter refers explicitly to the need for a just transition, protecting the poor from impacts and any transitional costs from emissions-intensive to low-carbon. The plan proposes several mitigation measures, including a carbon budgeting approach, reference to Treasury’s carbon tax, use of various low-carbon options while maintaining energy security, and the integrated resource plan for electricity. The NDP refers to coal in several chapters, in some places suggesting additional investment (including new rail lines to transport coal and coal to liquids),
Box 4.5
in others decommissioning coal-fired power ‘procuring at least 20,000 MW of renewable electricity by 2030, importing electricity from the region, decommissioning 11,000 MW of ageing coal-fired power stations and stepping up investments in energy-efficiency’ (NPC 2011: p. 46). Reference to environmental sustainability is not limited to Chapter 5 – the introductory vision statement includes acknowledgement ‘that each and every one of us is intimately and inextricably of this earth with its beauty and life-giving sources; that our lives on earth are both enriched and complicated by what we have contributed to its condition’ (NPC 2011: p. 21); and the overview of the plan includes a section on climate change, addressing both mitigation and adaptation.
Looking ahead, given that different development pathways can lead to different levels of GHG emissions and to different capacities and opportunities to mitigate, there is increasing research on how to make development pathways more sustainable. Literature is also focusing on the need for a ‘new normal’ as a system capable of achieving higher quality growth while addressing multiple development objectives by focusing on ‘innovative development pathways’.
Literature suggests that if development pathways are to be changed to address the climate change problem, choices that would need to be made about development pathways would not be marginal (Stern 2009), and would require a new social contract to address a complex set of inter-linkages across sectors, classes and the whole economy (Winkler 2017b). Shifting development pathways necessitates planning in a holistic manner, rather than thinking about discrete and isolated activities and actions to undertake mitigation. Further, the necessary transformational changes can be positive if they are rooted in the development aspirations of the economy and society in which they take place (Dubash 2012; Jones et al. 2013), but they can also lead to carbon colonialism if the transformations are imposed by Northern donors or perceived as such.
Accordingly, influencing a societies’ development pathways draws upon a broader range of policies and other efforts than narrowly influencing mitigation pathways, to be able to achieve the multiple objectives of reducing poverty, inequality and GHG emissions. The implications for employment, education, mobility, housing and many other development aspects must be integrated and new ways of looking at development pathways which are low carbon must be considered (Bataille et al. 2016b; Waisman et al. 2019). For instance, job creation and education are important elements that could play a key role in reducing inequality and poverty in countries like South Africa and India (Winkler et al. 2015; Rao and Min 2018) while these also open up broader opportunities for mitigation.
4.3.2.5New Tools Are Needed to Pave and Assess Development Pathways
Relative to the literature on mitigation pathways described in 4.2.5 and in 4.3.3, the literature on development pathways is limited. The climate research community has developed the Shared Socio-economic Pathways (SSPs) that link several socio-economic drivers including equity in relation to welfare, resources, institutions, governance and climate mitigation policies in order to reflect many of the key development directions (O’Neill et al. 2014). In most modelling exercises however, development remains treated as an exogenous input. In addition, models may capture only some dimensions of development that are relevant for mitigation options, thereby not capturing distributional aspects and not allowing consistency checks with broader developmental goals (Valadkhani et al. 2016). Quantitative tools for assessing mitigation pathways could be more helpful if they could provide information on a broader range of development indicators, and could model substantively different alternative development paths, thereby providing information on which levers might shift development in a more sustainable direction.
Doing so requires new ways of thinking with interdisciplinary research and use of alternative frameworks and methods suited to deeper understanding of change agents, determinants of change and adaptive management among other issues (Winkler 2018). This includes, inter alia, being able to examine enabling conditions for shifting development pathways (Section 4.4.1); re-evaluating the neo-classical assumptions within most models, both on the functioning of markets and on the behaviour of agents, to better address obstacles on the demand side, obstacles on the supply side and market distortions (Ekholm et al. 2013; Staub-Kaminski et al. 2014; Grubb et al. 2015) improving representation of issues related with uncertainty, innovation, inertia and irreversibility within the larger development contexts, including energy access and security; improving the representation of social and human capital, and of social, technological and governance innovations (Pedde et al. 2019).
Tools have been developed in that direction, for example in the Mitigation Action Plans and Scenarios (MAPS) community (La Rovere et al. 2014b), but need to be further mainstreamed in the analysis. Back-casting is often a preferred modelling approach for assessment aiming to align national development goals with global climate goals like CO2 stabilisation. Back-casting is a normative approach where modellers construct desirable futures and specify upfront targets and then find out possible pathways to attain these targets (IPCC et al. 2001). Use of approaches like back-casting are useful not only in incorporating the long term national development objectives in the models, but also evaluating conflicts and synergies more effectively (van der Voorn et al. 2020). In back casting, the long-term national development objectives remain the key benchmarks guiding the model dynamics and the global climate goal is interfaced to realise the co-benefits. The models then delineate the roadmap of national actions such that the national goals are achieved with a comprehensive understanding of the full costs and benefits of low-carbon development (often including the costs of adaptation and impacts from residual climate change). Back-casting modelling exercises show that aligning development and climate actions could result in much lower ‘social cost of carbon’ (Shukla et al. 2008). Back-casting does not aim to produce blueprints. Rather, it indicates the relative feasibility and the social, environmental, and political implications of different development and climate futures on the assumption of a clear relationship between goal setting and policy planning (Dreborg 1996). Accordingly, back-casting exercises are well suited for preparing local specific roadmaps like for cities (Gomi et al. 2010, 2011).
4.3.3Examples of Shifts in Development Pathways and of Supporting Policies
As noted in Section 4.3.1, policy approaches that include a broader range of instruments and initiatives would impact more fundamentally on the actors, institutions and structures of societies and the dynamics among them, aiming to alter the underlying drivers of emissions, opening up a wider range of mitigation opportunities and potential in the process of achieving societal development goals. While the evolution of these drivers is subject to varied influences and complex interactions, there are policy measures by which decision-makers might influence them. Table 4.12 provides some examples of policy measures that can affect key drivers (shown in the row headings).
Table 4.12 | Examples of policies that can help shift development pathways.
Drivers | Examples of policy measures |
Behaviour | –Progressive taxation –Ecological tax reform –Regulation of advertisement –Investment in public transit –Eco-labelling |
Governance and institutions | –Campaign finance laws –Regulatory transparency –Commitment to multilateral environmental governance –Public investment in education and R&D –Public-service information initiatives –Public sector commitment to science-based decision-making –Anti-corruption policies |
Innovation | –Investment in public education –Public sector R&D support –Fiscal incentives for private investments in public goods –International technology development and transfer initiatives |
Finance and investment | –International investment treaties support common objectives –Litigation and liability regulations –Reform of subsidies and other incentives not aligned with –Insurance sector and pension regulation –Green quantitative easing –Risk disclosure |
Policies such as those listed in Table 4.12 are typically associated with broader objectives than GHG mitigation. They are generally conceived and implemented in the pursuit of overall societal development objectives, such as job creation, macroeconomic stability, economic growth, and public health and welfare. However, they can have major influence on mitigative capacity, and hence can be seen as necessary tools if mitigation options are to be significantly broadened and accelerated (medium evidence, medium agreement). The example of the UK shows how accelerated mitigation through dietary changes require a wide set of efforts to shift underlying drivers of behaviour. In this case, multiple forces have interacted to lead to reduced meat consumption, including health attitudes, animal welfare concerns, and an increasing focus on climate and other environmental impacts of livestock production, along with corporate investment in market opportunities, and technological developments in meat alternatives (Box 5.5).
Other historic cases that are unrelated to recent mitigation efforts might be more appropriate examples of major socio-technical shifts that were largely driven by intentional, coherent intentional policy initiatives across numerous domains to meet multiple objectives. The modernisation of agriculture in various national contexts fits such a mold. In the USA, for example, major government investments in agricultural innovation through the creation of agricultural universities and support for research provided advances in the technological basis for modernisation. A network of agricultural extension services accelerated the popularization and uptake of modern methods. Infrastructure investments in irrigation and drainage made production more viable, and investment in roadways and rail for transport supported market formation. Agricultural development banks made credit available, and government subsidies improved the profitability for farmers and agricultural corporations. Public campaigns were launched to modify food habits (Ferleger 2000).
Further examples of SDPS across many different systems and sectors are elaborated across this report. Concrete examples assessed in this chapter include high employment and low emissions structural change, fiscal reforms for mitigation and social contract, combining housing policies to deliver both housing and transport mitigation, and change economic, social and spatial patterns of development of the agriculture sector provide the basis for sustained reductions in emissions from deforestation (Sections 4.4.1.7–4.4.1.10). These examples differ by context. Examples in other chapters include transformations in energy, urban, building, industrial, transport, and land-based systems, changes in behaviour and social practices, as well as transformational changes across whole economies and societies (Cross-Chapter Box 5 in this chapter, Section 5.8, Box 6.2, Sections 8.2, 8.3.1, 8.4, 9.8.1, 9.8.2 and 10.4.1, and Cross-Chapter Box 12 in Chapter 16). These examples and others can be understood in the context of an explanation of the concept of SDPS, and how to shifting development pathways (Cross-Chapter Box 5 in this chapter).
Cross-Chapter Box 5 | Shifting Development Pathways to Increase Sustainability and Broaden Mitigation Options
Authors: Franck Lecocq (France), Harald Winkler (Republic of South Africa), Mustafa Babiker (Sudan/Saudi Arabia), Brett Cohen (Republic of South Africa), Heleen de Coninck (the Netherlands), Dipak Dasgupta (India), Navroz K. Dubash (India), María Josefina Figueroa Meza (Venezuela/Denmark), Michael Grubb (United Kingdom), Kirsten Halsnæs (Denmark), Şiir Kılkış (Turkey), William Lamb (Germany/United Kingdom), Sebastian Mirasgedis (Greece), Sudarmanto Budi Nugroho (Indonesia), Chukwumerije Okereke (Nigeria/United Kingdom), Minal Pathak (India), Joyashree Roy (India/Thailand), Ambuj Sagar (India), Yamina Saheb (France/Algeria), Priyadarshi Shukla (India), Jim Skea (United Kingdom), Youba Sokona (Mali), Julia Steinberger (United Kingdom/Switzerland), Mariama Williams (Jamaica/the United States of America)
1. What do we mean by development pathways?
In the present report, development pathways refer to patterns of development resulting from multiple decisions and choices made by many actors in the national and global contexts. Each society whether in the Global North or the Global South follows its own pattern of development (Figure 1.6). Development pathways can also be described at smaller scales (e.g., for regions or cities). By extension, the concept can also be applied to sectors and systems (e.g., the development pathway of the agricultural sector or of industrial systems).
2. Why do development pathways matter in a report about mitigation?
2a. Past development pathways determine both today’s GHG emissions and the set of opportunities to reduce emissions
Development pathways drive GHG emissions for a large part (Sections 2.4, 2.5 and 2.6). For example, different social choices and policy packages with regard to land use and associated rents will result in human settlements with different spatial patterns, different types of housing markets and cultures, and different degrees of inclusiveness, and thus different demand for transport services and associated GHG emissions (Sections 8.3.1 and 10.2.1).
There is compelling evidence to show that continuing along existing development pathways is unlikely to achieve rapid and deep emission reductions (robust evidence, medium agreement). For example, investments in long-lived infrastructure, including energy supply systems, could lock-in high emissions pathways and risk making deep decarbonisation and sustainable policies more difficult and expensive.
Development pathways also determine the set of tools available to mitigate climate change (Figure 4.7). For example, the capacity of households to move closer to their workplace, in response to, for example, a price signal on carbon and thus on gasoline, depends on rents, which themselves depend on the spatial patterns of development of human settlements (Section 8.3.1). Said differently, mitigation costs depend on past development choices. Similarly, development pathways determine the enablers and levers available for adaptation (AR6 WGII, Chapter 18) and for achieving other SDGs.
In the absence of shifts in development pathways, conventional mitigation policy instruments (e.g., carbon tax, emission quotas, technological norms, etc.) may not be able to limit emissions to a degree sufficient for deep decarbonisation or only at very high economic and social costs.
Policies to shift development pathways, on the contrary, make mitigation policies more effective. For example, policies that prioritise non-car transit, or limit rents close to work places would make it easier for households to relocate in response to a price signal on transport, and thus makes the same degree of mitigation achievable at lower economic and social cost.
2b. Shifting development pathways broadens the scope for synergies between development objectives and mitigation
Second, societies pursue a variety of development objectives, of which protecting the Earth’s climate is part. The SDGs provide a global mapping of these goals. Absent climate mitigation, our collective ability to achieve the SDGs in 2030 and to sustain them beyond 2030 is likely to be compromised, even if adaptation measures are put in place (AR6 WGII).
There are many instances in which reducing GHG emissions and moving towards the achievement of other development objectives can go hand in hand, in the near-, mid- and long-term (Sections 3.7, 6.7.7, 7.6.5, 8.2, 9.8, 10.1.1, 11.5.3 and 17.3, and Figures 3.40 and 12.1). For example, transitions from coal-based power to lower-emissions electricity generation technologies and from internal combustion engine to lower-carbon transport has large mitigation potential and direct benefits for health through reduction in local air pollution (Box 6.2 and Section 10.4.1). Energy efficiency in buildings and energy poverty alleviation through improved access to clean fuels also delivers significant health benefits (Sections 9.8.1 and 9.8.2).
Cross-Chapter Box 5
Careful design of mitigation policies is critical to achieving these synergies (Section 13.8). Integrated policies can support the creation of synergies between climate change goals and other SDGs. For example, when measures promoting walkable urban areas are combined with electrification and clean renewable energy, there are several co-benefits to be attained (Figure SPM.8 and Section 5.2). These include reduced pressures on agricultural land from reduced urban growth, health co-benefits from cleaner air and benefits from enhanced mobility (Sections 8.2, 8.4 and 4.4.1.9).
Policy design can also manage trade-offs, for example through policy measures as part of just transitions (Section 17.4). However, even with good policy design, decisions about mitigation actions, and the timing and scale thereof, may entail trade-offs with the achievement of other national development objectives in the near-, mid- and long term. In the near term, for example, regulations may ban vehicles from city centres to reduce congestion and local air pollution, but reduce mobility and choice. Increasing green spaces within cities without caps on housing prices may involve trade-offs with affordable housing and push low income residents outside the city (Section 8.2.2). In the mid- and long-term, large-scale deployment of biomass energy raises concerns about food security and biodiversity conservation (Sections 3.7.1, 3.7.5, 7.4.4, 9.8.1, 12.5.2 and 12.5.3). Conflicts between mitigation and other development objectives can act as an impediment to climate action (Section 13.8). Climate change is the result of decades of unsustainable energy production, land-use, production and consumption patterns, as well as governance arrangements and political economic institutions that lock in resource-intensive development patterns (robust evidence, high agreement). Reframing development objectives and shifting development pathways towards sustainability can help transform these patterns and practices, allowing space for transitions transforming unsustainable systems (medium evidence, high agreement) (Chapter 17, Executive Summary).
Prioritising is one way to manage trade-offs, addressing some national development objectives earlier than others. Another way is to adopt policy packages aimed at shifting development pathways towards sustainability as they expand the range of tools available to simultaneously achieve multiple development objectives, including mitigation. In the city example of Section 2a, a carbon tax alone would run counter to other development objectives if it made suburban households locked into high emissions transport modes poorer or if it restricted mobility choices, in particular for low- and middle-income households. Policy packages combining affordable housing and provision of safe low-carbon mobility could both facilitate equitable access to housing (a major development objective in many countries) and make it easier to mitigate by shifting the urban development pathway.
Similarly, a fundamental shift in the service provision that helps reduce energy demand (Chapter 5), driven by targeted policies, investment and enabling socio-cultural and behavioural change, would reduce pressure on supply side mitigation need, hence limiting pressure on water and food and the achievement of associated SDGs. Some studies assume Western European lifestyle as a reference for the Global North and an improvement in the living standard for the Global South to reduce energy demand and emissions (Grubler et al. 2018), while others explore a transformative change in the Global North to achieve a decent living standard for all (Bertram et al. 2018; Millward-Hopkins et al. 2020) (Section 3.7.8). For example, in the UK, interaction between multiple behavioural, socio-cultural, and corporate drivers including NGO campaigns, social movements and product innovations resulted in an observed decline in meat consumption (Sections 5.4 and 5.6.4).
3. What does shifting development pathways towards sustainability entail?
Shifting development pathways towards sustainability implies making transformative changes that disrupt existing developmental trends. Such choices would not be marginal (Stern 2009), but include technology adoption, infrastructure availability and use, and socio-behavioural factors (Chapter 5).
These include creating new infrastructure, sustainable supply chains, institutional capacities for evidence-based and integrated decision-making, financial alignment towards low-carbon socially responsible investments, just transitions and shifts in behaviour and norms to support shifts away from fossil-fuel consumption (Green and Denniss 2018). Adopting multi-level governance modes, tackling corruption where it inhibits shifts to sustainability, and improving social and political trust are also key for aligning and supporting long-term environmentally just policies and processes.
Shifting development pathways entails fundamental changes in energy, urban, building, industrial, transport, and land-based systems. It also requires changes in behaviour and social practices. Overcoming inertia and locked-in practices may face considerable opposition (Geels et al. 2017) (Section 5.4.5). The durability of carbon intensive transport modes and electricity generating infrastructures increase the risk of lock-in to high emissions pathways, as these comprise not just consumer practices, but sunk costs in infrastructure, supporting institutions and rules (Seto et al. 2016; Mattioli et al. 2020). Shifting investments towards low-GHG solutions requires a combination of conducive public policies, attractive investment opportunities, as well as the availability of financing to enable such a transition (Section 15.3).
Cross-Chapter Box 5
4. How to shift development pathways?
Shifting development paths is complex. If history is any guide, practices that can easily supplant existing systems and are clearly profitable move fastest (Griliches 1957). Changes that involve ‘dissimilar, unfamiliar and more complex science-based components’ take more time, acceptance and legitimation and involve complex social learning (Conley and Udry 2010), even when they promise large gains (Pezzoni et al. 2019).
Yet despite the complexities of the interactions that result in patterns of development, history also shows that societies can influence the direction of development pathways based on choices made by decision-makers, citizens, the private sector and social stakeholders. For example, fundamentally different responses to the first oil shock shifted then-comparable economies on to different energy sector development and economic pathways in the 1970s and 80s (Sathaye et al. 2009). More recent examples have shown evidence of voluntary transitions for example, advanced lighting in Sweden, improved cook-stoves in China, liquefied petroleum gas stoves in Indonesia or ethanol vehicles in Brazil (Sovacool 2016).
There is no one-size-fits-all recipe for shifting development pathways. However, the following insights can be drawn from past experience and scenarios of possible future development pathways (Section 4.4.1). For example, policies making inner-urban neighbourhoods more accessible and affordable reduce transport costs for low- and middle-income households, and also reduce transport emissions (Section 4.4.1.9). Shifts in development pathways result from both sustained political interventions and bottom-up changes in public opinion. No single sector or policy action is enough to achieve this. Coordinated policy mixes would need to coordinate multiple actors – in other words, individuals, groups and collectives, corporate actors, institutions and infrastructure actors – to deepen decarbonisation and shift pathways towards sustainability (Pettifor 2020). One example was the liquefied petroleum gas (LPG) Subsidy (‘Zero Kero’) Program in Indonesia which harnessed creative policy design to shift to cleaner energy by overcoming existing private interests. The objective of decreasing fiscal expenditures on domestic kerosene subsidies by replacing it with LPG was achieved by harnessing distribution networks of existing providers supported by government subsidised provision of equipment and subsidised pricing (Cross-Chapter Box 9 in Chapter 13).
Shifts in one country may spill over to other countries. Collective action by individuals as part of formal social movements or informal lifestyle changes underpins system change (Sections 5.2.3, 5.4.1, 5.4.5.3 and 13.5).
Sectoral transitions that aspire to shift development pathways often have multiple objectives, and deploy a diverse mix or package of policies and institutional measures (Figure 13.6). Context specific governance conditions can significantly enable or disable sectoral transitions, and play a determinative role in whether a sectoral transition leads to a shift in development pathway. For example, if implemented policies to tackle fuel poverty target the most socially vulnerable households, this can help address barriers poor households face in undertaking building retrofits. In the EU-28, it has been shown that accelerated energy efficiency policies coupled with strong social policies targeting the most vulnerable households, can help reduce the energy demand in residential sector, and deliver additional co-benefits of avoided premature deaths and reduced health impacts (Section 9.8.2).
Literature suggests that through equitable resource distribution, high levels of human development can be provided at moderate energy and carbon levels by changing consumption patterns and redirecting systems in the direction of more sustainable resource use, suggesting that a special effort can be made in the near term for those on higher incomes who account for a disproportionate fraction of global emissions (Millward-Hopkins et al. 2020; Hickel et al. 2021) (Section 5.2.2 and Figure 5.14).
The necessary transformational changes are likely to be more acceptable if rooted in the development aspirations of the economy and society within which they take place (Dubash 2012; Jones et al. 2013) and may enable a new social contract to address a complex set of inter-linkages across sectors, classes and the whole economy (Fleurbaey et al. 2018).
Taking advantage of windows of opportunity and disruptions to mindsets and socio-technical systems could advance deeper transformations. These might include the globally declining costs of renewables (Figure 1.7, Section 2.2.5 and Box 16.2), emerging social norms for climate mitigation (Green and Denniss 2018), or the COVID-19 pandemic, all of which might be harnessed to centre political action on protecting human and planetary health (Büchs et al. 2020), but if not handled carefully could also risk undermining the support for transformation.
Cross-Chapter Box 5
5. How can shifts in development pathways be implemented by actors in different contexts?
Shifting development pathways to increased sustainability is a shared aspiration. Yet since countries differ in starting points (e.g., social, economic, cultural, political) and history, they have different urgent needs in terms of facilitating the economic, social, and environmental dimensions of sustainable development and, therefore, give different priorities (Sections 4.3.2 and 17.4). The appropriate set of policies to shift development pathways thus depends on national circumstances and capacities.
In some developed countries and communities, affluence leads to high levels of consumption and emissions across sectors (Mazur and Rosa 1974; Wiedmann et al. 2020). For some countries, reducing consumption can reduce emissions without compromising on wellbeing. However, some developing countries still face the challenge of escaping ‘middle-income traps’ (Agénor and Canuto 2015), as labour-saving technological change and globalisation have limited options to develop via the manufacturing sector (Altenburg and Rodrik 2017). In least developed countries, infrastructure, industry, and public services are still being established, posing both a challenge to financial support to deploy technologies, and large opportunities to support accelerating low-to-zero carbon options – especially in terms of efficient and sufficient provision (Millward-Hopkins et al. 2020). Availability of capital, or lack thereof, is a critical discriminant across countries and requires international cooperation (Section 15.2.2).
Shifting development pathways towards sustainability needs to be supported by global partnerships to strengthen suitable capacity, technological innovation (Section 16.6), and financial flows (Sections 14.4.1, 15.2.4). The international community can play a particularly key role by helping ensure the necessary broad participation in climate-mitigation efforts, including by countries at different development levels, through sustained support for policies and partnerships that support shifting development pathways towards sustainability while promoting equity and being mindful of different transition capacities (Sections 4.3.2, 16.5, 16.6, 14.4 and 17.4).
In sum, development pathways unfold over time in response to complex dynamics among various drivers and diverse actors with varying interests and motivations ( high agreement , robust evidence). The way countries develop determines the nature and degree of the obstacles to accelerating mitigation and achieving other sustainable development objectives (medium-robust evidence, medium agreement). Meeting ambitious mitigation and development goals cannot be achieved through incremental change (robust evidence, medium agreement). Shifting development pathways thus involves designing and implementing policies where possible to intentionally enhance enabling conditions and reduce obstacles to desired outcomes (medium evidence, medium agreement).
Section 4.4 elaborates mechanisms through which societies can develop and implement policies to substantially shift development pathways toward securing shared societal objectives. Such policies entail overcoming obstacles (Section 4.2.7) by means of favourable enabling conditions: governance and institutions, behaviour, innovation, policy and finance. These enabling conditions are amenable to intentional change – to greater or lesser degrees and over longer or shorter time scales – based on a range of possible measures and processes (Section 4.4).
4.4How to Shift Development Pathways and Accelerate the Pace and Scale of Mitigation
4.4.1Approaches, Enabling Conditions and Examples
4.4.1.1Framing the Problem
What have we learned so far? As highlighted above, despite 30 years of UNFCCC and growing contributions by non-state actors, the emissions gap keeps growing (Sections 4.2.2 and 4.2.3). Mitigation conceived as incremental change is not enough. Meeting ambitious mitigation goals entails rapid, non-marginal changes in production and consumption patterns (Sections 4.2.4 and 4.2.5). Taking another approach, we have seen in Section 4.3 that shifting development pathways broadens the scope for mitigation (Sections 4.3.1 and 4.3.2) and offers more opportunities than mitigation alone to combine mitigation with the realisation of other SDGs (Section 4.3.1 and Cross-Chapter Box 5 in this chapter).
A practical way forward is to combine shifting development pathways and accelerating mitigation (medium evidence, high agreement). This means introducing multi-objective policy packages and sequences with climate and development components that both target mitigation directly and create the conditions for shifts in development pathways that will help accelerate further mitigation down the line, and meet other development objectives. Since development pathways result from myriad decisions from multiple actors (Section 4.3.1), coordination across countries and with non-state actors is essential.
The literature does not provide a handbook on how to accomplish the above. However, analysis of past experience as well as understanding of how societies function yield insights that the present section aims at presenting. Human history has seen multiple transformation of economies due to path-breaking innovations (Michaelowa et al. 2018), like the transformation of the energy system from traditional biomass to fossil fuels or from steam to electricity (Fouquet 2010, 2016a; Sovacool 2016). Fouquet (2016b) and Smil (2016) argue that even the most rapid global transformations have taken several decades. Enabling transformational change implies to create now the conditions that lead to that transformation (Díaz et al. 2019). The starting point is that there is no single factor determining such a transformation. Rather a range of enabling conditions can combine in a co-evolutionary process. Amongst the conditions that have been cited in the literature are higher levels of innovation, multilevel governance, transformative policy regimes or profound behavioural transformation (Rockström et al. 2017; IPCC 2018a; Geels et al. 2018; Kriegler et al. 2018). It might be possible to put in place some of the above conditions rapidly, while others may take longer, thereby requiring an early start.
The present chapter uses the set of enabling conditions identified in the IPCC SR1.5 report, namely policy, governance and institutional capacity, finance, behaviour and lifestyles and innovation and technology (de Coninck et al. 2018). As Figure 4.8 illustrates, public policies are required to foster both accelerating mitigation and shifting development pathways. They are also vital to guide and provide the other enabling conditions (compare Table 4.12). Improved governance and enhanced institutional capacity facilitate the adoption of policies that accelerate mitigation and shift development pathways, with the potential to achieve multiple mitigation and development objectives. Finance is required both to accelerate mitigation and to shift development pathways. Chapter 15 argues that near term actions to shift the financial system over the next decade (2021–2030) are critically important and feasible, and that the immediate post-COVID recovery opens up opportunities to scale up financing from billions to trillions (Mawdsley 2018) (Section 15.6.7). As discussed in Section 4.2.5, accelerated mitigation pathways encompass both rapid deployment of new technologies such as CCS or electric vehicles, as well as changes in consumption patterns: rapid deployment of mitigation technology and behaviour change are thus two enabling conditions to accelerated mitigation. Dynamics of deployment of technologies are relatively well known, pointing to specific, short-term action to accelerate innovation and deployment (Cross-Chapter Box 12 in Chapter 16), whereas dynamics of collective behaviour change is less well understood. Arguably, the latter also facilitates shifting development pathways.
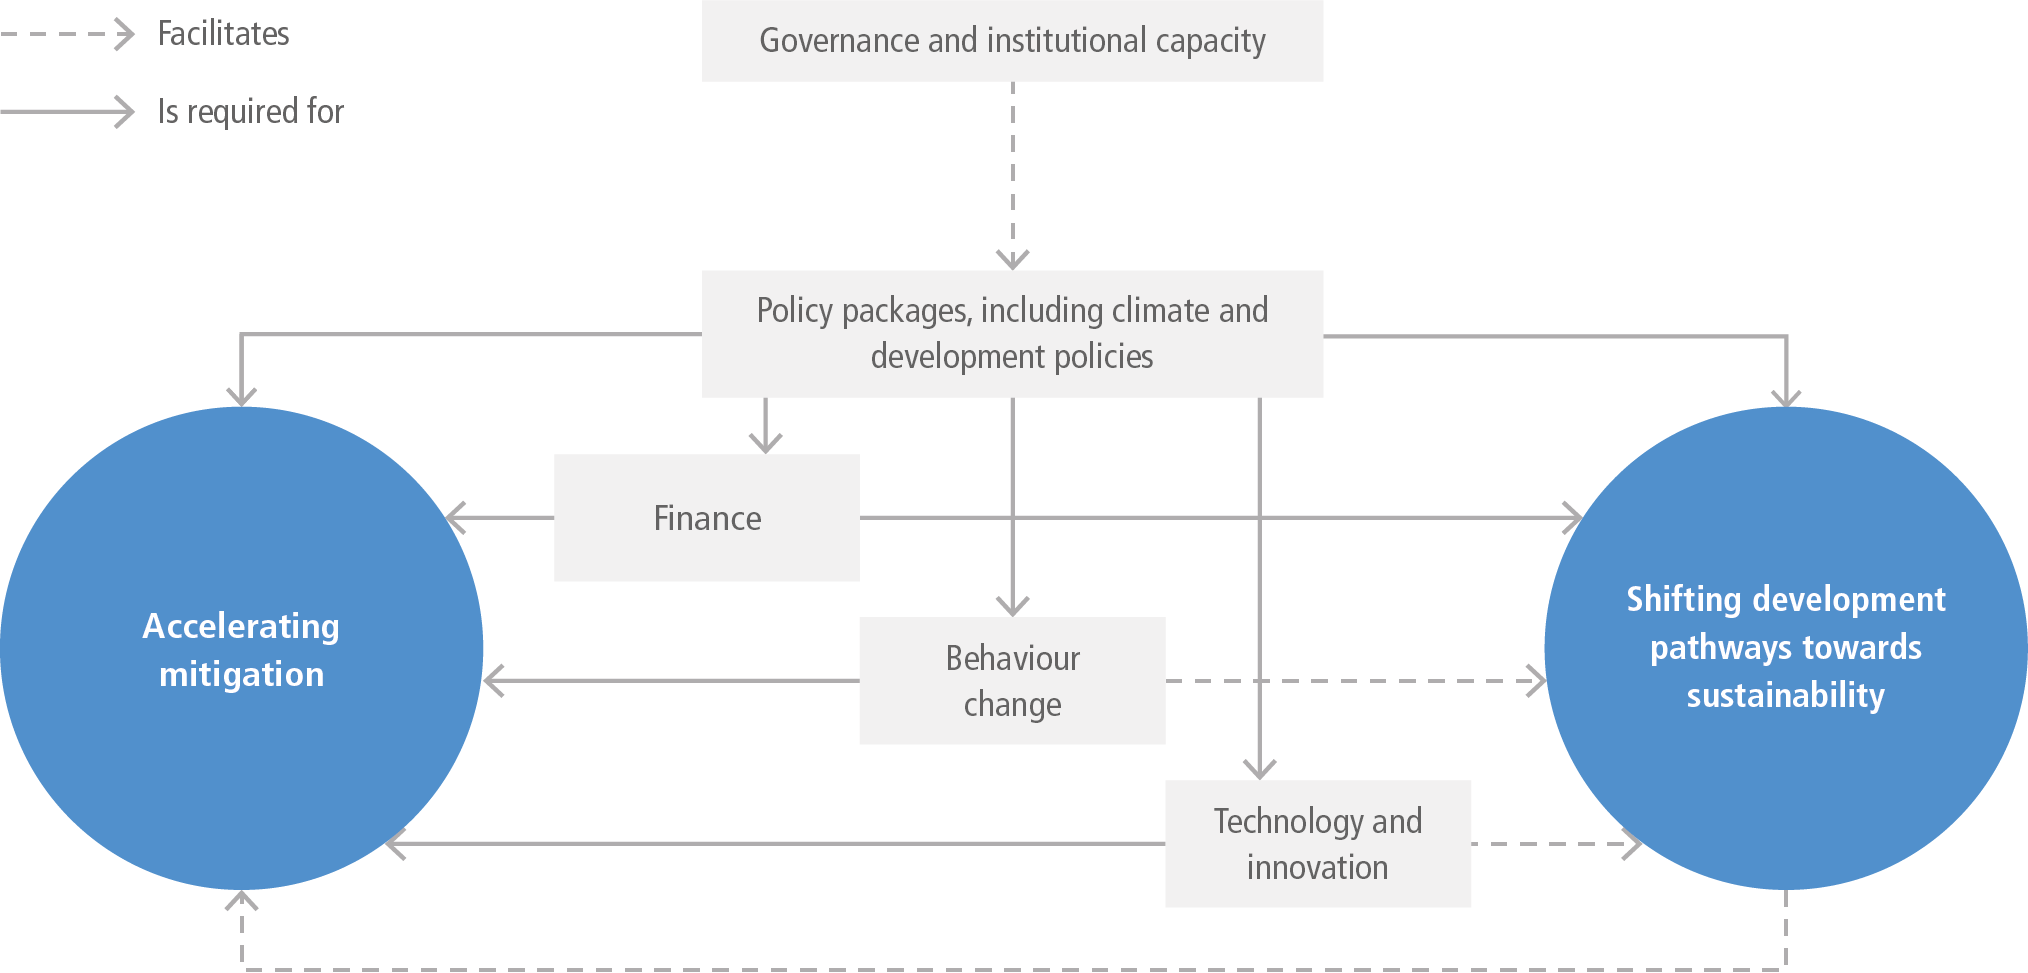
Figure 4.8 | Enabling conditions for accelerating mitigation and shifting development pathways towards sustainability.
Individual enabling conditions are discussed at length in Chapter 5 (behaviour change), 13 (policies, governance and institutional capacity), 15 (finance) and 16 (innovation). The purpose of the discussion below is to draw operational implications from these chapters for action, taking into account the focus of the present Chapter on action at the national level in the near- and mid-term, and its special emphasis on shifting development pathways in addition to accelerated mitigation.
The rest of the Section is organised as follows. Policy packages that combine climate and development policies are first discussed (Section 4.4.1.2). The next sections are dedicated to the conditions that facilitate shifts in development pathways and accelerated mitigation: governance and institutions (Section 4.4.1.3), financial resources (Section 4.4.1.4), behaviour change (Section 4.4.1.5) and innovation (Section 4.4.1.6). Four examples of how climate and development policies can be combined to shift pathways and accelerate mitigation are then presented (Sections 4.4.1.7, 4.4.1.8, 4.4.1.9 and 4.4.1.10). Section 4.4.2 focuses specifically on how shifts in development pathways can deliver both mitigation and adaptation. Finally, Section 4.4.3 discusses risks and uncertainties associated with combining shifting development pathways and accelerating mitigation.
4.4.1.2Policy Packages That Include Climate and Development Policies
Although many transformations in the past have been driven by the emergence and diffusion of an innovative technology, policy intervention was frequent, especially in the more rapid ones (Michaelowa et al. 2018; Grubb et al. 2021). Likewise, it is not expected that spontaneous behaviour change or market evolution alone yield the type of transformations outlined in the accelerated mitigation pathways described in Section 4.2.5, or in the shifts in development pathways described in Section 4.3.3. On the contrary, stringent temperature targets imply bold policies in the short term (Rockström et al. 2017; Kriegler et al. 2018) to enforce effective existing policy instruments and regulations, as well as to reform or remove harmful existing policies and subsidies (Díaz et al. 2019).
Policy integration, addressing multiple objectives, is an essential component of shifting development pathways and accelerating mitigation (robust evidence, high agreement). A shift in development pathways that fosters accelerated mitigation may best be achieved through integrated actions that comprise policies in support of the broader SDG agenda, based on country-specific priorities (Sections 4.3.2, 13.8 and 13.9). These may include for example, fiscal policies, or integrating industrial (Nilsson et al. 2021) and energy policies (Fragkos et al. 2021) with climate policies. Similarly, sectoral transitions that aspire to shifting development pathways towards sustainability often have multiple objectives, and deploy a diverse mix or package of policies and institutional measures (Cross-Chapter Box 5).
Because low-carbon transitions are political processes, analyses are needed of policy as well as for policy (Section 13.6). Political scientists have developed a number of theoretical models that both explain policy-making processes and provide useful insights for influencing those processes. Case studies of successes and failures in sustainable development and mitigation offer equally important insights. Both theoretical and empirical analysis reinforce the argument that single policy instruments are not sufficient (robust evidence, high agreement). Policymakers might rather mobilise a range of policies, such as financial instruments (taxes, subsidies, grants, loans), regulatory instruments (standards, laws, performance targets) and processual instruments (demonstration projects, network management, public debates, consultations, foresight exercises, roadmaps) (Voß et al. 2007). Policies can be designed to focus on limiting or phasing out high-carbon technology. The appropriate mix is likely to vary between countries and domains, depending on political cultures and stakeholder configurations (Rogge and Reichardt 2016), but is likely to include a combination of: (i) standards, nudges and information to encourage low-carbon technology adoption and behavioural change; (ii) economic incentives to reward low-carbon investments; (iii) supply-side policy instruments including for fossil fuel production (to complement demand-side climate policies) and (iv) innovation support and strategic investment to encourage systemic change (Grubb 2014). These approaches can be mutually reinforcing. For example, carbon pricing can incentivise low-carbon innovation, while targeted support for emerging niche technologies can make them more competitive encourage their diffusion and ultimately facilitate a higher level of carbon pricing. Similarly, the success of feed-in tariffs in Germany only worked as well as it did because it formed part of a broader policy mix including ‘supply-push’ mechanisms such as subsidies for research and ‘systemic measures’ such as collaborative research projects and systems of knowledge exchange (Rogge et al. 2015).
4.4.1.3Governance and Institutional Capacity
Governance for climate mitigation and shifting development pathways is enhanced when tailored to national and local contexts. Improved institutions and governance enable ambitious climate action and help bridge implementation gaps (medium evidence, high agreement). Improving institutions involve a broad range of stakeholders and multiple regional and temporal scales. It necessitates a credible and trusted process for reconciling perspectives and balancing potential side-effects, managing winners and losers and adopting compensatory measures to ensure an inclusive and just transition (Newell and Mulvaney 2013; Miller and Richter 2014; Gambhir et al. 2018; Diffenbaugh and Burke 2019), managing the risk of inequitable or non-representative power dynamics and avoiding regulatory capture by special interests (Helsinki Design Lab 2011; Boulle et al. 2015; Kahane 2012).
Long experience of political management of change demonstrates that managing such risks is not easy, and requires sufficiently strong and competent institutions (Stiglitz 1998). For example, shift away from fossil fuel-based energy economy could significantly disrupt the status quo, leading to a stranding of financial and capital assets and shifting of political-economic power. Ensuring the decision-making process is not unduly influenced by actors with much to lose is key to managing a transformation. Effective governance, as noted in Chapter 13, requires establishing strategic direction, coordination of policy responses, and mediation among divergent interests. Among varieties of climate governance, which institutions emerge is path-dependent, based on the interplay of national political institutions, international drivers, and bureaucratic structures (Dubash 2021). Focused national climate institutions to address these challenges are more likely to emerge, persist and be effective when they are consistent with a framing of climate change that has broad national political support (medium evidence, medium agreement) (Sections 4.5, 13.2 and 13.5).
Innovative governance approaches can help meet these challenges (Clark et al. 2018; Díaz et al. 2019). Enabling multilevel governance– i.e., better alignment across governance scales – and coordination of international organisations and national governments can help accelerate a transition to sustainable development and deep decarbonisation (Tait and Euston-Brown 2017; Michaelowa and Michaelowa 2017; Ringel 2017; Revi 2017; Cheshmehzangi 2016; IPCC 2018a). Participatory and inclusive governance– partnerships between state and non-state actors, and concerted effort across different stakeholders are crucial in supporting acceleration (Burch et al. 2014; Hering et al. 2014; Roberts 2016; Figueres et al. 2017; Clark et al. 2018; Leal Filho et al. 2018; Lee et al. 2018). So do partnerships through transnational climate governance initiatives, which coordinate nation states and non-state actors on an international scale (Hsu et al. 2018). Although they are unlikely to close the gap of the insufficient mitigation effort of national governments (Michaelowa and Michaelowa 2017) (Section 4.2.3), they help building confidence in governments concerning climate policy and push for more ambitious national goals (UNEP 2018b).
Meeting these challenges also requires enhanced institutional capacity and enhanced institutional mechanisms to strengthen the coordination between multiple actors, improve complementarities and synergies between multiple objectives (Rasul 2016; Ringel 2017; Liu et al. 2018) and pursue climate action and other development objectives in an integrated and coherent way (Von Stechow et al. 2016; McCollum et al. 2018; Rogelj et al. 2018b; Roy et al. 2018; Fuso Nerini et al. 2019), particularly in developing countries (Adenle et al. 2017; Rosenbloom 2017). Institutional capacities to be strengthened include vertical collaboration and interaction within nation states and horizontal collaboration (e.g., transnational city networks) for the development and implementation of plans, regulations and policies. More specifically capacities include: capacity for knowledge harnessing and integration (from multiple perspectives); for integrated policy design and implementation (Scott 2017); for long-term planning (Lecocq et al. 2021) for monitoring and review process; for coordinating multi-actor processes to create synergies and avoid trade-offs. As a result, institutions that enable and improve human capacities and capabilities are a major driver of transformation. To this extent, promoting education, health care and social safety, also are instrumental to undertake climate change mitigation and cope with environmental problems (Winkler et al. 2007; Sachs et al. 2019). Given that strengthening institutions may be a long-term endeavour, it needs attention in the near term.
4.4.1.4Channelling Financial Resources
Accelerated mitigation and shifting development pathways necessitate both redirecting existing financial flows from high- to low-emissions technologies and systems and providing additional resources (robust evidence, high agreement). An example is changes in investments from fossil fuels to renewable energy, with pressures to disinvest in the former while increasing levels of ‘green finance’ (Sections 6.7.4 and 15.5). While some lower-carbon technologies have become competitive (Sections 1.4.3 and 2.5), support remains needed for the low-emissions options have higher costs per unit of service provided than high-emission ones. Lack of financial resources is identified as a major barrier to the implementation of accelerated mitigation and of shifts in development pathways. Overcoming this obstacle has two major components. One relates to private capital. The other to public finance.
There is substantial amount of research on the redirection of private financial flows towards low-carbon investment and the role of financial regulators and central banks, as detailed in Chapter 15. Financial systems are an indispensable element of a systemic transition (Fankhauser et al. 2016; Naidoo 2020). Policy frameworks can redirect financial resources towards low-emission assets and services (UNEP 2015), mainstreaming climate finance within financial and banking system regulation, and reducing transaction costs for bankable mitigation technology projects (Mundaca et al. 2013; Brunner and Enting 2014; Yeo 2019). Shifts in the financial system to finance climate mitigation and other SDGs can be achieved by aligning incentives and investments with multiple objectives (UNEP Inquiry 2016).
Different approaches have been explored to improve such alignment (Section 15.6), from national credit policies to directly green mainstream financial regulations (e.g., through modifications in the Basel rules for banks). For all approaches, an essential precondition is to assess and monitor the contribution of financial flows to climate and sustainability goals, with better metrics that clearly link with financial activity (Chenet et al. 2019). Enabling the alignment of investment decision-making with achieving climate and broader sustainability goals includes acknowledgment and disclosure of climate-change related risk and of risks associated with mitigation in financial portfolios. Current disclosures remain far from the scale the markets need to channel investment to sustainable and resilient solutions (UNEP - Finance Initiative 2020; Clark et al. 2018; Task Force on Climate-Related Financial Disclosures 2019; IPCC 2018b). Disclosure, however, is not enough (Ameli et al. 2020). In addition, climate targets can be translated into investment roadmaps and financing needs for financial institutions, both at national and international level. Financing needs are usable for financial institutions, to inform portfolio allocation decisions and financing priorities (Chenet et al. 2019). At the international level, for example, technology roadmaps for key sectors can be translated into investment roadmaps and financing needs, as shown by existing experiences in energy and industrial sectors (IEA 2015; IEA and WBSCD 2018; Chenet et al. 2019).
The transition from traditional public climate finance interventions to the market-based support of climate mitigation (Bodnar et al. 2018) demands innovative forms of financial cooperation and innovative financing mechanisms to help de-risk low-emission investments and support new business models. These financial innovations may involve sub-national actors like cities and regional governments in raising finance to achieve their commitments (Cartwright 2015; CCFLA 2017). Moreover, public-private partnerships have proved to be an important vehicle for financing investments to meet the SDGs, including economic instruments for financing conservation (Sovacool 2013; Díaz et al. 2019).
Overall, early action is needed to overcome barriers and to adjust the existing incentive system to align national development strategies with climate and sustainable development goals in the medium-term. Steckel et al. (2017) conclude that climate finance could become a central pillar of sustainable development by reconciling the global goal of cost-efficient mitigation with national policy priorities. Without a more rapid, scaled redeployment of financing, in development trajectories that hinder the realisation of the global goals will be locked in (Zadek and Robins 2016). Investment might be designed to avoid trading off the Paris goals against other SDGs, as well as those that simultaneously reduce poverty, inequality, and emissions (Fuso Nerini et al. 2019).
At the national level, it is also essential to create public fiscal space for actions promoting the SDG agenda and thereby broadening the scope of mitigation (medium evidence, medium agreement). To do so, pricing carbon – either through tax payments based on the level of emissions or cap-and-trade systems that limit total allowable emissions – is an efficient means of discouraging carbon emissions throughout an economy (both in consumption and production) while simultaneously encouraging a switch to non-carbon energy sources and generating revenues for prioritised actions (Section 13.6.3). Regarding to levels, the High-Level Commission on Carbon Prices concluded that ‘carbon-price level consistent with achieving the Paris temperature target is at least USD40–80 tCO2–1 by 2020 and USD50–100 tCO2–1 by 2030, provided a supportive policy environment is in place’ (CPLC 2017; Wall Street Journal 2019). National level models yield median carbon values of carbon values of USD733 tCO2–1 in 2050 along accelerated mitigation pathways (Section 4.2.6), while global models find a median value of USD578 tCO2–1 for pathways that reach net zero CO2 between 2045 and 2055 [interquartile range USD405–708] (Section 3.6.1).
Carbon pricing, however, is designed to reduce its fiscal base. Fiscal space may therefore also need to stem from other sources, although fiscal reforms are complex endeavours (Section 4.4.1.8). For countries at lower income levels, foreign aid can make an important contribution to the same agenda (Kharas and McArthur 2019). It may also be noted that, according to estimates at the global level, military spending amounted to USD1.748 trillion in 2012 (the last year with data), a figure that corresponded to 2.3% of GDP, 55% of government spending in education, and was 13 times the level of net ODA (World Bank 2020; SIPRI 2020). Given this, moderate reductions in military spending (which may involve conflict resolution and cross-country agreements on arms limitations) could free up considerable resources for the SDG agenda, both in the countries that reduce spending and in the form of ODA. The resolution of conflicts within and between countries before they become violent would also reduce the need for public and private spending repairing human and physical damage. The fact that civil wars are common in the countries that face the severest SDG challenges underscores the importance of this issue (Collier 2007, pp.17–37).
4.4.1.5Changing Behaviour and Lifestyles
Changes in behaviour and lifestyles are important to accelerated mitigation. Most global mitigation pathways that limit warming to 2°C (>67%) or lower assume substantial behavioural and societal change and low-carbon lifestyles (de Coninck et al. 2018; IPCC 2018a; Luderer et al. 2018a) (see also Section 3.3.1 in this report; and Table 4.9 and Figure 4.3 in IPCC SR1.5). Chapter 5 concludes that behavioural changes within transition pathways offer Gigaton-scale CO2 savings potential at the global level, an often overlooked strategy in traditional mitigation scenarios.
Individual motivation and capacity are impacted by different factors that go beyond traditional social, demographic and economic predictors. However, it is unclear to what extent behavioural factors (i.e., cognitive, motivational and contextual aspects) are taken into account in policy design (Dubois et al. 2019; Mundaca et al. 2019). In fact, while economic policies play a significant role in influencing people’s decisions and behaviour, many drivers of human behaviour and values work largely outside the market system (Winkler et al. 2015; Díaz et al. 2019) as actors in society, particularly individuals, do not respond in an economically ‘rational’ manner based on perfect-information cost-benefit analyses (Runge 1984; Shiller 2019). Rather, compelling narratives can drive individuals to adopt new norms and policies. And norms can be more quickly and more robustly shifted by proposing and framing policies designed with awareness of how framings interact with individual cognitive tendencies (van der Linden et al. 2015). Transformative policies are thus much more likely to be successfully adopted and lead to long-term behavioural change if designed in accordance with principles of cognitive psychology (van der Linden et al. 2015), and with the deep understanding of decision-making offered by behavioural science (UNEP 2017b). Similarly, given that present bias – being motivated by costs and benefits that take effect immediately than those delivered later – significantly shapes behaviour, schemes that bring forward distant costs into the present or that upfront incentives have proved to be more effective (Zauberman et al. 2009; van den Broek et al. 2017; Safarzyńska 2018). Overall, transformational strategies that align mitigation with subjective life satisfaction, and build societal support by positive discourses about economic, social, and cultural benefits of low-carbon innovations, promises far more success than targeting mitigation alone (WBGU 2011; Asensio and Delmas 2016; Geels et al. 2017).
Climate actions are related to knowledge but even strongly to motivational factors (Hornsey et al. 2016; Bolderdijk et al. 2013; Boomsma and Steg 2014), which explains the gap between awareness and action (Ünal et al. 2018). Social influences, particularly from peers, affect people’s engagement in climate action (Schelly 2014). Role models appear to have a solid basis in people’s everyday preferences (WBGU 2011). Social norms can reinforce individuals’ underlying motivations and be effective in encouraging sustainable consumption patterns, as many examples offered by behavioural science illustrate. Social networks also influence and spread behaviours (Service et al. 2014; Clayton et al. 2015; Farrow et al. 2017; Shah et al. 2019). These social influences can be harnessed by climate policy.
Collective action by individuals as part of formal social movements or informal lifestyle movements underpins system change (robust evidence, high agreement) (Sections 5.4 and 5.5). Organisations are comprised of individuals, but also become actors in their own right. Recent literature has considered the role of coalitions and social movements in energy democracy and energy transitions towards sustainability (Hess 2018). Other scholars have examined the role of women in redistributing power, both in the sense of energy transition and in terms of gender relations (Allen et al. 2019; Routledge et al. 2018). Mitigation and broader sustainable development policies that facilitate active participation by stakeholders can build trust, forge new social contracts, and contribute to a positive cycle building climate governance capacity (Section 5.2.3).
However, behavioural change not embedded in structural change will contribute little to climate change mitigation, suggesting that behavioural change is not only a function of individual agency but also depends on other enabling factors, such as the provision of infrastructure and institutions (Section 5.4). Successful shifts towards public transport, for example, involve technologies (buses, trams), infrastructure (light rail, dedicated bus lanes), regulations (operational licenses, performance contracts), institutions (new organisations, responsibilities, oversight), and high-enough density, which in turn depends on such choices as housing or planning policies (Section 4.4.1.9).
4.4.1.6Fostering Technological Innovation
As outlined in Section 4.2.5, rapid, large-scale deployment of improved low-carbon technology is a critical component of accelerated mitigation pathways. As part of its key role in technological change, R&D can make a crucial contribution to accelerated mitigation up to 2030 and beyond, among other things by focusing on closing technology gaps that stand in the way of decarbonising today’s high emitting sectors. Such sectors include shipping, trucking, aviation and heavy industries like steel, cement and chemicals. More broadly, it is increasingly clear that digital changes are becoming a key driving force in societal transformation (Tegmark 2017). Digitalisation is not only an ‘instrument’ for resolving sustainability challenges, it is also a fundamental driver of disruptive, multiscalar change (Sachs et al. 2019) that amounts to a shift in development pathway. Information and communication technologies, artificial intelligence, the internet of things, nanotechnologies, biotechnologies, robotics, are not usually categorised as climate technologies, but have a potential impact on GHG emissions (OECD 2017b) (Cross-Chapter Box 11 in Chapter 16).
The direction of innovation matters (robust evidence, high agreement). The research community has called for more ‘responsible innovation’ (Pandza and Ellwood 2013), ‘open innovation’ (Rauter et al. 2019), ‘mission-oriented’ innovation (Mazzucato and Semieniuk 2017), ‘holistic innovation’ (Chen et al. 2018b), ‘next-generation innovation policy’ (Kuhlmann and Rip 2018) or ‘transformative innovation’ (Schot and Steinmueller 2018) so that innovation patterns and processes are commensurate to our growing sustainability challenges. There is a growing recognition that new forms of innovation can be harnessed and coupled to climate objectives (Fagerberg et al. 2016; Wang et al. 2018). As such, innovation and socio-technical change can be channelled to intensify mitigation via ‘deliberate acceleration’ (Roberts et al. 2018a) and ‘coalition building’ (Hess 2018).
Innovation goes beyond technology. For example, decarbonisation in sectors with long lived capital stock (such as heavy industry, buildings, transport infrastructure) entail technology, policy and financing innovations (Bataille 2020). Similarly, expanding the deployment of photovoltaics can draw upon policies that support specific technical innovations (e.g., to improve photovoltaics efficiency), or innovations in regulatory and market regimes (e.g., net-metering), to innovations in social organisation (e.g., community-ownership). System innovation is a core focus of the transitions literature (Grin et al. 2010; Markard et al. 2012; Geels et al. 2017). Accelerating low-carbon transitions not only involves a shift of system elements but also underlying routines and rules, and hence transitions shift the directionality of innovation. They hence concern the development of a new paradigm or regime that is more focused on solving sustainability challenges that cannot be solved within the dominant regime they substitute (Cross-Chapter Box 12 in Chapter 16).
Several studies have pointed at the important possible contributions of grassroots innovators for the start-up of sustainability transitions (Seyfang and Smith 2007; Seyfang et al. 2014; Smith et al. 2016). In particular, a range of studies have shown that users can play a variety of roles in promoting system innovation: shielding, nurturing (including learning, networking and visioning) and empowering the niches in relation to the dominant system and regime (Schot et al. 2016; Randelli and Rocchi 2017; Meelen et al. 2019). More fundamentally, innovation regimes can be led and guided by markets driven by monetisable profits (as much of private sector led technological innovation of patentable intellectual property), or prioritise social returns (e.g., innovation structures such as innovation prizes, public sector innovation, investments in human capital, and socially-beneficial intellectual property regimes). In both cases, public policies can play a key role by providing resources and favourable incentives (IEA 2020). Chapter 16 provides more details on ways to foster innovation.
4.4.1.7Example: Structural Change Provides a Way to Keep Jobs and Mitigate
Developing countries have experienced a period of rapid economic growth in the past two decades. Patterns of growth have differed markedly across regions, with newly emerging East Asian economies building on transition to manufacturing – as China has done in the past – while Latin American countries tend to transition directly from primary sector to services (Rodrik 2016), and African countries tend to rely on productivity improvements in the primary sectors (Diao et al. 2019). Yet many countries still face the challenge of getting out of the ‘middle-income trap’ (Agénor and Canuto 2015), as labour-saving technological change and globalisation have limited options to develop via the manufacturing sector (Altenburg and Rodrik 2017).
Looking ahead, several studies have illustrated how structural change towards sustainability could lead to reduced emissions intensity and higher mitigative capacity. In China, for example, the shift away from heavy industry (to light industry and services) has already been identified as the most important force limiting emissions growth (Guan et al. 2018), and as a major factor for future emissions (Kwok et al. 2018).
Overall, Altenburg et al. (2017) argue that reallocation of capital and labour from low- to high-productivity sectors – in other words, structural change – remains a necessity, and that it is possible to combine it with reduced environmental footprint (including, but not limited to, mitigation). They argue that this dual challenge calls for structural transformation policies different from those implemented in the past, most importantly through a ‘systematic steering of investment behaviour in a socially agreed direction’ and encompassing policy coordination (limited evidence, medium agreement).
In order to permit progress on their SDG agendas, it is essential that countries develop visions of their future decarbonised sectoral production structure, including its ability to generate growth in incomes, employment and foreign exchange earnings. as well as the related spatial distribution of production, employment, and housing. To this extent, governance and institutional capacity matter, such as availability of tools to support long-term planning. A sectoral structure that permits strong growth is essential given strong associations between growth in per-capita incomes and progress on most SDGs (including those related to poverty; health; education; and access to water, sanitation, electricity, and roads; but not income equality), in part due to the fact that higher incomes provide both households and governments with resources that at least in part would be used to promote SDGs (Gable et al. 2015).
The future viability of sectors will depend on the extent to which they can remain profitable while relying on lower-carbon energy. The challenge to identify alternative sectors of growth is particularly acute for countries that today depend on oil and natural gas for most of their foreign exchange and government revenues (Mirzoev et al. 2020). Changes in economic structure will also have gender implications since the roles of men and women vary across sectors. For example, in many developing countries, sectors in which women play a relatively important role, including agriculture and unpaid household services like collection of water and fuel wood, may be negatively affected by climate change (Roy 2018). It may thus be important to take complementary actions to address the gender implications of changes in economic structure.
Given strong complementarities between policies discussed above, an integrated policy approach is crucial. For example, as suggested, the actions that influence the pace at which GHG emissions can be cut with political support may depend on taxation (including carbon taxes), investments in infrastructure, spending on R&D, changes in income distribution (influenced by transfers), and communication. In this light, it is important to consider the demands that alternative policy packages put on government policy-making efficiency and credibility as well as the roles of other enabling conditions. In fact, plans to undertake major reforms may provide governments with impetus to accelerate the enhancement of their capacities as part of the preparations (Karapin 2016; Withana 2016; Jakob et al. 2019).
4.4.1.8Example: Embedding Carbon Finance in Broader Fiscal Reforms Offers a Way to Mitigate and Rethink the Social Contract
In many countries, fiscal systems are currently under stress to provide resources for the implementation of development priorities, such as, for example, providing universal health coverage and other social services (Meheus and McIntyre 2017) or sustainably funding pension systems in the context of aging populations (Asher and Bali 2017; Cruz-Martinez 2018). Overall, Baum et al. (2017) argue that low-income countries are likely not to have the fiscal space to undertake the investment entailed in reaching the SDGs. To create additional fiscal space, major options include improving tax recovery, reducing subsidies and levying additional taxes.
Mitigation offers an opportunity to create additional fiscal space, and thus to serve the objectives outlined above, by creating a new source of revenue for the government via carbon taxation or emissions permit auctioning and by reducing existing expenditures via reduction in subsidies to fossil-fuel. The 1991 tax reform in Sweden is an early example in which environmental taxation (including, but not limited to, fossil fuel taxation) was introduced as part of a package primarily aimed at lowering the marginal tax rates (more than 80% at the time), at reducing other taxes, while keeping most of the welfare state. To do so, the tax base was broadened, including through environmental and carbon taxation (Sterner 2007). Once in place, the carbon tax rate was substantially ramped up over time, and its base broadened (Criqui et al. 2019).
The future potential for using carbon taxation as a way to provide space for fiscal reform has been highlighted in the so-called ‘green fiscal reform’ literature (Vogt-Schilb et al. 2019). The potential is large, since only 13% of global GHG emissions were covered by carbon pricing schemes in 2019 (Watts et al. 2019) and since many countries price carbon negatively by subsidising fossil fuel use, thus generating effects that are the opposite of those that positive carbon prices hope to promote. In 2018, the global subsidy value amounted to USD427 billion, some 10 times the payment for carbon use (Watts et al. 2019). However, the size of the potential for creating fiscal space varies strongly across countries given differences in terms of current carbon prices and fuel subsidies.
The limited adoption of and political support for carbon pricing may be explained by the fact that most of the gains occur in the future and depend on actions across the globe, making them seem abstract and unpredictable, whereas the costs in the form of higher carbon prices are immediate (Karapin 2016). Furthermore, the links between carbon pricing and emissions may not be clear to the public who, in addition, may not trust that the government will use budgetary savings according to stated plans. The latter may be due to various factors, including a history of limited government commitment and corruption (Withana 2016; Chadwick 2017; Maestre-Andrés et al. 2019).
The literature reports limited systematic evidence based on ex post analysis of the performance of carbon pricing – carbon taxes and greenhouse gas (GHG) emissions trading systems (ETSs) (Haites 2018). Performance assessment is complicated by the effect of other policies and exogenous factors. Haites (2018) suggests that since 2008, other policies have probably contributed more to emission reductions than carbon taxes, and most tax rates are too low to achieve mitigation objectives. Emissions under ETSs have declined, with the exception of four systems without emissions caps (ibid). Every jurisdiction with an ETS and/or carbon tax also has other policies that affect its GHG emissions.
To help policymakers overcome obstacles, research has reviewed the international experience from carbon pricing reforms. Elimination of fossil fuel subsidies, equivalent to the elimination of negative carbon prices, have been more successful when they have included complementary and transparent measures that enjoy popular support, accompanied by a strong communications component that explains the measures and stresses their benefits (Withana 2016; Rentschler and Bazilian 2017; Maestre-Andrés et al. 2019).
Part of the losses (and related calls for compensation or exemptions) due to carbon pricing are related to the fact that it hurts the competitiveness of sectors that face imports from countries with lower carbon prices, leading to ‘carbon leakage’ if carbon-intensive production (and related jobs) migrates from countries with relatively high carbon prices. Some research suggests that evidence that a border carbon tax (or adjustment), set on the basis of the carbon content of the import, including a downward adjustment on the basis of any carbon payments (taxes or other) already made before entry, could reduce carbon leakage while also raising additional revenue and encouraging carbon pricing in the exporting country (Withana 2016; Cosbey et al. 2019).
The timing of carbon pricing reforms is also important: they are more likely to succeed if they exploit windows of opportunity provided by events that raise awareness of the costs of carbon emissions (like bouts of elevated local air pollution or reports about the role of emissions in causing global warming), as well as momentum from climate actions by other countries and international climate agreements (Karapin 2016; Jakob et al.2019). It is also important to consider the level of international prices of carbon energy: when they are low, consumer resistance would be smaller since prices will remain relatively low, though the tax may become more visible when energy prices increase again. As part of ongoing efforts to accelerate mitigation, such tax hikes may be crucial to avoid a slow down in the shift to renewable energy sources (Withana 2016; Rentschler and Bazilian 2017). In countries that export carbon energy, carbon taxation may run into additional resistance from producers.
There is also considerable literature providing insights on the political and social acceptability of carbon taxes, suggesting for example that political support may be boosted if the revenue is recycled to the tax payers or earmarked for areas with positive environmental effects (e.g., Bachus et al. (2019) for Belgium, and Beiser-McGrath and Bernauer (2019) for Germany and the USA), as well as on the difficulties associated with political vagaries (and economic consequences thereof) associated with the introduction of such instruments (Pereira et al. 2016). Similarly, ‘best practices’ have been drawn from past experience on fossil-fuel subsidy reforms (Rentschler and Bazilian 2017; Sovacool 2017). Specific policies, however, depend on societal objectives, endowments, structure of production, employment, and trade, and institutional structure (including the functioning of markets and government capacity) (Kettner et al. 2019). As noted in Section 4.2.6, macroeconomic analysis finds that the overall economic implications of carbon pricing differ markedly depending on the way the proceeds from carbon pricing are used, and thus on the way the fiscal system is reformed, with potential for double dividend if the proceeds from the tax are used to repeal the most distortive taxes in the economy.
In the context of this section on development pathways, it is worth emphasising that potential revenues drawn from the climate mitigation component of the fiscal reform varies strongly with the context, and may not be sufficient to address the other objectives pursued. Even if the carbon price is high, the revenue it generates may be moderate as a share of GDP and eventually it will be zero if emissions are eliminated. For example, Jakob et al. (2016) find that the carbon pricing revenues that most countries in Sub-Saharan Africa could expect to generate only would meet a small part of their infrastructure spending needs. In Sweden, the country with the highest carbon tax rate in the world, the tax has not been a significant part of total tax revenues. Moreover, emissions from sectors covered by the tax have shrunk and, as a result, the revenues from the tax, as a share of GDP, have also declined, from a peak of 0.93% in 2004, when the rate was USD109 per metric tonne of CO2, to 0.48% in 2018, when the rate had reached USD132 (Jonsson et al. 2020; Statistics Sweden 2020). This means that governments that want to avoid a decline in the GDP share for total tax revenues over time would have to raise the intake from other taxes. However, it is here important to note that domestic tax hikes are likely to involve trade-offs since, at the same time as the spending they fund may provide various benefits, they may also reduce the capacity of households and the private sector to consume and invest, something that may reduce growth over time and reduced resources for spending in support of human development (Lofgren et al. 2013). It is also worth emphasising that restructuring of the fiscal system amount to changes in the social contract of the society (Combet and Hourcade 2017 and 2014), and thus represents a major economic and social decision.
4.4.1.9Example: Combining Housing Policies With Carbon Taxation Can Deliver Both Housing and Mitigation in the Transport Sector
The spatial distribution of households and firms across urban and rural areas is a central characteristic of development pathways. Patterns of urbanisation, territorial development, and regional integration have wide-ranging implications for economic, social and environmental objectives (World Bank 2009). Notably, choices regarding spatial forms of development have large-scale implications for demand for transportation and associated GHG emissions.
Exclusionary mechanisms such as decreasing accessibility and affordability of inner-urban neighbourhoods is a major cause of suburbanisation of low- to middle-income households (e.g., Hochstenbach and Musterd 2018). Suburbanisation, in turn, is associated with higher transportation demand (Bento et al. 2005) and higher carbon footprints for households (Jones and Kammen 2014). Similarly, other studies find a significant positive link between housing prices and energy demand (Lampin et al. 2013).
Reducing emissions from transport in cities through traditional climate policy instruments (e.g., through a carbon tax) is more difficult when inner-urban neighbourhoods are less accessible and less affordable, because exclusionary mechanisms act as a countervailing force to the rising transportation costs induced by the climate policy, pushing households outwards rather than inwards. Said differently, the costs of mitigating intra-city transportation emissions are higher when inner-urban housing prices are higher (Lampin et al. 2013).
This suggests that policies making inner-urban neighbourhoods more accessible and more affordable can open up broader opportunities for suburban households to relocate in the face of increasing transportation costs. This is particularly important for low- and middle-income households, who spend a greater portion of their income on housing and transportation, and are more likely to be locked into locations that are distant from their jobs. Making inner-urban neighbourhoods more accessible and more affordable has the potential to reduce both the social costs (e.g., households feeling helpless in front of rising fuel prices) and the economic costs of mitigation policies – as a lower price of carbon is likely to achieve the same amount of emission reductions since households have more capacities to adjust.
Making inner-cities neighbourhoods more accessible and more affordable is a complex endeavour (Benner and Karner 2016). At the same time, it is already a policy objective in its own right in many countries, independent of the climate mitigation motivation, for a range of social, health and economic reasons. Revenues derived from climate policies could provide additional resources to support such programs, as some climate policy already have provisions to use their revenues towards low-income groups (Karner and Marcantonio 2018). The mitigation benefits of keeping inner-cities more accessible and affordable for low- and middle-income households often remains out of, or is only emerging in the debates surrounding the planning of fast-developing cities in many developing countries (IADB 2012; Grant 2015; Khosla and Bhardwaj 2019). Finally, from a political economy perspective, it is also interesting to note that (Bergquist et al. 2020) find higher support for climate policy packages in the USA when affordable housing programs are included.
In addition, investment in infrastructure is critical to the development of decarbonised economic structures that generate growth, employment, and universal access to a wide range of services that are central to the SDG agenda: transportation, water, sanitation, electricity, flood protection, and irrigation. For low- and middle-income countries, annual costs of reaching these goals by 2030 and putting their economies on a path toward decarbonisation may range between 2% and 8% of GDP, with the level depending on spending efficiency. Notably, these costs need not exceed those of more polluting alternatives (Rozenberg and Fay 2019). For transportation, this involves a shift toward more public transportation (rail and bus), and decarbonised electricity for vehicles, combined with land-use policies that densify cities and reduce distances between homes and jobs. By influencing the spatial distribution of households and firms and the organisation of transportation, infrastructure has a strong bearing on GHG emissions and the costs of providing services to different populations. Depending on country context, the private sector may play a particularly important role in the financing of infrastructure (World Bank 2009; Klein 2015).
Many investments in infrastructure and sectoral capital stocks have long lifetimes. Given this, it may be important to make sure that today’s investments be fully decarbonised at the start or that they later can be converted to zero carbon. Today’s investments in electric vehicles in settings where electricity is produced with fossil fuels is an example of convertible investments – they will be decarbonised once electricity production has switched to renewable energies. For capital stocks that cannot be decarbonised, countries may face costs of decommissioning well before the end of their useful lifetimes, especially when it is needed to respect country commitments to future full decarbonisation.
4.4.1.10Example: Changing Economic, Social and Spatial Patterns of Development of the Agriculture Sector Provide the Basis for Sustained Reductions in Emissions From Deforestation
A growing literature assesses co-benefits of sectoral policies that lead to decarbonisation and simultaneously promote economic development, improve living standards, reduce inequality, and create job opportunities (Maroun and Schaeffer 2012; Bataille et al. 2016b; Pye et al. 2016; Bataille et al. 2018; La Rovere et al. 2018; Richter et al. 2018; Waisman et al. 2019). While this may be particularly challenging in developing countries, given large populations still lacking basic needs, previous development paths show that finding synergies in development and climate objectives in the AFOLU sector is possible. One example is Brazil, which has arguably shifted its development pathway to reduce emissions and make progress towards several SDGs, though progress is not linear. Over the past two decades, Brazil had made remarkable progress in implementing a sequence of policies across multiple sectors. This policy package simultaneously increased minimum wages of low income families, achieved universal energy access, and raised the quality of life and well-being for the large majority of the population (Da Silveira Bezerra et al. 2017; Grottera et al. 2017, 2018; La Rovere et al. 2018). This led to significant social benefits, reduction of income inequality and poverty eradication (Da Silveira Bezerra et al. 2017; Grottera et al. 2017), reflected in a decrease of the Gini coefficient and a rise in the human development index (La Rovere 2017).
Regulatory instruments were used to limit deforestation rates, together with implemented economic instruments that provided benefits to those protecting local ecosystems and enhancing land-based carbon sinks (Nunes et al. 2017; Bustamante et al. 2018; Soterroni et al. 2018, 2019). In parallel, public policies reinforced environmental regulation and command-and-control instruments to limit deforestation rates and implemented market-based mechanisms to provide benefits to those protecting local ecosystems and enhancing land-based carbon sinks (Sunderlin et al. 2014; Nunes et al. 2017; Hein et al. 2018; Simonet et al. 2019). The private sector, aligned with public policies and civil society, implemented the Amazon Soy Moratorium, a voluntary agreement that bans trading of soybeans from cropland associated with cleared Amazon rainforest and blacklists farmers using slave labour. This was achieved without undermining production of soybean commodities (Soterroni et al. 2019). As a result, between 2005 and 2012, the country halved its GHG emissions and reduced the rate of deforestation by 78% (INPE 2019a,b). This example shows that development delivering well-being can be accompanied by significant mitigation. A long-term and strategic vision was important in guiding enabling policies and mechanisms.
In more recent years, some of these shifts in Brazil’s development pathways were undone. Political changes have redefined development priorities, with higher priority being given to agricultural development than climate change mitigation. The current administration has reduced the power of environmental agencies and forestry protection laws (including the forest code), while allowing the expansion of cropland to protected Amazon rainforest areas (Ferrante and Fearnside 2019; Rochedo et al. 2018). As a result, in 2020, deforestation exceeded 11,000 km 2, and reached the highest rate in the last 12 years (INPE 2020). The literature cautions that, if current policies and trends continue, the Amazon may reach an irreversible tipping point beyond which it will be impossible to remediate lost ecosystems and restore carbon sinks and indigenous people knowledge (Lovejoy and Nobre 2018; INPE 2019a; Nobre 2019). In addition, fossil fuel subsidies and other fiscal support of increased exploitation of oil resources may create carbon lock-ins that further inhibit low-carbon investments (Lefèvre et al. 2018).
Brazil’s progress in mitigation depended significantly on reduced deforestation in the past. If deforestation rates keep on rising, mitigation efforts would need to shift to the energy sector. However, according to Rochedo et al. (2018), mitigation costs in the energy sector in Brazil are three times the costs of reducing deforestation and increasing land-based carbon sinks. Further mitigation strategies may depend on CCS in Brazil as elsewhere (Herreras Martínez et al. 2015; Nogueira de Oliveira et al. 2016), though the economic feasibility of deployment is not yet clear (Section 4.2.5.4).
4.4.2Adaptation, Development Pathways and Mitigation
Mitigation actions are strongly linked to adaptation. These connections come about because mitigation actions can be adaptive (e.g., some agroforestry projects) but also through policy choices (e.g., climate finance is allocated among adaptation or mitigation projects) and even biophysical links (e.g., climate trajectories, themselves determined by mitigation, can influence the viability of adaptation projects). As development pathways shape the levers and enablers available to a society (Section 4.3.1, Figure 4.7), a broader set of enabling conditions also helps with adaptation (medium evidence, high agreement).
Previous assessments have consistently recognised this linkage. The Paris Agreement includes mitigation and adaptation as key areas of action, through NDCs and communicating adaptation actions and plans. The Agreement explicitly recognises that mitigation co-benefits resulting from adaptation can count towards NDC targets. The IPCC Fifth Assessment Report (IPCC 2014) emphasised that sustainable development is helpful in going beyond a narrow focus on separate mitigation and adaptation options and their specific co-benefits. The IPCC Special Report on climate change and land addresses GHG emissions from land-based ecosystems with a focus on the vulnerability of land-based systems to climate change. The report identifies the potential of changes to land use and land management practices to mitigate and adapt to climate change, and to generate co-benefits that help meet other SDGs (Jian et al. 2019).
A substantial literature detailing trade-offs and synergies between mitigation and adaptation exists and is summarised in the IPCC SR1.5 including energy system transitions; land and ecosystem transitions (including addressing food system efficiency, sustainable agricultural intensification, ecosystem restoration); urban and infrastructure system transitions (including land use planning, transport systems, and improved infrastructure for delivering and using power); industrial system transitions (including energy efficiency, bio-based and circularity, electrification and hydrogen, and industrial carbon capture, utilisation and storage (CCUS); and carbon dioxide removal (including bioenergy with CCS, afforestation and reforestation, soil carbon sequestration, and enhanced weathering) (IPCC 2018: Table 4.SM.5.1). Careful design of policies to shift development pathways towards sustainability can increase synergies and manage trade-offs between mitigation and adaptation (robust evidence, medium agreement).
This section examines how development pathways can build greater adaptive and mitigative capacity, and then turns to several examples of mitigation actions with implications for adaptation where there is a notable link to development pathways and policy choices. These examples are in the areas of agriculture, blue carbon and terrestrial ecosystem restoration.
4.4.2.1Development Pathways can Build Greater Capacity for Both Adaptation and Mitigation
Previous IPCC assessments have reflected on making development more sustainable (IPCC et al. 2001; Sathaye et al. 2007; Fleurbaey et al. 2014). Other assessments have highlighted how ecosystem functions can support sustainable development and are critical to meeting the goals of the Paris Agreement (IPBES 2019b). IPCC SR1.5 found that sustainable development pathways to 1.5°C broadly support and often enable transformations and that ‘sustainable development has the potential to significantly reduce systemic vulnerability, enhance adaptive capacity, and promote livelihood security for poor and disadvantaged populations ( high confidence)’ (IPCC 2018b: Section 5.3.1). With careful management, shifting development pathways can build greater adaptive and mitigative capacity, as further confirmed in recent literature (Schramski et al. 2018; Harvey et al. 2014; Ebi et al. 2014; Rosenbloom et al. 2018; Antwi-Agyei et al. 2015; Singh 2018; IPBES 2019b). The literature points to the challenge of design of specific policies and shifts in development pathways to achieve both mitigation and adaptation goals.
Governance and institutional capacity
Governance and institutional capacity necessary for mitigation actions also enables effective adaptation actions. Implementation of mitigation and adaptation actions can, however, encounter different sets of challenges. Mitigation actions requiring a shift away from established sectors and resources (e.g., fossil fuels) entail governance challenges to overcome vested interests (Piggot et al. 2020; SEI et al. 2020). Mitigation-focused initiatives from non-state actors tend to attain greater completion than adaptation-focused initiatives (NewClimate Institute et al. 2019).
Behaviour and lifestyles
On the level of individual entities, adaptation is reactive to current or anticipated environmental changes but mitigation is undertaken deliberately. Chapter 5 considers behavioural change, including the reconsideration of values and what is meant by well-being, and reflecting on a range of actors addressing both adaptation and mitigation. Shifting development pathways may be disruptive (Cross-Chapter Box 5), and there may be limits to propensity to change. Some studies report that climate change deniers and sceptics can be induced to undertake pro-environmental action if those actions are framed in terms of societal welfare, not climate change (Bain et al. 2012; Hornsey et al. 2016). Concrete initiatives to change behaviour and lifestyles include the Transition Town movement, which seeks to implement a just transition – both in relation to adaptation and mitigation – in specific localities (Roy et al. 2018).
Finance
Finance and investment of mitigation actions must be examined in conjunction with funding of adaptation actions, due to biophysical linkages and policy trade-offs (Box 15.1). Most climate funding supports mitigation efforts, not adaptation efforts (Buchner et al. 2019) (Halimanjaya and Papyrakis 2012). Mitigation projects are often more attractive to private capital (Abadie et al. 2013; Buchner et al. 2019). Efforts to integrate adaptation and mitigation in climate change finance are limited (Kongsager et al. 2016; Locatelli et al. 2016) There is a perception that integration of mitigation and adaptation projects would lead to competition for limited finance available for adaptation (Locatelli et al. 2016). Long-standing debates (Ayers and Huq 2009; Smith et al. 2011) whether development finance counts as adaptation funding remain unresolved. See Chapter 15 for more in-depth discussion relating investment in funding mitigation and adaptation actions.
Innovation and technologies
Systems transitions that address both adaptation and mitigation include the widespread adoption of new and possibly disruptive technologies and practices and enhanced climate-driven innovation (IPCC 2018a). See Chapter 16 for an in-depth discussion of innovation and technology transfer. The literature points to trade-offs that developing countries face in investing limited resources in research and development, though finding synergies in relation to agriculture (Adenle et al. 2015). Other studies point to difference in technology transfers for adaptation and mitigation (Biagini et al. 2014). Adaptation projects tend to use existing technologies whereas mitigation climate actions are more likely to rely on novel technologies. Innovations for mitigation are typically technology transfers from developed to less-developed countries (Biagini et al. 2014), however this so-called North-South technology transfer pathway is not exclusive (Biagini et al. 2014), and is increasingly challenged by China’s global role in implementing mitigation actions (Chen 2018; Urban 2018). Indigenous knowledge can be a unique source for techniques for adaptation (Nyong et al. 2007) and may be favoured over externally generated knowledge (Tume et al. 2019).
Policy
Adaptation-focused pathways might reduce inequality, if adequate support is available and well-distributed (Pelling and Garschagen 2019). Some studies suggest that cities might plan for possible synergies in adaptation and mitigation strategies, currently done independently (Grafakos et al. 2019). The literature suggests that cities might identify both mitigation and adaptation as co-benefits of interventions targeted at developmental goals (Dulal 2017).
4.4.2.2 Specific Links Between Mitigation and Adaptation
Mitigation actions can be adaptive and vice-versa. In particular, many nature-based solutions (NBS) for climate mitigation are adaptive (medium evidence, medium agreement). Multiple NBS are being pursued under current development pathways (Chapter 7), but shifting to sustainable development pathways may enable a wider set of nature-based mitigation solutions with adaptation benefits. An example of this would be a shift to more sustainable diets through guidelines, carbon taxes, or investment in R&D of animal product substitutes (Figure 13.2) which could reduce pressure on land and allow for implementation of multiple NBS. Many of these solutions are consistent with meeting other societal goals, including biodiversity conservation and other sustainable development goals (Griscom et al. 2017; Fargione et al. 2018; Tallis et al. 2018). However, there can be synergies and trade-offs in meeting a complex set of sustainability goals (e.g., biodiversity, Section 7.6.5 and 3.1.5).
Development is a key factor leading to land degradation in many parts of the world (IPBES 2019b). Shifting development pathways to sustainability can include restoration and protection of ecosystems, which can enhance capacity for both mitigation and adaptation actions (IPBES 2019b).
In this section, we explore mitigation actions related to sustainable agriculture, coastal ecosystems (‘blue carbon’), and restoration and protection of some terrestrial ecosystems. These mitigation actions are exemplary of trade-offs and synergies with adaptation, sensitivity to biophysical coupling, and linkages to development pathways. Other specific examples can be found in Chapters 6 to 11.
Farming system approaches can benefit mitigation and adaptation
Farming system approaches can be a significant contributor to mitigation pathways. These practices (which are not mutually exclusive) include agroecology, conservation agriculture, integrated production systems and organic farming (Box 7.5). Such methods have potential to sequester significant amounts of soil carbon (Section 7.4.3.1) as well as reduce emissions from on-field practices such as rice cultivation, fertilizer management, and manure management (Section 7.4.3) with total mitigation potential of 3.9 ± 0.2 GtCO2-eq yr –1 (Chapter 7). Critically, these approaches may have significant benefits in terms of adaptation and other development goals.
Farming system approaches to agricultural mitigation have a wide variety of co-benefits and trade-offs. Indeed, there are conceptual formulations for these practices in which the co-benefits are more of a focus, such as climate-smart agriculture (CSA) which ties mitigation to adaptation through its three pillars of increased productivity, mitigation, and adaptation (Lipper et al. 2014). The ‘4 per 1000’ goal to increase soil carbon by 0.4% per year (Soussana et al. 2019) is compatible with the three pillars of CSA. Sustainable intensification, a framework which centers around a need for increased agricultural production within environmental constraints also complements CSA (Campbell et al. 2014). The literature reports examples of mitigation co-benefits of adaptation actions, with evidence from various regions (Thornton and Herrero 2015; Thornton et al. 2018) (Chapter 7).
Conservation agriculture, promoted for improving agricultural soils and crop diversity (Powlson et al. 2016) can help build adaptive capacity (Smith et al. 2017; Pradhan et al. 2018a) and yield mitigation co-benefits through improved fertiliser use or efficient use of machinery and fossil fuels (Harvey et al. 2014; Cui et al. 2018; Pradhan et al. 2018a).
There is a complex set of barriers to implementation of farming-system approaches for climate mitigation (Section 7.6.4), suggesting a need for deliberate shifts in development pathways to achieve significant progress in this sector. The link between NDCs and mitigation in the land use sector can provide impetus for such policies. For example, there are multiple agricultural mitigation options that southeast Asian countries could use to meet NDCs that would have an important adaptive impact (Amjath-Babu et al. 2019).
Some agricultural practices considered sustainable have trade-offs, and their implementation can have negative effects on adaptation or other ecosystem services. Fast-growing tree monocultures or biofuel crops may enhance carbon stocks but reduce downstream water availability and decrease availability of agricultural land (Windham-Myers et al. 2018; Kuwae and Hori 2019). In some dry environments similarly, agroforestry can increase competition with crops and pastures, decreasing productivity, and reduce catchment water yield (Schrobback et al. 2011).
Agricultural practices can adapt to climate change while decreasing CO2 emissions on the farm field. However, if such a practice leads to lower yields, interconnections of the global agricultural system can lead to land use change elsewhere and a net increase in GHG emissions (Erb et al. 2016). Implementation of sustainable agriculture can increase or decrease yields depending on context (Pretty et al. 2006).
Blue carbon and mitigation co-benefits of adaptation actions
The Paris Agreement recognises that mitigation co-benefits resulting from Parties’ adaptation actions and/or economic diversification plans can contribute to mitigation outcomes (UNFCCC 2015a: Article 4.7). Blue carbon refers to biologically-driven carbon flux or storage in coastal ecosystems such as seagrasses, salt marshes, and mangroves (Wylie et al. 2016; Fennessy et al. 2019; Fourqurean et al. 2012; Tokoro et al. 2014) (see Cross-Chapter Box 8 on blue carbon as a storage medium and removal process).
Restoring or protecting coastal ecosystems is a mitigation action with synergies with adaptation and development. Such restoration has been described as a ‘no regrets’ mitigation option in the Special Report on the Ocean and Cryosphere in a Changing Climate (Bindoff et al. 2019) and advocated as a climate solution at national scales (Bindoff et al. 2019; Taillardat et al. 2018; Fargione et al. 2018) and global scales (Howard et al. 2017). On a per-area basis, carbon stocks in coastal ecosystems can be higher than in terrestrial forests (Howard et al. 2017), with below-ground carbon storage up to 1000 tC ha –1 (McLeod et al. 2011; Crooks et al. 2018; Bindoff et al. 2019). Overall, coastal vegetated systems have a mitigation potential of around 0.5% of current global emissions, with an upper limit of less than 2% (Bindoff et al. 2019).
Restoration or protection of coastal ecosystems is an important adaptation action with multiple benefits, with bounded global mitigation benefits (Gattuso et al. 2018; Bindoff et al. 2019). Such restoration/preservation reduces coastal erosion and protects from storm surges, and otherwise mitigates impacts of sea level rise and extreme weather along the coast line (Siikamäki et al. 2012; Romañach et al. 2018; Alongi 2008). Restoration of tidal flow to coastal wetlands inhibits methane emissions which occur in fresh and brackish water (Kroeger et al. 2017) (Section 7.4.2.8 describes a more inclusive set of ecosystem services provided by coastal wetlands). Coastal habitat restoration projects can also provide significant social benefits in the form of job creation (through tourism and recreation opportunities), as well as ecological benefits through habitat preservation (Edwards et al. 2013; Sutton-Grier et al. 2015; Sutton-Grier and Moore 2016; Wylie et al. 2016; Kairo et al. 2018; Bindoff et al. 2019).
Coastal ecosystem-based mitigation can be cost-effective, but interventions should be designed with care. One concern is to assure that actions remain effective at higher levels of climate change (Alongi 2015; Bindoff et al. 2019). Also, methane emissions from ecosystems may partially reduce the benefit of the carbon sequestration (Rosentreter et al. 2018) depending on the salinity (Poffenbarger et al. 2011; Kroeger et al. 2017). As the main driver of mangrove forest loss is aquaculture/agriculture (Thomas et al. 2017), there may be entrenched interests opposing restoration and protection actions.
Restoration and protection of terrestrial ecosystems
Restoration of terrestrial landscapes can be a direct outcome of development pathways, and can be critical to achieving a variety of SDGs (especially 1, 2, 6, 8, 13, 15) (Vergara et al. 2016; Lapola et al. 2018) although it also presents risks and can have trade-offs with other SDGs (Cao et al. 2010; Dooley and Kartha 2018). Landscape restoration is nearly always a mitigation action, and can also provide adaptive capacity. While policy in Brazil has tended to focus on the Amazon as a carbon sink, the mitigation co-benefits of ecosystem-based adaptation actions have been highlighted in the literature (Locatelli et al. 2011; Di Gregorio et al. 2016). A study of potential restoration of degraded lands in Latin America (Vergara et al. 2016) indicates that substantial benefits for mitigation, adaptation, and economic development accrue after several years, underscoring a reliance on deliberate development choices. In agricultural contexts, restoration is a development choice that can enhance adaptive and mitigative capacity via impact on farmer livelihoods.
Preventing degradation of landscapes can support both mitigation and adaptation (IPCC 2019). Restoration of ecosystems is associated with improved water filtration, groundwater recharge and flood control and multiple other ecosystem services (Ouyang et al. 2016).
Restoration projects must be designed with care. There can be trade-offs in addition to the synergies noted above (Section 7.6.4.3). Restorations may be unsuccessful if not considered in their socio-economic context (Lengefeld et al. 2020; Iftekhar et al. 2017; Jellinek et al. 2019). Restoration projects for mitigation purposes can be more effective if done with adaptation in mind (Gray et al. 2011) as a changing climate may render some mitigation actions biophysically infeasible (Arneth et al. 2021). Landscape restoration projects intended for CDR may underperform due to future release of stored carbon, or deferral of storage until after irreversible climate change effects (e.g. extinctions) (Dooley and Kartha 2018).
Afforestation plans have received substantial attention as a climate mitigation action, with ongoing unresolved debate on the feasibility and trade-offs of such plans. Such afforestation programs can fail for biophysical reasons (Fleischman et al. 2020) (Section 7.4.2.2) but also lack of consideration of socioeconomic and development contexts (Fleischman et al. 2020).
4.4.3Risks and Uncertainties
Shifting development pathways and accelerating mitigation are complex endeavours that carry risks. Some of these risks can be easily captured by quantitative models. Others are better understood via qualitative approaches, such as qualitative narrative storylines (told in words) and methods mixing qualitative and quantitative models (Kemp-Benedict 2012; Hanger-Kopp et al. 2019). The following outline key risks and relevant hedging strategies identified in the literature.
4.4.3.1Actions by Others Not Consistent With Domestic efforts
The international context is a major source of uncertainty for national-level planning, especially for small- or medium-sized open economies, because the outcome of domestic choices may significantly depend on decisions made by other countries and actor, over which national governments have limited or no control (Lachapelle and Paterson 2013). Availability of foreign financial resources in countries with limited domestic savings (Baum et al. 2017) and availability of technology transfers (Glachant and Dechezleprêtre 2017) are some examples. Other external decisions with significant bearing on domestic action include mitigation policies in other countries (Dai et al. 2017), and especially in major trading partners, the lack of which can result in competitive disadvantage for sectors exposed to international competition (Alton et al. 2014). The international prices of the key commodities (notably energy), goods and services are important, notably when shifting development pathway is based on structural change (e.g., Willenbockel et al. 2017 for Ghana and Kenya).
Remedies include first devising policy packages that are, to the extent possible, robust to uncertainty regarding external decisions. For example, mitigation in the building sector is considered less problematic for competitiveness since the construction sector is less exposed to international competition. Remedies also include securing international cooperation to reduce the uncertainty that domestic decision-makers face about the international context. Shifting investments towards low-GHG solutions requires a combination of conducive public policies, attractive investment opportunities and financing of transitions (Section 15.6), which can enable shifting development pathways. Cooperation can generate positive spill overs through technology diffusion (Section 13.6.6). Third, cooperation is not limited to governments. As discussed in Section 4.2.3, international cooperative initiatives among non-state actors (cities, economic branches, etc.) can also provide know-how, resources and stable cooperative frameworks that reduce uncertainty for individual actors (Section 14.5.5).
4.4.3.2Parts of Complex Policy Packages Fail
As outlined in the examples in Section 4.4.1 above, shifting development pathways and accelerating mitigation are complex endeavours, on which there is limited experience and know-how from the past. An uncertainty is that parts of these policy packages may fail, in other words, under-deliver relative to the amount of mitigation and of transformations initially expected. For example, France has failed to meet its 2015–2018 carbon budget as housing retrofitting programs, in particular, have failed to deliver the expected amount of emission reductions (Haut Conseil pour le Climat 2019). There are two main options to tackle this risk. The first is to build in redundancy. The second is to anticipate that some parts of the policies will inevitably fail, and build-in monitoring and corrective mechanisms in a sequential decision-making process. To this regard, building institutions that can properly monitor, learn from and improve over time is critical (Nair and Howlett 2017).
4.4.3.3New Information Becomes Available
The science on climate change, its impacts and the opportunities to mitigate is continuously being updated. Even though decisions are no longer made ‘in a sea of uncertainty’ (Lave 1991), we know that new information will come over time, that may have significant bearing on the design and objectives of policies to shift development pathways and accelerate mitigation. New information may come from climate sciences (e.g., updated GWP values or available carbon budgets) (Quéré et al. 2018), impact sciences (e.g., re-evaluation of climate impacts associated with given emission pathways) (Ricke et al. 2018) or mitigation sciences (e.g., on availability of given technologies) (Lenzi et al. 2018; Giannousakis et al. 2020).
At the same time, economic and social systems are characterised by high degree of inertia, via long-lived capital stock or urban forms (Lecocq and Shalizi 2014), or more broadly mutually reinforcing physical, economic, and social constraints (Seto et al. 2016) that may lead to carbon lock-ins (Erickson et al. 2015). Risks associated with long-lasting fossil-fuel power plants have been the object of particular attention. For example, Pfeiffer et al. (2018) estimate that even if the current pipeline of power plants was cancelled, about 20% of the existing capacity might be stranded to remain compatible with 1.5°C or 2°C pathways – implying that additional capital accumulation would lead to higher sunk costs associated with stranded assets (Ansar et al. 2013; Johnson et al. 2015; Kriegler et al. 2018; Luderer et al. 2018b).
In the presence of uncertainty and inertia (or irreversibilities), hedging strategies may be considered, that include selection of risk-hedging strategies and processes to adjust decisions as new information becomes available. The notion of hedging against risks is also prominent in the adaptation literature, as exemplified by the terminology of ‘climate resilient development’ (Fankhauser and McDermott 2016) (AR6 WGII, Chapter18). There is also a growing literature on hedging strategies for individual actors (e.g., firms or investors) in the face of the uncertainties associated with mitigation (e.g., policy uncertainty or the associated carbon price uncertainty; e.g., Andersson et al. 2016 or Morris et al. 2018). On the other hand, there is often limited discussion of uncertainty and of its implication for hedging strategies in the accelerated mitigation pathway literature. Exceptions include (Capros et al. 2019), who elicit ‘no-regret’ and ‘disruptive’ mitigation options for the EU through a detailed sensitivity analysis, and (Watson et al. 2015) who discuss flexible strategies for the UK energy sector transition in the face of multiple uncertainties.
4.4.3.4Black Swans (Such as the COVID-19 Crisis)
As the current COVID-19 crisis demonstrates, events happen that can derail the best-laid plans. Unexpected events beyond the range of human experience until then are called ‘black swans’, given the expectation that all swans are white. The only point to note here is that such events may also provide opportunities. In the COVID-19 case, for example, the experience of conducting many activities on-line, which reduces emissions from transport, may leave an imprint on how some of these activities are carried out in the post-COVID-19 world. Similarly, reduced air pollution seen during the pandemics may increase support for mitigation and strengthen the case for climate action. However, the emissions implications of recovery packages depend on choosing policies that support climate action while addressing the socio-economic implications of COVID-19 (Hepburn et al. 2020). Governments may be in a stronger position to do so due to their pivotal role in assuring the survival of many businesses during the pandemics. Given the magnitude of recovery packages and their implications (Pollitt et al. 2021), choosing the direction of recovery packages amounts to choosing a development pathway (Cross-Chapter Box 1 in Chapter 1).
4.4.3.5Transformations Run Into Oppositions
As noted above, shifting development pathways and accelerating mitigation involve a broad range of stakeholders and decision-makers, at multiple geographical and temporal scales. They require a credible and trusted process for reconciling perspectives and balancing potential side-effects, managing winners and losers and implementing compensatory measures to ensure an inclusive just transition (Newell and Mulvaney 2013; Miller and Richter 2014; Gambhir et al. 2018; Diffenbaugh and Burke 2019). Such processes are designed to manage the risk of inequitable or non-representative power dynamics (Helsinki Design Lab 2011; Boulle et al. 2015; Kahane 2012). More generally, stakeholder processes can be subject to regulatory capture by special interests, or outright opposition from a variety of stakeholders. Information asymmetry between government and business may shape the results of consultative processes. Long experience of political management of change demonstrates that managing such risks is not easy, and requires sufficiently strong and competent institutions (Stiglitz 1998). The next section on Just Transition (Section 4.5) addresses this issue.
4.5Equity, Including Just Transitions
Equity is an ethical and at times economic imperative, but it is also instrumentally an enabler of deeper ambition for accelerated mitigation (Hoegh-Guldberg et al. 2019). The literature supports a range of estimates of the net benefits – globally or nationally – of low-carbon transformation, and it identifies a number of difficulties in drawing definitive quantitative conclusions (e.g., comparisons of costs and benefits among different actors, the existence of non-economic impacts, comparison across time, uncertainty in magnitude) (Section 3.6). One of the most important of these dimensions is the distributional consequences of mitigation, as well as a range of equity considerations arising from the uncertainty in net benefits, as well as from the distribution of costs and benefits among winners and losers (Rendall 2019; Caney 2016; Lahn and Bradley 2016; Lenferna 2018a; Kartha et al. 2018b; Robiou Du Pont et al. 2017). Some equity approaches are even just seeking corrective justice including for historical emissions (Adler 2007). For an assessment of literature on fairness in NDCs, see Section 4.2.2.7.
Equity issues are often discussed in the literature via frameworks that are well-founded in the ethical literature and that have a strong bearing on effort-sharing, but have not yet been quantitatively modelled and expressed in the form of an emissions allocation quantified framework. These include, for example, ethical perspectives based in human rights (Johl and Duyck 2012), human capabilities (Klinsky et al. 2017b), environmental justice (Mohai et al. 2009; Schlosberg 2009), ecological debt (Srinivasana et al. 2008; Warlenius et al. 2015), transitional justice (Klinsky 2017; Klinsky and Brankovic 2018), and planetary boundaries (Häyhä et al. 2016).
While there is extensive literature on equity frameworks for national emissions allocations (CSO Equity Review 2015, 2017, 2018; Holz et al. 2018; Kemp-Benedict et al. 2018; Robiou du Pont and Meinshausen 2018; Fyson et al. 2020; Pozo et al. 2020; Pye et al. 2020), such studies have tended to focus on allocation of a global carbon budget among countries based on quantified equity frameworks. The implicit normative choices made in these analysis have limitations (Kartha et al. 2018a). Moreover, there are many ethical parameters that could be introduced to enrich the existing quantitative frameworks, such as progressivity (Holz et al. 2018), consumption-based accounting (Afionis et al. 2017), prioritarianism (Adler and Treich 2015 ), and a right to development (Moellendorf 2020). Introducing these ethical frames into conventional quantification approaches generally implies greater allocations for poorer and lower-emitting populations, suggesting that the approaches that are typically highlighted in emissions allocation analyses tends to favour wealthier and higher-emitting countries. Broader, more inclusive sharing of costs and burdens is seen as a way to enhance equity in procedures and outcomes.
Ultimately, equity consequences depend on how costs and benefits are initially incurred and how they are shared as per social contracts (Combet and Hourcade 2017), national policy, and international agreements. The literature suggests a relationship between the effectiveness of cooperative action and the perception of fairness of such arrangements. Winkler et al. (2018) demonstrate that countries have put forward a wide variety of indicators and approaches for explaining the fairness and ambition of their NDCs, reflecting the broader range of perspectives found in the moral philosophical literature cited above. Mbeva and Pauw (2016) further find that adaptation and financing issues take on greater salience in the national perspectives reflected in the NDCs.
Topics of equity and fairness have begun to receive a greater amount of attention within the energy and climate literature, namely through the approaches of gender and race (Pearson et al. 2017; Lennon 2017; Allen et al. 2019), climate justice (Roberts and Parks 2007; Routledge et al. 2018) (Roberts & Parks, 2006; Routledge et al. 2018), and energy justice (Sovacool and Dworkin 2014). While such approaches frequently envision justice and equity as an ethical imperative, justice also possesses the instrumental value of enabling deeper and more socially acceptable mitigation efforts (Klinsky and Winkler 2018 ).
A concrete focal point on these issues has been that of ‘just transition’. Getting broad consensus for the transformational changes entailed in moving from a high- to a low-carbon economy means ‘leaving no one behind’, in other words, ensuring (sufficiently) equitable transition for the relevant affected individuals, workers, communities, sectors, regions and countries (Newell and Mulvaney, 2013; Jasanoff 2018). The concept of a ‘just transition’ owes its origin to the USA trade union movement of the 1980s. The earliest version of a just transition was called the ‘Superfund for Workers’ modelled on the 1980 Superfund program that designed federal funds for the clean-up of toxic substances from chemicals, mining and energy production (Stevis and Felli 2015). It was further taken up, for example in the collaboration of the International Trade Union Confederation (ITUC), the International Labour Organization (ILO) and the UN Environment Programme (UNEP) in promoting ‘green jobs’ as integral elements of a just transition (ILO 2015; Rosemberg 2010). In recent years the concept of a ‘just transition’ has gained increased traction, for example incorporated in the outcome of the Rio+20 Earth Summit and more recently recognised in the preamble of the Paris Agreement, which states ‘the imperative of a just transition of the workforce and the creation of decent work and quality jobs in accordance with nationally defined development priorities’ (UNFCCC 2015a). Some heads of state and government signed a Solidarity and Just Transition Silesia Declaration first introduced at COP24 in Poland (HoSG 2018).
The literature identifies targeted and proactive measures from governments, agencies, and authorities to ensure that any negative social, environmental or economic impacts of economy-wide transitions are minimised, while benefits are maximised for those disproportionally affected (Healy and Barry 2017). While the precise definition varies by source, core elements tend to include: (i) investments in establishing low-emission and labour-intensive technologies and sectors (Mijn Cha et al. 2020); (ii) research and early assessment of the social and employment impacts of climate policies (Green and Gambhir 2020; Mogomotsi et al. 2018); (iii) social dialogue and democratic consultation of social partners and stakeholders (Swilling and Annecke 2012; Smith 2017); (iv) the creation of decent jobs; active labour markets policies; and rights at work (ILO 2015; UNFCCC 2016c); (v) fairness in energy access and use (Carley and Konisky 2020); (vi) economic diversification based on low-carbon investments; (vii) realistic training/retraining programs that lead to decent work; (viii) gender specific politics that promote equitable outcomes (Allwood 2020); (ix) the fostering of international cooperation and coordinated multilateral actions (Lenferna 2018b; Newell and Simms 2020); (x) redressing of past harms and perceived injustices (Setzer and Vanhala 2019; UNHRC 2020); and (xi) consideration of inter-generational justice concerns, such as the impacts of policy decisions on future generations (Newell and Mulvaney, 2013).
A just transition could therefore entail that the state intervenes more actively in the eradication of poverty, and creates jobs in lower-carbon sectors, in part to compensate for soon-to-be abandoned fossil-fuel-based sectors, and that governments, polluting industries, corporations and those more able to pay higher associated taxes pay for transition costs, provide a welfare safety net and adequate compensation for people, communities, places, and regions that have been impacted by pollution, marginalised or negatively impacted by a transition from a high- to low-carbon economy and society (Muttitt and Kartha 2020; Le Billon and Kristoffersen 2020; Kartha et al. 2018b). Reducing climate impacts is another important dimension of equity, in that the poor who are least responsible for climate change are most vulnerable to its impacts (AR6 WGII, Chapter 8). Focusing on financial losses alone however can obscure an important distinction between losses incurred by corporations and states and losses experienced by workers and communities. Processes established in the name of a just transition are also at risk of being co-opted by incumbent interests and powerful/wealthy agents (Green and Gambhir, 2020). Policy interventions associated with good governance, democratic oversight, and legal recourse can help overcome attempted co-optation of just transition, or use of COVID-19 recovery packages for continued carbon lock-in (Hepburn et al. 2020; SEI et al. 2020).
The just transition concept has thus become an international focal point tying together social movements, trade unions, and other key stakeholders to ensure equity is better accounted for in low-carbon transitions and to seek to protect workers and communities. It also forms a central pillar of the growing movement for a ‘Green New Deal’ – a roadmap for a broad spectrum of policies, programs, and legislation that aims to rapidly decarbonise the economy while significantly reducing economic inequality (Allam et al. 2021; Galvin and Healy 2020). The US Green New Deal Resolution (Ocasio-Cortez 2019) for example, positions structural inequality, poverty mitigation, and a just transition at its centre. The European Green Deal proposed in 2019 (European Commission 2019), including a €100 billion ‘Just Transition Mechanism’ to mitigate the social effects of transitioning away from jobs in fossil-based industries. National level green new deals with strong just transition components have been proposed in South Korea, Australia, Spain, UK, Puerto Rico, Canada, as well as regional proposals across Latin America and the Caribbean (Pollin 2020).
A just transition at national, regional and local scales can help to ensure that workers, communities, frontline communities and the energy-poor are not left behind in the transition. Moreover, a just transition necessitates that rapid decarbonisation does not perpetuate asymmetries between richer and poorer states and people (UNHRC 2020). Alliances around a just transition in countries across the world take many forms (Box 4.6).
As Figure 4.9 shows, no fewer than seven national commissions or task forces on a just transition existed as of 2020 as well as seven other sets of national policies and a multitude of other actors, networks, and movements. For instance, the German phase-out of coal subsidies involved a savings package for unemployed miners. Subsidy reform packages introduced by Iran, Namibia, the Philippines, Turkey, and United Kingdom provide similar compensating measures to affected groups (Sovacool 2017). Spain’s just transition plan for coal miners includes early retirement, redundancy packages, silicosis compensation, retraining for green jobs, and priority job placement for former miners.
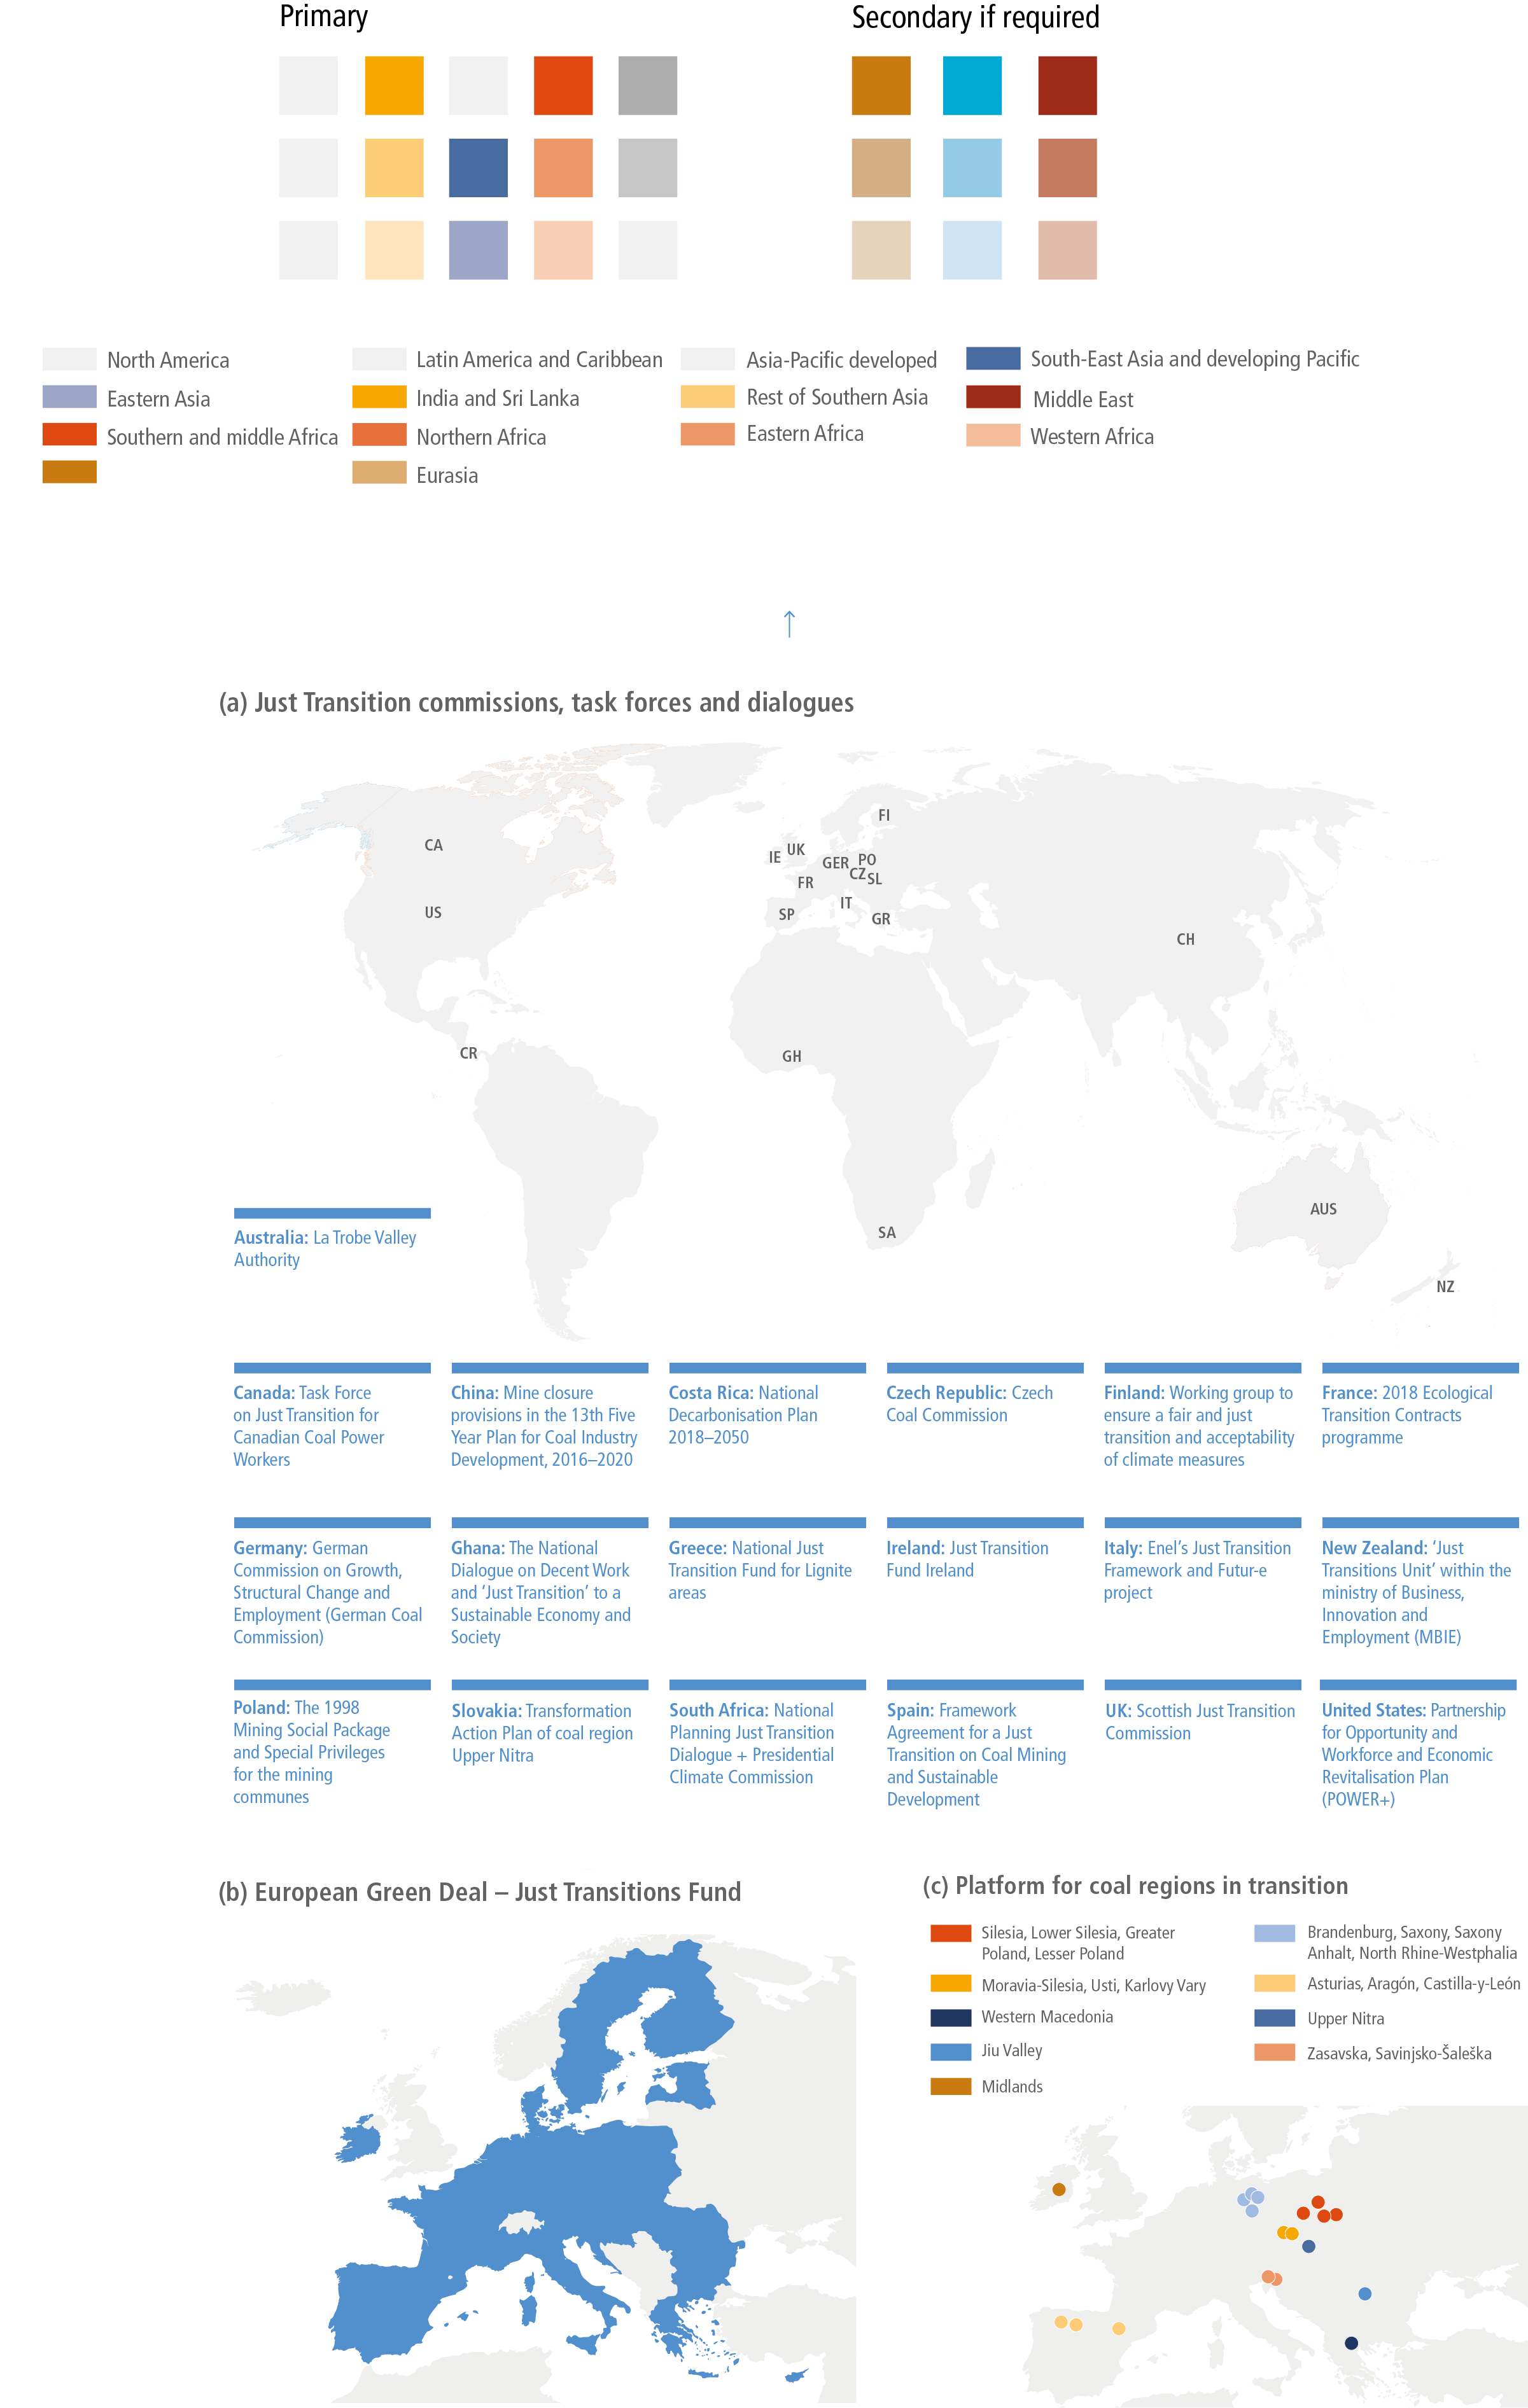
Figure 4.9 | Just Transitions around the world, 2020. Panel (a) shows commissions, task forces, dialogues behind a just transition in many countries (Schweitzer and Tonn 2003; Thalmann 2004; Harrison 2013; Galgóczi 2014; Mendoza 2014; Adeoti et al. 2016; Ng et al. 2016; Gass and Echeverria 2017; Snell 2018; ILO 2018; Ministry of Employment and Labour Relations of Ghana 2018; Szpor, A. and Ziółkowska 2018; van Asselt and Moerenhout 2018; Bankwatch 2019; Commission on Growth Structural Change and Employment 2019; European Union 2019, 2020; Galgóczi 2019; Government of Canada 2019; Government of Costa Rica 2019; NPC (National Planning Commission) 2019; Ministry of Business Innovation & Employment New Zealand 2019; Piggot et al. 2019; Popp 2019; Strambo et al. 2019; Government of Spain 2019; Finnish Government 2020; Scottish Government 2020; White House 2016; Mijn Cha et al. 2020); panel (b) shows the funds related to the Just Transition within the European Union Green Deal, and panel (c) shows the European Union’s Platform for Coal Regions in Transition.
Box 4.6 | Selected Organisations and Movements Supporting a Just Transition
•350.org (global)
•Asian Pacific Forum on Women, Law and Development (Asia Pacific)
•Blue Green Alliance (USA)
•Beyond Coal campaign (USA)
•Central Única dos Trabalhadores (Brazil)
•Climate Action Network (global)
•Climate Justice Alliance (USA)
•Cooperation Jackson (USA)
•Dejusticia (Colombia)
•Deutscher Gewerkschaftsbund (German Trade Union Confederation, Germany)
•DiEM25 (pan-European)
•European Union
•European Trade Union Confederation (EU)
•Grassroots Global Justice (USA)
•IndustriALL Global Union (global)
•Indigenous Environmental Network (USA)
•International Labor Organization (global)
•ITUC-affiliated Just Transition Centre (global)
•ITUC-affiliated Just Transition Centre (Americas)
•Just Transition Alliance (USA)
•Just Transition Centre (global)
•Just Transition Fund (USA)
•Kentuckians for the Commonwealth (USA)
•Labor Network for Sustainability (USA)
•Latrobe Valley Authority (Australia)
•Movement Generation (USA)
•NAACP (USA)
•National Union of Mineworkers of South Africa (South Africa)
•Pan African Climate Justice Alliance (Africa)
•Post Petroleum Transitions Roundtable (Mesa de Transición Post Petrolera) (Argentina)
•Powering Past Coal Alliance (global)
•Right to the city alliance (USA)
• Sierra Club (USA)
• Sunrise Movement (USA)
•The Leap Manifesto (Canada)
•The Trade Unions for Energy Democracy Initiative (global)
•Trade Union Confederation of the Americas (TUCA)
•Transition Towns Movement (UK)
•Women’s Environment and Development Organization (global)
4.6Knowledge Gaps
This section summarises knowledge gaps that require further research:
•Literature on mitigation pathways at the national level remains skewed towards large emitters. Many low-income countries have very few or no studies at all (Lepault and Lecocq 2021) (Section 4.2) (Annex III). Development of new studies and inclusion of associated scenarios in updated mitigation national mitigation pathway database would enhance understanding of mitigation at national level.
•Ex ante and ex post analysis of mitigation action and of mitigation plans by non-state actors, and their relationship with mitigation action and plans by governments is limited (Section 4.2.3).
• System analysis solutions are only beginning to be recognised in current literature on deep mitigation pathways, and rarely included in existing national policies or strategies (Section 4.2.5).
•While the technology elements of accelerated mitigation pathways at national level are generally well documented, studies of the economic and social implications of such pathways remain scarce (Section 4.2.6).
•Literature on the implication of development choices for emissions and for capacity to mitigate is limited (Section 4.3.2). In particular, more contributions from the research community working on development issues would be very useful here.
•Literature describing shifts in development pathways, and the conditions for such shifts (based on past experience or on models) remains scarce (Sections 4.3.1, 4.3.3 and 4.4.1). Studying shifts in development pathways requires new ways of thinking with interdisciplinary research and use of alternative frameworks and methods suited for understanding of change agents, determinants of change and adaptive management among other issues (Winkler 2018). Research is not only expected to produce knowledge and boost innovation, but also to help identify transformation pathways and to enlighten public debate and public decision-making on related political choices.
•Other research gaps concern the open ocean and blue carbon. There is limited knowledge about quantification of the blue carbon stocks. Research is required into what happens if the sequestration capacity of the ocean and marine ecosystems is damaged by climate change to the tipping point until the sink becomes an emitter, and on how to manage blue carbon (Section 4.4.2).
•Knowledge is limited on: (i) linking equity frameworks on mitigation with adaptation and most importantly with loss and damage, (ii) applying ethical parameters to enrich many of the existing quantitative frameworks, to assess fairness and ambition of NDCs; (iii) extending equity frameworks to quantify equitable international support, as the difference between equity-based national emissions scenarios and national domestic emissions scenarios (Sections 4.2.2.7 and 4.5).
Frequently Asked Questions (FAQs)
FAQ 4.1 | What is to be done over and above countries’ existing pledges under the Paris Agreement to keep global warming well below 2°C?
Current pledges and efforts under the PA aimed at keeping global warming below 2°C are not enough, falling short by 14 to 23 GtCO2- eq (Cross-Chapter Box 4 in this Chapter). There is a further shortfall of about 4 to 7 GtCO2-eq in 2030 if the conditions are not fulfilled for those Parties that have made their pledges with conditions for support (Section 4.2.2.3). To cover up for these shortfalls will require taking actions across all sectors that can substantially reduce GHG emissions. Examples of such actions include shifting to low- or zero-emission power generation, such as renewables; changing food systems, such as diet changes away from land-intensive animal products; electrifying transport and developing ‘green infrastructure’, such as building green roofs, or improving energy efficiency by smart urban planning, which will change the layout of many cities. Because these different actions are connected, it means all relevant companies, industries and stakeholders would need to be involved to increase the support and chance of successful implementation (Section 4.2.5). The deployment of low-emission technology depends upon economic conditions (e.g., employment generation or capacity to mobilise investment), but also on social/cultural conditions (e.g., awareness and acceptability) and institutional conditions (e.g., political support and understanding), and the provision of relevant enabling conditions (Section 4.4.1). Encouraging stronger and more ambitious climate action by non-government and sub-national stakeholders, as well as international cooperative initiatives (ICIs) could make significant contributions to emissions reduction (Section 4.2.3).
FAQ 4.2 | What is to be done in the near term to accelerate mitigation and shift development pathways?
Increasing speed of implementation, breadth of action across all sectors of the economy, and depth of emission reduction faces important obstacles, that are rooted in the underlying structure of societies (Section 4.2.7). Addressing these obstacles amounts to shifting away from existing developmental trends (i.e., shifting development pathways, Cross-Chapter Box 5). This can be done by strengthening governance and institutional capacity, aligning technology and innovation systems with low-carbon development, facilitating behaviour change and providing adequate finance within the context of multi-objective policy packages and sequences (Section 4.4.1). Shifting development pathways towards sustainability broadens the scope for, and is thus a complement to, accelerated mitigation (Section 4.3).
FAQ 4.3 | Is it possible to accelerate mitigation in the near term while there are so many other development priorities? (Education, health, employment, etc.)
It is possible to accelerate mitigation while addressing other developmental priorities by implementing measures that simultaneously address both climate and development goals. Casting mitigation in the broader context of development pathways provides additional opportunities to articulate both (Section 4.3.1.4). Policies such as progressive taxation, investment in public transport, regulatory transparency, commitment to multilateral environmental governance, fiscal incentives for private investments, international technology development and transfer initiatives, and risk disclosure and efforts to improve underlying enabling conditions (improving governance and institutional capacity, fostering behavioural change and technological innovation, and provision of finance) address multiple objectives beyond mitigation, such as job creation, macroeconomic stability, economic growth, public health and welfare, providing energy access, providing formal housing, and providing mobility. How we manage our land and agriculture, growing cities, transport needs, our industries, and the way people are trained and employed all impact on GHG emissions and the options we have to reduce them. In turn, reducing GHG emissions can also contribute to reducing poverty, preventing hunger, improving health and wellbeing, and providing clean water and clean energy. Implementing right policies and investments can help to address the challenges of how to reduce emissions without constraining development. For example, in land use, widespread planting of a single tree species or crops for bioenergy (organic matter turned into renewable energy) could affect food and water supplies. Therefore, if bioenergy is to be relied upon to offset emissions, the right policies and investments are needed (see also Chapter 17).
References
Abadie, L.M., I. Galarraga, and D. Rübbelke, 2013: An analysis of the causes of the mitigation bias in international climate finance. Mitig. Adapt. Strateg. Glob. Change, 18(7) , 943–955, doi:10.1007/s11027-012-9401-7.
Acar, S. and A.E. Yeldan, 2016: Environmental impacts of coal subsidies in Turkey: A general equilibrium analysis. Energy Policy, 90, 1–15, doi:10.1016/j.enpol.2015.12.003.
Adler, M., 2007: Corrective Justice and Liability for Global Warming. Univ. PA. Law Rev. , 155 (6) , 1859–1867.
Adler, M.D. and N. Treich, 2015: Prioritarianism and Climate Change. Environ. Resour. Econ. , 62(2) , 279–308, doi:10.1007/s10640-015-9960-7.
Adenle, A.A., H. Azadi, and J. Arbiol, 2015: Global assessment of technological innovation for climate change adaptation and mitigation in developing world. J. Environ. Manage. , 161, 261–275, doi:10.1016/j.jenvman.2015.05.040.
Adenle, A.A., D.T. Manning, and J. Arbiol, 2017: Mitigating Climate Change in Africa: Barriers to Financing Low-Carbon Development. World Dev. , 100, 123–132, doi.org/10.1016/j.worlddev.2017.07.033.
Adeoti, J., L. Chete, C. Beaton, and K. Clarke, 2016: Compensation Mechanisms for Fuel Subsidy Removal in Nigeria. The International Institute for Sustainable Development, Global Subsidies Initiative, Nigerian Institute of Social and Economic Research, Winnipeg, Canada, Geneva, Switzerland and Lagos, Nigeria, 68 pp.
Adler, M.D. and N. Treich, 2015: Prioritarianism and Climate Change. Environ. Resour. Econ. , 62(2) , 279–308, doi:10.1007/s10640-015-9960-7.
Adshead, D., S. Thacker, L.I. Fuldauer, and J.W. Hall, 2019: Delivering on the Sustainable Development Goals through long-term infrastructure planning. Glob. Environ. Change, 59, 101975, doi:10.1016/j.gloenvcha.2019.101975.
Afionis, S., M. Sakai, K. Scott, J. Barrett, and A. Gouldson, 2017: Consumption-based carbon accounting: Does it have a future?Wiley Interdiscip. Rev. Clim. Change, 8(1) , e438, doi:10.1002/WCC.438.
Agénor, P.-R.R. and O. Canuto, 2015: Middle-income growth traps. Res. Econ. , 69(4) , 641–660, 10.1016/j.rie.2015.04.003.
Aggarwal, P., 2017: 2°C target, India’s climate action plan and urban transport sector. Travel Behav. Soc. , 6, 110–116, doi:10.1016/j.tbs.2016.11.001.
Ai, Z., N. Hanasaki, V. Heck, T. Hasegawa, and S. Fujimori, 2021: Global bioenergy with carbon capture and storage potential is largely constrained by sustainable irrigation. Nat. Sustain. , 4(10) , 884–891, doi:10.1038/s41893-021-00740-4.
Aldy, J.E., W.A. Pizer, and K. Akimoto, 2017: Comparing emissions mitigation efforts across countries. Clim. Policy, 17(4) , 501–515, doi:10.1080/14693062.2015.1119098.
Allam, Z., A. Sharifi, D. Giurco, and S.A. Sharpe, 2021: On the Theoretical Conceptualisations, Knowledge Structures and Trends of Green New Deals. Sustainability, 13(22) , 12529, doi:10.3390/su132212529.
Allen, E., H. Lyons, and J.C. Stephens, 2019: Women’s leadership in renewable transformation, energy justice and energy democracy: Redistributing power. Energy Res. Soc. Sci. , 57, 101233, doi:10.1016/j.erss.2019.101233.
Allwood, G., 2020: Mainstreaming Gender and Climate Change to Achieve a Just Transition to a Climate-Neutral Europe. J. Common Mark. Stud. , 58(S1) , 173–186, doi:10.1111/jcms.13082.
Alongi, D.M., 2008: Mangrove forests: Resilience, protection from tsunamis, and responses to global climate change. Estuar. Coast. Shelf Sci. , 76(1) , 1–13, doi:10.1016/j.ecss.2007.08.024.
Alongi, D.M., 2015: The Impact of Climate Change on Mangrove Forests. Curr. Clim. Chang. Reports, 1(1) , 30–39, doi:10.1007/s40641-015-0002-x.
Altenburg, T. and D. Rodrik, 2017: Green Industrial Policy: Accelerating Structural Change Towards Wealthy Green Economies. In: Green Industrial Policy. Concept, Policies, Country Experiences[Altenburg, T. and C. Assmann, (eds.)], UN Environment; German Development Institute/Deutsches Institut für Entwicklungspolitik (DIE), Geneva, Switzerland, pp. 2–20.
Altieri, K. et al., 2015: Pathways to deep decarbonisation in South Africa. Part of DDPP 2015 final report of the Deep Decarbonization Pathways Project . Energy Research Centre, Sustainable Development Solutions Network, Institute for Sustainable Development and International Relations, Cape Town, New York, Paris, 52 pp.
Altieri, K.E. et al., 2016: Achieving development and mitigation objectives through a decarbonization development pathway in South Africa. Clim. Policy, 16(sup1) , S78–S91, doi:10.1080/14693062.2016.1150250.
Alton, T. et al., 2014: Introducing carbon taxes in South Africa. Appl. Energy, 116, 344–354, doi:10.1016/J.APENERGY.2013.11.034.
Álvarez-Espinosa, A.C. et al., 2018: Evaluación económica de los compromisos de Colombia en el marco de COP21. Rev. Desarro. y Soc. , (79), 15–54, doi:10.13043/dys.79.1.
Ameli, N., P. Drummond, A. Bisaro, M. Grubb, and H. Chenet, 2020: Climate finance and disclosure for institutional investors: Why transparency is not enough. Clim. Change, 160(4) , 565–589, doi:10.1007/s10584-019-02542-2.
Amjath-Babu, T.S., P.K. Aggarwal, and S. Vermeulen, 2019: Climate action for food security in South Asia? Analyzing the role of agriculture in nationally determined contributions to the Paris agreement. Clim. Policy, 19(3) , 283–298, doi:10.1080/14693062.2018.1501329.
Andersen, I. et al., 2021: Defining ‘science-based targets’. Natl. Sci. Rev. , 8(7) , doi:10.1093/nsr/nwaa186.
Andersson, M., P. Bolton, and F. Samama, 2016: Hedging Climate Risk. Financ. Anal. J. , 72(3) , 13–32, doi:10.2469/faj.v72.n3.4.
Andrijevic, M., J. Crespo Cuaresma, T. Lissner, A. Thomas, and C.F. Schleussner, 2020: Overcoming gender inequality for climate resilient development. Nat. Commun. , 11(1) , 1–8, doi:10.1038/s41467-020-19856-w.
Ansar, A., B. Caldecott, and J. Tilbury, 2013: Stranded assets and the fossil fuel divestment campaign. Smith School of Enterprise and the Environment, University of Oxford, Oxford, United Kingdom, 81 pp.
Antimiani, A., V. Costantini, O. Kuik, and E. Paglialunga, 2016: Mitigation of adverse effects on competitiveness and leakage of unilateral EU climate policy: An assessment of policy instruments. Ecol. Econ. , 128, 246–259, doi:10.1016/j.ecolecon.2016.05.003.
Antwi-Agyei, P., A.J. Dougill, and L.C. Stringer, 2015: Impacts of land tenure arrangements on the adaptive capacity of marginalized groups: The case of Ghana’s Ejura Sekyedumase and Bongo districts. Land Use Policy, 49, 203–212, doi:10.1016/j.landusepol.2015.08.007.
Antwi-Agyei, P., A.J. Dougill, T.P. Agyekum, and L.C. Stringer, 2018: Alignment between nationally determined contributions and the sustainable development goals for West Africa. Clim. Policy, 18(10) , 1296–1312, doi:10.1080/14693062.2018.1431199.
APERC, 2019: APEC Energy Demand and Supply. Outlook, vol. 1, 7th ed., Asia-Pacific Economic Cooperation Secretariat (APERC), Singapore, 198 pp.
Arango-Aramburo, S. et al., 2019: Climate impacts on hydropower in Colombia: A multi-model assessment of power sector adaptation pathways. Energy Policy, 128 (July 2018), 179–188, doi:10.1016/j.enpol.2018.12.057.
Arndt, C., R. Davies, K. Makrelov, and J. Thurlow, 2013: Measuring the Carbon Intensity of the South African Economy. South African J. Econ. , 81(3) , 393–415, doi:10.1111/j.1813-6982.2012.01324.x.
Arneth, A. et al., 2021: Restoring Degraded Lands. Annu. Rev. Environ. Resour. , 46(1) , doi:10.1146/annurev-environ-012320-054809.
Asakawa, K., K. Kimoto, S. Takeda, and T.H. Arimura, 2021: Double Dividend of the Carbon Tax in Japan: Can We Increase Public Support for Carbon Pricing? In: Economics, Law, and Institutions in Asia Pacific, Springer Japan, pp. 235–255.
Asensio, O.I., and M.A. Delmas, 2016: The dynamics of behavior change: Evidence from energy conservation. J. Econ. Behav. Organ. , 126, 196–212, doi:10.1016/j.jebo.2016.03.012.
Asher, M.G. and A.S. Bali, 2017: Creating fiscal space to pay for pension expenditure in Asia. Econ. Polit. Stud. , 5(4) , 501–514, doi:10.1080/20954816.2017.1384625.
Ashina, S., J. Fujino, T. Masui, T. Ehara, and G. Hibino, 2012: A roadmap towards a low-carbon society in Japan using backcasting methodology: Feasible pathways for achieving an 80% reduction in CO2 emissions by 2050. Energy Policy, 41, 584–598, doi:10.1016/j.enpol.2011.11.020.
Auffhammer, M. and C.D. Wolfram, 2014: Powering up China: Income distributions and residential electricity consumption. Am. Econ. Rev. , 104(5) , 575–580, doi:10.1257/aer.104.5.575.
Ayers, J.M. and S. Huq, 2009: Supporting adaptation to climate change: What role for official development assistance?Dev. Policy Rev. , 27(6) , 675–692, doi:10.1111/j.1467-7679.2009.00465.x.
Bachus, K., L. Van Ootegem, and E. Verhofstadt, 2019: ‘No taxation without hypothecation’: Towards an improved understanding of the acceptability of an environmental tax reform J. Environ. Policy Plan. , 21 (4) , 321–332, doi:10.1080/1523908X.2019.1623654.
Baek, J. and G. Gweisah, 2013: Does income inequality harm the environment? Empirical evidence from the United States. Energy Policy, 62, 1434–1437, doi:10.1016/j.enpol.2013.07.097.
Bahn, O. and K. Vaillancourt, 2020: Implications of EMF 34 scenarios on renewable deployment and carbon abatement in Canada: Insights from a regionalized energy model. Energy Policy, 142 (April), doi:10.1016/j.enpol.2020.111518.
Bain, P.G., M.J. Hornsey, R. Bongiorno, and C. Jeffries, 2012: Promoting pro-environmental action in climate change deniers. Nat. Clim. Change, 2(8) , 600–603, doi:10.1038/nclimate1532.
Bankwatch, 2019: The transformation action plan for the Slovakia’s Upper Nitra coal region. Bankwatch Network. https://bankwatch.org/wp- content/uploads/2019/09/Transformation-Action-Plan-Upper-Nitra.pdf (Accessed June 15, 2020).
Banuri, T. and J.P. Weyant, 2001: Setting the Stage: Climate change and sustainable development. In: Climate Change 2001: Mitigation: Contribution of WGIII to the Third Assessment Report of the IPCC [Banuri, T. and J.P. Weyant, (eds.)]. Cambridge University Press, Cambridge, UK, pp. 74–114.
Bappenas, 2019: Low Carbon Development Report: A paradigm shift towards a green economy in Indonesia. Minister (2001) of National Development Planning/ Head of National Development Planning Agency (Bappenas), Indonesia. Jakarta, https://www.greengrowthknowledge.org/sites/default/files/downloads/policy-database//indonesia_lowcarbon_development_full%20report.pdf .
Bataille, C., H. Waisman, M. Colombier, L. Segafredo, and J. Williams, 2016a: The Deep Decarbonization Pathways Project (DDPP): Insights and emerging issues. Clim. Policy, 16(sup1) , S1–S6, doi:10.1080/14693062.2016.1179620.
Bataille, C. et al., 2016b: The need for national deep decarbonization pathways for effective climate policy. Clim. Policy, 16(sup1) , S7–S26, doi:10.1080/14693062.2016.1173005.
Bataille, C. et al., 2018: A review of technology and policy deep decarbonization pathway options for making energy-intensive industry production consistent with the Paris Agreement. J. Clean. Prod. , 187, 960–973, doi.org/10.1016/j.jclepro.2018.03.107.
Bataille, C. et al., 2020: Net-zero deep decarbonization pathways in Latin America: Challenges and opportunities. Energy Strateg. Rev. , 30, doi:10.1016/j.esr.2020.100510.
Bataille, C. G.F., 2020: Physical and policy pathways to net‐zero emissions industry. WIREs Clim. Change, 11 (2) , doi:10.1002/wcc.633.
Baum, A., A. Hodge, and A. Mineshima, 2017: Can They Do It All? Fiscal Space in Low-Income Countries. International Monetary Fund, Washington, DC, USA, 41 pp.
Baumstark, L. et al., 2021: REMIND2.1: Transformation and innovation dynamics of the energy-economic system within climate and sustainability limits. Geosci. Model Dev. , 14(10) , 6571–6603, doi:10.5194/gmd-14-6571-2021.
Beck, B., T. Surridge, and S. Hietkamp, 2013: The South African centre for carbon capture and storage delivering CCS in the developing world. Energy Procedia, 37, 6502–6507, doi:10.1016/j.egypro.2013.06.580.
Beegle, K., A. Coudouel, and E. Monsalve, eds., 2018: Realizing the Full Potential of Social Safety Nets in Africa. The World Bank, San Francisco, USA 385 pp, https://openknowledge.worldbank.org/bitstream/handle/10986/29789/9781464811647.pdf?sequence=2&isAllowed=y (Accessed November 1, 2021).
Beiser-McGrath, L.F. and T. Bernauer, 2019: Could revenue recycling make effective carbon taxation politically feasible?Sci. Adv. , 5(9) , doi:10.1126/sciadv.aax3323.
Benner, C. and A. Karner, 2016: Low-wage jobs-housing fit: identifying locations of affordable housing shortages. Urban Geogr. , 37(6) , 883–903, doi:10.1080/02723638.2015.1112565.
Bento, A.M., 2013: Equity Impacts of Environmental Policy. Annu. Rev. Resour. Econ. , 5(1) , 181–196, doi:10.1146/annurev-resource-091912-151925.
Bento, A.M., M.L. Cropper, A.M. Mobarak, and K. Vinha, 2005: The effects of Urban spatial structure on travel demand in the United States. Rev. Econ. Stat. , 87(3) , 466–478, doi:10.1162/0034653054638292.
Benveniste, H., O. Boucher, C. Guivarch, H. Le Treut, and P. Criqui, 2018: Impacts of nationally determined contributions on 2030 global greenhouse gas emissions: Uncertainty analysis and distribution of emissions. Environ. Res. Lett. , 13(1) , doi:10.1088/1748-9326/aaa0b9.
Bergquist, P., M. Mildenberger, and L.C. Stokes, 2020: Combining climate, economic, and social policy builds public support for climate action in the US. Environ. Res. Lett. , 15(5) , doi:10.1088/1748-9326/ab81c1.
Berry, A., 2019: The distributional effects of a carbon tax and its impact on fuel poverty: A microsimulation study in the French context. Energy Policy, 124, 81–94, doi:10.1016/J.ENPOL.2018.09.021.
Berthe, A. and L. Elie, 2015: Mechanisms explaining the impact of economic inequality on environmental deterioration. Ecol. Econ. , 116, 191–200, doi:10.1016/j.ecolecon.2015.04.026.
Bertram, C. et al., 2015: Carbon lock-in through capital stock inertia associated with weak near-term climate policies. Technol. Forecast. Soc. Change, 90 (PA) , 62–72, doi:10.1016/j.techfore.2013.10.001.
Bertram, C. et al., 2018: Targeted policies can compensate most of the increased sustainability risks in 1.5 °C mitigation scenarios. Environ. Res. Lett. , 13(6) , 064038, doi:10.1088/1748-9326/aac3ec.
Biagini, B., L. Kuhl, K.S. Gallagher, and C. Ortiz, 2014: Technology transfer for adaptation. Nat. Clim. Change, 4(9) , 828–834, doi:10.1038/nclimate2305.
Biardeau, L.T., L.W. Davis, P. Gertler, and C. Wolfram, 2020: Heat exposure and global air conditioning. Nat. Sustain. , 3(1) , 25–28, doi:10.1038/s41893-019-0441-9.
Bindoff, N.L., W.W.L. Cheung, J.G. Kairo, J. Arístegui, V.A. Guinder, R. Hallberg, N. Hilmi, N. Jiao, M.S. Karim, L. Levin, S. O’Donoghue, S.R. Purca Cuicapusa, B. Rinkevich, T. Suga, A. Tagliabue, and P. Williamson, 2019: Changing Ocean, Marine Ecosystems, and Dependent Communities. In: IPCC Special Report on the Ocean and Cryosphere in a Changing Climate[H.-O. Pörtner, D.C. Roberts, V. Masson-Delmotte, P. Zhai, M. Tignor, E. Poloczanska, K. Mintenbeck, A. Alegría, M. Nicolai, A. Okem, J. Petzold, B. Rama, N.M. Weyer (eds.)]. Cambridge University Press, Cambridge, UK, and New York, NY, USA, pp. 447–588.
Birmingham Energy Institute, 2018: A Cool World Defining the Energy Conundrum of Cooling for All. University of Bringham. https://www.birmingham.ac.uk/Documents/college-eps/energy/Publications/2018-clean-cold-report.pdf .
Blazquez, J., L.C. Hunt, and B. Manzano, 2017: Oil subsidies and renewable energy in Saudi Arabia: A general equilibrium approach. Energy J. , 38(1) , 29–45, doi:10.5547/01956574.38.SI1.jbla.
BloombergNEF, 2017: Global Storage Market to Double Six Times by 2030, Bloomberg New Energy Finance, London, UK, https://about.bnef.com/blog/global-storage-market-double-six-times-2030/ (Accessed November 1, 2021).
Bodnar, P. et al., 2018: Underwriting 1.5°C: competitive approaches to financing accelerated climate change mitigation. Clim. Policy, 18(3) , 368–382, doi:10.1080/14693062.2017.1389687.
Böhringer, C., S. Peterson, T.F. Rutherford, J. Schneider, and M. Winkler, 2021: Climate policies after Paris: Pledge, Trade and Recycle: Insights from the 36th Energy Modeling Forum Study (EMF36). Energy Econ. , 103, doi:10.1016/j.eneco.2021.105471.
Bolderdijk, J.W., L. Steg, E.S. Geller, P.K. Lehman, and T. Postmes, 2013: Comparing the effectiveness of monetary versus moral motives in environmental campaigning. Nat. Clim. Change, 3(4) , 413–416, doi:10.1038/nclimate1767.
Boomsma, C. and L. Steg, 2014: The effect of information and values on acceptability of reduced street lighting. J. Environ. Psychol. , 39, 22–31, doi:10.1016/j.jenvp.2013.11.004.
Borba, B.S.M.C. et al., 2012: Energy-related climate change mitigation in Brazil: Potential, abatement costs and associated policies. Energy Policy, 49, 430–441, doi:10.1016/j.enpol.2012.06.040.
Borenstein, S. and L.W. Davis, 2016: The Distributional Effects of US Clean Energy Tax Credits. Tax Policy Econ. , 30(1) , 191–234, doi:10.1086/685597.
Boulle, M. et al., 2015: MAPS approach: learning and doing in the Global South. The MAPS Programme. Mitigation Action Plans and Scenarios (MAPS), Cape Town, https://www.researchgate.net/publication/308899738_The_MAPS_approach_learning_and_doing_in_the_global_south.
Bowen, A., K. Kuralbayeva, and E.L. Tipoe, 2018: Characterising green employment: The impacts of ‘greening’ on workforce composition. Energy Econ. , 72, 263–275, doi:10.1016/j.eneco.2018.03.015.
Boysen, L.R. et al., 2017: The limits to global-warming mitigation by terrestrial carbon removal. Earth’s Futur. , 5(5) , 463–474, doi:10.1002/2016EF000469.
Broekhoff, D., P. Erickson, and C.M. Lee, 2015: What cities do best: Piecing together an efficient global climate governance. Stockholm Environment Institute, Seattle, USA, https://www.sei.org/publications/what-cities-do-best-piecing-together-an-efficient-global-climate-governance/ (Accessed November 1, 2021).
Brown, T., D. Schlachtberger, A. Kies, S. Schramm, and M. Greiner, 2018: Synergies of sector coupling and transmission reinforcement in a cost-optimised, highly renewable European energy system. Energy, 160, 720–739, doi:10.1016/J.ENERGY.2018.06.222.
Bruegge, C., T. Deryugina, and E. Myers, 2019: The Distributional Effects of Building Energy Codes. J. Assoc. Environ. Resour. Econ. , 6(S1) , S95–S127, doi:10.1086/701189.
Brunner, S. and K. Enting, 2014: Climate finance: A transaction cost perspective on the structure of state-to-state transfers. Glob. Environ. Change, 27(1) , 138–143, doi:10.1016/j.gloenvcha.2014.05.005.
Buchner, B. et al., 2019: Global Landscape of Climate Finance 2019 – CPI.https://climatepolicyinitiative.org/publication/global-landscape-of-climate-finance-2019/ (Accessed December 18, 2019).
Büchs, M. et al., 2020: Wellbeing economies post-covid – Wellbeing Economy Alliance, Wellbeing Economy Alliance, BARNSTAPLE, United Kingdom, 10 pp., https://wellbeingeconomy.org/ten-principles-for-building-back-better- to-create-wellbeing-economies-post-covid.
Bulavskaya, T. and F. Reynès, 2018: Job creation and economic impact of renewable energy in the Netherlands. Renew. Energy, 119, 528–538, doi:10.1016/j.renene.2017.09.039.
Burch, S., A. Shaw, A. Dale, and J. Robinson, 2014: Triggering transformative change: A development path approach to climate response in communities. Clim. Policy, 14(4) , 467–487.
Bureau, D., F. Henriet, and K. Schubert, 2019: Pour le climat: Une taxe juste, pas juste une taxe. Notes du Cons. d’analyse économique, 50(2) , 1, doi:10.3917/ncae.050.0001.
Busch, T., H. Klee, and V.H. Hoffmann, 2008: Curbing greenhouse gas emissions on a sectoral basis: the Cement Sustainability Initiative. In: Corporate Responses to Climate Change, Routledge [Sullivan, R. (ed.)]. Routledge, Oxon, United Kingdom and New York, NY, USA, pp. 204–219.
Bustamante, M.M.C. et al., 2018: Engagement of scientific community and transparency in C accounting: The Brazilian case for anthropogenic greenhouse gas emissions from land use, land-use change and forestry. Environ. Res. Lett. , 13(5) , 055005, doi:10.1088/1748-9326/aabb37.
Butnar, I. et al., 2020: A deep dive into the modelling assumptions for biomass with carbon capture and storage (BECCS): a transparency exercise. Environ. Res. Lett. , 15(8) , 084008, doi:10.1088/1748-9326/ab5c3e.
Caetano, T., H. Winker, and J. Depledge, 2020: Towards zero carbon and zero poverty: Integrating national climate change mitigation and sustainable development goals. Clim. Policy, 20(7) , 773–778, doi:10.1080/14693062.2020.1791404.
Cain, M. et al., 2019: Improved calculation of warming-equivalent emissions for short-lived climate pollutants. npj Clim. Atmos. Sci. , 2 (1) , 29, doi:10.1038/s41612-019-0086-4.
Calfucoy, P., M. Torres Gunfaus, and H. Blanco, 2019: Building capacities for long-term planning: The Mitigation Action Plans and Scenarios (MAPS) program, Washington, DC, https://wriorg.s3.amazonaws.com/s3fs-public/building-capacities-long-term-planning-mitigation-action-plan-and-scenarios-maps-program-updated.pdf (Accessed November 1, 2021).
Calvin, K. et al., 2021: Bioenergy for climate change mitigation: Scale and sustainability. GCB Bioenergy, 13(9) , 1346–1371, doi:10.1111/gcbb.12863.
Campagnolo, L. and M. Davide, 2019: Can the Paris deal boost SDGs achievement? An assessment of climate mitigation co-benefits or side-effects on poverty and inequality. World Dev. , 122, 96–109, doi:10.1016/j.worlddev.2019.05.015.
Campbell, B.M., P. Thornton, R. Zougmoré, P. van Asten, and L. Lipper, 2014: ScienceDirect Sustainable intensification: What is its role in climate smart agriculture?Curr. Opin. Environ. Sustain. , 8, 39–43, doi.org/10.1016/j.cosust.2014.07.002.
Caney, S., 2016: The Struggle for Climate Justice in a Non-Ideal World. Midwest Stud. Philos. , 40(1) , 9–26, doi:10.1111/misp.12044.
Canzler, W. and D. Wittowsky, 2016: The impact of Germany’s Energiewende on the transport sector – Unsolved problems and conflicts. Util. Policy, 41, 246–251, doi:10.1016/j.jup.2016.02.011.
Cao, S. et al., 2010: Damage caused to the environment by reforestation policies in arid and semi-arid areas of China. Ambio, 39(4) , 279–283, doi:10.1007/s13280-010-0038-z.
Capros, P. et al., 2019: Energy-system modelling of the EU strategy towards climate-neutrality. Energy Policy, 134, doi:10.1016/J.ENPOL.2019.110960.
Carley, S. and D.M. Konisky, 2020: The justice and equity implications of the clean energy transition. Nat. Energy, 5, 569–577, doi:10.1038/s41560-020-0641-6.
Carrara, S., 2020: Reactor ageing and phase-out policies: Global and regional prospects for nuclear power generation. Energy Policy, 147, doi:10.1016/j.enpol.2020.111834.
Cartwright, A., 2015: Better Growth, Better Cities: Rethinking and Redirecting Urbanisation in Africa. Working Pa. New Climate Economy, Washington, DC, USA, 44 pp, https://newclimateeconomy.report/workingpapers/wp-content/uploads/sites/5/2016/04/NCE-APP-final.pdf (Accessed November 1, 2021).
CCFLA, 2017: Localizing Climate Finance, Mapping Gaps and Opportunities, Designing Solutions, New York, USA, https://ccacoalition.org/en/resources/ localizing-climate-finance-mapping-gaps-and-opportunities-designing-solutions-0.
Central Compilation & Translation Press, 2016: The 13th Five-Year Plan for Economic and Social Development of the People’s Republic of China. Cent. Compil. Transl. Press, 97–99.
Chadwick, A.E., 2017: Climate Change Communication. Oxford Res. Encycl. Commun. , doi:10.1093/acrefore/9780190228613.013.22.
Chai, Q.-M. and H.-Q. Xu, 2014: Modeling an emissions peak in China around 2030: Synergies or trade-offs between economy, energy and climate security. Adv. Clim. Chang. Res. , 5(4) , 169–180, doi.org/10.1016/j.accre.2015.06.001.
Chan, S., R. Falkner, M. Goldberg, and H. van Asselt, 2018: Effective and geographically balanced? An output-based assessment of non-state climate actions. Clim. Policy, 18(1) , 24–35, doi:10.1080/14693062.2016.1248343.
Charlier, D., B. Legendre, and A. Risch, 2019: Fuel poverty in residential housing: Providing financial support versus combatting substandard housing. Appl. Econ. , 51(49) , 5369–5387, doi:10.1080/00036846.2019.1613501.
Chateau, J., R. Bibas, and E. Lanzi, 2018: Impacts of Green Growth Policies on Labour Markets and Wage Income Distribution: A General Equilibrium Application to Climate and Energy Policies-Environment, OECD Environment Working Papers, No. 137, OECD Publishing, Paris, France, doi: 10.1787/5jz2qck2b2vd-en.
Chen, J., P. Wang, L. Cui, S. Huang, and M. Song, 2018a: Decomposition and decoupling analysis of CO2 emissions in OECD. Appl. Energy, 231, 937–950, doi:10.1016/j.apenergy.2018.09.179.
Chen, J., X. Yin, and L. Mei, 2018b: Holistic Innovation: An Emerging Innovation Paradigm. Int. J. Innov. Stud. , 2(1) , 1–13, doi:10.1016/J.IJIS.2018.02.001.
Chen, Y.-H.H., G.R. Timilsina, and F. Landis, 2013: Economic implications of reducing carbon emissions from energy use and industrial processes in Brazil. J. Environ. Manage. , 130, 436–446, doi:10.1016/j.jenvman.2013.08.049.
Chen, Y., 2018: Comparing North-South technology transfer and South-South technology transfer: The technology transfer impact of Ethiopian Wind Farms. Energy Policy, 116, 1–9, doi:10.1016/j.enpol.2017.12.051.
Chen, Y. and M.A.C. Hafstead, 2019: Using a Carbon Tax to Meet US International Climate Pledges. Clim. Chang. Econ. , 10(1) , doi:10.1142/S2010007819500027.
Chenet, H., A. Hilke, and W. Duan, 2019: Finance Sector Alignment with International Climate Goals Reviewing Optionsand Obstacles.
Cheshmehzangi, A., 2016: China’s New-type Urbanisation Plan (NUP) and the Foreseeing Challenges for Decarbonization of Cities: A Review. Energy Procedia, 104, 146–152, doi:10.1016/j.egypro.2016.12.026.
Chester, M.V., 2019: Sustainability and infrastructure challenges. Nat. Sustain. , 2(4) , 265–266, doi:10.1038/s41893-019-0272-8.
Child, M., C. Kemfert, D. Bogdanov, and C. Breyer, 2019: Flexible electricity generation, grid exchange and storage for the transition to a 100% renewable energy system in Europe. Renew. Energy, 139, 80–101, doi:10.1016/j.renene.2019.02.077.
Chilvers, J. et al., 2017: Realising transition pathways for a more electric, low-carbon energy system in the United Kingdom: Challenges, insights and opportunities. Proc. Inst. Mech. Eng. Part A J. Power Energy, 231(6) , 440–477, doi:10.1177/0957650917695448.
Chimhowu, A.O., D. Hulme, and L.T. Munro, 2019: The ‘New’ national development planning and global development goals: Processes and partnerships. World Dev. , 120, 76–89, doi:10.1016/j.worlddev.2019.03.013.
China National Renewable Energy Centre, 2019: China Renewable Energy Outlook 2019. Energy Research Institute of Academy of Macroeconomic Research/NDRC China National Renewable Energy Centre, Beijing, China
Chiodi, A. et al., 2013: Modelling the impacts of challenging 2050 European climate mitigation targets on Ireland’s energy system. Energy Policy, 53, 169–189, doi:10.1016/j.enpol.2012.10.045.
Chunark, P. and B. Limmeechokchai, 2018: Thailand Energy System Transition to Keep Warming Below 1.5 Degrees. Carbon Manag. , 9(5) , 515–531, doi:10.1080/17583004.2018.1536169.
Chunark, P., B. Limmeechokchai, S. Fujimori, and T. Masui, 2017: Renewable energy achievements in CO2 mitigation in Thailand’s NDCs. Renew. Energy, 114, 1294–1305, doi:10.1016/j.renene.2017.08.017.
Clack, C.T.M. et al., 2017: Evaluation of a proposal for reliable low-cost grid power with 100% wind, water, and solar. Proc. Natl. Acad. Sci. , 114(26) , 6722–6727, doi:10.1073/PNAS.1610381114.
Clark, R., J. Reed, and T. Sunderland, 2018: Bridging funding gaps for climate and sustainable development: Pitfalls, progress and potential of private finance. Land Use Policy, 71, 335–346, doi:10.1016/j.landusepol.2017.12.013.
Clarke, L. et al., 2016: Long-term abatement potential and current policy trajectories in Latin American countries. Energy Econ. , 56, 513–525, doi:10.1016/j.eneco.2016.01.011.
Clarke L., K. Jiang, K. Akimoto, M. Babiker, G. Blanford, K. Fisher-Vanden, J.-C. Hourcade, V. Krey, E. Kriegler, A. Löschel, D. McCollum, S. Paltsev, S. Rose, P.R. Shukla, M. Tavoni, B. van der Zwaan, and D. P. van Vuuren, 2014: Assessing Transformation Pathways. In: Climate Change 2014: Mitigation of Climate Change. Contribution of Working Group III to the Fifth Assessment Report of the Intergovernmental Panel on Climate Change[Edenhofer, O., R. Pichs-Madruga, Y. Sokona, E. Farahani, S. Kadner, K. Seyboth, A. Adler, I. Baum, S. Brunner, P. Eickemeier, B. Kriemann, J. Savolainen, S. Schlömer, C. von Stechow, T. Zwickel and J.C. Minx (eds.)]. Cambridge University Press, Cambridge, United Kingdom and New York, NY, USA, pp. 413–510.
Clayton, S. et al., 2015: Psychological research and global climate change. Nat. Clim. Change, 5(7) , 640–646, doi:10.1038/nclimate2622.
Climate Action Tracker, 2019: Climate Action Tracker: Country Assessments, NewClimate – Institute for Climate Policy and Global Sustainability gGmbH, Cologne, Germany and Climate Analytics gGmbH, Berlin, Germany, https://climateactiontracker.org/documents/698/CAT_2019-12-10_ BriefingCOP25_WarmingProjectionsGlobalUpdate_Dec2019.pdf (updated November 2018 – June 2019).
Climate Action Tracker, 2020: Pandemic recovery: Positive intentions vs policy. Climate Action Tracker, Climate Analytics, NewClimate Institute, 25 pp., NewClimate – Institute for Climate Policy and Global Sustainability gGmbH, Cologne, Germany and Climate Analytics gGmbH, Berlin, Germany, https://climateactiontracker.org/documents/790/CAT_2020-09-23_ Briefing_GlobalUpdat e_Sept2020.pdf (Accessed November 1, 2021).
Climate Action Tracker, 2021: Warming Projections Global Update, NewClimate – Institute for Climate Policy and Global Sustainability gGmbH, Cologne, Germany and Climate Analytics gGmbH, Berlin, Germany, https://climateactiontracker.org/documents/853/CAT_2021-05-04_Briefing_Global-Update_Climate-Summit-Momentum.pdf (Accessed November 1, 2021).
Colander, D.C. and R. Kupers, (eds.), 2016: Complexity and the art of public policy: Solving society’s problems from the bottom up. Princeton University Press, Princeton, NJ, USA, 320 pp.
Collier, P., 2007: The Bottom Billion: Why the Poorest Countries are Failing and What Can Be Done About It . Oxford University Press, Oxford, UK, 224 pp.
Combet, E. and J.C. Hourcade, 2014: Taxe carbone, retraites et déficits publics: Le coût caché du cloisonnement des expertises. Rev. Econ. Polit. , 124(3) , 291, doi:10.3917/redp.243.0291.
Combet, E. and J.C. Hourcade, 2017: Fiscalité carbone et finance climat, Un contrat social pour notre temps. Les Petits Matins, Paris, France, 150 pp.
Commission on Growth Structural Change and Employment, 2019: Commission on Growth, Structural Change and Employment – Final Report . Berlin, Germany, 128 pp., https://www.bmwi.de/Redaktion/EN/Publikationen/commission-on-growth-structural-change-and-employment.pdf?__blob=publication File&v=3.
COMMIT, 2019: Deliverable 2.2: Long-term, Low-emission Pathways in Australia, Brazil, Canada, China, EU, India, Indonesia, Japan, Republic of Korea, Russia, and United States. The Hague, the Netherlands,https://www.researchgate.net/profile/Heleen-Van-Soest/publication/ 329521902_Long-term_Low-emission_Pathways_in_Australia_Brazil_ Canada_China_EU_India_Indonesia_Japan_Republic_of_Korea_ Russian_Federation_and_the_United_States/links/5c0d387e299 bf139c74d4792/Long-term-Low-emission-Pathways-in-Australia-Brazil-Canada-China-EU-India-Indonesia-Japan-Republic-of-Korea-Russian-Federation-and-the-United-States.pdf?origin=publication_detail, 77 pp (Accessed November 1, 2021).
Committee on Climate Change, 2019: Net Zero: The UK’s contribution to stopping global warming, Committee on Climate Change, London, United Kingdom, 275 pp., www.theccc.org.uk/publications (Accessed December 18, 2019).
Conley, T.G. and C.R. Udry, 2010: Learning about a new technology: Pineapple in Ghana. Am. Econ. Rev. , 100 (1) , 35–69, doi:10.1257/aer.100.1.35.
Cook, G. and J.P. Ponssard, 2011: A proposal for the renewal of sectoral approaches building on the cement sustainability initiative. Clim. Policy, 11(5) , 1246–1256, doi:10.1080/14693062.2011.602552.
Cosbey, A., S. Droege, C. Fischer, and C. Munnings, 2019: Developing Guidance for Implementing Border Carbon Adjustments: Lessons, Cautions, and Research Needs from the Literature. Rev. Environ. Econ. Policy, 13(1) , 3–22, doi.org/10.1093/reep/rey020.
CPC-CC, 2015: Opinions of the CPC Central Committee and the State Council on further promoting the development of Ecological Civilization, Communist Party of China Central Committee, Beijing, China.
CPLC, 2017: Report of the High-Level Commission on Carbon Prices, 2–3, Carbon Pricing Leadership Coalition, Washington D.C., USA 10 pp., https://www.connect4climate.org/sites/default/files/files/publications/CarbonPricingReortFinal.pdf (Accessed November 1, 2021).
Crippa, M. et al., 2021: EDGAR v6.0 Greenhouse Gas Emissions. European Commission, Joint Research Center (JRC), Brussels, Belgium,http://data.europa.eu/89h/97a67d67-c62e-4826-b873-9d972c4f670b (Accessed November 1, 2021).
Criqui, P., M. Jaccard, and T. Sterner, 2019: Carbon taxation: A tale of three countries. Sustainability, 11(22) , 6280, doi:10.3390/su11226280.
Cronin, J.A., D. Fullerton, and S. Sexton, 2019: Vertical and Horizontal Redistributions from a Carbon Tax and Rebate. J. Assoc. Environ. Resour. Econ. , 6(S1) , S169–S208, doi:10.1086/701191.
Crooks, S. et al., 2018: Coastal wetland management as a contribution to the US National Greenhouse Gas Inventory. Nat. Clim. Change, 8(12) , 1109–1112, doi:10.1038/s41558-018-0345-0.
Cruz-Martinez, G., 2018: Revenue-Generating Potential of Taxation for Older-Age Social Pensions. Ageing Int. , 43(4) , 415–437, doi:10.1007/s12126-017-9298-2.
CSO Equity Review, 2015: Fair Shares: A Civil Society Equity Review of INDCs. CSO Equity Review Coalition, Manila, London, Cape Town, Washington, et al., https://static1.squarespace.com/static/620ef5326bbf2d7627553dbf/t/622827f61f2e1746062ebec6/1646798856616/CSO.Equity.Review--2015--Fair.Shares.A.Civil.Society.Equity.Review.of.INDCs.pdf (Accessed November 1, 2021).
CSO Equity Review, 2017: Equity and the Ambition Ratchet Towards a Meaningful 2018 Facilitative Dialogue Report . CSO Equity Review Coalition, Manila, London, Cape Town, Washington, et al., https://static1.squarespace.com/static/620ef5326bbf2d7627553dbf/t/622827f61f2e1746062ebec6/1646798856616/CSO.Equity.Review--2015--Fair.Shares.A.Civil.Society.Equity.Review.of.INDCs.pdf (Accessed November 1, 2021).
CSO Equity Review, 2018: After Paris: Inequality, Fair Shares, and the Climate Emergency. CSO Equity Review Coalition, Manila, London, Cape Town, Washington, et al., https://static1.squarespace.com/static/620ef5326bbf2d7627553dbf/t/622827f61f2e1746062ebec6/1646798856616/CSO.Equity.Review--2015--Fair.Shares.A.Civil.Society.Equity.Review.of.INDCs.pdf (Accessed November 1, 2021).
Cui, L., R. Li, M. Song, and L. Zhu, 2019: Can China achieve its 2030 energy development targets by fulfilling carbon intensity reduction commitments?Energy Econ. , 83, 61–73, doi:10.1016/J.ENECO.2019.06.016.
Cui, Z. et al., 2018: Pursuing sustainable productivity with millions of smallholder farmers. Nature, 555(7696) , 363–366, doi:10.1038/nature25785.
Cunliffe, G.E., C. Holz, K.L. Mbeva, P. Pauw, and H. Winkler, 2019: Comparative analysis of the NDCs of Canada, the European Union, Kenya and South Africa from an equity perspective. Energy Research Centre, University of Cape Town, Cape Town, South Africa, 85 pp.
Da Silveira Bezerra, P.B. et al., 2017: The power of light: Socio-economic and environmental implications of a rural electrification program in Brazil. Environ. Res. Lett. , 12(9) , doi:10.1088/1748-9326/aa7bdd.
Dafnomilis, I. et al., 2020: Exploring the impact of COVID-19 pandemic on global emission projections: Assessment of green vs ‘not green’ recoveryPBL Netherlandz Environmental Assessment Agency, The Hague, Netherlands and NewClimate – Institute for Climate Policy and Global Sustainability gGmbH, Cologne, Germany, 44 pp., https://newclimate.org/wp-content/uploads/2020/09/COVID-19_Global_Emissions_Projections_Sept2020.pdf (Accessed November 1, 2021).
Dafnomilis, I. et al., 2021: Targeted green recovery measures in a post-COVID-19 world enable the energy transition, Working paper, 20 pp,. doi:10.21203/rs.3.rs-667715/v1.
Dagnet, Y. et al., 2017: Designing the enhanced transparency framework part 2: Review under the Paris Agreement . World Resources Institute, Washington, DC, USA., https://www.wri.org/research/designing-enhanced-transparency-framework-part-2-review-under-paris-agreement .
Dai, H.-C., H.-B. Zhang, and W.-T. Wang, 2017: The impacts of US withdrawal from the Paris Agreement on the carbon emission space and mitigation cost of China, EU, and Japan under the constraints of the global carbon emission space. Adv. Clim. Chang. Res. , 8(4) , 226–234, doi:10.1016/j.accre.2017.09.003.
Dai, H., X. Xie, Y. Xie, J. Liu, and T. Masui, 2016: Green growth: The economic impacts of large-scale renewable energy development in China. Appl. Energy, 162, 435–449, doi:10.1016/j.apenergy.2015.10.049.
Daioglou, V. et al., 2020: Implications of climate change mitigation strategies on international bioenergy trade. Clim. Change, 163(3) , 1639–1658, doi:10.1007/s10584-020-02877-1.
Davis, L.W. and C.R. Knittel, 2019: Are Fuel Economy Standards Regressive?J. Assoc. Environ. Resour. Econ. , 6(S1) , S37–S63, doi:10.1086/701187.
de Coninck, H., A. Revi, M. Babiker, P. Bertoldi, M. Buckeridge, A. Cartwright, W. Dong, J. Ford, S. Fuss, J.-C. Hourcade, D. Ley, R. Mechler, P. Newman, A. Revokatova, S. Schultz, L. Steg, and T. Sugiyama, 2018: Strengthening and Implementing the Global Response. In: Global Warming of 1.5°C: An IPCC special report on the impacts of global warming of 1.5°C above pre-industrial levels and related global greenhouse gas emission pathways, in the context of strengthening the global response to the threat of climate change, sustainable development, and efforts to eradicate poverty. [Masson-Delmotte, V., P. Zhai, H.-O. Pörtner, D. Roberts, J. Skea, P.R. Shukla, A. Pirani, W. Moufouma-Okia, C. Péan, R. Pidcock, S. Connors, J.B.R. Matthews, Y. Chen, X. Zhou, M.I. Gomis, E. Lonnoy, T. Maycock, M. Tignor, and T. Waterfield (eds.)]. Cambridge University Press, Cambridge, United Kingdom and New York, NY, USA, pp 313–443.
Deep Decarbonization Pathways Project, 2015: Pathways to deep decarbonsiation: 2015 report. Published by the Sustainable Development Solutions Network (SDSN) and the Institute for Sustainable Development and International Relations (IDDRI). Sustainable Development Solutions Network (SDSN) and Institute for Sustainable Development and International Relations (IDDRI), Paris and New York, 44 pp., https://www.iddri.org/sites/default/files/import/publications/ddpp_2015synthetisreport.pdf (Accessed November 1, 2021).
Deetman, S. et al., 2013: Deep greenhouse gas emission reductions in Europe: Exploring different options. Energy Policy, 55, 152–164, doi:10.1016/j.enpol.2012.11.047.
Delgado, R., A.I. Cadena, M. Espinosa, C. Peña, and M. Salazar, 2014: A case study on Colombian mitigation actions. Clim. Dev. , 6(sup1) , 12–24, doi:10.1080/17565529.2013.857587.
Delgado, R., T.B. Wild, R. Arguello, L. Clarke, and G. Romero, 2020: Options for Colombia’s mid-century deep decarbonization strategy. Energy Strateg. Rev. , 32, 100525, doi:10.1016/J.ESR.2020.100525.
den Elzen, M. et al., 2016: Contribution of the G20 economies to the global impact of the Paris agreement climate proposals. Clim. Change, 137(3–4) , 655–665, doi:10.1007/s10584-016-1700-7.
den Elzen, M. et al., 2019: Are the G20 economies making enough progress to meet their NDC targets?Energy Policy, 126, 238–250, doi:10.1016/j.enpol.2018.11.027.
den Elzen, M., I. Dafnomilis, and H. van Soest, 2021: PBL Climate Pledge NDC tool. PBL Netherlands Environ. Assess. Agency, https://themasites.pbl.nl/o/climate-ndc-policies-tool/ (Accessed October 7, 2021).
Deutscher Bundestag, 2002: Enquete Commission on sustainable energy supply against the background of globalisation and liberalisation. Summary of final report . Berlin, Germany, http://webarchiv.bundestag.de/archive/2007/0206/parlament/gremien/kommissionen/archiv14/ener/schlussbericht/engl.pdf (Accessed November 1, 2021).
Devarajan, S., D.S. Go, S. Robinson, and K. Thierfelder, 2011: Tax Policy to Reduce Carbon Emissions in a Distorted Economy: Illustrations from a South Africa CGE Model. B.E.J. Econom. Anal. Policy, 11(1) , doi:10.2202/1935-1682.2376.
Dhar, S., M. Pathak, and P.R.R. Shukla, 2018: Transformation of India’s transport sector under global warming of 2°C and 1.5°C scenario. J. Clean. Prod. , 172, 417–427, doi:10.1016/j.jclepro.2017.10.076.
Di Gregorio, M. et al., 2016: Integrating mitigation and adaptation in climate and land use policies in Brazil: a policy document analysis. Centre for Climate Change Economics and Policy and Sustainability Research Institute, Leeds and London, United Kingdom, 54 pp., https://www.cccep.ac.uk/wp-content/uploads/2016/02/Working-Paper-257-Di-Gregorio-et-al-2016.pdf (Accessed November 1, 2021).
Diao, X., M. McMillan, and D. Rodrik, 2019: The Recent Growth Boom in Developing Economies: A Structural-Change Perspective. In: The Palgrave Handbook of Development Economics[Nissanke M. and J.A. Ocampo (eds.)]. Springer International Publishing, Cham, Switzerland, pp. 281–334.
Díaz, S., J. Settele, and E. Brondízio, 2019: Global assessment report on biodiversity and ecosystem services. Summary for policymakers. Intergovernmental Science-Policy Platform on Biodiversity and Ecosystem (IPBES), Bonn, Germany, 56 pp.
Diffenbaugh, N.S. and M. Burke, 2019: Global warming has increased global economic inequality. Proc. Natl. Acad. Sci. 116(20) , 9808–9813, doi:10.1073/pnas.1816020116.
Dioha, M.O. and A. Kumar, 2020: Exploring sustainable energy transitions in sub-Saharan Africa residential sector: The case of Nigeria. Renew. Sustain. Energy Rev. , 117, 109510, doi:10.1016/j.rser.2019.109510.
Dioha, M.O., N.V. Emodi, and E.C. Dioha, 2019: Pathways for low carbon Nigeria in 2050 by using NECAL2050. Renew. Energy Focus, 29 (June), 63–77, doi:10.1016/j.ref.2019.02.004.
Doelle, M., 2019: The heart of the Paris rulebook: Communicating ndcs and Accounting for Their Implementation. Clim. Law, 9(1–2) , 3–20, doi:10.1163/18786561-00901002.
Dong, B., W. Wei, X. Ma, and P. Li, 2018: On the impacts of carbon tax and technological progress on China. Appl. Econ. , 50(4) , 389–406, doi:10.1080/00036846.2017.1316826.
Dooley, K. and S. Kartha, 2018: Land-based negative emissions: Risks for climate mitigation and impacts on sustainable development. Int. Environ. Agreements Polit. Law Econ. , 18(1) , 79–98, doi:10.1007/s10784-017-9382-9.
Dorband, I.I., M. Jakob, M. Kalkuhl, and J.C. Steckel, 2019: Poverty and distributional effects of carbon pricing in low- and middle-income countries – A global comparative analysis. World Dev. , 115, 246–257, doi:10.1016/j.worlddev.2018.11.015.
Dorin, B., 2017: India and Africa in the global agricultural system (1961-2050): Towards a new socio-technical regime?Econ. Polit. Wkly. , 52(25–26) , 5–13.
Douenne, T., 2020: The Vertical and Horizontal Distributive Effects of Energy Taxes: A Case Study of a French Policy. Energy J. , 41(3) , doi:10.5547/01956574.41.3.tdou.
Douenne, T. and A. Fabre, 2020: French attitudes on climate change, carbon taxation and other climate policies. Ecol. Econ. , 169, doi.org/10.1016/j.ecolecon.2019.106496.
Doumax-Tagliavini, V. and C. Sarasa, 2018: Looking towards policies supporting biofuels and technological change: Evidence from France. Renew. Sustain. Energy Rev. , 94, 430–439, doi:10.1016/j.rser.2018.06.020.
Dreborg, K.H., 1996: Essence of backcasting. Futures, 28(9) , 813–828, doi:10.1016/S0016-3287(96)00044-4.
Dreyfus, G., Borgford-Parnell, J. Fahey, B. Peters, and Xu, 2020: Assessment of Climate and Development Benefits of Efficient and Climate-Friendly Cooling[Molina, M. and Zaelke, D. (eds.)], https://www.ccacoalition.org/en/resources/assessment-climate-and-development-benefits-efficient-and-climate-friendly-cooling.
Druckman, A. and T. Jackson, 2015: Understanding households as drivers of carbon emissions. In: Taking Stock of Industrial Ecology[Clift, R. and A. Druckman (eds.)]. Springer International Publishing, Cham, Switzerland, pp. 181–203.
Duan, H., J. Mo, Y. Fan, and S. Wang, 2018: Achieving China’s energy and climate policy targets in 2030 under multiple uncertainties. Energy Econ. , 70, 45–60, doi:10.1016/J.ENECO.2017.12.022.
Dubash, N., R. Khosla, N.D.N. D. Rao, and A. Bhardwaj, 2018: India’s energy and emissions future: An interpretive analysis of model scenarios. Environ. Res. Lett. , 13 (074018), doi:10.1088/1748-9326/aacc74.
Dubash, N.K., 2012: Toward Enabling and Inclusive Global Environmental Governance. J. Environ. Dev. , 21(1) , 48–51, doi:10.1177/1070496511435550.
Dubash, N.K., 2021: Varieties of climate governance: The emergence and functioning of climate institutions. Env. Polit. , 30(sup1) , 1–25, doi:10.1080/09644016.2021.1979775.
Dubois, G. et al., 2019: It starts at home? Climate policies targeting household consumption and behavioral decisions are key to low-carbon futures. Energy Res. Soc. Sci. , 52, 144–158, doi:10.1016/j.erss.2019.02.001.
Dulal, H.B., 2017: Making cities resilient to climate change: Identifying ‘win–win’ interventions. Local Environ. , 22(1) , 106–125, doi:10.1080/13549839.2016.1168790.
Duscha, V., J. Wachsmuth, J. Eckstein, and B. Pfluger, 2019: GHG-neutral EU2050 – a scenario of an EU with net-zero greenhouse gas emissions and its implications. Fraunhofer Institute for Systems and Innovation Research, Karlsruhe, Germany, 81 pp., https://www.umweltbundesamt.de/en/publikationen/ghg-neutral-eu2050 (Accessed November 1, 2021).
Ebi, K.L. et al., 2014: A new scenario framework for climate change research: Background, process, and future directions. Clim. Change, 122(3) , doi:10.1007/s10584-013-0912-3.
Edwards, P.E.T., A.E. Sutton-Grier, and G.E. Coyle, 2013: Investing in nature: Restoring coastal habitat blue infrastructure and green job creation. Mar. Policy, 38, 65–71, doi:10.1016/j.marpol.2012.05.020.
EFC, 2020: Synthesis Report 2020 on China’s carbon neutrality: China’s new growth pathway: from the 14th Five Year Plan to carbon neutrality, Energy Foundation China, Beijing, China, https://www.efchina.org/Reports-en/report-lceg-2020121 (Accessed November 1, 2021).
Ekholm, T., H. Ghoddusi, V. Krey, and K. Riahi, 2013: The effect of financial constraints on energy-climate scenarios. Energy Policy, 59, 562–572, doi:10.1016/j.enpol.2013.04.001.
Elizondo, A., V. Pérez-Cirera, A. Strapasson, J.C. Fernández, and D. Cruz-Cano, 2017: Mexico’s low-carbon futures: An integrated assessment for energy planning and climate change mitigation by 2050. Futures, 93, 14–26, doi:10.1016/j.futures.2017.08.003.
Elliott, C., K. Levin, J. Thwaites, K. Mogelgaard, and Y. Dagnet, 2017: Designing the enhanced transparency framework part 1: Reporting under the Paris Agreement . World Resources Institute, Washington, DC, USA.
Energy Transitions Commission and Rocky Mountain Institute, 2019: China 2050 : A Fully Developed Rich Zero-Carbon Economy. https://www.energy-transitions.org/publications/china-2050-a-fully-developed-rich-zero-carbon-economy/#download-form.
Erb, K.H. et al., 2016: Exploring the biophysical option space for feeding the world without deforestation. Nat. Commun. , 7, doi:10.1038/ncomms11382.
Erickson, P., S. Kartha, M. Lazarus, and K. Tempest, 2015: Assessing carbon lock-in. Environ. Res. Lett. , 10(8) , 084023, doi:10.1088/1748-9326/10/8/084023.
Esquivel, V., 2016: Power and the Sustainable Development Goals: a feminist analysis. Gend. Dev. , 24(1) , 9–23, doi:10.1080/13552074.2016.1147872.
Esteban, M. and J. Portugal-Pereira, 2014: Post-disaster resilience of a 100% renewable energy system in Japan. Energy, 68, 756–764, doi:10.1016/j.energy.2014.02.045.
Esteban, M. et al., 2018: 100% renewable energy system in Japan: Smoothening and ancillary services. Appl. Energy, 224, 698–707, doi:10.1016/j.apenergy.2018.04.067.
European Commission, 2013: Summary report on the analysis of the responses received to the Consultative Communication on the future of Carbon Capture and Storage in Europe – Energía y Sociedad. European Commission, Brussels, Belgium, https://energy.ec.europa.eu/system/files/2014-10/20130702_ccs_consultation_report_0.pdf (Accessed October 18, 2021).
European Commission, 2019: The European Green Deal. COM(2019) 640 final. European Commission (EC), Brussels, Belgium., https://eur-lex.europa.eu/legal-content/EN/TXT/?uri=COM%3A2019%3A640%3AFIN (Accessed November 1, 2021).
European Union, 2019: Structural Support Action for Coal and Carbon Intensive Regions. European Commission (EC), Brussels, Belgium,https://ec.europa.eu/energy/topics/oil-gas-and-coal/EU-coal-regions/coal-regions-transition_en (Accessed June 15, 2020).
European Union, 2020: Financing the green transition: The European Green Deal Investment Plan and Just Transition Mechanism– Regional Policy – European Commission. European Commission (EC), Brussels, Belgium, https://ec.europa.eu/regional_policy/en/newsroom/news/2020/01/14-01-2020-financing-the-green-transition-the-european-green-deal-investment-plan-and-just-transition-mechanism (Accessed December 15, 2020).
Fagerberg, J., S. Laestadius, and B.R. Martin, 2016: The Triple Challenge for Europe: The Economy, Climate Change, and Governance. Challenge, 59(3) , 178–204, doi:10.1080/05775132.2016.1171668.
Fankhauser, S. and T.K.J. McDermott, 2016: Chapter 1: Climate-resilient development: an introduction. In: The Economics of Climate-Resilient Development [Fankhauser, S. and T.K.J. McDermott, (eds.)]. Edward Elgar Publishing, Cheltenham, UK, 1–14pp.
Fankhauser, S., A. Sahni, A. Savvas, and J. Ward, 2016: Where are the gaps in climate finance?Clim. Dev. , 8(3) , 203–206, doi:10.1080/17565529.2015.1064811.
FAO, 2016: The agricultural sectors in nationally determined contributions (NDCs): Priority areas for international support . Food and Agriculture Organization of the United Nations, Rome, Italy. http://www.fao.org/3/a-i6400e.pdf , 23 pp (Accessed July 12, 2019).
Fargione, J.E. et al., 2018: Natural climate solutions for the United States. Sci. Adv. , 4(11) , doi:10.1126/sciadv.aat1869.
Faria, P.C.S. and N. Labutong, 2019: A description of four science-based corporate GHG target-setting methods. Sustain. Accounting, Manag. Policy J. , 11(3) , 591–612, doi:10.1108/SAMPJ-03-2017-0031.
Farrow, K., G. Grolleau, and L. Ibanez, 2017: Social Norms and Pro-environmental Behavior: A Review of the Evidence. Ecol. Econ. , 140, 1–13, doi:10.1016/j.ecolecon.2017.04.017.
Fekete, H. et al., 2015: How can the new climate agreement support robust national mitigation targets? Opportunities up to Paris and beyond. Umweltbundesamt, Dessau-Roßlau, Germany, https://newclimate.org/wp-content/uploads/2015/12/climate_change_25_2015_how_can_the_climate_agreement_support_robust_national_mitigation_targets.pdf , 26 pp (Accessed July 12, 2019).
Fennessy, M.S. et al., 2019: Environmental controls on carbon sequestration, sediment accretion, and elevation change in the Ebro River Delta: Implications for wetland restoration. Estuar. Coast. Shelf Sci. , 222, 32–42, doi:10.1016/J.ECSS.2019.03.023.
Ferleger, L., 2000: Arming American Agriculture for the Twentieth Century: How the USDA’s Top Managers Promoted Agricultural Development. Agricult . Hist ., 74(2) , 211–226.
Fernandez, M.A. and A.J. Daigneault, 2018: Money does grow on trees: Impacts of the Paris agreement on the New Zealand economy. Clim. Chang. Econ. , 9(3) , 1850005, doi:10.1142/S2010007818500057.
Ferrante, L. and P.M. Fearnside, 2019: Brazil’s new president and ‘ruralists’ threaten Amazonia’s environment, traditional peoples and the global climate. Environ. Conserv. , 46(4) , 261–263, doi:10.1017/S0376892919000213.
Figueres, C. et al., 2017: Three years to safeguard our climate. Nature, 546(7660) , 593–595, doi:10.1038/546593a.
Finnish Government, 2020: A fair transition towards a carbon neutral Finland – Roadmap for achieving the carbon neutrality target . Government of Finland, Helsinki, Finland https://valtioneuvosto.fi/documents/10616/20764082/hiilineutraaliuden+tiekartta+03022020+en.pdf/e791931c-90e1-f74b-3be4-3dc0994f67f1/hiilineutraaliuden+tiekartta+03022020+en.pdf , 6 pp (Accessed November 1, 2021).
Fleischman, F. et al., 2020: Pitfalls of Tree Planting Show Why We Need People-Centered Natural Climate Solutions. Bioscience, 70(11) , 947–950, doi:10.1093/biosci/biaa094.
Fleurbaey, M. and D. Blanchet, 2013: Beyond GDP: Measuring Welfare and Assessing Sustainability. J. Reg. Sci. , 54(1) , 323, 10.1093/acprof:oso/9780199767199.001.0001.
Fleurbaey M., S. Kartha, S. Bolwig, Y.L. Chee, Y. Chen, E. Corbera, F. Lecocq, W. Lutz, M.S. Muylaert, R.B. Norgaard, C. Okereke, and A.D. Sagar, 2014: Sustainable Development and Equity. In: Climate Change 2014: Mitigation of Climate Change. Contribution of Working Group III to the Fifth Assessment Report of the Intergovernmental Panel on Climate Change[Edenhofer, O., R. Pichs-Madruga, Y. Sokona, E. Farahani, S. Kadner, K. Seyboth, A. Adler, I. Baum, S. Brunner, P. Eickemeier, B. Kriemann, J. Savolainen, S. Schlömer, C. von Stechow, T. Zwickel and J.C. Minx (eds.)]. Cambridge University Press, Cambridge, UK, and New York, NY, USA, pp. 283–350.
Fleurbaey, M. et al., 2018: A Manifesto for Social Progress. Cambridge University Press, Cambridge, United Kingdom and New York, NY, USA, 248 pp.
Forouli, A., A. Nikas, D.J. Van de Ven, J. Sampedro, and H. Doukas, 2020: A multiple-uncertainty analysis framework for integrated assessment modelling of several sustainable development goals. Environ. Model. Softw. , 131, 104795, doi:10.1016/J.ENVSOFT.2020.104795.
Forster, P.M. et al., 2020: Current and future global climate impacts resulting from COVID-19. Nat. Clim. Change, 10(10) , 913–919, doi:10.1038/s41558-020-0883-0.
Fouquet, R., 2010: The slow search for solutions: Lessons from historical energy transitions by sector and service. Energy Policy, 38(11) , 6586–6596, doi:10.1016/j.enpol.2010.06.029.
Fouquet, R., 2016a: Path dependence in energy systems and economic development. Nat. Energy, 1(8) , 16098, doi:10.1038/nenergy.2016.98.
Fouquet, R., 2016b: Historical energy transitions: Speed, prices and system transformation. Energy Res. Soc. Sci. , 22, 7–12, doi:10.1016/j.erss.2016.08.014.
Fourqurean, J.W. et al., 2012: Seagrass ecosystems as a globally significant carbon stock. Nat. Geosci. , 5(7) , 505–509, doi:10.1038/ngeo1477.
Fragkos, P., N. Tasios, L. Paroussos, P. Capros, and S. Tsani, 2017: Energy system impacts and policy implications of the European Intended Nationally Determined Contribution and low-carbon pathway to 2050. Energy Policy, 100, 216–226, doi:10.1016/j.enpol.2016.10.023.
Fragkos, P. et al., 2021: Energy system transitions and low-carbon pathways in Australia, Brazil, Canada, China, EU-28, India, Indonesia, Japan, Republic of Korea, Russia and the United States. Energy, 216, 119385, doi:10.1016/j.energy.2020.119385.
Frank, S. et al., 2017: Reducing greenhouse gas emissions in agriculture without compromising food security?Environ. Res. Lett. , 12(10) , 105004, doi:10.1088/1748-9326/aa8c83.
Fridahl, M. and L. Johansson, 2017: An assessment of the potential for spurring transformational change through Nationally Appropriate Mitigation Actions (NAMAs). Environ. Innov. Soc. Transitions, 25, 35–46, doi:10.1016/j.eist.2016.11.003.
Fuhrman, J. et al., 2020: Food–energy–water implications of negative emissions technologies in a +1.5°C future. Nat. Clim. Change, 10(10) , 920–927, doi:10.1038/s41558-020-0876-z.
Fujimori, S., K. Oshiro, H. Shiraki, and T. Hasegawa, 2019: Energy transformation cost for the Japanese mid-century strategy. Nat. Commun. , 10(1) , 4737, doi:10.1038/s41467-019-12730-4.
Fullerton, D. and E. Muehlegger, 2019: Who Bears the Economic Burdens of Environmental Regulations?Rev. Environ. Econ. Policy, 13(1) , 62–82, doi:10.1093/reep/rey023.
Fuso Nerini, F. et al., 2019: Connecting climate action with other Sustainable Development Goals. Nat. Sustain. , 2(8) , 674–680, doi:10.1038/s41893-019-0334-y.
Fyson, C.L. and M.L. Jeffery, 2019: Ambiguity in the Land Use Component of Mitigation Contributions Toward the Paris Agreement Goals. Earth’s Futur. , 7(8) , 873–891, doi:10.1029/2019EF001190.
Fyson, C.L., S. Baur, M. Gidden, and C.-F. Schleussner, 2020: Fair-share carbon dioxide removal increases major emitter responsibility. Nat. Clim. Change, 10(9) , 836–841, doi:10.1038/s41558-020-0857-2.
Gable, S., H. Lofgren, and I.O. Rodarte, 2015: Trajectories for Sustainable Development Goals: Framework and Country Applications. World Bank, Washington, DC, USA, https://openknowledge.worldbank.org/handle/10986/23122 (Accessed November 1, 2021).
Galer, G., 2004: Preparing the ground? Scenarios and political change in South Africa. Development , 47(4) , 26–34, doi:10.1057/palgrave.development.1100092.
Galgóczi, B., 2014: The long and winding road from black to green: Decades of structural change in the Ruhr region. Int. J. Labour Res. , 6(2) , 217–268.
Galgóczi, B., 2019: Phasing out Coal – A Just Transition Approach. European Trade Union Institute , Brussels, Belgium, https://etui.org/sites/default/files/19%20WP%202019%2004%20Phasing%20out%20coal%20Galgoczi%20Web%20version.pdf , 45 pp (Accessed November 1, 2021).
Galvin, R. and N. Healy, 2020: The Green New Deal in the United States: What it is and how to pay for it. Energy Res. Soc. Sci. , 67, doi:10.1016/j.erss.2020.101529.
Gambhir, A., F. Green, and P. Pearson, 2018: Towards a just and equitable low-carbon energy transition. Grantham Institute, Imperial College London, London, UK, 18 pp.
Garg, A. and S. S.Vishwanathan., 2021: Climate policies post Paris. In: Climate ambition beyond emission numbers: Taking stock of progress by looking inside countries and sectors[Waisman, H. et al., (eds.)]. Deep Decarbonization Pathways (DDP) Initiative-IDDRI. Paris, France, pp. 71–76.
Gass, P. and D. Echeverria, 2017: Fossil Fuel Subsidy Reform and the Just Transition: Integrating approaches for complementary outcomes GSI REPORT. https://www.iisd.org/system/files/publications/fossil-fuel-subsidy-reform-just-transition.pdf (Accessed December 15, 2020).
Gattuso, J.P. et al., 2018: Ocean solutions to address climate change and its effects on marine ecosystems. Front. Mar. Sci. , 5 (Oct), doi:10.3389/fmars.2018.00337.
Geels, F.W., B.K. Sovacool, T. Schwanen, and S. Sorrell, 2017: Socio-technical transitions for deep decarbonization. Science, 357(6357) , 1242–1244, doi:10.1126/science.aao3760.
Geels, F.W., T. Schwanen, S. Sorrell, K. Jenkins, and B.K. Sovacool, 2018: Reducing energy demand through low-carbon innovation: A socio-technical transitions perspective and thirteen research debates. Energy Res. Soc. Sci. , 40 (June 2017), 23–35, doi:10.1016/j.erss.2017.11.003.
Giannousakis, A. et al., 2020: How uncertainty in technology costs and carbon dioxide removal availability affect climate mitigation pathways. Energy, 216, 119253, doi:10.1016/j.energy.2020.119253.
Gilbert, A., B.K. Sovacool, P. Johnstone, and A. Stirling, 2017: Cost overruns and financial risk in the construction of nuclear power reactors: A critical appraisal. Energy Policy, 102, 644–649, doi:10.1016/j.enpol.2016.04.001.
Gillingham, K.T., C.R. Knittel, J. Li, M. Ovaere, and M. Reguant, 2020: The Short-run and Long-run Effects of Covid-19 on Energy and the Environment. Joule, 4(7) , 1337–1341, doi:10.1016/j.joule.2020.06.010.
GIZ, 2017: Sectoral implementation of nationally determined contributions (NDCs). Deutsche Gesellschaft für Internationale Zusammenarbeit (GIZ) GmbH, Bonn and Eschborn, Germany, https://newclimate.org/2017/08/01/sectoral-implementation-of-nationally-determined-contributions-ndcs/, 12 pp. (Accessed July 12, 2019).
Glachant, M. and A. Dechezleprêtre, 2017: What role for climate negotiations on technology transfer?Clim. Policy, 17(8) , 962–981, doi:10.1080/14693062.2016.1222257.
Global Cement and Concrete Association, 2020: Climate Ambition: GCCA. Global Cement and Concrete Association, London, United Kingdom, https://gccassociation.org/climate-ambition/ (Accessed October 18, 2021).
Glomsrød, S., T. Wei, B. Aamaas, M.T. Lund, and B.H. Samset, 2016: A warmer policy for a colder climate: Can China both reduce poverty and cap carbon emissions?Sci. Total Environ. , 568, 236–244, doi:10.1016/j.scitotenv.2016.06.005.
Gomi, K., K. Shimada, and Y. Matsuoka, 2010: A low-carbon scenario creation method for a local-scale economy and its application in Kyoto city. Energy Policy, 38(9) , 4783–4796, doi:10.1016/j.enpol.2009.07.026.
Gomi, K., Y. Ochi, and Y. Matsuoka, 2011: A systematic quantitative backcasting on low-carbon society policy in case of Kyoto city. Technol. Forecast. Soc. Change, 78(5) , 852–871, doi:10.1016/j.techfore.2011.01.002.
Goulder, L.H., M.A.C. Hafstead, G. Kim, and X. Long, 2019: Impacts of a carbon tax across US household income groups: What are the equity-efficiency trade-offs?J. Public Econ. , 175, 44–64, doi:10.1016/j.jpubeco.2019.04.002.
Government of Canada, 2019: Task Force: Just Transition for Canadian Coal Power Workers and Communities. Government of Canada, Ottawa, Canada, https://www.canada.ca/en/environment-climate-change/services/climate-change/task-force-just-transition.html (Accessed January 8, 2020).
Government of Costa Rica, 2019: National Decarbonization Plan 2018-2050. Government of Costa Rica, San José, Costa Rica, https://unfccc.int/sites/default/files/resource/NationalDecarbonizationPlan.pdf (Accessed 1 November 2021).
Government of India, 2015: India’s Intended Nationally Determined Contribution: Working Towards Climate Justice. Ministry of Environment, Forest and Climate Change, Government of India, NewDelhi, India,.https://www4.unfccc.int/sites/ndcstaging/PublishedDocuments/India%20First/INDIA%20INDC%20TO%20UNFCCC.pdf , 38 pp (Accessed 1 November 2021).
Government of India, 2018: Strategy for New India @ 75. Government of India, New Delhi, Indiahttps://niti.gov.in/sites/default/files/2019-01/Strategy_for_New_India_0.pdf (Accessed November 1, 2021).
Government of Spain, 2019: The just transition strategy within the strategic energy and climate framework. Government of Spain, Madrid, Spain, 20 pp., https://www.miteco.gob.es/en/prensa/etj-english-interactive_tcm38- 505653.pdf (Accessed November 1, 2021).
Grafakos, S., K. Trigg, M. Landauer, L. Chelleri, and S. Dhakal, 2019: Analytical framework to evaluate the level of integration of climate adaptation and mitigation in cities. Clim. Change, 154(1–2) , 87–106, doi:10.1007/s10584-019-02394-w.
Grant, N., A. Hawkes, S. Mittal, and A. Gambhir, 2021: Confronting mitigation deterrence in low-carbon scenarios. Environ. Res. Lett. , 16(6) , 064099, doi:10.1088/1748-9326/ac0749.
Grant, R., 2015: Sustainable African Urban Futures. Am. Behav. Sci. , 59(3) , 294–310, doi:10.1177/0002764214550301.
Grassi, G. et al., 2017: The key role of forests in meeting climate targets requires science for credible mitigation. Nat. Clim. Change, 7(3) , 220–226, doi:10.1038/nclimate3227.
Grassi, G. et al., 2018: Reconciling global-model estimates and country reporting of anthropogenic forest CO2 sinks. Nat. Clim. Change, 8(10) , 914–920, doi:10.1038/s41558-018-0283-x.
Grassi, G. et al., 2021: Critical adjustment of land mitigation pathways for assessing countries’ climate progress. Nat. Clim. Change, 11(5) , 425–434, doi:10.1038/s41558-021-01033-6.
Gray, L.K., T. Gylander, M.S. Mbogga, P.Y. Chen, and A. Hamann, 2011: Assisted migration to address climate change: Recommendations for aspen reforestation in western Canada. Ecol. Appl. , 21(5) , 1591–1603, doi:10.1890/10-1054.1.
Green, F. and R. Denniss, 2018: Cutting with both arms of the scissors: The economic and political case for restrictive supply-side climate policies. Clim. Change, 150(1) , 73–87, doi:10.1007/s10584-018-2162-x.
Green, F. and A. Gambhir, 2020: Transitional assistance policies for just, equitable and smooth low-carbon transitions: Who, what and how?Clim. Policy, 20(8) , 902–921, doi:10.1080/14693062.2019.1657379.
Griliches, Z., 1957: Hybrid Corn: An Exploration in the Economics of Technological Change. Econometrica, 25(4) , 501, doi:10.2307/1905380.
Grin, J., J. Rotmans, and J. Schot, 2010: Transitions to sustainable development: New directions in the study of long term transformative change. Routledge, New York, USA and Oxon, UK, 397 pp.
Griscom, B.W. et al., 2017: Natural climate solutions. Proc. Natl. Acad. Sci., 114(44) , 11645–11650, doi:10.1073/pnas.1710465114.
Grottera, C., A.O. Pereira, and E.L. La Rovere, 2017: Impacts of carbon pricing on income inequality in Brazil. Clim. Dev. , 9(1) , 80–93, doi:10.1080/17565529.2015.1067183.
Grottera, C. et al., 2018: Linking electricity consumption of home appliances and standard of living: A comparison between Brazilian and French households. Renew. Sustain. Energy Rev. , 94 (July), 877–888, doi:10.1016/j.rser.2018.06.063.
Grubb, M., 2014: Planetary Economics. Routledge, Oxon, UK, and New York, NY, USA, 548 pp.
Grubb, M., J.C. Hourcade, and K. Neuhoff, 2015: The Three Domains structure of energy-climate transitions. Technol. Forecast. Soc. Change, 98, 290–302, doi:10.1016/j.techfore.2015.05.009.
Grubb, M. et al., 2021: Induced innovation in energy technologies and systems a review of evidence and potential implications for CO2 mitigation. Environ. Res. Lett. , 16(4) , 043007, doi:10.1088/1748-9326/abde07.
Grubler, A., 2010: The costs of the French nuclear scale-up: A case of negative learning by doing. Energy Policy, 38(9) , 5174–5188, doi:10.1016/j.enpol.2010.05.003.
Grubler, A. et al., 2018: A low energy demand scenario for meeting the 1.5°C target and sustainable development goals without negative emission technologies. Nat. Energy, 3(6) , 515–527, doi:10.1038/s41560-018-0172-6.
Grunewald, N., S. Klasen, I. Martınez-Zarzoso, and C. Muris, 2017: The trade-off between income inequality and carbon dioxide emissions. Ecol. Econ. , 142, 249–256, doi: 10.1016/j.ecolecon.2017.06.034.
Guan, D. et al., 2018: Structural decline in China’s CO2 emissions through transitions in industry and energy systems. Nat. Geosci. , 11(8) , 551–555, doi:10.1038/s41561-018-0161-1.
Gupta, D., F. Ghersi, S.S. Vishwanathan, and A. Garg, 2019: Achieving sustainable development in India along low-carbon pathways: Macroeconomic assessment. World Dev. , 123, 104623, doi:10.1016/J.WORLDDEV.2019.104623.
Haberl, H. et al., 2020: A systematic review of the evidence on decoupling of GDP, resource use and GHG emissions, part II: Synthesizing the insights. Environ. Res. Lett. , 15 (6) , 065003, doi:10.1088/1748-9326/AB842A.
Haines, A. et al., 2017: Short-lived climate pollutant mitigation and the Sustainable Development Goals. Nat. Clim. Change, 7(12) , 863–869, doi:10.1038/s41558-017-0012-x.
Haites, E., 2018: Carbon taxes and greenhouse gas emissions trading systems: What have we learned?Clim. Policy, 18(8) , 955–966, doi:10.1080/14693062.2018.1492897.
Halimanjaya, A. and E. Papyrakis, 2012: Donor Characteristics and the Supply of Climate Change Aid. DEV Working Paper 42. The School of International Development, University of East Anglia, Norwich, United Kingdom, 28 pp.
Hamilton, T.G.A. and S. Kelly, 2017: Low-carbon energy scenarios for sub-Saharan Africa: An input-output analysis on the effects of universal energy access and economic growth. Energy Policy, 105 (February), 303–319, doi:10.1016/j.enpol.2017.02.012.
Hammond, W., J. Axsen, and E. Kjeang, 2020: How to slash greenhouse gas emissions in the freight sector: Policy insights from a technology-adoption model of Canada. Energy Policy, 137 (November 2019), 111093, doi:10.1016/j.enpol.2019.111093.
Hanaoka, T. and T. Masui, 2018: Co-benefit Reductions of Short-Lived Climate Pollutants and Air Pollutants by 2050 while Achieving the 2 Degree Target in Asia. J. Sustain. Dev. Energy, Water Environ. Syst. , 6(3) , 505–520, doi:10.13044/j.sdewes.d6.0218.
Hanger-Kopp, S., J. Lieu, and A. Nikas, 2019: Narratives of Low-Carbon Transitions. Routledge, Oxon, UK, and New York, NY, USA, 296 pp.
Hansen, K., B.V. Mathiesen, and I.R. Skov, 2019: Full energy system transition towards 100% renewable energy in Germany in 2050. Renew. Sustain. Energy Rev. , 102, 1–13, doi:10.1016/j.rser.2018.11.038.
Hao, Y., H. Chen, and Q. Zhang, 2016: Will income inequality affect environmental quality? Analysis based on China’s provincial panel data. Ecol. Indic. , 67, 533–542, doi:10.1016/j.ecolind.2016.03.025.
Harper, A.B. et al., 2018: Land-use emissions play a critical role in land-based mitigation for Paris climate targets. Nat. Commun. , 9 (1) , doi:10.1038/s41467-018-05340-z.
Harrison, K., 2013: The Political Economy of British Columbia’s Carbon Tax. OECD Environment Working Papers No.63, OECD, Paris, France, 22 pp,https://www.oecd-ilibrary.org/environment-and-sustainable-development/the-political-economy-of-british-columbia-s-carbon-tax_5k3z04gkkhkg-en.
Harvey, C.A. et al., 2014: Climate-Smart Landscapes: Opportunities and Challenges for Integrating Adaptation and Mitigation in Tropical Agriculture. Conserv. Lett. , 7(2) , 77–90, doi:10.1111/conl.12066.
Hasegawa, T. et al., 2018: Risk of increased food insecurity under stringent global climate change mitigation policy. Nat. Clim. Change, 8(8) , 699–703, doi:10.1038/s41558-018-0230-x.
Haut Conseil pour le Climat, 2019: Agir en cohérence avec les ambitions. Rapport annuel., Haut Conseil pour le Climat, Paris, France, 66 pp.,https://www.hautconseilclimat.fr/wp-content/uploads/2019/09/hcc_rapport_annuel_2019_v2.pdf (Accessed November 1, 2021).
Häyhä, T., P.L. Lucas, D.P. van Vuuren, S.E. Cornell, and H. Hoff, 2016: From Planetary Boundaries to national fair shares of the global safe operating space – How can the scales be bridged?Glob. Environ. Change, 40, 60-72, doi:10.1016/j.gloenvcha.2016.06.008.
He, J.-K., 2016: Global low-carbon transition and China’s response strategies. Adv. Clim. Chang. Res. , 7(4) , 204–212, doi.org/10.1016/j.accre.2016.06.007.
Healy, N. and J. Barry, 2017: Politicizing energy justice and energy system transitions: Fossil fuel divestment and a ‘just transition.’Energy Policy, 108, 451–459, doi:10.1016/j.enpol.2017.06.014.
Heck, V., D. Gerten, W. Lucht, and A. Popp, 2018: Biomass-based negative emissions difficult to reconcile with planetary boundaries. Nat. Clim. Change, 8(2) , 151–155, doi:10.1038/s41558-017-0064-y.
Heidrich, O. et al., 2016: National climate policies across Europe and their impacts on cities strategies. J. Environ. Manage. , 168, 36–45, doi:10.1016/j.jenvman.2015.11.043.
Hein, J., A. Guarin, E. Frommé, and P. Pauw, 2018: Deforestation and the Paris climate agreement: An assessment of REDD+ in the national climate action plans. For. Policy Econ. , 90, 7–11, doi.org/10.1016/j.forpol.2018.01.005.
Helgenberger, S. et al., 2019: Future skills and job creation through renewable energy in South Africa: Assessing the co-benefits of decarbonising the power sector. IASS Studies, Council for Scientific and Industrial Research and Institute for Advanced Sustainability Studies, Pretoria and Postdam, doi: 10.2312/iass.2019.009.
Helsinki Design Lab, 2011: In Studio: Recipes for Systemic Change, SITRA, Helskinki, Finland, 335pp, http://www.helsinkidesignlab.org/peoplepods/themes/hdl/downloads/In_Studio-Recipes_for_Syst emic_Change.pdf (Accessed November 1, 2021).
Hepburn, C., B. O’Callaghan, N. Stern, J. Stiglitz, and D. Zenghelis, 2020: Will COVID-19 fiscal recovery packages accelerate or retard progress on climate change?Oxford Rev. Econ. Policy, 36(sup1) , S359–S381, doi:10.1093/oxrep/graa015.
Hering, J.G., D.A. Dzombak, S.A. Green, R.G. Luthy, and D. Swackhamer, 2014: Engagement at the science-policy interface. Environ. Sci. Technol. , 48(19) , 11031–11033, doi:10.1021/es504225t.
Hermwille, L., A. Siemons, H. Förster, and L. Jeffery, 2019: Catalyzing mitigation ambition under the Paris Agreement: Elements for an effective Global Stocktake. Clim. Policy, 19(8) , 988–1001, doi:10.1080/14693062.2019.1624494.
Herreras Martínez, S. et al., 2015: Possible energy futures for Brazil and Latin America in conservative and stringent mitigation pathways up to 2050. Technol. Forecast. Soc. Change, 98, 186–210, doi:10.1016/j.techfore.2015.05.006.
Hess, D.J., 2018: Energy democracy and social movements: A multi-coalition perspective on the politics of sustainability transitions. Energy Res. Soc. Sci. , 40, 177–189, doi:10.1016/j.erss.2018.01.003.
Hickel, J. et al., 2021: Urgent need for post-growth climate mitigation scenarios. Nat. Energy, 6(8) , 766–768, doi:10.1038/s41560-021-00884-9.
Hochstenbach, C. and S. Musterd, 2018: Gentrification and the suburbanization of poverty: Changing urban geographies through boom and bust periods. Urban Geogr. , 39(1) , doi:10.1080/02723638.2016.1276718.
Hodson, E.L. et al., 2018: US energy sector impacts of technology innovation, fuel price, and electric sector CO2 policy: Results from the EMF 32 model intercomparison study. Energy Econ. , 73, 352–370, doi:10.1016/j.eneco.2018.03.027.
Hoegh-Guldberg, O. et al., 2019: The human imperative of stabilizing global climate change at 1.5°C. Science, 365 (6459), doi:10.1126/science.aaw6974.
Hoffman, S.G. and P. Durlak, 2018: The Shelf Life of a Disaster: Post-Fukushima Policy Change in The United States And Germany. Sociol. Forum, 33(2) , 378–402, doi:10.1111/socf.12419.
Höhne, N., H. Fekete, M.G.J.J. den Elzen, A. F. Hof, and T. Kuramochi, 2018: Assessing the ambition of post-2020 climate targets: A comprehensive framework. Clim. Policy, 18(4) , 425–441, doi:10.1080/14693062.2017.1294046.
Höhne, N. et al., 2019: Bridging the Gap: Enhancing Mitigation Ambition and Action at G20 Level and Globally. In UNEP Emissions Gap Report 2019. 28-38.
Höhne, N. et al., 2020: Emissions: World has four times the work or one-third of the time. Nature, 579 (7797) , 25–28, doi:10.1038/d41586-020-00571-x.
Holz, C., S. Kartha, and T. Athanasiou, 2018: Fairly Sharing 1.5: National Fair Shares of a 1.5°C – Compliant Global Mitigation Effort (D1500, Trans.). Int. Environ. Agreements Polit. Law Econ. , 18(1) , 117–134, doi:10.1007/s10784-017-9371-z.
Hong, S. and B.W. Brook, 2018: A nuclear- to-gas transition in South Korea: Is it environmentally friendly or economically viable?Energy Policy, 112, 67–73, doi:10.1016/J.ENPOL.2017.10.012.
Hong, S., C.J.A. Bradshaw, and B.W. Brook, 2014: South Korean energy scenarios show how nuclear power can reduce future energy and environmental costs. Energy Policy, 74(C) , 569–578, doi:10.1016/J.ENPOL.2014.05.054.
Hoolohan, C. et al., 2019: Stepping-up innovations in the water–energy–food nexus: A case study of anaerobic digestion in the UK. Geogr. J. , 185(4) , 391–405, doi:10.1111/geoj.12259.
Hornsey, M.J., E.A. Harris, P.G. Bain, and K.S. Fielding, 2016: Meta-analyses of the determinants and outcomes of belief in climate change. Nat. Clim. Change, 6(6) , 622–626, doi:10.1038/nclimate2943.
HoSG, 2018: Solidarity and just transition: Silesia Declaration. Supported by Heads of State and Government (HoSG) of several countries during UNFCCC COP 24. Katowice.
Howard, J. et al., 2017: Clarifying the role of coastal and marine systems in climate mitigation. Front. Ecol. Environ. , 15(1) , 42–50, doi:10.1002/fee.1451.
Hsu, A., A.J. Weinfurter, and K. Xu, 2017: Aligning subnational climate actions for the new post-Paris climate regime. Clim. Change, 142(3–4) , 419–432, doi:10.1007/s10584-017-1957-5.
Hsu, A. et al., 2018: Global climate action from cities, regions, and businesses. New Climate Institute, Cologne and Berlin, Germany,106 pp., https://newclimate. org/2018/08/30/global-climate-action-from-cities-regions-and-businesses/ (Accessed December 4, 2019).
Hsu, A. et al., 2019: A research roadmap for quantifying non-state and subnational climate mitigation action. Nat. Clim. Change, 9(1) , 11–17, doi:10.1038/s41558-018-0338-z.
Hsu, A., N. Höhne, T. Kuramochi, V. Vilariño, and B.K. Sovacool, 2020: Beyond states: Harnessing sub-national actors for the deep decarbonisation of cities, regions, and businesses. Energy Res. Soc. Sci. , 70, 101738, doi:10.1016/j.erss.2020.101738.
Hu, W.-C., S.-M. Chung, J.-C. Lin, C.-T. Fan, and C.-A. Lien, 2017: An accelerating green growth for Taiwan’s climate ambition. Renew. Sustain. Energy Rev. , 79, 286–292, doi:10.1016/j.rser.2017.05.089.
Huang, H. et al., 2019: Emissions trading systems and social equity: A CGE assessment for China. Appl. Energy, 235, 1254–1265, doi:10.1016/J.APENERGY.2018.11.056.
Huenteler, J., T.S. Schmidt, and N. Kanie, 2012: Japan’s post-Fukushima challenge – implications from the German experience on renewable energy policy. Energy Policy, 45, 6–11, doi:10.1016/j.enpol.2012.02.041.
Hummelbrunner, R. and H. Jones, 2013: A guide for planning and strategy development in the face of complexity. Overseas Development Institute, London, United Kingdom, 12 pp., https://cdn.odi.org/media/documents/8287.pdf (Accessed November 1, 2021).
Iacobuta, G., N.K. Dubash, P. Upadhyaya, M. Deribe, and N. Höhne, 2018: National climate change mitigation legislation, strategy and targets: A global update. Clim. Policy, 18(9) , 1114–1132, doi:10.1080/14693062.2018.1489772.
IADB, 2012: Room for Development: Housing Markets in Latin America and the Caribbean. Inter-American Development Bank [Patricio Bouillon, C., (ed.)]. Inter-American Development Bank (IADB), Palgrave Macmillan, New York, USA, 456 pp.
IEA, 2015: Technology Roadmap: Hydrogen and Fuel Cells. International Energy Agency (IEA), Paris, France, 75pp., https://www.iea.org/reports/technology-roadmap-hydrogen-and-fuel-cells.
IEA, 2017: Energy Technology Perspectives 2017. International Energy Agency, Paris, France, 438 pp., https://iea.blob.core.windows.net/assets/a6587f9f-e56c-4b1d-96e4-5a4da78f12fa/Energy_Technology_Perspectives_2017-PDF.pdf (Accessed July 12, 2019).
IEA, 2020: World Energy Outlook 2020. International Energy Agency (IEA), Paris, France, 461 pp.
IEA and WBSCD, 2018: Technology roadmap low-carbon transition in the cement industry. International Energy Agency, Paris, France and World Business Council for Sustainable Development, Geneva, Switzerland, https://www.wbcsd.org/contentwbc/download/4586/61682/1 .
Iftekhar, M.S., M. Polyakov, D. Ansell, F. Gibson, and G.M. Kay, 2017: How economics can further the success of ecological restoration. Conserv. Biol. , 31(2) , 261–268, doi:10.1111/cobi.12778.
ILO, 2015: Guidelines for a just transition towards environmentally sustainable economies and societies for all. International Labour Organization (ILO), Geneva, Switzerland, 23 pp., http://www.ilo.org/wcmsp5/groups/public/---ed_emp/---emp_ent/documents/publication/wcms_432859.pdf .
ILO, 2018: Just Transition Towards Environmentally Sustainable Economies and Societies for All. International Labor Organization (ILO), Geneva, Switzerland, 22 pp., https://www.ilo.org/wcmsp5/groups/public/---ed_dialogue/---actrav/documents/publication/wcms_647648.pdf .
INPE, 2019a: INPE Database PRODES – Amazônia (Monitoramento do Desmatamento da Floresta Amazônica Brasileira por Satélite). Instituto Nacional de Pesquisas Espaciais, São José dos Campos/SP, Brazilhttp://www.obt.inpe.br/OBT/assuntos/programas/amazonia/prodes (Accessed December 19, 2019).
INPE, 2019b: INPE-EM database Deforestation-driven gross emissions. Instituto Nacional de Pesquisas Espaciais, São José dos Campos/SP, Brazil, http://inpe-em.ccst.inpe.br/en/deforestation-driven-gross-emissions-old-growth-forests-amz/ (Accessed December 19, 2019).
INPE, 2020: PRODES Amazônia. Amazon deforestation satellite monitoring (Monitoramento do Desmatamento da Floresta Amazônica Brasileira por Satélite). Brasilia. Instituto Nacional de Pesquisas. (Accessed November 1, 2021).
IPBES, 2019a: Global assessment report on biodiversity and ecosystem services of the Intergovernmental Science-Policy Platform on Biodiversity and Ecosystem Services[Díaz, S.et ak. (eds.)]. Intergovernmental Science-Policy Platform on Biodiversity and Ecosystem Services (IPBES), Bonn, Germany, 1148 pp.
IPBES, 2019b: Summary for policymakers of the global assessment report on biodiversity and ecosystem services. Intergovernmental Science-Policy Platform on Biodiversity and Ecosystem Services (IPBES), Bonn, Germany.
IPCC, 2014: Climate Change 2014: Synthesis Report. Contribution of Working Groups I, II and III to the Fifth Assessment Report of the Intergovernmental Panel on Climate Change[Core Writing Team, R.K. Pachauri and L.A. Meyer (eds.)]. IPCC, Geneva, Switzerland, 151 pp.
IPCC, 2018a: Global Warming of 1.5°C: An IPCC special report on the impacts of global warming of 1.5°C above pre-industrial levels and related global greenhouse gas emission pathways, in the context of strengthening the global response to the threat of climate change, sustainable development, and efforts to eradicate poverty[Masson-Delmotte, V., P. Zhai, H.-O. Pörtner, D. Roberts, J. Skea, P.R. Shukla, A. Pirani, W. Moufouma-Okia, C. Péan, R. Pidcock, S. Connors, J.B.R. Matthews, Y. Chen, X. Zhou, M.I. Gomis, E. Lonnoy, T. Maycock, M. Tignor, and T. Waterfield (eds.)]. Cambridge University Press, Cambridge, UK and New York, USA, 616 pp.
IPCC, 2018b: Summary for Policymakers. In: Global Warming of 1.5°C: An IPCC special report on the impacts of global warming of 1.5°C above pre-industrial levels and related global greenhouse gas emission pathways, in the context of strengthening the global response to the threat of climate change, sustainable development, and efforts to eradicate poverty[Masson-Delmotte, V., P. Zhai, H.-O. Pörtner, D. Roberts, J. Skea, P.R. Shukla, A. Pirani, W. Moufouma-Okia, C. Péan, R. Pidcock, S. Connors, J.B.R. Matthews, Y. Chen, X. Zhou, M.I. Gomis, E. Lonnoy, T. Maycock, M. Tignor, and T. Waterfield (eds.)]. UK and New York, NY, USA, pp. 32.
IPCC, 2019: Climate Change and Land: An IPCC special report on climate change, desertification, land degradation, sustainable land management, food security, and greenhouse gas fluxes in terrestrial ecosystems[P.R. Shukla, J. Skea, E. Calvo Buendia, V. Masson-Delmotte, H.-O. Pörtner, D. C. Roberts, P. Zhai, R. Slade, S. Connors, R. van Diemen, M. Ferrat, E. Haughey, S. Luz, S. Neogi, M. Pathak, J. Petzold, J. Portugal Pereira, P. Vyas, E. Huntley, K. Kissick, M. Belkacemi, J. Malley, (eds.)]. Cambridge University Press, Cambridge, UK and New York, NY, USA.
IPoSP, 2018: Rethinking Society for the 21st Century. International Panel on Social Progress, Volume 1: Socio-Economic Transformations. Cambridge University Press, Cambridge, United Kingdom, 366 pp.
Irfany, M.I. and S. Klasen, 2017: Affluence and emission trade-offs: Evidence from Indonesian households’ carbon footprint. Environ. Dev. Econ. , 22(5) , 546–570, doi:10.1017/S1355770X17000262.
Jacobson, M.Z., 2002: Control of fossil-fuel particulate black carbon and organic matter, possibly the most effective method of slowing global warming. J. Geophys. Res. Atmos. , 107(19) , 16-1-16–22, doi:10.1029/2001JD001376.
Jacobson, M.Z., 2010: Short-term effects of controlling fossil-fuel soot, biofuel soot and gases, and methane on climate, Arctic ice, and air pollution health. J. Geophys. Res. Atmos. , 115(14) , doi:10.1029/2009JD013795.
Jacobson, M.Z., 2019: The health and climate impacts of carbon capture and direct air capture. Energy Environ. Sci. , 12(12) , 3567–3574, doi:10.1039/C9EE02709B.
Jacobson, M.Z. et al., 2017: 100% Clean and Renewable Wind, Water, and Sunlight All-Sector Energy Roadmaps for 139 Countries of the World. Joule, 1(1) , 108–121, doi:10.1016/j.joule.2017.07.005.
Jacobson, M.Z. et al., 2019: Impacts of Green New Deal Energy Plans on Grid Stability, Costs, Jobs, Health, and Climate in 143 Countries. One Earth, 1(4) , 449–463, doi:10.1016/j.oneear.2019.12.003.
Jakob, M., R. Soria, C. Trinidad, and O. Edenhofer, 2019: Green fiscal reform for a just energy transition in Latin America. Econ. Open-Access, Open- Assess. E-Journal, 13, 1–11, 10.5018/economics-ejournal.ja.2019-17.
Jakob, M. et al., 2014: Feasible mitigation actions in developing countries. Nat. Clim. Change, 4(11) , 961–968, doi:10.1038/nclimate2370.
Jakob, M. et al., 2016: Carbon Pricing Revenues Could Close Infrastructure Access Gaps. World Dev. , 84, 254–265, doi:10.1016/J.WORLDDEV.2016.03.001.
Jasanoff, S., 2018: Just transitions: A humble approach to global energy futures. Energy Res. Soc. Sci. , 35, 11–14, doi:10.1016/j.erss.2017.11.025.
Jayadev, G., B.D. Leibowicz, and E. Kutanoglu, 2020: US electricity infrastructure of the future: Generation and transmission pathways through 2050. Appl. Energy, 260 (November 2019), 114267, doi:10.1016/j.apenergy.2019.114267.
Jellinek, S. et al., 2019: Integrating diverse social and ecological motivations to achieve landscape restoration. J. Appl. Ecol. , 56(1) , 246–252, doi:10.1111/1365-2664.13248.
Jia, G., E. Shevliakova, P. Artaxo, N. De Noblet-Ducoudré, R. Houghton, J. House, K. Kitajima, C. Lennard, A. Popp, A. Sirin, R. Sukumar, and L. Verchot, 2019: Land–Climate Interactions. In: Climate Change and Land: An IPCC special report on climate change, desertification, land degradation, sustainable land management, food security, and greenhouse gas fluxes in terrestrial ecosystems[P.R. Shukla, J. Skea, E. Calvo Buendia, V. Masson-Delmotte, H.-O. Pörtner, D.C. Roberts, P. Zhai, R. Slade, S. Connors, R. van Diemen, M. Ferrat, E. Haughey, S. Luz, S. Neogi, M. Pathak, J. Petzold, J. Portugal Pereira, P. Vyas, E. Huntley, K. Kissick, M, Belkacemi, J. Malley, (eds.)]. Cambridge University Press, Cambridge, United Kingdom and New York, NY, USA, 131–247 pp.
Jiang, K., X. Zhuang, R. Miao, and C. He, 2013: China’s role in attaining the global 2°C target. Clim. Policy, 13(sup1) , 55–69, doi:10.1080/14693062.2012.746070.
Jiang, K., K. Tamura, and T. Hanaoka, 2017: Can we go beyond INDCs: Analysis of a future mitigation possibility in China, Japan, EU and the US. Adv. Clim. Chang. Res. , 8(2) , 117–122, doi:10.1016/j.accre.2017.05.005.
Jiang, K., C. He, H. Dai, J. Liu, and X. Xu, 2018: Emission scenario analysis for China under the global 1.5°C target. Carbon Manag. , 9(5) , 481–491, doi:10.1080/17583004.2018.1477835.
Jiang, K.J. et al., 2016: China’s low-carbon investment pathway under the 2°C scenario. Adv. Clim. Chang. Res. , 7(4) , 229–234, doi:10.1016/j.accre.2016.12.004.
Johl, A. and S. Duyck, 2012: Promoting Human Rights in the Future Climate Regime. Ethics, Policy Environ. , 15(3) , doi:10.1080/21550085.2012.730240.
Johnson, N. et al., 2015: Stranded on a low-carbon planet: Implications of climate policy for the phase-out of coal-based power plants. Technol. Forecast. Soc. Change, 90(PA) , 89–102, doi:10.1016/j.techfore.2014.02.028.
Jones, C. and D.M. Kammen, 2014: Spatial distribution of US household carbon footprints reveals suburbanization undermines greenhouse gas benefits of urban population density. Environ. Sci. Technol. , 48(2) , 895–902, doi:10.1021/es4034364.
Jones, L. et al., 2013: The political economy of local adaptation planning: Exploring barriers to Flexible and Forward-looking Decision Making in three districts in Ethiopia, Uganda and Mozambique. Overseas Development Institute, London, United Kingdom, 29 pp., https://www.preventionweb.net/ publication/political-economy-local-adaptation-planning-exploring-barriers-flexible-and-forward.
Jonsson, S., A. Ydstedt, and E. Asen, 2020: Looking Back on 30 Years of Carbon Taxes in Sweden. Fiscal Fact No. 727. Tax Foundation, Washington, DC, USA, 4 pp.
JRC, 2021: Global Energy and Climate Outlook 2021: Advancing towards climate neutrality. Joint Research Centre (European Commission), Brussels, Belgium, 130 pp.
Ju, Y. et al., 2021: Industrial decarbonization under Japan’s national mitigation scenarios: A multi-model analysis. Sustain. Sci. , 16(2) , 411–427, doi:10.1007/s11625-021-00905-2.
Kahane, A., 2012: Transformative scenario planning. In: The Collaboratory, Barrett-Koehler Publishers, Inc., San Francisco, USA, pp. 168.
Kairo, J.G., A.J. Hamza, and C. Wanjiru, 2018: Mikoko Pamoja. In: A Blue Carbon Primer[Windham-Myers, L., S. Crooks, and T.G. Troxler, (eds.)]. CRC Press, Boca Raton, FL, USA, pp. 341–350.
Kane, L. and M. Boulle, 2018: ‘This was different’: Transferring climate mitigation knowledge practices south to south with the MAPS programme. Clim. Policy, 8(9), 1177-1188, doi:10.1080/14693062.2017.1421520.
Karapin, R., 2016: Political Opportunities for Climate Policy. Cambridge University Press, Cambridge UK and New York, NY, USA, 344 pp.
Karlsson, M., E. Alfredsson, and N. Westling, 2020: Climate policy co-benefits: A review. Clim. Policy, 20(3) , 292–316, doi:10.1080/14693062.2020.1724070.
Karner, A. and R.A. Marcantonio, 2018: Achieving Transportation Equity: Meaningful Public Involvement to Meet the Needs of Underserved Communities. Public Work. Manag. Policy, 23(2) , 105–126, doi:10.1177/1087724X17738792.
Kartha, S. et al., 2018a: Cascading biases against poorer countries. Nat. Clim. Change, 8(5) , 348–349, doi.org/10.1038/s41558-018-0152-7.
Kartha, S., S. Caney, N.K. Dubash, and G. Muttitt, 2018b: Whose carbon is burnable? Equity considerations in the allocation of a ‘right to extract’. Clim. Change, 150, 117–129, doi:10.1007/s10584-018-2209-z.
Kato, E. and A. Kurosawa, 2019: Evaluation of Japanese energy system toward 2050 with TIMES-Japan – Deep decarbonization pathways. Energy Procedia, 158, 4141–4146, doi:10.1016/j.egypro.2019.01.818.
Kemp-Benedict, E., 2012: Telling better stories: Strengthening the story in story and simulation. Environ. Res. Lett. , 7(4) , 41004, doi:10.1088/1748-9326/7/4/041004.
Kemp-Benedict, E., C. Holz, T. Athanasiou, S. Kartha, and P. Baer, 2018: The Climate Equity Reference Calculator. Climate Equity Reference Project (EcoEquity and Stockholm Environment Institute), Berkeley and Somerville, California, USA.
Keramidas, K. et al., 2021: Global Energy and Climate Outlook 2020: A New Normal Beyond Covid-19. European Commission, Joint Research Centre, Sevilla, Spain, 76 pp., https://publications.jrc.ec.europa.eu/repository/bitstream/JRC123203/kjna30558enn_geco2020.pdf .
Kettner, C., D. Kletzan-Slamanig, A. Köppl, B. Littig, and I. Zielinska, 2019: A Cross-Country Comparison of Sustainable Energy Development in Selected EU Members. J. Sustain. Res. , 1(2) , doi:10.20900/jsr20190017.
Khanna, N. et al., 2019: Energy and CO2 implications of decarbonization strategies for China beyond efficiency: Modeling 2050 maximum renewable resources and accelerated electrification impacts. Appl. Energy, 242 (February 2019), 12–26, doi:10.1016/j.apenergy.2019.03.116.
Kharas, H. and J. McArthur, 2019: Building the SDG economy: Needs, spending, and financing for universal achievement of the Sustainable Development Goals. Global Economy & Development Working Paper 131, Brookings Institution, Washington, DC, USA , 38 pp., https://www.brookings.edu/research/building-the-sdg-economy-needs-spending-and-financing-for-universal-achievement-of-the-sustainable-development-goals/ (Accessed December 11, 2019).
Kharecha, P.A. and M. Sato, 2019: Implications of energy and CO2 emission changes in Japan and Germany after the Fukushima accident. Energy Policy, 132, 647–653, doi:10.1016/j.enpol.2019.05.057.
Khosla, R. and A. Bhardwaj, 2019: Urbanization in the time of climate change: Examining the response of Indian cities. Wiley Interdiscip. Rev. Clim. Change, 10(1) , e560, doi:10.1002/wcc.560.
Kikstra, J.S. et al., 2021: Climate mitigation scenarios with persistent COVID-19-related energy demand changes. Nat. Energy, doi:10.1038/s41560-021-00904-8.
Kissinger, G., A. Gupta, I. Mulder, and N. Unterstell, 2019: Climate financing needs in the land sector under the Paris Agreement: An assessment of developing country perspectives. Land Use Policy, 83, 256–269, doi:10.1016/j.landusepol.2019.02.007.
Kläy, A., A.B. Zimmermann, and F. Schneider, 2015: Rethinking science for sustainable development: Reflexive interaction for a paradigm transformation. Futures, 65, 72–85, doi:10.1016/J.FUTURES.2014.10.012.
Klein, M., 2015: Public-private partnerships: Promise and hype. (June), Policy Research Working Paper number 7340, The World Bank, Washington, DC,18 pp., doi:10.1596/1813-9450-7340.
Klinsky, S., 2017: An initial scoping of transitional justice for global climate governance. Clim. Policy, 18(6) , 1–14, doi:10.1080/14693062.2017.1377594.
Klinsky, S. and J. Brankovic, 2018: The global climate regime and transitional justice. Routledge, Oxon, UK and New York, USA, 196 pp.
Klinsky, S. and H. Winkler, 2018: Building equity in: strategies for integrating equity into modelling for a 1.5°C world. Philos. Trans. R. Soc. A. , 376(2119) , 20160461, doi:10.1098/rsta.2016.0461.
Klinsky, S. et al., 2017a: Why equity is fundamental in climate change policy research. Glob. Environ. Change, 44, 170–173, doi:10.1016/j.gloenvcha.2016.08.002.
Klinsky, S., D. Waskow, E. Northrop, and W. Bevins, 2017b: Operationalizing equity and supporting ambition: Identifying a more robust approach to ‘respective capabilities’. Clim. Dev. , 9(4) , 287–297, doi:http://dx.doi.org/10.1080/17565529.2016.1146121.
Köberle, A.C., P.R.R. Rochedo, A.F.P. Lucena, A. Szklo, and R. Schaeffer, 2020: Brazil’s emission trajectories in a well-below 2°C world: The role of disruptive technologies versus land-based mitigation in an already low-emission energy system. Clim. Change, 162(4) , 1823–1842, doi:10.1007/s10584-020-02856-6.
Kolsuz, G. and A.E. Yeldan, 2017: Economics of climate change and green employment: A general equilibrium investigation for Turkey. Renew. Sustain. Energy Rev. , 70, 1240–1250, doi:10.1016/j.rser.2016.12.025.
Kongsager, R., B. Locatelli, and F. Chazarin, 2016: Addressing Climate Change Mitigation and Adaptation Together: A Global Assessment of Agriculture and Forestry Projects. Environ. Manage. , 57(2) , 271–282, doi:10.1007/s00267-015-0605-y.
Kowarsch, M. et al., 2017: A road map for global environmental assessments. Nat. Clim. Change, 7, 379, doi:10.1038/nclimate3307.
Krakowski, V., E. Assoumou, V. Mazauric, and N. Maïzi, 2016: Feasible path toward 40–100% renewable energy shares for power supply in France by 2050: A prospective analysis. Appl. Energy, 171, 501–522, doi:10.1016/j.apenergy.2016.03.094.
Kriegler, E. et al., 2018: Short term policies to keep the door open for Paris climate goals. Environ. Res. Lett. , 13(7) , 074022, doi:10.1088/1748-9326/aac4f1.
Kroeger, K.D., S. Crooks, S. Moseman-Valtierra, and J. Tang, 2017: Restoring tides to reduce methane emissions in impounded wetlands: A new and potent Blue Carbon climate change intervention. Sci. Rep. , 7(1) , 1–12, doi:10.1038/s41598-017-12138-4.
Kuhlmann, S. and A. Rip, 2018: Next-Generation Innovation Policy and Grand Challenges. Sci. Public Policy, 45 (4) , 448–454, doi:10.1093/scipol/scy011.
Kuramochi, T., T. Wakiyama, and A. Kuriyama, 2017: Assessment of national greenhouse gas mitigation targets for 2030 through meta-analysis of bottom-up energy and emission scenarios: A case of Japan. Renew. Sustain. Energy Rev. , 77, 924–944, doi:10.1016/j.rser.2016.12.093.
Kuramochi, T. et al., 2018: Ten key short-term sectoral benchmarks to limit warming to 1.5°C. Clim. Policy, 18(3) , 287–305, doi:10.1080/14693062.2017.1397495.
Kuramochi, T. et al., 2020: Beyond national climate action: The impact of region, city, and business commitments on global greenhouse gas emissions. Clim. Policy, 20(3) , 275–291, doi:10.1080/14693062.2020.1740150.
Kuwae, T. and M. Hori, 2019: Blue Carbon in Shallow Coastal Ecosystems: Carbon Dynamics, Policy, and Implementation. Springer, Singapore.
Kwok, T.F., Y. Xu, X. Liu, and Y. Leung, 2018: The impacts of economic structure on China’s carbon dioxide emissions: An analysis with reference to other East Asian economies. Clim. Policy, 18(10) , 1235–1245, doi:10.1080/14693062.2017.1418282.
La Rovere, E.L., 2017: Low-carbon development pathways in Brazil and ‘Climate Clubs’. Wiley Interdiscip. Rev. Clim. Change, 8(1) , e439, doi:10.1002/wcc.439.
La Rovere, E.L. et al., 2014a: Economic and social implications: Brazilian GHG mitigation scenarios to 2030. Brazilian Forum on Climate Change – FBMC. COPPE/UFRJ, Rio de Janeiro, https://www.mapsprogramme.org/wp-content/uploads/Summary_for_Decision_Makers_IES-Brasil.pdf .
La Rovere, E.L., A.O. Pereira, C.B.S. Dubeux, and W. Wills, 2014b: Climate change mitigation actions in Brazil. Clim. Dev. , 6(sup1) , 25–33, doi:10.1080/17565529.2013.812952.
La Rovere, E.L., W. Wills, C. Grottera, C.B.S.S. Dubeux, and C. Gesteira, 2018: Economic and social implications of low-emission development pathways in Brazil. Carbon Manag. , 9(5) , 563–574, doi:10.1080/17583004.2018.1507413.
Lachapelle, E. and M. Paterson, 2013: Drivers of national climate policy. Clim. Policy, 13(5) , 547–571, doi:10.1080/14693062.2013.811333.
Lahn, B., 2018: In the light of equity and science: Scientific expertise and climate justice after Paris. Int. Environ. Agreements Polit. Law Econ. , 18(1) , 29–43, doi:10.1007/s10784-017-9375-8.
Lahn, B. and G. Sundqvist, 2017: Science as a ‘fixed point’? Quantification and boundary objects in international climate politics. Environ. Sci. Policy, 67 (supC) , 8–15, doi.org/10.1016/j.envsci.2016.11.001.
Lahn, G. and S. Bradley, 2016: Left Stranded? Extractives-Led Growth in a Carbon-Constrained World. R. Inst. Int. Aff . Royal Institute of International Affairs, London, United Kingdom, 38 pp., https://www.chathamhouse.org/ sites/default/files/publications/research/2016-06-17-left-stranded-extractives-bradley-lahn-final.pdf (Accessed November 1, 2021).
Lampin, L.B.A.A., F. Nadaud, F. Grazi, and J.-C. C. Hourcade, 2013: Long-term fuel demand: Not only a matter of fuel price. Energy Policy, 62, 780–787, doi:10.1016/j.enpol.2013.05.021.
Landa Rivera, G., F. Reynès, I. Islas Cortes, F.X. Bellocq, and F. Grazi, 2016: Towards a low-carbon growth in Mexico: Is a double dividend possible? A dynamic general equilibrium assessment. Energy Policy, 96, 314–327, doi:10.1016/j.enpol.2016.06.012.
Lantz, V. and Q. Feng, 2006: Assessing income, population, and technology impacts on CO2 emissions in Canada: Where’s the EKC?Ecol. Econ. , 57(2) , 229–238, doi:10.1016/j.ecolecon.2005.04.006.
Lap, T., R. Benders, F. van der Hilst, and A. Faaij, 2020: How does the interplay between resource availability, intersectoral competition and reliability affect a low-carbon power generation mix in Brazil for 2050?Energy, 195, doi:10.1016/j.energy.2020.116948.
Lapola, D.M. et al., 2018: Limiting the high impacts of Amazon forest dieback with no-regrets science and policy action. Proc. Natl. Acad. Sci. , 115(46) , 11671–11679, doi:10.1073/pnas.1721770115.
Lave, L.B., 1991: Formulating Greenhouse Policies in a Sea of Uncertainty. Energy J. , 12(1) , doi:10.5547/issn0195-6574-ej-vol12-no1-2.
Le Billon, P. and B. Kristoffersen, 2020: Just cuts for fossil fuels? Supply-side carbon constraints and energy transition. Environ. Plan. A, 52(6) , 1072–1092, doi:10.1177/0308518X18816702.
Le Quéré, C. et al., 2019: Drivers of declining CO2 emissions in 18 developed economies. Nat. Clim. Change, 9, 213–217, doi:10.1038/s41558-019-0419-7.
Le Quéré, C. et al., 2020: Temporary reduction in daily global CO2 emissions during the COVID-19 forced confinement. Nat. Clim. Change, 10(7) , 647–653, doi:10.1038/s41558-020-0797-x.
Leach, M. et al., 2018: Equity and sustainability in the anthropocene: A social-ecological systems perspective on their intertwined futures. Glob. Sustain. , 1 (e13) , 1–13, doi:10.1017/sus.2018.12.
Leal Filho, W. et al., 2018: Reinvigorating the sustainable development research agenda: The role of the sustainable development goals (SDG). Int. J. Sustain. Dev. World Ecol. , 25(2) , 131–142, doi:10.1080/13504509.2017.1342103.
Lecocq, F. and Z. Shalizi, 2014: The economics of targeted mitigation in infrastructure. Clim. Policy, 14(2) , 187–208, doi:10.1080/14693062.2014.861657.
Lecocq, F., A. Nadaï, and C. Cassen, 2022: Getting models and modellers to inform long-term mitigation strategies. Clim. Policy, , doi:10.1080/14693062.2021.2002250.
Lee, C.T. et al., 2018: Enabling low-carbon emissions for sustainable development in Asia and beyond. J. Clean. Prod. , 176, 726–735, doi:10.1016/j.jclepro.2017.12.110.
Lefèvre, J., W. Wills, and J.-C. Hourcade, 2018: Combining low-carbon economic development and oil exploration in Brazil? An energy–economy assessment. Clim. Policy, 18(10) , 1286–1295, doi:10.1080/14693062.2018.1431198.
Lenferna, G.A., 2018a: If You’re ‘Still In’ the Paris Climate Agreement, Then Show Us the Money. Ethics, Policy Environ. , 21(1) , 52–55, doi:10.1080/21550085.2018.1463626.
Lenferna, G.A., 2018b: Can we equitably manage the end of the fossil fuel era?Energy Res. Soc. Sci. , 35, 217–223, doi:10.1016/j.erss.2017.11.007.
Lengefeld, E., G. Metternicht, and P. Nedungadi, 2020: Behavior change and sustainability of ecological restoration projects. Restor. Ecol. , 28(4) , 724–729, doi:10.1111/rec.13159.
Lennon, M., 2017: Decolonizing energy: Black Lives Matter and technoscientific expertise amid solar transitions. Energy Res. Soc. Sci. , 30, 18–27, doi:10.1016/j.erss.2017.06.002.
Lenzi, D., W.F. Lamb, J. Hilaire, M. Kowarsch, and J.C. Minx, 2018: Don’t deploy negative emissions technologies without ethical analysis. Nature, 561(7723) , 303–305, doi:10.1038/d41586-018-06695-5.
Lepault, C. and F. Lecocq, 2021: Mapping forward-looking mitigation studies at country level. Environ. Res. Lett. , 16(8) , 083001, doi:10.1088/1748-9326/ac0ac8.
Levinson, A., 2019: Energy Efficiency Standards Are More Regressive Than Energy Taxes: Theory and Evidence. J. Assoc. Environ. Resour. Econ. , 6(S1) , S7–S36, doi:10.1086/701186.
Li, J., M. Hamdi-Cherif, and C. Cassen, 2017: Aligning domestic policies with international coordination in a post-Paris global climate regime: A case for China. Technol. Forecast. Soc. Change, 125, 258–274, doi:10.1016/J.TECHFORE.2017.06.027.
Lin, B. and H. Liu, 2015: CO2 emissions of China’s commercial and residential buildings: Evidence and reduction policy. Build. Environ. , 92, 418–431, doi:10.1016/j.buildenv.2015.05.020.
Lipper, L. et al., 2014: Climate-smart agriculture for food security. Nat. Clim. Change, 4(12) , 1068–1072, doi:10.1038/nclimate2437.
Liu, J. et al., 2018: Nexus approaches to global sustainable development. Nat. Sustain. , 1(9) , 466–476, doi:10.1038/s41893-018-0135-8.
Locatelli, B., V. Evans, A. Wardell, A. Andrade, and R. Vignola, 2011: Forests and climate change in Latin America: Linking adaptation and mitigation. Forests, 2(1) , 431–450, doi:10.3390/f2010431.
Locatelli, B., G. Fedele, V. Fayolle, and A. Baglee, 2016: Synergies between adaptation and mitigation in climate change finance. Int. J. Clim. Chang. Strateg. Manag. , 8(1) , 112–128, doi:10.1108/IJCCSM-07-2014-0088.
Lofgren, H., M. Cicowiez, and C. Diaz-Bonilla, 2013: MAMS – A Computable General Equilibrium Model for Developing Country Strategy Analysis. Handb. Comput. Gen. Equilib. Model. , 1, 159–276, doi:10.1016/B978-0-444-59568-3.00004-3.
Louis, J.N., S. Allard, F. Kotrotsou, and V. Debusschere, 2020: A multi-objective approach to the prospective development of the European power system by 2050. Energy, 191, doi:10.1016/j.energy.2019.116539.
Lovejoy, T.E. and C. Nobre, 2018: Amazon Tipping Point. Sci. Adv. , 4(2) , eaat2340, doi:10.1126/sciadv.aat2340.
Low-Carbon Asia Research Project, 2012: Ten Actions toward Low Carbon Asia. http://2050.nies.go.jp (Accessed December 18, 2019).
Lucena, A.F.P. et al., 2016: Climate policy scenarios in Brazil: A multi-model comparison for energy. Energy Econ. , 56, 564–574, doi.org/10.1016/j.eneco.2015.02.005.
Luderer, G. et al., 2016: Deep Decarbonization Towards 1.5°C–2°C Stabilization Policy findings from the ADVANCE project (first edition). Postdam Institute for Climate Impact Research (PIK), Potsdam, Germany, 44 pp., http://www.fp7-advance.eu/sites/default/files/documents/WP7/ADV ANCE-Synthesis-Report.pdf .
Luderer, G. et al., 2018a: Residual fossil CO2 emissions in 1.5-2°C pathways. Nat. Clim. Change, 8(7) , 626-633, doi:10.1038/s41558-018-0198-6.
Luderer, G. et al., 2018b: Residual fossil CO2 emissions in 1.5–2 °C pathways. Nat. Clim. Change, 8(7) , 626–633, doi:10.1038/s41558-018-0198-6.
Lui, S. et al., 2021: Correcting course: The emission reduction potential of international cooperative initiatives. Clim. Policy, 21(2) , 232–250, doi:10.1080/14693062.2020.1806021.
Lund, H. and B.V. Mathiesen, 2009: Energy system analysis of 100% renewable energy systems – The case of Denmark in years 2030 and 2050. Energy, 34(5) , 524–531, doi:10.1016/j.energy.2008.04.003.
Mace, M.J., C.L. Fyson, M. Schaeffer, and W.L. Hare, 2021: Large‐Scale Carbon Dioxide Removal to Meet the 1.5°C Limit: Key Governance Gaps, Challenges and Priority Responses. Glob. Policy, 12(S1) , 67–81, doi:10.1111/1758-5899.12921.
Maestre-Andrés, S., S. Drews, and J. van den Bergh, 2019: Perceived fairness and public acceptability of carbon pricing: A review of the literature. Clim. Policy, 19(9) , 1186–1204, doi:10.1080/14693062.2019.1639490.
Malliet, P., F. Reynès, G. Landa, M. Hamdi-Cherif, and A. Saussay, 2020: Assessing Short-Term and Long-Term Economic and Environmental Effects of the COVID-19 Crisis in France. Environ. Resour. Econ. , 76 (4) , 867–883, doi:10.1007/s10640-020-00488-z.
Mandley, S.J., V. Daioglou, H.M. Junginger, D.P. van Vuuren, and B. Wicke, 2020: EU bioenergy development to 2050. Renew. Sustain. Energy Rev. , 127, 109858, doi:10.1016/J.RSER.2020.109858.
Mansell, P., S.P. Philbin, T. Broyd, and I. Nicholson, 2019: Assessing the impact of infrastructure projects on global sustainable development goals. Proc. Inst. Civ. Eng. Eng. Sustain. , 173(4) , 196–212, doi:10.1680/jensu.19.00044.
Markard, J., R. Raven, and B. Truffer, 2012: Sustainability transitions: An emerging field of research and its prospects. Res. Policy, 41(6) , 955–967, doi:10.1016/j.respol.2012.02.013.
Maroun, C. and R. Schaeffer, 2012: Emulating new policy goals into past successes: Greenhouse gas emissions mitigation as a side effect of biofuels programmes in Brazil. Clim. Dev. , 4(3) , 187–198, doi:10.1080/17565529.2012.668849.
Massetti, E., 2012: Short-term and long-term climate mitigation policy in Italy. Wiley Interdiscip. Rev. Clim. Change, 3(2) , 171–183, doi:10.1002/wcc.159.
Mata, É. et al., 2020: A map of roadmaps for zero and low energy and carbon buildings worldwide. Environ. Res. Lett. , 15(11) , 113003, doi:10.1088/1748-9326/abb69f.
Mathiesen, B.V., H. Lund, and K. Karlsson, 2011: 100% Renewable energy systems, climate mitigation and economic growth. Appl. Energy, 88(2) , 488–501, doi:10.1016/j.apenergy.2010.03.001.
Mathur, R. and S. Shekhar, 2020: India’s energy sector choices – options and implications of ambitious mitigation efforts. Clim. Change, 162(4) , 1893–1911, doi:10.1007/s10584-020-02885-1.
Matsuoka, Y., M. Kainuma, J. Fujino, and T. Ehara, 2013: How to Approach Asian Low-Carbon Societies?Glob. Environ. Res. , 17, 3–10.
Mattioli, G., C. Roberts, J.K. Steinberger, and A. Brown, 2020: The political economy of car dependence: A systems of provision approach. Energy Res. Soc. Sci. , 66, 101486, doi:10.1016/j.erss.2020.101486.
Mawdsley, E., 2018: ‘From billions to trillions’: Financing the SDGs in a world ‘beyond aid’. Dialogues Hum. Geogr. , 8(2) , 191–195, doi:10.1177/2043820618780789.
Mazur, A. and E. Rosa, 1974: Energy and Life-Style: Massive energy consumption may not be necessary to maintain current living standards in America. Science, 186(4164) , 607–610, doi:10.1126/science.186.4164.607.
Mazzucato, M. and G. Semieniuk, 2017: Public financing of innovation: New questions. Oxford Rev. Econ. Policy, 33(1) , 24–48, doi:10.1093/oxrep/grw036.
Mbeva, K.L. and W.P. Pauw, 2016: Self-Differentiation of Countries’ Responsibilities Addressing Climate Change through Intended Nationally Determined Contributions. Deutsches Institut für Entwicklungspolitik gGmbH, Bonn, Germany, 51 pp.
McCollum, D.L. et al., 2018: Energy investment needs for fulfilling the Paris Agreement and achieving the Sustainable Development Goals. Nat. Energy, 3(7) , 589–599, doi:10.1038/s41560-018-0179-z.
McDowall, W. et al., 2017: Circular Economy Policies in China and Europe. J. Ind. Ecol. , 21(3) , 651–661, doi:10.1111/jiec.12597.
McLeod, E. et al., 2011: A blueprint for blue carbon: Toward an improved understanding of the role of vegetated coastal habitats in sequestering CO2. Front. Ecol. Environ. , 9(10) , 552–560, doi:10.1890/110004.
McNeil, M.A. et al., 2016: Energy efficiency outlook in China’s urban buildings sector through 2030. Energy Policy, 97, 532–539, doi:10.1016/j.enpol.2016.07.033.
Meelen, T., B. Truffer, and T. Schwanen, 2019: Virtual user communities contributing to upscaling innovations in transitions: The case of electric vehicles. Environ. Innov. Soc. Transitions, 31, 96–109, doi:10.1016/j.eist.2019.01.002.
Meheus, F. and D. McIntyre, 2017: Fiscal space for domestic funding of health and other social services. Heal. Econ. Policy Law, 12(2) , 159–177, doi:10.1017/S1744133116000438.
Meinshausen, M., J. Guetschow, J. Lewis, and Z. Nicholls, 2021: NDC factsheets, doi:10.5281/zenodo.5710394.
Méjean, A., F. Lecocq, and Y. Mulugetta, 2015: Equity, burden sharing and development pathways: Reframing international climate negotiations. Int. Environ. Agreements Polit. Law Econ. , 15(4) , 387–402, doi:10.1007/s10784-015-9302-9.
Mendoza, M.N., 2014: Lessons Learned: Fossil Fuel Subsidies and Energy Sector Reform in the Philippines GSI REPORT. International Institute for Sustainable Development, Winnipeg, Manitoba, Canada, www.iisd.org/gsi (Accessed December 15, 2020).
Messner, D., 2015: A social contract for low carbon and sustainable development: Reflections on non-linear dynamics of social realignments and technological innovations in transformation processes. Technol. Forecast. Soc. Change, 98, 260–270, doi:10.1016/J.TECHFORE.2015.05.013.
Michaelowa, A., M. Allen, and F. Sha, 2018: Policy instruments for limiting global temperature rise to 1.5°C – can humanity rise to the challenge?Clim. Policy, 18(3) , 275–286, doi:10.1080/14693062.2018.1426977.
Michaelowa, K. and A. Michaelowa, 2017: Transnational Climate Governance Initiatives: Designed for Effective Climate Change Mitigation?Int. Interact. , 43(1) , 129–155, doi:10.1080/03050629.2017.1256110.
Mijn Cha, J., M. Wander, and M. Pastor, 2020: Environmental Justice, Just Transition, and a Low-Carbon Future for California. Environ. Law Report. , 50, 10216.
Mikova, N., W. Eichhammer, and B. Pfluger, 2019: Low-carbon energy scenarios 2050 in north-west European countries: Towards a more harmonised approach to achieve the EU targets. Energy Policy, 130 (February), 448–460, doi:10.1016/j.enpol.2019.03.047.
Miller, C.A. and J. Richter, 2014: Social Planning for Energy Transitions. Curr. Sustain. Energy Reports, 1(3) , 77–84, doi:10.1007/s40518-014-0010-9.
Millot, A., A. Krook-Riekkola, and N. Maïzi, 2020: Guiding the future energy transition to net-zero emissions: Lessons from exploring the differences between France and Sweden. Energy Policy, 139 (July 2019), 111358, doi:10.1016/j.enpol.2020.111358.
Millward-Hopkins, J., J.K. Steinberger, N.D. Rao, and Y. Oswald, 2020: Providing decent living with minimum energy: A global scenario. Glob. Environ. Change, 65, 102168, doi:10.1016/j.gloenvcha.2020.102168.
Ministry of Business Innovation & Employment New Zealand, 2019: Just Transition. Government of New Zealand, Wellington, New Zealand, https://www.mbie.govt.nz/business-and-employment/economic-development/just-transition/ (Accessed January 8, 2020).
Ministry of Employment and Labour Relations of Ghana, 2018: Ghana National Dialogue on Decent Work. Accra, Ghana, https://www.un-page.org/ghana-holds-national-dialogue-decent-work-and-%E2%80%98just-transition%E2%80%99-green-economy (Accessed January 8, 2020).
Minx, J.C. et al., 2021: A comprehensive and synthetic dataset for global, regional, and national greenhouse gas emissions by sector 1970–2018 with an extension to 2019. Earth Syst. Sci. Data, 13, 5213–5252, doi:10.5194/essd-13-5213-2021.
Mirzoev, Tokhir N., Ling Zhu, Yang Yang, Tian Zhang, Erik Roos, Andrea Pescatori, A.M., 2020: Future of Oil and Fiscal Sustainability in the GCC Region. International Monetary Fund, Washington, DC, USA, 45 pp.,https://www.imf.org/-/media/Files/Publications/DP/2020/English/FOFSGCCEA.ashx (Accessed November 1, 2021).
Mittal, S., J.Y. Liu, S. Fujimori, and P.R. Shukla, 2018: An assessment of near-to-mid-term economic impacts and energy transitions under ‘2°C’ and ‘1.5°C’ scenarios for India. Energies, 11(9) , doi:10.3390/en11092213.
MoEF, 2008: India’s National Action Plan on Climate Change (NAPCC). Prime Minister’s Council On Climate Change, Ministry of Environment and Forests (MOEF), Government of India, New Delhi. 56 pp., https://moef.gov.in/wp-content/uploads/2018/04/Pg01-52_2.pdf (Accessed October 26, 2021).
MoEFCC, 2018: Annual Report 2018-19. Ministry of Environment, Forest and Climate Change (MOEFCC), Government of India . https://moef.gov.in/wp-content/uploads/2019/08/Annual-Report-2018-19-English.pdf (Accessed October 26, 2021).
MoEFCC, 2021: Annual Report 2020-21. Ministry of Environment, Forest and Climate Change, Government of India. https://moef.gov.in/wp-content/uploads/2017/06/Environment-AR-English-2020-21.pdf (Accessed October 26, 2021).
Moellendorf, D., 2020: Responsibility for Increasing Mitigation Ambition in Light of the Right to Sustainable Development. Fudan J. Humanit. Soc. Sci. , 13(2) , 181–192, doi:10.1007/s40647-020-00277-4.
Mogomotsi, P.K., G.E.J. Mogomotsi, and W.L. Hambira, 2018: Paris agreement on climate change and Botswana’s Vision 2036: An examination of linkages. Chinese J. Popul. Resour. Environ. , 16(1) , 59–66, doi:10.1080/10042857.2018.1438000.
Mohai, P., D. Pellow, and J.T. Roberts, 2009: Environmental Justice. Annu. Rev. Environ. Resour. , 34(1) , 405–430, doi:10.1146/annurev-environ-082508-094348.
Mohan, A., O. Geden, M. Fridahl, H.J. Buck, and G.P. Peters, 2021: UNFCCC must confront the political economy of net-negative emissions. One Earth, 4(10) , 1348–1351, doi:10.1016/j.oneear.2021.10.001.
Moomaw, W.R., J.R. Moreira, K. Blok, D.L. Greene, K. Gregory, T. Jaszay, T. Kashiwagi, M. Levine, M. McFarland, N. Siva Prasad, L. Price, H.-H. Rogner, R. Sims, F. Zhou, P. Zhou, 2001: Technological and Economic Potential of Greenhouse Gas Emissions Reduction. In: Contribution of Working Group III to the Third Assessment Report of the Intergovernmental Panel on Climate Change – Mitigation. Cambridge University Press, Cambridge, UK and New York, NY, USA, pp. 167–300. https://www.ipcc.ch/site/assets/uploads/2018/03/3.pdf (Accessed July 12, 2019).
Morris, J., V. Srikrishnan, M. Webster, and J. Reilly, 2018: Hedging Strategies: Electricity Investment Decisions under Policy Uncertainty. Energy J. , 39(1) , 101-122, doi:10.5547/01956574.39.1.jmor.
Mu, Y., S. Evans, C. Wang, and W. Cai, 2018a: How will sectoral coverage affect the efficiency of an emissions trading system? A CGE-based case study of China. Appl. Energy, 227, 403–414, doi:10.1016/j.apenergy.2017.08.072.
Mu, Y., C. Wang, and W. Cai, 2018b: The economic impact of China’s INDC: Distinguishing the roles of the renewable energy quota and the carbon market. Renew. Sustain. Energy Rev. , 81, 2955–2966, doi:10.1016/j.rser.2017.06.105.
Munasinghe, M., 2001: Development, equity and sustainability (DES) in the context of climate change. In: Cross-cutting issues guidance papers: IPCC supporting material for the Third Assessment Report [Pachauri, R.K., T. Taniguchi, and K. Tanaka, (eds.)]. Intergovernmental Panel on Climate Change (IPCC), Geneva, Switzerland, 69–119 pp.
Munasinghe, M., 2007: Making development more sustainable: Sustainomics framework and practical applications. MIND Press, Colombo, Sri Lanka, 657 pp.
Mundaca, L., M. Mansoz, L. Neij, and G. Timilsina, 2013: Transaction costs analysis of low-carbon technologies. Clim. Policy, 13(4) , 490–513, doi:10.1080/14693062.2013.781452.
Mundaca, L., J. Sonnenschein, L. Steg, N. Höhne, and D. Ürge-Vorsatz, 2019: The global expansion of climate mitigation policy interventions, the Talanoa Dialogue and the role of behavioural insights. Environ. Res. Commun. , 1(6) , 061001, doi:10.1088/2515-7620/ab26d6.
Muttitt, G. and S. Kartha, 2020: Equity, climate justice and fossil fuel extraction: Principles for a managed phase out. Clim. Policy, 20(8) , 1024–1042, doi:10.1080/14693062.2020.1763900.
Naidoo, C.P., 2020: Relating financial systems to sustainability transitions: Challenges, demands and design features. Environ. Innov. Soc. Transitions, 36, 270–290, doi:10.1016/j.eist.2019.10.004.
Nair, S. and M. Howlett, 2017: Policy myopia as a source of policy failure: Adaptation and policy learning under deep uncertainty. Policy Polit. , 45(1) , 103–118, doi:10.1332/030557316X14788776017743.
Nascimento, L. et al., 2021: Greenhouse gas mitigation scenarios for major emitting countries – Analysis of current climate policies and mitigation commitments: 2021 update. NewClimate Institute, PBL Netherlands Environmental Assessment Agency, and International Institute for Applied Systems Analysis, 132 pp., https://newclimate.org/wp-content/uploads/2021/10/NewClimate_EC-PBL_CurrentPolicies_Report_Oct21.pdf .
NDC Partnership, 2017: PARTNERSHIP IN ACTION – ONE YEAR ON.http://www4.unfccc.int/ndcregistry/Pages/Home.aspx (Accessed July 12, 2019).
Nemet, G.F., M. Jakob, J.C. Steckel, and O. Edenhofer, 2017: Addressing policy credibility problems for low-carbon investment. Glob. Environ. Change, 42, 47–57, doi:10.1016/j.gloenvcha.2016.12.004.
Nepal, 2020: The Fifteenth Plan (Fiscal Year 2019/20 2023/24). Government of Nepal, National Planning Commission, Kathmandu, Nepal, 731 pp., https://npc.gov.np/images/category/15th_plan_English_Version.pdf .
New, M., D. Reckien, D. Viner, C. Adler, S.-M. Cheong, C. Conde, A. Constable, E. Coughlan de Perez, A. Lammel, R. Mechler, B. Orlove, and W. Solecki, 2022: Decision Making Options for Managing Risk. In: Climate Change 2022: Impacts, Adaptation, and Vulnerability. Contribution of Working Group II to the Sixth Assessment Report of the Intergovernmental Panel on Climate Change[H.-O. Pörtner, D.C. Roberts, M. Tignor, E.S. Poloczanska, K. Mintenbeck, A. Alegría, M. Craig, S. Langsdorf, S. Löschke, V. Möller, A. Okem, B. Rama (eds.)]. Cambridge University Press. In Press.
NewClimate Institute, Data-Driven Lab, PBL, German Development Institute/Deutsches Institut für Entwicklungspolitik (DIE), Blavatnik School of Government, University of Oxford, 2019: Global climate action from cities, regions and businesses: Impact of individual actors and cooperative initiatives on global and national emissions. [Kuramochi, T., et al. eds.)]. 2019 ed. NewClimate Institute and Data-Driven EnviroLab, Cologne, Germany, PBL, G.D. Institute, and Blavanik School of Government, University of Oxford, UK, 93pp.
Newell, P. and D. Mulvaney, 2013: The political economy of the ‘just transition’. Geogr. J. , 179(2) , 132–140, doi:10.1111/geoj.12008.
Newell, P. and A. Simms, 2020: Towards a fossil fuel non-proliferation treaty. Clim. Policy, 20(8) , 1043–1054, doi:10.1080/14693062.2019.1636759.
Ng, S., N. Mabey, and J. Gaventa, 2016: Pulling ahead on clean technology: China’s 13th five year plan challenges Europe’s low-carbon competitiveness. E3G Briefing Paper, E3G, London, United Kingdom, 12 pp.
Nguyen, K.H., and M. Kakinaka, 2019: Renewable energy consumption, carbon emissions, and development stages: Some evidence from panel cointegration analysis. Renew. Energy, 132, 1049–1057, doi:10.1016/j.renene.2018.08.069.
Nicholls, Z.R.J. et al., 2020: Reduced Complexity Model Intercomparison Project Phase 1: Introduction and evaluation of global-mean temperature response. Geosci. Model Dev. , 13(11) , 5175–5190, doi:10.5194/gmd-13-5175-2020.
Nieves, J.A., A.J. Aristizábal, I. Dyner, O. Báez, and D.H. Ospina, 2019: Energy demand and greenhouse gas emissions analysis in Colombia: A LEAP model application. Energy, 169, 380–397, doi:10.1016/j.energy.2018.12.051.
Nilsson, L.J. et al., 2021: An industrial policy framework for transforming energy and emissions intensive industries towards zero emissions. Clim. Policy, 21(8) , 1053–1065, doi:10.1080/14693062.2021.1957665.
Nilsson, M., D. Griggs, and M. Visbeck, 2016: Policy: Map the interactions between Sustainable Development Goals. Nature, 534(7607) , 320–322, doi:10.1038/534320a.
Nisbet, E.G. et al., 2020: Methane Mitigation: Methods to Reduce Emissions, on the Path to the Paris Agreement. Rev. Geophys. , 58 (1) , doi:10.1029/2019RG000675.
Nobre, C.A., 2019: To save Brazil’s rainforest, boost its science. Nature, 574(7779) , 455–455, doi:10.1038/d41586-019-03169-0.
Nogueira de Oliveira, L.P. et al., 2016: Critical technologies for sustainable energy development in Brazil: Technological foresight based on scenario modelling. J. Clean. Prod. , 130, 12–24, doi:10.1016/j.jclepro.2016.03.010.
Nong, D., 2018: General equilibrium economy-wide impacts of the increased energy taxes in Vietnam. Energy Policy, 123, 471–481, doi:10.1016/J.ENPOL.2018.09.023.
Nong, D., S. Meng, and M. Siriwardana, 2017: An assessment of a proposed ETS in Australia by using the MONASH-Green model. Energy Policy, 108, 281–291, doi:10.1016/J.ENPOL.2017.06.004.
NPC, 2011: Our future - make it work: National development plan 2030. National Planning Commission, The Presidency, Pretoria, South Africa, 484 pp., https://www.gov.za/sites/default/files/gcis_document/201409/ndp-2030-our-future-make-it-workr.pdf (Accessed 23 August 2012).
NPC (National Planning Commission), 2019: Draft Proposal - Version Two 2050 Vision and Pathways for a Just Transition to a low carbon, climate resilient economy and society. Pretoria, South Africa, 35 pp.
Nunes, F.S.M., B.S. Soares-Filho, R. Rajão, and F. Merry, 2017: Enabling large-scale forest restoration in Minas Gerais state, Brazil. Environ. Res. Lett. , 12(4) , 44022, doi:10.1088/1748-9326/aa6658.
NYDF Assessment Partners, 2020: Balancing forests and development: Addressing infrastructure and extractive industries, promoting sustainable livelihoods. Internationale Klimaschutzinitiative (IKI), Climate Focus, Amsterdam, The Netherlands, 109 pp., https://forestdeclaration.org/wp-content/uploads/2021/10/2020NYDFReport.pdf (Accessed October 18, 2021).
Nyong, A., F. Adesina, and B. Osman Elasha, 2007: The value of indigenous knowledge in climate change mitigation and adaptation strategies in the African Sahel. Mitig. Adapt. Strateg. Glob. Change, 12 (5) , 787–797, doi:10.1007/s11027-007-9099-0.
O’Neill, B., M. van Aalst, Z. Zaiton Ibrahim, L. Berrang Ford, S. Bhadwal, H. Buhaug, D. Diaz, K. Frieler, M. Garschagen, A. Magnan, G. Midgley, A. Mirzabaev, A. Thomas, and R. Warren, 2022: Key Risks Across Sectors and Regions Supplementary Material. In: Climate Change 2022: Impacts, Adaptation, and Vulnerability. Contribution of Working Group II to the Sixth Assessment Report of the Intergovernmental Panel on Climate Change[H.-O. Pörtner, D.C. Roberts, M. Tignor, E.S. Poloczanska, K. Mintenbeck, A. Alegría, M. Craig, S. Langsdorf, S. Löschke, V. Möller, A. Okem, B. Rama (eds.)]. Available fromhttps://www.ipcc.ch/report/ar6/wg2/.
O’Neill, B.C. et al., 2014: A new scenario framework for climate change research: The concept of shared socio-economic pathways. Clim. Change, 122(3) , 387–400, doi:10.1007/s10584-013-0905-2.
O’Neill, B.C. et al., 2017: The roads ahead: Narratives for shared socio-economic pathways describing world futures in the 21st century. Glob. Environ. Change, 42, 169–180, doi:10.1016/j.gloenvcha.2015.01.004.
Obergassel, W., L. Hermwille, and S. Oberthür, 2021: Harnessing international climate governance to drive a sustainable recovery from the COVID-19 pandemic. Clim. Policy, 21(10), 1298-1306, doi:10.1080/14693062.2020.1835603.
Ocasio-Cortez, A., 2019: Resolution Recognizing the duty of the Federal Government to create a Green New Deal. H.Res.109. House Resolution (H.Res.)109. 116th Congress, 1st Session, Washington, DC, https://www.congress.gov/bill/116th-congress/house-resolution/109/text (Accessed November 1, 2021).
OECD, 2017a: Employment Implications of Green Growth: Linking jobs, growth, and green policies OECD REPORT FOR THE G7 ENVIRONMENT MINISTERS. Organisation for Economic Co-operation and Development (OECD), Paris, France, 22 pp., www.oecd.org/greengrowth (Accessed December 11, 2019).
OECD, 2017b: Investing in Climate, Investing in Growth. Organisation for Economic Co-operation and Development (OECD), Paris, France, 309 pp., https://www.oecd.org/env/investing-in-climate-investing-in-growth-9789264273528-en.htm.
Oei, P.-Y., T. Burandt, K. Hainsch, K. Löffler, and C. Kemfert, 2020: Lessons from Modeling 100% Renewable Scenarios Using GENeSYS-MOD. Econ. Energy Environ. Policy, 9(1) , 103–120, doi:10.5547/2160-5890.9.1.POEI.
Oshiro, K., M. Kainuma, and T. Masui, 2017a: Implications of Japan’s 2030 target for long-term low emission pathways. Energy Policy, 110, 581–587, doi:10.1016/j.enpol.2017.09.003.
Oshiro, K., T. Masui, and M. Kainuma, 2017b: Quantitative analysis of Japan’s 2030 target based on AIM/CGE and AIM/enduse. In: Post-2020 Climate Action: Global and Asian Perspectives[Fujimori, S., M. Kainuma, T. Masui (eds.)]. Springer Singapore, Mizuho Information and Research Institute, Inc., Tokyo, Japan, pp. 143–156.
Oshiro, K., T. Masui, and M. Kainuma, 2018: Transformation of Japan’s energy system to attain net-zero emission by 2050. Carbon Manag. , 9(5) , 493–501, doi:10.1080/17583004.2017.1396842.
Ostrom, E., 2010: Beyond Markets and States: Polycentric Governance of Complex Economic Systems. Am. Econ. Rev. , 100(3) , 641–672, doi:10.1257/AER.100.3.641.
Ouedraogo, N.S., 2017: Africa energy future: Alternative scenarios and their implications for sustainable development strategies. Energy Policy, 106, 457–471, doi:10.1016/j.enpol.2017.03.021.
Ouyang, Z. et al., 2016: Improvements in ecosystem services from investments in natural capital. Science, 352(6292) , 1455–1459, doi:10.1126/science.aaf2295.
Oyewo, A.S., A. Aghahosseini, M. Ram, A. Lohrmann, and C. Breyer, 2019: Pathway towards achieving 100% renewable electricity by 2050 for South Africa. Sol. Energy, 191 (June), 549–565, doi:10.1016/j.solener.2019.09.039.
Oyewo, A.S., A. Aghahosseini, M. Ram, and C. Breyer, 2020: Transition towards decarbonised power systems and its socio-economic impacts in West Africa. Renew. Energy, 154, 1092–1112, doi:10.1016/j.renene.2020.03.085.
Paladugula, A.L. et al., 2018: A multi-model assessment of energy and emissions for India’s transportation sector through 2050. Energy Policy, 116, 10–18, doi:10.1016/j.enpol.2018.01.037.
Pan, X., M. den Elzen, N. Höhne, F. Teng, and L. Wang, 2017: Exploring fair and ambitious mitigation contributions under the Paris Agreement goals. Environ. Sci. Policy, 74, 49–56, doi:10.1016/j.envsci.2017.04.020.
Pandza, K. and P. Ellwood, 2013: Strategic and ethical foundations for responsible innovation. Res. Policy, 42(5) , 1112–1125, doi:10.1016/J.RESPOL.2013.02.007.
Parikh, K.S., J.K. Parikh, and P.P. Ghosh, 2018: Can India grow and live within a 1.5 degree CO2 emissions budget?Energy Policy, 120, 24–37, doi:10.1016/j.enpol.2018.05.014.
Patrizio, P. et al., 2018: Reducing US Coal Emissions Can Boost Employment. Joule, 2(12) , 2633–2648, doi:10.1016/J.JOULE.2018.10.004.
Pauw, W.P. et al., 2018: Beyond headline mitigation numbers: We need more transparent and comparable NDCs to achieve the Paris Agreement on climate change. Clim. Change, 147(1–2) , 23–29, doi:10.1007/s10584-017-2122-x.
Pauw, W.P., P. Castro, J. Pickering, and S. Bhasin, 2020: Conditional nationally determined contributions in the Paris Agreement: foothold for equity or Achilles heel?Clim. Policy, 20(4) , 468–484, doi:10.1080/14693062.2019.1635874.
Pearson, A.R. et al., 2017: Race, Class, Gender and Climate Change Communication. In: Oxford Research Encyclopedia of Climate Science, Oxford University Press.
Pedde, S. et al., 2019: Archetyping shared socio-economic pathways across scales: An application to central Asia and European case studies. Ecol. Soc. , 24(4) , doi:10.5751/ES-11241-240430.
Pelling, M.A and M. Garschagen, 2019: Put equity first in climate adaptation: Focusing on the bottom few percent, not averages, is the best way to tackle poverty. Nature, 569, 327–329, doi: 10.1038/d41586-019-01497-9.
Pereira, A.M., R.M. Pereira, and P.G. Rodrigues, 2016: A new carbon tax in Portugal: A missed opportunity to achieve the triple dividend?Energy Policy, 93, 110–118, doi:10.1016/j.enpol.2016.03.002.
Perrier, Q. and P. Quirion, 2018: How shifting investment towards low-carbon sectors impacts employment: Three determinants under scrutiny. Energy Econ. , 75, 464–483, doi:10.1016/J.ENECO.2018.08.023.
Peters, G.P. and O. Geden, 2017: Catalysing a political shift from low to negative carbon. Nat. Clim. Change, 7(9) , 619–621, doi:10.1038/nclimate3369.
Peters, G.P., R.M. Andrew, S. Solomon, and P. Friedlingstein, 2015: Measuring a fair and ambitious climate agreement using cumulative emissions. Environ. Res. Lett. , 10(10) , 105004, doi:10.1088/1748-9326/10/10/105004.
Peters, G.P. et al., 2017: Key indicators to track current progress and future ambition of the Paris Agreement. Nat. Clim. Change, 7, 118–122, doi:10.1038/NCLIMATE3202.
Pettifor, A., 2020: The Case for the Green New Deal. Verso, London, UK, New York, NY, USA, 208 pp.
Pezzoni, M., R. Veugelers, and F. Visentin, 2019: How fast is this novel technology going to be a hit?C.E.P.R. Discussion Papers, Centre for Economic Policy Research, London, United Kingdom, https://ideas.repec.org/p/cpr/ceprdp/13447.html (Accessed December 22, 2020).
Pfeiffer, A., C. Hepburn, A. Vogt-Schilb, and B. Caldecott, 2018: Committed emissions from existing and planned power plants and asset stranding required to meet the Paris Agreement. Environ. Res. Lett. , 13(5) , 054019, doi:10.1088/1748-9326/aabc5f.
Piggot, G., M. Boyland, A. Down, and A.R. Torre, 2019: Realizing a just and equitable transition away from fossil fuels. Stockholm Environment Institute (SEI), Seattle, USA, 12 pp., https://www.sei.org/publications/just-and-equitable-transition-fossil-fuels/ (Accessed January 8, 2020).
Piggot, G., C. Verkuijl, H. van Asselt, and M. Lazarus, 2020: Curbing fossil fuel supply to achieve climate goals. Clim. Policy, 20(8) , doi:10.1080/14693062.2020.1804315.
Pizer, W.A. and S. Sexton, 2019: The Distributional Impacts of Energy Taxes. Rev. Environ. Econ. Policy, 13(1) , 104–123, doi:10.1093/reep/rey021.
Poffenbarger, H.J., B.A. Needelman, and J.P. Megonigal, 2011: Salinity influence on methane emissions from tidal marshes. Wetlands, 31(5) , 831–842, doi:10.1007/s13157-011-0197-0.
Pollin, R., 2020: An Industrial Policy Framework to Advance a Global Green New Deal. In: The Oxford Handbook of Industrial Policy, [Oqubay, A., C. Cramer, H.-J. Chang, and R. KozulWright, (eds.)]. Oxford University Press, Oxford, UK, doi: 10.1093/oxfordhb/9780198862420.013.16.
Pollin, R. and B. Callaci, 2019: The Economics of Just Transition: A Framework for Supporting Fossil Fuel–Dependent Workers and Communities in the United States. Labor Stud. J. , 44(2) , 93–138, doi:10.1177/0160449X18787051.
Pollitt, H., E. Alexandri, U. Chewpreecha, and G. Klaassen, 2015: Macroeconomic analysis of the employment impacts of future EU climate policies. Clim. Policy, 15(5) , 604–625, doi:10.1080/14693062.2014.953907.
Pollitt, H., R. Lewney, B. Kiss-Dobronyi, and X. Lin, 2021: Modelling the economic effects of COVID-19 and possible green recovery plans: a post-Keynesian approach. Clim. Policy, 21(10), 1257–1271, doi:10.1080/14693062.2021.1965525.
Polonara, F., L.J.M. Kuijpers, and R.A. Peixoto, 2017: Potential impacts of the montreal protocol kigali amendment to the choice of refrigerant alternatives. Int. J. Heat Technol. , 35 (Special Issue 1), S1–S8, doi:10.18280/ijht.35Sp0101.
Popp, R., 2019: A Just Transition of European Coal Regions. Assessing stakeholder positions towards the transition away from coal. E3G, London, UK, 20 pp., https://www.euki.de/wp-content/uploads/2019/02/E3G_2019_Stakeholder_Mappings_European_Coal_Regions_Final-1.pdf (Accessed November 1, 2021).
Portugal-Pereira, J. et al., 2016: Overlooked impacts of electricity expansion optimisation modelling: The life cycle side of the story. Energy, 115, 1424–1435, doi:10.1016/j.energy.2016.03.062.
Portugal-Pereira, J. et al., 2018: Better late than never, but never late is better: Risk assessment of nuclear power construction projects. Energy Policy, 120, 158–166, doi:10.1016/j.enpol.2018.05.041.
Powlson, D.S., C.M. Stirling, C. Thierfelder, R.P. White, and M.L. Jat, 2016: Does conservation agriculture deliver climate change mitigation through soil carbon sequestration in tropical agro-ecosystems?Agric. Ecosyst. Environ. , 220, 164–174, doi:10.1016/j.agee.2016.01.005.
Pozo, C., Á. Galán-Martín, D.M. Reiner, N. Mac Dowell, and G. Guillén-Gosálbez, 2020: Equity in allocating carbon dioxide removal quotas. Nat. Clim. Change, 10(7) , 640–646, doi:10.1038/s41558-020-0802-4.
PPMC and SLoCaT, 2016: Transport and climate change synthesis of analytical products by the paris process on mobility and climate (PPMC). Paris Process on Mobility and Climate (PPMC) and Partnership on Sustainable, Low Carbon Transport (SLoCaT). http://www.ppmc-transport.org/wp-content/uploads/2016/11/E2_Synthesis-Report.pdf (Accessed July 12, 2019).
Pradhan, A., C. Chan, P.K. Roul, J. Halbrendt, and B. Sipes, 2018a: Potential of conservation agriculture (CA) for climate change adaptation and food security under rainfed uplands of India: A transdisciplinary approach. Agric. Syst. , 163, 27–35, doi:10.1016/j.agsy.2017.01.002.
Pradhan, B.B., R.M. Shrestha, A. Pandey, and B. Limmeechokchai, 2018b: Strategies to Achieve Net Zero Emissions in Nepal. Carbon Manag. , 9(5) , 533–548, doi:10.1080/17583004.2018.1536168.
Pradhan, P., L. Costa, D. Rybski, W. Lucht, and J.P. Kropp, 2017: A Systematic Study of Sustainable Development Goal (SDG) Interactions. Earth’s Futur. , 5(11) , 1169–1179, doi:10.1002/2017EF000632.
Pretty, J.N. et al., 2006: Resource-conserving agriculture increases yields in developing countries. Environ. Sci. Technol. , 40(4) , 1114–1119, doi:10.1021/es051670d.
Prognos, Öko-Institut, Wuppertal-Institut, 2020: Towards a Climate-Neutral Germany. Executive Summary conducted for Agora Energiewende, Agora Verkehrswende and Stiftung Klimaneutralität . Stiftung Denkfabrik Klimaneutralität, Berlin, Germany, 175 pp., https://www.stiftung-klima.de/app/uploads/2020/11/2020_KNDE_Langfassung_WEB.pdf (Accessed October 18, 2021).
Pye, S. et al., 2016: Exploring national decarbonization pathways and global energy trade flows: A multi-scale analysis. Clim. Policy, 16(sup1) , S92–S109, doi:10.1080/14693062.2016.1179619.
Pye, S. et al., 2020: An equitable redistribution of unburnable carbon. Nat. Commun. , 11, 3968, doi:10.1038/s41467-020-17679-3.
Quéré, C. et al., 2018: Global Carbon Budget 2018. Earth Syst. Sci. Data, 10(4) , 2141–2194, doi:10.5194/essd-10-2141-2018.
Quinet, A. et al., 2019: The Value for Climate Action: A Shadow Price of Carbon for Evaluation of Investments and Public Policies, Paris, France, 187 pp., https://www.strategie.gouv.fr/sites/strategie.gouv.fr/files/atoms/files/ fs-the-value-for-climate-action-final-web.pdf (Accessed November 1, 2021).
Rajamani, L., 2017: Guiding principles and general obligation (Article 2.2 and Article 3). In: The Paris Agreement on climate change: Analysis and commentary. ISBN: 9780198803768[Klein, D., P. Carazo, J. Bulmer, M. Doelle, and A. Higham, (eds.)]. Oxford University Press, Oxford, UK.
Rajamani, L. and J. Brunnée, 2017: The legality of downgrading nationally determined contributions under the Paris agreement: Lessons from the US disengagement. J. Environ. Law, 29(3) , 537–551, doi:10.1093/jel/eqx024.
Rajamani, L. et al., 2021: National ‘fair shares’ in reducing greenhouse gas emissions within the principled framework of international environmental law. Clim. Policy, 21(8), 983–1004, doi:10.1080/14693062.2021.1970504.
Ramalingam, B., 2013: Aid on the edge of chaos: Rethinking international cooperation in a complex world. Oxford University Press, Oxford, UK, 480 pp.
Ramanathan, V. and Y. Xu, 2010: The Copenhagen accord for limiting global warming: Criteria, constraints, and available avenues. Proc. Natl. Acad. Sci. , 107(18) , 8055–8062, doi:10.1073/pnas.1002293107.
Randelli, F. and B. Rocchi, 2017: Analysing the role of consumers within technological innovation systems: The case of alternative food networks. Environ. Innov. Soc. Transitions, 25, 94–106, doi:10.1016/j.eist.2017.01.001.
Rao, N.D. and J. Min, 2018: Less global inequality can improve climate outcomes. Wiley Interdiscip. Rev. Clim. Change, 9(2) , doi:10.1002/wcc.513.
Rao, N.D., P. Sauer, M. Gidden, and K. Riahi, 2019: Income inequality projections for the Shared Socio-economic Pathways (SSPs). Futures, 105, 27–39, doi: 10.1016/j.futures.2018.07.001.
Raskin, P. and R. Swart, 2020: Excluded futures: The continuity bias in scenario assessments. Sustain. Earth, 3(1) , 8, doi:10.1186/s42055-020-00030-5.
Raskin, P. et al., 2002: Great transition: The promise and lure of the times ahead. Stockholm Environment Institute, Boston, USA, https://greattransition.org/documents/Great_Transition.pdf (Accessed November 1, 2021).
Rasul, G., 2016: Managing the food, water, and energy nexus for achieving the Sustainable Development Goals in South Asia. Environ. Dev. , 18, 14–25, doi:10.1016/j.envdev.2015.12.001.
Raubenheimer, S. et al., 2015: Stories from the South: Exploring low-carbon development pathways. MAPS team (Mitigation Action Plans and Scenarios), Edited by Stefan Raubenheimer. Cape Town, South Africa, 328 pp.
Rauter, R., D. Globocnik, E. Perl-Vorbach, and R.J. Baumgartner, 2019: Open innovation and its effects on economic and sustainability innovation performance. J. Innov. Knowl. , 4(4) , 226–233, doi:10.1016/J.JIK.2018.03.004.
Rendall, M., 2019: Discounting, climate change, and the ecological fallacy. Ethics, 129(3) , 441–463, doi:10.1086/701481.
Renner, S., J. Lay, and M. Schleicher, 2019: The effects of energy price changes: Heterogeneous welfare impacts and energy poverty in Indonesia. Environ. Dev. Econ. , 24(2) , 180–200, doi:10.1017/S1355770X18000402.
Rentschler, J. and M. Bazilian, 2017: Policy Monitor – Principles for Designing Effective Fossil Fuel Subsidy Reforms. Rev. Environ. Econ. Policy, 11(1) , 138–155, doi:10.1093/reep/rew016.
Revi, A., 2017: Re-imagining the United Nations’ Response to a Twenty-first-century Urban World: doi.org/10.1177/2455747117740438, 2(2) , ix–xv, doi:10.1177/2455747117740438.
Riahi, K. et al., 2015: Locked into Copenhagen pledges – Implications of short-term emission targets for the cost and feasibility of long-term climate goals. Technol. Forecast. Soc. Change, 90, 8–23, doi:10.1016/j.techfore.2013.09.016.
Riahi, K. et al., 2017: The Shared Socio-economic Pathways and their energy, land use, and greenhouse gas emissions implications: An overview. Glob. Environ. Change, 42, 153–168, doi:10.1016/j.gloenvcha.2016.05.009.
Riahi, K. et al., 2021: Implications of avoiding temperature overshoot for the attainability and costs of stringent mitigation targets. Nat. Clim. Change, Accepted.
Richter, P.M., R. Mendelevitch, and F. Jotzo, 2018: Coal taxes as supply-side climate policy: A rationale for major exporters?Clim. Change, 150(1–2) , 43–56, doi:10.1007/s10584-018-2163-9.
Ricke, K., L. Drouet, K. Caldeira, and M. Tavoni, 2018: Country-level social cost of carbon. Nat. Clim. Change, 8(10) , 895–900, doi:10.1038/s41558-018-0282-y.
Ringel, M., 2017: Energy efficiency policy governance in a multi-level administration structure – evidence from Germany. Energy Effic. , 10(3) , 753–776, doi:10.1007/s12053-016-9484-1.
Roberts, C. et al., 2018a: The politics of accelerating low-carbon transitions: Towards a new research agenda. Energy Res. Soc. Sci. , 44, 304–311, doi:10.1016/j.erss.2018.06.001.
Roberts, D., 2016: The New Climate Calculus: 1.5°C = Paris Agreement, Cities, Local Government, Science and Champions (PLSC 2). Urbanisation, 1(2) , 71–78, doi:10.1177/2455747116672474.
Roberts, J.T. and B.C. Parks, 2007: A climate of injustice: Global inequality, North-South politics, and climate policy. MIT Press, Cambridge, MA, USA, 404 pp.
Roberts, S.H., B.D. Foran, C.J. Axon, B.S. Warr, and N.H. Goddard, 2018b: Consequences of selecting technology pathways on cumulative carbon dioxide emissions for the United Kingdom. Appl. Energy, 228, 409–425, doi:10.1016/j.apenergy.2018.06.078.
Robertson, S., 2021: Transparency, trust, and integrated assessment models: An ethical consideration for the Intergovernmental Panel on Climate Change. WIREs Clim. Change, 12(1) , doi:10.1002/wcc.679.
Robiou du Pont, Y. and M. Meinshausen, 2018: Warming assessment of the bottom-up Paris Agreement emissions pledges. Nat. Commun. , 9(1) , 4810, doi:10.1038/s41467-018-07223-9.
Robiou Du Pont, Y. et al., 2017: Equitable mitigation to achieve the Paris Agreement goals. Nat. Clim. Change, 7(1) , 38, doi:10.1038/nclimate3186.
Rochedo, P.R.R. et al., 2018: The threat of political bargaining to climate mitigation in Brazil. Nat. Clim. Change, 8(8) , 695–698, doi:10.1038/s41558-018-0213-y.
Rockström, J. et al., 2017: A roadmap for rapid decarbonization. Science, 355(6331) , 1269–1271, doi:10.1126/science.aah3443.
Rodrik, D., 2016: Premature deindustrialization. J. Econ. Growth, 21(1) , 1–33, doi:10.1007/s10887-015-9122-3.
Roelfsema, M. et al., 2018: The Global Stocktake. Keeping track of implementing the Paris Agreement. PBL Netherlands Environ. Assess. Agency, PBL Netherlands Environmental Assedssment Agency, The Hague, The Netherlands, https://themasites.pbl.nl/global-stocktake-indicators/ (Accessed July 12, 2019).
Roelfsema, M. et al., 2020: Taking stock of national climate policies to evaluate implementation of the Paris Agreement. Nat. Commun. , 11(1) , 2096, doi:10.1038/s41467-020-15414-6.
Rogelj, J. and C.-F. Schleussner, 2019: Unintentional unfairness when applying new greenhouse gas emissions metrics at country level. Environ. Res. Lett. , 14 (11), 114039, doi:10.1088/1748-9326/ab4928.
Rogelj, J. et al., 2016: Paris Agreement climate proposals need a boost to keep warming well below 2°C. Nature, 534 (7609) , 631–639, doi:10.1038/nature18307.
Rogelj, J. et al., 2017: Understanding the origin of Paris Agreement emission uncertainties. Nat. Commun. , 8, 15748, doi:10.1038/ncomms15748.
Rogelj, J., D. Shindell, K. Jiang, S. Fifita, P. Forster, V. Ginzburg, C. Handa, H. Kheshgi, S. Kobayashi, E. Kriegler, L. Mundaca, R. Séférian, and M.V. Vilariño, 2018a: Mitigation Pathways Compatible with 1.5°C in the Context of Sustainable Development. In: Global Warming of 1.5°C: An IPCC special report on the impacts of global warming of 1.5°C above pre-industrial levels and related global greenhouse gas emission pathways, in the context of strengthening the global response to the threat of climate change[Masson-Delmotte, V., P. Zhai, H.-O. Pörtner, D. Roberts, J. Skea, P.R. Shukla, A. Pirani, W. Moufouma-Okia, C. Péan, R. Pidcock, S. Connors, J.B.R. Matthews, Y. Chen, X. Zhou, M.I. Gomis, E. Lonnoy, T. Maycock, M. Tignor, and T. Waterfield (eds.)]. Cambridge University Press, Cambridge, UK, and New York, NY, USA, pp. 93–174.
Rogelj, J. et al., 2018b: Scenarios towards limiting global mean temperature increase below 1.5°C. Nat. Clim. Change, 8(4) , 325–332, doi:10.1038/s41558-018-0091-3.
Rogelj, J., O. Geden, A. Cowie, and A. Reisinger, 2021: Net-zero emissions targets are vague: three ways to fix. Nat. , 591, 365–368, doi: 10.1038/d41586-021-00662-3
Rogge, K.S. and K. Reichardt, 2016: Policy mixes for sustainability transitions: An extended concept and framework for analysis. Res. Policy, 45(8) , 1620–1635, doi:10.1016/J.RESPOL.2016.04.004.
Rogge, K.S. et al., 2015: Green change: Renewable energies, policy mix and innovation. Fraunhofer ISI, Karlsruhe, Germany, 43 pp., http://sro.sussex.ac.uk/id/eprint/66004/ (Accessed December 19, 2019).
Romañach, S.S. et al., 2018: Conservation and restoration of mangroves: Global status, perspectives, and prognosis. Ocean Coast. Manag. , 154, 72–82, doi:10.1016/J.OCECOAMAN.2018.01.009.
Rose, S.K., R. Richels, G. Blanford, and T. Rutherford, 2017: The Paris Agreement and next steps in limiting global warming. Clim. Change, 142(1–2) , 255–270, doi:10.1007/s10584-017-1935-y.
Rosemberg, A., 2010: Building a Just Transition: The linkages between climate change and employment. In: Climate Change and Labour: The Need for a “Just Transition”. International Journal of Labour Research, 2(2) , 125–161.
Rosenbloom, D., 2017: Pathways: An emerging concept for the theory and governance of low-carbon transitions. Glob. Environ. Change, 43, 37–50, doi:10.1016/j.gloenvcha.2016.12.011.
Rosenbloom, D., J. Meadowcroft, S. Sheppard, S. Burch, and S. Williams, 2018: Transition experiments: Opening up low-carbon transition pathways for Canada through innovation and learning. Can. Public Policy, 44(4) , 368–383, doi:10.3138/cpp.2018-020.
Rosentreter, J.A., D.T. Maher, D.V. Erler, R.H. Murray, and B.D. Eyre, 2018: Methane emissions partially offset ‘blue carbon’ burial in mangroves. Sci. Adv. , 4(6) , doi:10.1126/sciadv.aao4985.
Routledge, P., A. Cumbers, and K.D. Derickson, 2018: States of just transition: Realising climate justice through and against the state. Geoforum, 88, 78–86, doi:10.1016/j.geoforum.2017.11.015.
Roy, J., P. Tschakert, H. Waisman, S. Abdul Halim, P. Antwi-Agyei, P. Dasgupta, B. Hayward, M. Kanninen, D. Liverman, C. Okereke, P.F. Pinho, K. Riahi, and A.G. Suarez Rodriguez, 2018: Sustainable Development, Poverty Eradication and Reducing Inequalities. In: Global Warming of 1.5°C: An IPCC special report on the impacts of global warming of 1.5°C above pre-industrial levels and related global greenhouse gas emission pathways, in the context of strengthening the global response to the threat of climate change[Masson-Delmotte, V., P. Zhai, H.-O. Pörtner, D. Roberts, J. Skea, P.R. Shukla, A. Pirani, W. Moufouma-Okia, C. Péan, R. Pidcock, S. Connors, J.B.R. Matthews, Y. Chen, X. Zhou, M.I. Gomis, E. Lonnoy, T. Maycock, M. Tignor, and T. Waterfield (eds.)]. Cambridge University Press, Cambridge, UK and New York, USA, pp. 445–540.
Rozenberg, J. and M. Fay, 2019: Beyond the Gap: How Countries Can Afford the Infrastructure They Need while Protecting the Planet . [Rozenberg, J. and M. Fay, (eds.)]. World Bank, Washington, DC, 175 pp.
RSA, 2011: National Climate Change Response White Paper. Government Gazette No. 34695, Notice 757 of 2011. Government of South Africa, Pretoria, South Africa, 49 pp.
Runge, C.F., 1984: Institutions and the Free Rider: The Assurance Problem in Collective Action. J. Polit. , 46 (1) , 154–181, doi:10.2307/2130438.
Sachs, J.D. et al., 2019: Six Transformations to achieve the Sustainable Development Goals. Nat. Sustain. , 2 (9), 805–814, doi:10.1038/s41893-019-0352-9.
Safarzyńska, K., 2018: Integrating behavioural economics into climate-economy models: Some policy lessons. Clim. Policy, 18(4) , 485–498, doi:10.1080/14693062.2017.1313718.
Sager, L., 2019: Income inequality and carbon consumption: Evidence from Environmental Engel curves. Energy Econ. , 84, 104507, doi:10.1016/j.eneco.2019.104507.
Samadi, S., J. Terrapon-Pfaff, S. Lechtenböhmer, and K. Knoop, 2018: Long-term low greenhouse gas emission development strategies for achieving the 1.5°C target – insights from a comparison of German bottom-up energy scenarios. Carbon Manag. , 9(5) , 549–562, doi:10.1080/17583004.2018.1475174.
Sanjuán, M.A., C. Argiz, P. Mora, and A. Zaragoza, 2020: Carbon dioxide uptake in the roadmap 2050 of the spanish cement industry. Energies, 13(13) , 3452, doi:10.3390/en13133452.
Sathaye, J., A. Najam, C. Cocklin, T. Heller, F. Lecocq, J. Llanes-Regueiro, J. Pan, G. Petschel-Held , S. Rayner, J. Robinson, R. Schaeffer, Y. Sokona, R. Swart, H. Winkler, 2007: Sustainable Development and Mitigation. In: Climate Change 2007: Mitigation. Contribution of Working Group III to the Fourth Assessment Report of the Intergovernmental Panel on Climate Chang e [Metz, B., O.D. Davidson, P. Bosch, R. Dave, and L.M. Meyer (eds.)]. Cambridge University Press, Cambridge, UK and New York, NY, USA.
Sathaye, J. et al., 2009: Opportunities to change development pathways toward lower greenhouse gas emissions through energy efficiency. Energy Effic. , 2(4) , doi:10.1007/s12053-009-9044-z.
Saveyn, B., L. Paroussos, and J.C. Ciscar, 2012: Economic analysis of a low-carbon path to 2050: A case for China, India and Japan. Energy Econ. , 34(sup3) , doi:10.1016/j.eneco.2012.04.010.
SB Chairs, 2021: Preparing for the first global stock-take. Revised non-paper by the Chairs of the SBSTA and SBI (15 September 2021). United Nations Framework Convention on Climate Change (UNFCCC), Bonn, 10 pp., https://unfccc.int/sites/default/files/resource/REV_Non-paper_on_Preparing_for_GST1_forSBs_15Sept.pdf (Accessed November 1, 2021).
Scenario Building Team, 2007: Long Term Mitigation Scenarios: Strategic Options for South Africa. Department of Environment Affairs and Tourism South Africa, Pretoria, South Africa, https://open.uct.ac.za/bitstream/ handle/11427/16804/Scenario_Building_Team_Long_Term_Mitigation_ 2007.pdf?sequence%20=%201 (Accessed November 1, 2021).
Schelly, C., 2014: Residential solar electricity adoption: What motivates, and what matters? A case study of early adopters. Energy Res. Soc. Sci. , 2, 183–191, doi:10.1016/j.erss.2014.01.001.
Schiffer, H.-W., 2015: Europe’s Road to a Sustainable Energy-Supply System. Energy Environ. , 26(1–2) , 111–126, doi:10.1260/0958-305x.26.1-2.111.
Schlosberg, D., 2009: Defining environmental justice: Theories, movements, and nature. Oxford University Press, Oxford, UK, 238 pp.
Schmid, E. and B. Knopf, 2012: Ambitious mitigation scenarios for Germany: A participatory approach. Energy Policy, 51, 662–672, doi:10.1016/j.enpol.2012.09.007.
Schot, J. and W.E. Steinmueller, 2018: Three frames for innovation policy: R&D, systems of innovation and transformative change. Res. Policy, 47(9) , 1554–1567, doi:10.1016/J.RESPOL.2018.08.011.
Schot, J., L. Kanger, and G. Verbong, 2016: The roles of users in shaping transitions to new energy systems. Nat. Energy, 1, 16054, doi:10.1038/nenergy.2016.54.
Schramski, S., C. McCarty, and G. Barnes, 2018: Household adaptive capacity: A social networks approach in rural South Africa. Clim. Dev. , 10(3) , 230–242, doi:10.1080/17565529.2017.1301861.
Schrobback, P., D. Adamson, and J. Quiggin, 2011: Turning Water into Carbon: Carbon Sequestration and Water Flow in the Murray–Darling Basin. Environ. Resour. Econ. , 49(1) , 23–45, doi:10.1007/s10640-010-9422-1.
Schweitzer, M. and Tonn, B., 2003: Non-energy benefits of the US Weatherization Assistance Program: A summary of their scope and magnitude. Appl. Energy, 76(4) , 321–335, doi: 10.1016/S0306-2619(03)00003-5.
Schweizer, V.J. and E. Kriegler, 2012: Improving environmental change research with systematic techniques for qualitative scenarios. Environ. Res. Lett. , 7(4) , 044011, doi:10.1088/1748-9326/7/4/044011.
Scott, A., 2017: Making governance work for water – energy – food nexus approaches. Climate and Development Knowledge Network, London, United Kingdom, 15 pp., https://cdkn.org/resource/working-paper-making-governance-work-water-energy-food-nexus-approaches/?loclang=en_gb (Accessed November 1, 2021).
Scott, A., L. Worrall, and S. Patel, 2018: Aligning energy development and climate objectives in Nationally Determined Contributions. Climate and Development Knowledge Network (CDKN), London, UK, 28 pp.,https://media.africaportal.org/documents/CDKN_Aligning-Energy-Working-Paper_final-web.pdf (Accessed November 1, 2021).
Scottish Government, 2020a: Just Transition Commission. https://www.gov.scot/groups/just-transition-commission, Scottish Government, Edinburgh, United Kingdom (Accessed November 1, 2021).
Scottish Government, 2020b: Securing a green recovery on a path to net zero: Climate change plan 2018–2032 – update. Scottish Government, Edinburgh, United Kingdom, https://www.gov.scot/publications/securing-green-recovery-path-net-zero-update-climate-change-plan-20182032/, 253 pp. (Accessed January 6, 2021).
Scottish Government, 2021: Energy statistics for Scotland. Q4 2020 figures. https://www.gov.scot/binaries/content/documents/govscot/publications/statistics/2018/10/quarterly-energy-statistics-bulletins/documents/energy-statistics-summary---march-2021/energy-statistics-summary---march-2021/govscot%3Adocument/Scotland%2BEnergy%2BSt (Accessed November 1, 2021).
SEI et al., 2019: The Production Gap: The discrepancy between countries’ panned fossil fuel production and global production levels consistent with limitingwarming to 1.5°C or 2°C. Stockholm Environment Institute (SEI), Seattle, USA, 70 pp., https://productiongap. org/2019report/.
SEI, IISD, ODI, E3G, and UNEP, 2020: The Production Gap Report: 2020 Special Report . Stockholm Environment Institute (SEI), Seattle, USA, International Institute for Sustainable Development, Winnipeg, Manitoba, Canada, Overseas Development Institute, London, United Kingdom, E3G, London, United Kingdom, United Nations Environmental Program, New York, USA, 66 pp., http://productiongap. org/2020report .
Sekera, J. and A. Lichtenberger, 2020: Assessing Carbon Capture: Public Policy, Science, and Societal Need. Biophys. Econ. Sustain. , 5 (3) , 1–28, doi:10.1007/s41247-020-00080-5.
Sen Roy, S. and S. Sen Roy, 2018: Linking Gender to Climate Change Impacts in the Global South. Springer International Publishing, Cham, Switzerland, 1–25 pp.
Service, O. et al., 2014: EASTFour simple ways to apply behavioural insights. Behavioural Insights Ltd., London, United Kingdom, 53 pp.,http://behaviouralinsights.co.uk/publications/east-four-simple-ways-apply-behavioural-insights.
Seto, K.C. et al., 2016: Carbon Lock-In: Types, Causes, and Policy Implications. Annu. Rev. Environ. Resour. , 41(1) , 425–452, doi:10.1146/annurev-environ-110615-085934.
Setzer, J. and L.C. Vanhala, 2019: Climate change litigation: A review of research on courts and litigants in climate governance. Wiley Interdiscip. Rev. Clim. Change, 10(3) , doi:10.1002/wcc.580.
Seyfang, G. and A. Smith, 2007: Grassroots innovations for sustainable development: Towards a new research and policy agenda. Env. Polit. , 16 (4) , 584–603, doi:10.1080/09644010701419121.
Seyfang, G., S. Hielscher, T. Hargreaves, M. Martiskainen, and A. Smith, 2014: A grassroots sustainable energy niche? Reflections on community energy in the UK. Environ. Innov. Soc. Transitions, 13, 21–44, doi:10.1016/j.eist.2014.04.004.
Shah, Z. et al., 2019: If you care, I care: Perceived social support and public engagement via SNSs during crises. Technol. Soc. , 59, 101195, doi:10.1016/j.techsoc.2019.101195.
Shahiduzzaman, M. and A. Layton, 2017: Decomposition analysis for assessing the United States 2025 emissions target: How big is the challenge?Renew. Sustain. Energy Rev. , 67, 372–383, doi:10.1016/j.rser.2016.08.042.
Sharma, S.S., 2011: Determinants of carbon dioxide emissions: Empirical evidence from 69 countries. Appl. Energy, 88(1) , 376–382, doi:10.1016/j.apenergy.2010.07.022.
Sharmina, M. et al., 2016: A nexus perspective on competing land demands: Wider lessons from a UK policy case study. Environ. Sci. Policy, 59, 74–84, doi:10.1016/j.envsci.2016.02.008.
Shawoo, Z. and C.L. McDermott, 2020: Justice through polycentricity? A critical examination of climate justice framings in Pakistani climate policymaking. Clim. Policy, 20(2) , 199–216, doi:10.1080/14693062.2019.1707640.
Shell Global, 2014: New Lenses on Future Cities. Shell International BV, The Hague, The Netherlands, 55 pp., https://www.shell.com/energy-and-innovation/the-energy-future/scenarios/new-lenses-on-future-cities.html (Accessed November 22, 2019).
Shiller, R.J., 2019: Narrative economics: How stories go viral and drive major economic events. Princeton University Press, Princeton, USA, 377 pp.
Shindell, D. et al., 2012: Simultaneously mitigating near-term climate change and improving human health and food security. Science, 335(6065) , 183–189, doi:10.1126/science.1210026.
Shindell, D. et al., 2017: A climate policy pathway for near- and long-term benefits. Science, 356(6337) , 493–494, doi:10.1126/science.aak9521.
Shiraki, H. et al., 2021: The role of renewables in the Japanese power sector: Implications from the EMF35 JMIP. Sustain. Sci. , 16(2) , 375–392, doi:10.1007/s11625-021-00917-y.
Shirizadeh, B., Q. Perrier, and P. Quirion, 2020: How Sensitive are Optimal Fully Renewable Power Systems to Technology Cost Uncertainty?Energy J. , 43(1) , doi:10.5547/01956574.43.1.BSHI.
Shukla, P.R., S. Dhar, and D. Mahapatra, 2008: Low-carbon society scenarios for India. Clim. Policy, 8, S156–S176, doi:10.3763/cpol.2007.0498.
Siagian, U.W.R., B.B. Yuwono, S. Fujimori, and T. Masui, 2017: Low-carbon energy development in Indonesia in alignment with Intended Nationally Determined Contribution (INDC) by 2030. Energies, 10(1) , doi:10.3390/en10010052.
Siikamäki, J., J.N. Sanchirico, and S.L. Jardine, 2012: Global economic potential for reducing carbon dioxide emissions from mangrove loss. Proc. Natl. Acad. Sci. , 109(36) , 14369–14374, doi:10.1073/pnas.1200519109.
Silva Herran, D. and S. Fujimori, 2021: Beyond Japanese NDC: Energy and macroeconomic transitions towards 2050 in emission pathways with multiple ambition levels. Sustain. Sci. , 16(2) , 489–501, doi:10.1007/s11625-021-00930-1.
Simonet, G., J. Subervie, D. Ezzine-de-Blas, M. Cromberg, and A.E. Duchelle, 2019: Effectiveness of a REDD+ Project in Reducing Deforestation in the Brazilian Amazon. Am. J. Agric. Econ. , 101(1) , 211–229, doi:10.1093/ajae/aay028.
Singh, C., 2018: Is participatory watershed development building local adaptive capacity? Findings from a case study in Rajasthan, India. Environ. Dev. , 25, 43–58, doi:10.1016/j.envdev.2017.11.004.
SIPRI, 2020: How does world military expenditure compare with government expenditure on health and education, or with overseas aid to developing countries? Stockholm International Peace Research Institute (SIPRI), Stockholm, Sweden, https://sipri.org/databases/milex/frequently-asked-questions#9-how-does-world (Accessed November 1, 2021).
Smil, V., 2016: Energy transitions: Global and national perspectives– 2nd ed. Praeger, Santa Barbara, CA, USA , 297 pp.
Smith, A., T. Hargreaves, S. Hielscher, M. Martiskainen, and G. Seyfang, 2016: Making the most of community energies: Three perspectives on grassroots innovation. Environ. Plan. A Econ. Sp. , 48(2) , 407–432, doi:10.1177/0308518X15597908.
Smith, H.J., E. Kruger, J. Knot, and J.N. Blignaut, 2017: Conservation agriculture in South Africa: lessons from case studies. In: Conservation agriculture for Africa: building resilient farming systems in a changing climate[Kassam, A. H., Mkomwa, S., Friedrich, T. (eds.)]. Plant Production and Protection Division, Food and Agriculture Organization of the United Nations Rome, Italy, pp. 214–245.
Smith, J.B. et al., 2011: Development and climate change adaptation funding: Coordination and integration. Clim. Policy, 11(3) , 987–1000, doi:10.1080/14693062.2011.582385.
Smith, S., 2017: Just Transition: A Report for the OECD. International Trade Union Confederation (ITUC), Brussels, Belgium, 23 pp., https://www.oecd.org/environment/cc/g20-climate/collapsecontents/Just-Transition-Centre-report-just-transition.pdf (Accessed November 1, 2021).
Snell, D., 2018: ‘Just transition’? Conceptual challenges meet stark reality in a ‘transitioning’ coal region in Australia. Globalizations, 15(4) , 550–564, doi:10.1080/14747731.2018.1454679.
Solano Rodriguez, B., P. Drummond, and P. Ekins, 2017: Decarbonizing the EU energy system by 2050: An important role for BECCS. Clim. Policy, 17, S93–S110, doi:10.1080/14693062.2016.1242058.
Soterroni, A.C. et al., 2018: Future environmental and agricultural impacts of Brazil’s Forest Code. Environ. Res. Lett. , 13(7) , 074021, doi:10.1088/1748-9326/aaccbb.
Soterroni, A.C. et al., 2019: Expanding the Soy Moratorium to Brazil’s Cerrado. Sci. Adv. , 5(7) , eaav7336, doi:10.1126/sciadv.aav7336.
Soussana, J.-F. et al., 2019: Matching policy and science: Rationale for the ‘4 per 1000 - soils for food security and climate’ initiative. Soil Tillage Res. , 188, 3–15, doi.org/10.1016/j.still.2017.12.002.
Sovacool, B.K., 2013: Expanding renewable energy access with pro-poor public private partnerships in the developing world. Energy Strateg. Rev. , 1(3) , 181–192, doi:10.1016/j.esr.2012.11.003.
Sovacool, B.K., 2016: How long will it take? Conceptualizing the temporal dynamics of energy transitions. Energy Res. Soc. Sci. , 13, 202–215, doi:10.1016/j.erss.2015.12.020.
Sovacool, B.K., 2017: Reviewing, Reforming, and Rethinking Global Energy Subsidies: Towards a Political Economy Research Agenda. Ecol. Econ. , 135, 150–163, doi:10.1016/j.ecolecon.2016.12.009.
Sovacool, B.K. and M.H. Dworkin, 2014: Global energy justice: Problems, principles, and practices. Cambridge University Press, Cambridge, United Kingdom and New York, NY, USA, 1–391 pp.
Sovacool, B.K., P. Schmid, A. Stirling, G. Walter, and G. MacKerron, 2020: Differences in carbon emissions reduction between countries pursuing renewable electricity versus nuclear power. Nat. Energy, 5(11) , 928–935, doi:10.1038/s41560-020-00696-3.
Spencer, T. et al., 2015: Beyond the Numbers: Understanding the Transformation Induced by INDCs. Institut du developpement durable et des relations internationales (IDDRI), Paris, France, 80 pp., https://inis.iaea.org/search/search.aspx?orig_q=RN :48078532 (Accessed November 1, 2021).
Srinivasana, U.T. et al., 2008: The debt of nations and the distribution of ecological impacts from human activities. Proc. Natl. Acad. Sci. , 105(5) , 1768–1773, doi:10.1073/PNAS.0709562104.
State of California, 2018: Executive Order B-55-18 to Achieve Carbon Neutrality. https://www.ca.gov/archive/gov39/wp-content/uploads/2018/09/9.10.18-Executive-Order.pdf (Accessed January 6, 2021).
Statistics Sweden, 2020: Downloaded data on Carbon tax revenues and GDP. www.scb.se.
Staub-Kaminski, I., A. Zimmer, M. Jakob, and R. Marschinski, 2014: Climate policy in practice: A typology of obstacles and implications for integrated assessment modeling. Clim. Chang. Econ. , 5(1) , doi:10.1142/S2010007814400041.
Steckel, J.C. et al., 2017: From climate finance toward sustainable development finance. Wiley Interdiscip. Rev. Clim. Change, 8(1) , e437, doi:10.1002/wcc.437.
Steffen, W. and M. Stafford Smith, 2013: Planetary boundaries, equity and global sustainability: Why wealthy countries could benefit from more equity. Curr. Opin. Environ. Sustain. , 5(3–4) , 403–408, doi:10.1016/j.cosust.2013.04.007.
Steffen, W. et al., 2015: Planetary boundaries: Guiding human development on a changing planet. Science, 347(6223) , doi:10.1126/science.1259855.
Stenzel, F. et al., 2021: Irrigation of biomass plantations may globally increase water stress more than climate change. Nat. Commun. , 12(1) , 1512, doi:10.1038/s41467-021-21640-3.
Stephan, B., S. Schurig, and A. Leidreiter, 2016: What Place for Renewables in the INDCs?World Future Council, Hamburg, Germany, 12 pp., https://www.worldfuturecouncil.org/wp-content/uploads/2016/03/WFC_2016_What_Place_for_Renewables_in_the_INDCs.pdf (Accessed July 12, 2019).
Sterner, T., 2007: Environmental tax reform: The Swedish experience. Eur. Environ. , 4(6) , 20–25, doi:10.1002/eet.3320040606.
Stevis, D. and R. Felli, 2015: Global labour unions and just transition to a green economy. Int. Environ. Agreements Polit. Law Econ. , 15(1) , 29–43, doi:10.1007/s10784-014-9266-1.
Stiglitz, J., 1998: Distinguished Lecture on Economics in Government: The Private Uses of Public Interests: Incentives and Institutions. J. Econ. Perspect. , 12(2) , 3–22, doi:10.1257/jep.12.2.3.
Stiglitz, J. et al., 2017: Report of the high-level commission on carbon prices. Supported by the World Bank Group; Agence de l’Environnement et de la Maitrise de l’Energie; Ministere de la transition ecologique et solidaire, Republique Francaise. Carbon Pricing Leadership Coalition, Washington, DC, USA, 61 pp., https://www.carbonpricingleadership.org/report-of-the-highlevel-commission-on-carbon-prices (Accessed November 1, 2021).
Strambo, C., J. Burton, and A. Atteridge, 2019: The end of coal? Planning of a ‘just transition’ in South Africa. Stockholm Environment Institute (SEI), Seattle, USA, 15 pp., https://www.sei.org/wp-content/uploads/2019/02/planning-a-just-transition-in-south-africa.pdf (Accessed November 1, 2021).
Sugiyama, M. et al., 2019: Japan’s long-term climate mitigation policy: Multi-model assessment and sectoral challenges. Energy, 167, 1120–1131, doi: 10.1016/j.energy.2018.10.091.
Sugiyama, M. et al., 2021: EMF 35 JMIP study for Japan’s long-term climate and energy policy: Scenario designs and key findings. Sustain. Sci. , 16(2) , 355–374, doi:10.1007/S11625-021-00913-2.
Sumabat, A.K. et al., 2016: Decomposition analysis of Philippine CO2 emissions from fuel combustion and electricity generation. Appl. Energy, 164, 795–804, doi:10.1016/j.apenergy.2015.12.023.
Sunderlin, W.D. et al., 2014: How are REDD+ Proponents Addressing Tenure Problems? Evidence from Brazil, Cameroon, Tanzania, Indonesia, and Vietnam. World Dev. , 55, 37–52, doi:10.1016/j.worlddev.2013.01.013.
Sutton-Grier, A.E. and A. Moore, 2016: Leveraging Carbon Services of Coastal Ecosystems for Habitat Protection and Restoration. Coast. Manag. , 44(3) , 259–277, doi:10.1080/08920753.2016.1160206.
Sutton-Grier, A.E., K. Wowk, and H. Bamford, 2015: Future of our coasts: The potential for natural and hybrid infrastructure to enhance the resilience of our coastal communities, economies and ecosystems. Environ. Sci. Policy, 51, 137–148, doi:10.1016/j.envsci.2015.04.006.
Swilling, M. and E. Annecke, 2012: Just transitions: Explorations of sustainability in an unfair world. UCT Press, Cape Town, South Africa, 360 pp.
Szpor, A. and Ziółkowska, K., 2018: The transformation of the Polish coal sector. International Institute for Sustainable Development, Winipeg, Manitoba, Canada, 21 pp., https://www.iisd.org/sites/default/files/publications/transformation-polish-coal-sector.pdf (Accessed November 1, 2021).
Taillardat, P., D.A. Friess, and M. Lupascu, 2018: Mangrove blue carbon strategies for climate change mitigation are most effective at the national scale. Biol. Lett. , 14(10) , 20180251, doi:10.1098/rsbl.2018.0251.
Tait, L., 2017: Towards a multidimensional framework for measuring household energy access: Application to South Africa. Energy Sustain. Dev. , 38, 1–9, doi:10.1016/j.esd.2017.01.007.
Tait, L. and M. Euston-Brown, 2017: What role can African cities play in low-carbon development? A multilevel governance perspective of Ghana, Uganda and South Africa. J. Energy South. Africa, 28(3) , 43, doi:10.17159/2413-3051/2017/v28i3a1959.
Tallis, H.M. et al., 2018: An attainable global vision for conservation and human well-being. Front. Ecol. Environ. , 114, 6722–6728, doi:10.1002/fee.1965.
Task Force on Climate-Related Financial Disclosures, 2019: Task Force on Climate-Related Financial Disclosures: Status Report . Financial Stability Board, Bank for International Settlements, Basel, Switzerland, 135 pp., https://assets.bbhub.io/company/sites/60/2020/10/2019-TCFD-Status-Report-FINAL-0531191.pdf .
Tegmark, M., 2017: Life 3.0: Being human in the age of artificial intelligence. Penguin Random House, London, United Kingdom, 364 pp.
Telaye, A., P. Benitez, S. Tamru, H.A. Medhin, and M.A. Toman, 2019: Exploring Carbon Pricing in Developing Countries: A Macroeconomic Analysis in Ethiopia. The World Bank, Washington, DC, Policy Research Working Paper 8860, 29 pp.
Thacker, S. et al., 2019: Infrastructure for sustainable development. Nat. Sustain. , 2(4) , 324–331, doi:10.1038/s41893-019-0256-8.
Thalmann, P., 2004: The public acceptance of green taxes: 2 Million voters express their opinion. Public Choice, 119 (1–2), 179–217, doi:10.1023/b:puch.0000024165.18082.db.
The Energy and Climate Intelligence Unit, 2019: Countdown to zero: Plotting progress towards delivering net zero emissions by 2050. Energy and Climate Intelligence Unit, London, United Kingdom, 16 pp., https://ca1-eci.edcdn.com/reports/ECIU_Countdown_to_Net_Zero.pdf?v=1561459809.
Thepkhun, P., B. Limmeechokchai, S. Fujimori, T. Masui, and R.M. Shrestha, 2013: Thailand’s Low-Carbon Scenario 2050: The AIM/CGE analyses of CO2 mitigation measures. Energy Policy, 62, 561–572, doi:10.1016/j.enpol.2013.07.037.
Thomas Klaus, Carla Vollmer, Harry Lehmann, and Klaus Müschen, 2010: Energy target 2050: 100 % renewable electricity supply. Federal Environment Agency Germany, Dessau-Roßlau, Germany, 44 pp., https://www.researchgate.net/publication/279526291_2050_Energy_Target_100_renewable_electricity_supply (Accessed October 18, 2021).
Thomas, N. et al., 2017: Distribution and drivers of global mangrove forest change, 1996–2010. PLoS One, 12(6) , 1–14, doi:10.1371/journal.pone.0179302.
Thornton, P.K. and M. Herrero, 2015: Adapting to climate change in the mixed crop and livestock farming systems in sub-Saharan Africa. Nat. Clim. Change, 5, 830–836, doi:10.1038/nclimate2754.
Thornton, P.K. et al., 2018: A Qualitative Evaluation of CSA Options in Mixed Crop-Livestock Systems in Developing Countries. In: Climate Smart Agriculture[Lipper, L., N. McCarthy, D. Zilberman, S. Asfaw, and G. Branca, (eds.)]. Food and Agriculture Organization of the United Nations, Rome, Italy, pp. 385–423.
Tokoro, T. et al., 2014: Net uptake of atmospheric CO2 by coastal submerged aquatic vegetation. Glob. Chang. Biol. , 20(6) , 1873–1884, doi:10.1111/gcb.12543.
Tume, S.J.P., J.N. Kimengsi, and Z.N. Fogwe, 2019: Indigenous Knowledge and Farmer Perceptions of Climate and Ecological Changes in the Bamenda Highlands of Cameroon: Insights from the Bui Plateau. Climate, 7(12) , doi:10.3390/cli7120138.
TWI2050 – The World in 2050, 2018: Transformations to Achieve the Sustainable Development Goals – Report prepared by The World in 2050 initiative. International Institute for Applied Systems Analysis (IIASA), Laxenburg, Austria, 157 pp., https://pure.iiasa.ac.at/id/eprint/15347/ (Accessed November 1, 2021).
UN, 2017: Work of the Statistical Commission pertaining to the 2030 Agenda for Sustainable Development. UN Documents A/RES/71/313, https://undocs. org/Home/ Mobile?FinalSymbol=A%2FRES%2F71%2F313&Language=E& DeviceType=Desktop&LangRequested=False (Last Accessed May 30, 2022), 25 pp.
UN, 2018: Report of the Inter-Agency and Expert Group on Sustainable Development Goal Indicators. UN Document E/CN.3/2018/2, https://undocs.org/Home/Mobile?FinalSymbol=E%2FCN.3%2F2018%2F2&Language= E& DeviceType=Desktop&LangRequested=False (last accessed May 30, 2022), 13 pp.
UN, 2019: Report of the Inter-Agency and Expert Group on Sustainable Development Goal Indicators – Note by the Secretary-General. UN Document E/CN.3/2019/2, https://documents-dds-ny.un.org/doc/UNDOC/GEN/N18/451/ 31/PDF/N1845131.pdf?OpenElement (Last Accessed May 31, 2022), 15 pp.
UN, 2020a: ‘Enhance solidarity’ to fight COVID-19, Chinese President urges, also pledges carbon neutrality by 2060. UN News, United Nations, New York, USA, https://news.un.org/en/story/2020/09/1073052 (Accessed December 8, 2020).
UN, 2020b: UN chief hails Republic of Korea’s vow to achieve carbon neutrality. UN News, United Nations, New York, USA, https://news.un.org/en/story/2020/10/1076342 (Accessed December 8, 2020).
UN, 2020c: Climate action: UN chief encouraged by Japan’s 2050 net zero pledge. UN News, United Nations, New York, USA, https://news.un.org/en/story/2020/10/1076132 (Accessed December 8, 2020).
Ünal, A.B., L. Steg, and M. Gorsira, 2018: Values Versus Environmental Knowledge as Triggers of a Process of Activation of Personal Norms for Eco-Driving. Environ. Behav. , 50(10) , 1092–1118, doi:10.1177/0013916517728991.
UNEP, 2015: Aligning the Financial System with Sustainable Development: Pathways to Scale. Inquiry: Design of a Sustainable Financial System and United Nations Environment Programme (UNEP), Geneva, Switzerland, 25 pp., https://www.unenvironment.org/ru/node/10493 (Accessed November 20, 2019).
UNEP, 2016: The Adaptation Finance Gap Report 2016. United Nations Environment Programme (UNEP), Nairobi, Kenya, 50 pp., https://climate analytics.org/media/agr2016.pdf (Accessed November 1, 2021).
UNEP, 2017a: The Emissions Gap Report 2017. United Nations Environment Programme (UNEP), Nairobi, Kenya, 89 pp.,https://wedocs.unep.org/bitstream/handle/20.500.11822/22070/EGR_2017.pdf?sequence=1&isAllowed=y (Accessed November 1, 2021).
UNEP, 2017b: Consuming Differently, Consuming Sustainably: Behavioural Insights for Policymaking. United Nations Environment Programme (UNEP), Nairobi, Kenya, 55 p., https://sustainabledevelopment.un.org/content/documents/2404Behavioral%20Insights.pdf (Accessed November 1, 2021).
UNEP, 2018a: The Adaptation Gap Report 2018. United Nations Environment Programme (UNEP), Nairobi, Kenya, 84 pp., https://wedocs.unep.org/bitstream/handle/20.500.11822/27114/AGR_2018.pdf?sequence=3 (Accessed November 1, 2021).
UNEP, 2018b: Emissions gap report 2018. United Nations Environment Programme (UNEP), Nairobi, Kenya, 85 pp., https://wedocs.unep.org/bitstream/handle/20.500.11822/26895/EGR2018_FullReport_EN.pdf?isAllowed=y&sequence=1 (Accessed November 1, 2021).
UNEP, 2020a: Emissions gap report 2020. United Nations Environment Programme (UNEP), Nairobi, Kenya. 101 pp., https://wedocs.unep.org/xmlui/bitstream/handle/20.500.11822/34426/EGR20.pdf?sequence=3 (Accessed November 1, 2021)
UNEP, 2020b: Oil and Gas Methane Partnership (OGMP) 2.0 Framework | Climate & Clean Air Coalition. United Nations Environment Programme (UNEP), Nairobi, Kenya, 18 pp., https://www.ccacoalition.org/en/resources/oil-and-gas-methane-partnership-ogmp-20-framework (Accessed October 18, 2021).
UNEP, 2021: The emissions gap report 2021. United Nations Environment Programme (UNEP), Nairobi, Kenya, 79 pp., , https://www.unep.org/resources/emissions-gap-report-2021 (Accessed November 1, 2021).
UNEP - Finance Initiative, 2020: Task Force on Climate-related financial disclosures. UNEP - Financ. Initiat.
UNEP and IEA, 2020: UNEP and IEA report: Cooling Emissions and Policy Synthesis (GEN - 1142.00) Eurovent .
UNEP and WMO, 2011: Integrated Assessment of Black Carbon and Tropospheric Ozone. World Meteorological Organization (WMO), Geneva, Switzerland, 283 pp., https://library.wmo.int/doc_num.php?explnum_id=7737 (Accessed November 1, 2021).
UNEP Inquiry, 2016: The Financial System We Need – From Momentum to Transformation. Financ. Syst. We Need. United Nations Environment Program (UNEP), Nairobi, Kenya, https://wedocs.unep.org/bitstream/handle/20.500.11822/20716/The_Financial_System_We_Need_From_Momentum_to_Transformation.pdf?sequence=1&isAllowed=y (Accessed November 1, 2021).
UNFCCC, 2014: Decision 1/CP.20: Lima Call for Action. FCCC/CP/2014/10/Add.1, United Nations Framework Convention on Climate Change (UNFCCC), 43 pp., https://undocs.org/Home/Mobile?FinalSymbol=FCCC%2FCP%2F2014%2F10%2FAdd.1&Lan guage=E&DeviceType=Desktop&LangRequested=False* (Accessed November 1, 2021).
UNFCCC, 2015a: Synthesis report on the aggregate effect of the intended nationally determined contributions. Note by the Secretariat, FCCC/CP/2015/7, United Nations Framework Convention on Climate Change (UNFCCC), 66 pp., https://undocs.org/Home/Mobile?FinalSymbol=F CCC%2FCP%2F2015%2F7&Language=E&Device Type=Desktop&LangRequested=False (Accessed November 1, 2021).
UNFCCC, 2015b: Paris Agreement . Annex to decision 1/CP.21. FCCC/CP/2015/10/Add.1, United Nations Framework Convention on Climate Change (UNFCCC), 36 pp., https://undocs.org/Home/Mobile?Final Symbol=FCCC%2FCP%2F2015%2F10%2FAdd.1&Language=E& DeviceType=Desktop&LangRequested=False (Accessed November 1, 2021).
UNFCCC, 2016a: Aggregate effect of the intended nationally determined contributions: an update - Synthesis report by the secretariat. FCCC/CP/2016/2, United Nations Framework Convention on Climate Change (UNFCCC), 75 pp., https://unfccc.int/resource/docs/2016/cop22/eng/02.pdf (Accessed November 1, 2021).
UNFCCC, 2016b: Aggregate effect of the intended nationally determined contributions: An update. FCCC/CP/2016/2, United Nations Framework Convention on Climate Change (UNFCCC), 78 pp., https://unfccc.int/resource/docs/2016/cop22/eng/02.pdf (Accessed November 1, 2021).
UNFCCC, 2016c: Just transition of the workforce, and the creation of decent work and quality jobs. Technical Paper. FCCC/TP/2016/7, United Nations Framework Convention on Climate Change (UNFCCC), 59 pp.,https://documents-dds-ny.un.org/doc/UNDOC/GEN/G16/240/43/PDF/G1624043.pdf?OpenElement (Accessed November 1, 2021).
UNFCCC, 2018a: Decision 19/CM1, FCCC/PA/CMA/2018/3/Add.2: Matters Relating to Article 14 of the Paris Agreement and Paragraphs 99–101 of Decision 1/CP.21. United Nations Framework Convention on Climate Change (UNFCCC), 53–58 pp., https://unfccc.int/sites/default/files/resource/ cma2018_3_add2_new_advance.pdf (Accessed November 1, 2021).
UNFCCC, 2018b: Decision 18/CM1, FCCC/PA/CMA/2018/3/Add.2: Modalities, procedures and guidelines for the transparency framework for action and support referred to in Article 13 of the Paris Agreement. United Nations Framework Convention on Climate Change (UNFCCC), 18–52 pp., https://unfccc.int/sites/default/files/resource/ cma2018_3_add2_new_advance.pdf (Accessed November 1, 2021).
UNFCCC, 2018c: Decision 4/CMA.1: Further guidance in relation to the mitigation section of decision 1/CP.21. Decision x/CMA.1. FCCC/PA/CMA/2018/3/Add.1, United Nations Framework Convention on Climate Change (UNFCCC), 37 pp., https://unfccc.int/documents/193407 (Accessed November 1, 2021).
UNFCCC, 2021: Nationally determined contributions under the Paris Agreement. Synthesis report by the secretariat. FCCC/PA/CMA/2021/8, United Nations Framework Convention on Climate Change (UNFCCC), 42 pp., https://unfccc.int/sites/default/files/resource/cma2021_08_adv_1.pdf (Accessed November 1, 2021).
UNHRC, 2020: International solidarity and climate change: Report of the Independent Expert on human rights and international solidarity. UN Doc. A/HRC/44/44, 20 pp., https://undocs.org/Home/ Mobile?FinalSymbol=A%2FHRC%2F44%2F44&Language=E&Device Type=Desktop&LangRequested=False (Accessed November 1, 2021).
Urban, F., 2018: China’s rise: Challenging the North-South technology transfer paradigm for climate change mitigation and low-carbon energy. Energy Policy, 113 (August 2017), 320–330, doi:10.1016/j.enpol.2017.11.007.
Vaillancourt, K., O. Bahn, E. Frenette, and O. Sigvaldason, 2017: Exploring deep decarbonization pathways to 2050 for Canada using an optimization energy model framework. Appl. Energy, 195, 774–785, doi:10.1016/j.apenergy.2017.03.104.
Valadkhani, A., I. Roshdi, and R. Smyth, 2016: A multiplicative environmental DEA approach to measure efficiency changes in the world’s major polluters. Energy Econ. , 54, 363–375, doi:10.1016/j.eneco.2015.12.018.
van Asselt, H. and T.S.H. Moerenhout, 2018: Reforming Egypt’s Fossil Fuel Subsidies in the Context of a Changing Social Contract. In: The Politics of Fossil Fuel Subsidies and their Reform. [ J. Skovgaard, and H. van Asselt (eds.)], Cambridge University Press, Cambridge, United Kingdom and New York, NY, USA, pp. 265–282.
van den Berg, N.J. et al., 2019: Implications of various effort-sharing approaches for national carbon budgets and emission pathways. Clim. Change, 162(4) , 1805–1822, doi:10.1007/s10584-019-02368-y.
van den Broek, K., J.W. Bolderdijk, and L. Steg, 2017: Individual differences in values determine the relative persuasiveness of biospheric, economic and combined appeals. J. Environ. Psychol. , 53, 145–156, doi:10.1016/j.jenvp.2017.07.009.
van der Linden, S., E. Maibach, and A. Leiserowitz, 2015: Improving Public Engagement With Climate Change: Five ‘Best Practice’ Insights From Psychological Science. Perspect. Psychol. Sci. , 10(6) , 758–763, doi:10.1177/1745691615598516.
van der Voorn, T., Å. Svenfelt, K.E. Björnberg, E. Fauré, and R. Milestad, 2020: Envisioning carbon-free land use futures for Sweden: A scenario study on conflicts and synergies between environmental policy goals. Reg. Environ. Change, 20(2) , 1–10, doi:10.1007/s10113-020-01618-5.
van der Zwaan, B. et al., 2016: Energy technology roll-out for climate change mitigation: A multi-model study for Latin America. Energy Econ. , 56, 526–542, doi:10.1016/j.eneco.2015.11.019.
van Heerden, J. et al., 2016: The economic and environmental effects of a carbon tax in South Africa: A dynamic CGE modelling approach. South African J. Econ. Manag. Sci. , 19(5) , 714–732, doi:10.17159/2222-3436/2016/v19n5a3.
van Meijl, H. et al., 2018: On the macroeconomic impact of bioenergy and biochemicals – Introducing advanced bioeconomy sectors into an economic modelling framework with a case study for the Netherlands. Biomass and Bioenergy, 108, 381–397, doi:10.1016/J.BIOMBIOE.2017.10.040.
Vandyck, T., K. Keramidas, B. Saveyn, A. Kitous, and Z. Vrontisi, 2016: A global stocktake of the Paris pledges: Implications for energy systems and economy. Glob. Environ. Change, 41, 46–63, doi:10.1016/j.gloenvcha.2016.08.006.
Vaughan, N.E. and C. Gough, 2016: Expert assessment concludes negative emissions scenarios may not deliver. Environ. Res. Lett. , 11(9) , 1–7, doi:10.1088/1748-9326/11/9/095003.
Ven, D.-J. Van de et al., 2019: Integrated policy assessment and optimisation over multiple sustainable development goals in Eastern Africa. Environ. Res. Lett. , 14(9) , 094001, doi:10.1088/1748-9326/AB375D.
Vergara, W. et al., 2016: The Economic Case for Landscape Restoration in Latin America. World Resources Instite, Washington DC, USA, 62 pp.
Veysey, J. et al., 2014: Pathways to Mexico’s climate change mitigation targets: A multi-model analysis. Energy Econ. , 56, 587–599, doi:10.1016/j.eneco.2015.04.011.
Victor, N., C. Nichols, and C. Zelek, 2018: The US power sector decarbonization: Investigating technology options with MARKAL nine-region model. Energy Econ. , 73 (November), 410–425, doi:10.1016/j.eneco.2018.03.021.
Viebahn, P., D. Vallentin, and S. Höller, 2014: Prospects of carbon capture and storage (CCS) in India’s power sector – An integrated assessment. Appl. Energy, 117, 62–75, doi:10.1016/J.APENERGY.2013.11.054.
Vishwanathan, S.S. and A. Garg, 2020: Energy system transformation to meet NDC, 2°C, and well below 2°C targets for India. Clim. Change, 162(4) , 1877–1891, doi:10.1007/s10584-019-02616-1.
Vishwanathan, S.S., A. Garg, and V. Tiwari, 2018a: Coal transitions in India: Assessing India’s energy transition options. Institut du Développement Durable et des Relations Internationales, Paris, France and Climate Strategies, London, United Kingdom, 52 pp., https://www.iddri.org/sites/default/files/PDF/Publications/Catalogue%20Iddri/Rapport/20180609_ReportCOAL_India.pdf .
Vishwanathan, S.S., A. Garg, V. Tiwari, and P.R. Shukla, 2018b: India in 2°C and well below 2°C worlds: Opportunities and challenges. Carbon Manag. , 9(5) , 459–479, doi:10.1080/17583004.2018.1476588.
Vogt-Schilb, A. and S. Hallegatte, 2017: Climate policies and nationally determined contributions: Reconciling the needed ambition with the political economy. Wiley Interdiscip. Rev. Energy Environ. , 6(6) , e256, doi:10.1002/wene.256.
Vogt-Schilb, A. et al., 2019: Cash transfers for pro-poor carbon taxes in Latin America and the Caribbean. Nat. Sustain. , 2(10) , 941–948, doi:10.1038/s41893-019-0385-0.
Voigt, C. and F. Ferreira, 2016: Differentiation in the Paris Agreement. Clim. Law, 6, 58–74, doi:doi 10.1163/18786561-00601004.
Von Stechow, C. et al., 2016: 2°C and SDGs: United they stand, divided they fall?Environ. Res. Lett. , 11(3) , doi:10.1088/1748-9326/11/3/034022.
Voß, J.-P., J. Newig, B. Kastens, J. Monstadt, and B. Nölting, 2007: Steering for Sustainable Development: A Typology of Problems and Strategies with respect to Ambivalence, Uncertainty and Distributed Power. J. Environ. Policy Plan. , 9(3–4) , 193–212, doi:10.1080/15239080701622881.
Waage, J. et al., 2015: Governing the UN Sustainable Development Goals: interactions, infrastructures, and institutions. Lancet Glob. Heal. , 3(5) , e251–e252, doi:10.1016/S2214-109X(15)70112-9.
Waisman, H. et al., 2019: A pathway design framework for national low greenhouse gas emission development strategies. Nat. Clim. Change, 9(4) , 261–268, doi:10.1038/s41558-019-0442-8.
Wakiyama, T. and T. Kuramochi, 2017: Scenario analysis of energy saving and CO2 emissions reduction potentials to ratchet up Japanese mitigation target in 2030 in the residential sector. Energy Policy, 103, 1–15, doi:10.1016/j.enpol.2016.12.059.
Wall Street Journal, 2019: Economists’ Statement on Carbon Dividends Organized by the Climate Leadership Council. https://www.wsj.com/articles/economists-statement-on-carbon-dividends-11547682910 (Accessed December 11, 2019).
Wang, K., Y. Mao, J. Chen, and S. Yu, 2018: The optimal research and development portfolio of low-carbon energy technologies: A study of China. J. Clean. Prod. , 176, 1065–1077, doi:10.1016/J.JCLEPRO.2017.11.230.
Wang, M. and C. Feng, 2017: Decomposition of energy-related CO2 emissions in China: An empirical analysis based on provincial panel data of three sectors. Appl. Energy, 190, 772–787, doi:10.1016/j.apenergy.2017.01.007.
Wang, Q., M. Lu, Z. Bai, and K. Wang, 2020: Coronavirus pandemic reduced China’s CO2 emissions in short-term, while stimulus packages may lead to emissions growth in medium- and long-term. Appl. Energy, 278, 115735, doi:10.1016/j.apenergy.2020.115735.
Warlenius, R., G. Pierce, and V. Ramasar, 2015: Reversing the arrow of arrears: The concept of ‘ecological debt’ and its value for environmental justice. Glob. Environ. Change, 30, 21–30, doi:10.1016/J.GLOENVCHA.2014.10.014.
Watson, J., R. Gross, I. Ketsopoulou, and M. Winskel, 2015: The impact of uncertainties on the UK’s medium-term climate change targets. Energy Policy, 87, 685–695, doi:10.1016/J.ENPOL.2015.02.030.
Watts, N. et al., 2019: The 2019 report of The Lancet Countdown on health and climate change: nsuring that the health of a child born today is not defined by a changing climate. Lancet , 304 (10211), 1836–1878, doi:/10.1016/S0140-6736(19)32596-6.
WBGU, 2011: World in transition: A social contract for sustainability. German Advisory Council on Global Change, Berlin, 396 pp, https://www.wbgu.de/fileadmin/user_upload/wbgu/publikationen/hauptgutachten/hg2011/pdf/wbgu_jg2011_en.pdf .
Wei, W., Y. Zhao, J. Wang, and M. Song, 2019: The environmental benefits and economic impacts of Fit-in-Tariff in China. Renew. Energy, 133, 401–410, doi:10.1016/J.RENENE.2018.10.064.
Weitz, N., H. Carlsen, M. Nilsson, and K. Skånberg, 2018: Towards systemic and contextual priority setting for implementing the 2030 agenda. Sustain. Sci. , 13(2) , 531–548, doi:10.1007/s11625-017-0470-0.
White House, 2016: Investing in Coal Communities, Workers, and Technology: The POWER+ Plan. https://obamawhitehouse.archives.gov/sites/default/files/omb/budget/fy2016/assets/fact_sheets/investing-in-coal-communities-workers-and-technology-the-power-plan.pdf (Accessed January 8, 2020).
Wiedenhofer, D. et al., 2017: Unequal household carbon footprints in China. Nat. Clim. Change, 7 (1) , 75–80, doi:10.1038/nclimate3165.
Wiedmann, T., M. Lenzen, L.T. Keyßer, and J.K. Steinberger, 2020: Scientists’ warning on affluence. Nat. Commun. , 11(1) , 1–10, doi:10.1038/s41467-020-16941-y.
Willenbockel, D., H. Hoka Osiolo, and S. Bawakyillenuo, 2017: Exploring the Macroeconomic Impacts of Low-Carbon Energy Transitions: A Simulation Analysis for Kenya and Ghana. IDS Bull. , 48(5–6) , doi:10.19088/1968-2017.163.
Windham-Myers, L., S. Crooks, and T.G. Troxler, 2018: A Blue Carbon Primer: The State of Coastal Wetland Carbon Science, Practice and Policy. 1st Edition. [Windham-Myers, L., S. Crooks, and T.G. Troxler, (eds.)]. CRC Press, Boca Raton, USA, 532 pp.
Winkler, H., 2017a: Mitigation (Article 4). In: The Paris Agreement on climate change: Analysis and commentary. [Klein, D., P. Carazo, J. Bulmer, M. Doelle, and A. Higham, (eds.)], Oxford University Press, Oxford, UK, pp. 135–159.
Winkler, H., 2017b: Reducing energy poverty through carbon tax revenues in South Africa. J. Energy South. Africa, 28(3) , 12–26, doi:10.17159/2413-3051/2017/v28i3a2332.
Winkler, H., 2018: Reducing inequality and carbon emissions: Innovation of developmental pathways. Academy of Science of South Africa, Pretoria, South Africa.
Winkler, H., and A. Marquard, 2009: Changing development paths: From an energy-intensive to low-carbon economy in South Africa. Clim. Dev. , 1(1) , 47–65, doi:10.3763/cdev.2009.0003.
Winkler, H., K. Baumert, O. Blanchard, S. Burch, and J. Robinson, 2007: What factors influence mitigative capacity?Energy Policy, 35(1) , 692–703, doi:10.1016/j.enpol.2006.01.009.
Winkler, H., A. Boyd, M. Torres Gunfaus, and S. Raubenheimer, 2015: Reconsidering development by reflecting on climate change. Int. Environ. Agreements Polit. Law Econ. , 15(4) , 369–385, doi:10.1007/s10784-015-9304-7.
Winkler, H. et al., 2017: Information for a developmental approach to mitigation: Linking sectoral and economy-wide models for Brazil, Chile, Colombia, Peru and South Africa. Clim. Dev. , 9(6) , 559–570, doi:10.1080/17565529.2016.1174660.
Winkler, H. et al., 2018: Countries start to explain how their climate contributions are fair: More rigour needed. Int. Environ. Agreements Polit. Law Econ. , 18, 99–115, doi:10.1007/s10784-017-9381-x.
Withana S., 2016: Overcoming Obstacles to Green Fiscal Reform. Int. J. Green Growth Dev. , 2(2) , 161–188.
Wollenberg, E. et al., 2016: Reducing emissions from agriculture to meet the 2°C target. Glob. Chang. Biol. , 22(12) , 3859–3864, doi:10.1111/gcb.13340.
World Bank, 2007: Results-based National Development Strategies: Assessment and Challenges Ahead. The World bank. The World Bank, Washington, DC, USA, 96 pp.
World Bank, 2009: : World Development Report 2009: Reshaping Economic Geography. The World Bank, Washington, DC, USA, 383 pp.
World Bank, 2020: World Development Indicators. The World Bank, Washington, DC, USA, https://databank.worldbank.org.
World Economic Forum, 2018: Eight Futures of Work: Scenarios and their Implications. The World Economic Forum (WEF), Geneva, Switzerland, 18 pp., https://www.weforum.org/whitepapers/eight-futures-of-work-scenarios-and-their-implications (Accessed November 22, 2019).
World Meteorological Organization, 2018: Scientific Assessment of Ozone Depletion: 2018 - Executive Summary. Global Ozo. World Meteorological Organization (WMO), Geneva, Switzerland, 67 pp.
Wright, J.G., T. Bischof-Niemz, J.R. Calitz, C. Mushwana, and R. van Heerden, 2019: Long-term electricity sector expansion planning: A unique opportunity for a least cost energy transition in South Africa. Renew. Energy Focus, 30 (September), 21–45, doi:10.1016/j.ref.2019.02.005.
Wu, R., H. Dai, Y. Geng, Y. Xie, and X. Tian, 2019: Impacts of export restructuring on national economy and CO2 emissions: A general equilibrium analysis for China. Appl. Energy, 248, 64–78, doi:10.1016/j.apenergy.2019.04.024.
Prognos, Öko-Institut, Wuppertal-Institut., 2021: Klimaneutrales Deutschland 2045. Wie Deutschland seine Klimaziele schon vor 2050 erreichen kann Zusammenfassung im Auftrag von Stiftung Klimaneutralität, Agora Energiewende und Agora VerkehrswendePrognos AG, Berlin, Germany, Öko-Institut e. V., Berlin, Germany, and Wuppertal Institut für Klima, Umwelt, 31 pp., https://static.agora-energiewende.de/fileadmin/ Projekte/2021/2021_04_KNDE45/A-EW_209_KNDE2045_Zusammen fassung_DE_WEB.pdf (Accessed October 18, 2021).
Wylie, L., A.E. Sutton-Grier, and A. Moore, 2016: Keys to successful blue carbon projects: Lessons learned from global case studies. Mar. Policy, 65, 76–84, doi:10.1016/j.marpol.2015.12.020.
Xiao, L. and R. Zhao, 2017: China’s new era of ecological civilization. Science, 358(6366) , 1008–1009, doi:10.1126/science.aar3760.
Xu, Y. and V. Ramanathan, 2017: Well below 2°C: Mitigation strategies for avoiding dangerous to catastrophic climate changes. Proc. Natl. Acad. Sci. , 114(39) , 10315–10323, doi:10.1073/pnas.1618481114.
Xunzhang, P., C. Wenying, L.E. Clarke, W. Lining, and L. Guannan, 2017: China’s energy system transformation towards the 2°C goal: Implications of different effort-sharing principles. Energy Policy, 103, 116–126, doi:10.1016/j.enpol.2017.01.020.
Yang, X., J. Pang, F. Teng, R. Gong, and C. Springer, 2021: The environmental co-benefit and economic impact of China’s low-carbon pathways: Evidence from linking bottom-up and top-down models. Renew. Sustain. Energy Rev. , 136, 110438, doi:10.1016/J.RSER.2020.110438.
Yeo, S., 2019: Where climate cash is flowing and why it’s not enough. Nature, 573(7774) , 328–331, doi:10.1038/d41586-019-02712-3.
Young, J. and M. Brans, 2017: Analysis of factors affecting a shift in a local energy system towards 100% renewable energy community. J. Clean. Prod. , 169, 117–124, doi:10.1016/j.jclepro.2017.08.023.
Zadek, S. and N. Robins, 2016: Financing sustainable development: Moving from momentum to transformation in a time of turmoil, : United Nations Environmental Program, New York, USAhttps://www.un.org/pga/71/wp-content/uploads/sites/40/2017/02/Financing-Sustainable-Development-in-a-time-of-turmoil.pdf (Accessed November 1, 2021).
Zappa, W., M. Junginger, and M. van den Broek, 2019: Is a 100% renewable European power system feasible by 2050?Appl. Energy, 233–234 (August 2018), 1027–1050, doi:10.1016/j.apenergy.2018.08.109.
Zauberman, G., B.K. Kim, S.A. Malkoc, and J.R. Bettman, 2009: Discounting time and time discounting: Subjective time perception and intertemporal preferences. J. Mark. Res. , 46(4) , 543–556, doi:10.1509/jmkr.46.4.543.
Zevallos, P., T.P. Takahashi, M.P. Cigaran, and K. Coetzee, 2014: Mitigation Action in Peru: A case study for energy efficiency. Clim. Dev. , 6(sup1) , 43–48, doi: 10.1080/17565529.2013.867251.
Zhang, H.-B., H.-C. Dai, H.-X. Lai, and W.-T. Wang, 2017: US withdrawal from the Paris Agreement: Reasons, impacts, and China’s response. Adv. Clim. Chang. Res. , 8(4) , 220–225, doi:10.1016/j.accre.2017.09.002.
Zhao, Y. et al., 2018: Scenario analysis of the carbon pricing policy in China’s power sector through 2050: Based on an improved CGE model. Ecol. Indic. , 85, 352–366, doi:10.1016/J.ECOLIND.2017.10.028.
Zhou, N. et al., 2019: A roadmap for China to peak carbon dioxide emissions and achieve a 20% share of non-fossil fuels in primary energy by 2030. Appl. Energy, 239 (December 2018), 793–819, doi:10.1016/j.apenergy.2019.01.154.
Zou, J. et al., 2016: Pursuing an innovative development pathway: Understanding China’s NDC. National Center for Climate Change Strategy and International Cooperation (NCSC) and Partnership for Market Readiness (PMR), Beijing and Washington, DC, http://documents.worldbank.org/curated/en/312771480392483509/pdf/110555-WP-FINAL-PMR-China-Country-Paper-Digital-v1-PUBLIC-ABSTRACT-SENT.pdf .
1 See Section 4.2.1 for description of ‘unconditional’ and ‘conditional’ elements of NDCs.
2 ‘Unconditional’ NDCs refer to abatement efforts pledged without any conditions (this terminology is used by the literature, not by the Paris Agreement). They are based mainly on domestic abatement actions, although countries can use international cooperation to meet their targets. ‘Conditional’ NDCs require international cooperation, for example bilateral agreements under article 6, financing or monetary and/or technological transfers (14.3.2).
3 Note that the statistical metrics reported are slightly different across the reports. For example, IPCC SR1.5 reported the 25th to 75th percentile range while the UNEP Emissions Gap Report uses median and 10th to 90th percentile ranges. In addition, this report applies 100-year GWPs from AR6 to aggregate across different GHG emission species, whereas 100-year GWPs from AR4 were applied in IPCC SR1.5 and UNEP 2020a. The application of AR6 GWPs on average leads to increase of estimates by about 1.3% and ranges are wider due to the difference in statistical error metrics.
4 See Box SPM.1 for a description of the approach to project global warming outcomes of modelled pathways and its consistency with the climate assessment in AR6 WGI.
5 The emission gap ranges provided here is calculated as the difference between minimum and maximum emissions estimates of NDCs and the median of the 1.5°C and 2°C pathways.
6 Specifying gases aids clarity, see Cross-Chapter Boxes 2 and 3 in chapters 2 and 3, respectively. Some countries refer to net zero GHG emissions as ‘climate neutrality’ or ‘carbon neutrality’; the more precise terms are used where supported by the information assessedin this report.


