Summary for Policymakers


This Summary for Policymakers should be cited as:
IPCC, 2022: Summary for Policymakers. In: Climate Change 2022: Mitigation of Climate Change. Contribution of Working Group III to the Sixth Assessment Report of the Intergovernmental Panel on Climate Change[P.R. Shukla, J. Skea, R. Slade, A. Al Khourdajie, R. van Diemen, D. McCollum, M. Pathak, S. Some, P. Vyas, R. Fradera, M. Belkacemi, A. Hasija, G. Lisboa, S. Luz, J. Malley, (eds.)]. Cambridge University Press, Cambridge, UK and New York, NY, USA. doi: 10.1017/9781009157926.001.
A. Introduction and Framing 
The Working Group III (WGIII) contribution to the IPCC’s Sixth Assessment Report (AR6) assesses literature on the scientific, technological, environmental, economic and social aspects of mitigation of climate change. 1 Levels of confidence 2 are given in () brackets. Numerical ranges are presented in square [] brackets. References to Chapters, Sections, Figures and Boxes in the underlying report and Technical Summary (TS) are given in {} brackets.
The report reflects new findings in the relevant literature and builds on previous IPCC reports, including the WGIII contribution to the IPCC’s Fifth Assessment Report (AR5), the WGI and WGII contributions to AR6 and the three Special Reports in the Sixth Assessment cycle, 3 as well as other UN assessments. Some of the main developments relevant for this report include {TS.1, TS.2}:
•An evolving international landscape. The literature reflects, among other factors: developments in the UN Framework Convention on Climate Change (UNFCCC) process, including the outcomes of the Kyoto Protocol and the adoption of the Paris Agreement {13, 14, 15, 16}; the UN 2030 Agenda for Sustainable Development including the Sustainable Development Goals (SDGs) {1, 3, 4, 17}; and the evolving roles of international cooperation {14}, finance {15} and innovation {16}.
•Increasing diversity of actors and approaches to mitigation. Recent literature highlights the growing role of non-state and sub-national actors including cities, businesses, Indigenous Peoples, citizens including local communities and youth, transnational initiatives, and public-private entities in the global effort to address climate change {5, 13, 14, 15, 16, 17}. Literature documents the global spread of climate policies and cost declines of existing and emerging low emission technologies, along with varied types and levels of mitigation efforts, and sustained reductions in greenhouse gas (GHG) emissions in some countries {2, 5, 6, 8, 12, 13, 16}, and the impacts of, and some lessons from, the COVID-19 pandemic. {1, 2, 3, 5, 13, 15, Box TS.1, Cross-Chapter Box 1 in Chapter 1}
•Close linkages between climate change mitigation, adaptation and development pathways. The development pathways taken by countries at all stages of economic development impact GHG emissions and hence shape mitigation challenges and opportunities, which vary across countries and regions. Literature explores how development choices and the establishment of enabling conditions for action and support influence the feasibility and the cost of limiting emissions {1, 3, 4, 5, 13, 15, 16}. Literature highlights that climate change mitigation action designed and conducted in the context of sustainable development, equity, and poverty eradication, and rooted in the development aspirations of the societies within which they take place, will be more acceptable, durable and effective {1, 3, 4, 5}. This report covers mitigation from both targeted measures, and from policies and governance with other primary objectives.
•New approaches in the assessment. In addition to the sectoral and systems chapters {3, 6, 7, 8, 9, 10, 11, 12}, the report includes, for the first time in a WGIII report, chapters dedicated to demand for services, and social aspects of mitigation {5, Box TS.11}, and to innovation, technology development and transfer {16}.The assessment of future pathways in this report covers near term (to 2030), medium term (up to 2050), and long term (to 2100) time scales, combining assessment of existing pledges and actions {4, 5}, with an assessment of emissions reductions, and their implications, associated with long-term temperature outcomes up to the year 2100 {3}. 4 The assessment of modelled global pathways addresses ways of shifting development pathways towards sustainability. Strengthened collaboration between IPCC Working Groups is reflected in Cross-Working Group Boxes that integrate physical science, climate risks and adaptation, and the mitigation of climate change. 5
•Increasing diversity of analytic frameworks from multiple disciplines including social sciences. This report identifies multiple analytic frameworks to assess the drivers of, barriers to and options for, mitigation action. These include: economic efficiency, including the benefits of avoided impacts; ethics and equity; interlinked technological and social transition processes; and socio-political frameworks, including institutions and governance {1, 3, 13, Cross-Chapter Box 12 in Chapter 16}. These help to identify risks and opportunities for action, including co-benefits and just and equitable transitions at local, national and global scales. {1, 3, 4, 5, 13, 14, 16, 17}
Section B of this Summary for Policymakers (SPM) assesses Recent developments and current trends, including data uncertainties and gaps . Section C, System transformations to limit global warming, identifies emission pathways and alternative mitigation portfolios consistent with limiting global warming to different levels, and assesses specific mitigation options at the sectoral and system level. Section D addresses Linkages between mitigation, adaptation, and sustainable development . Section E, Strengthening the response, assesses knowledge of how enabling conditions of institutional design, policy, finance, innovation and governance arrangements can contribute to climate change mitigation in the context of sustainable development.
B. Recent Developments and Current Trends
B.1 Total net anthropogenic GHG emissions6have continued to rise during the period 2010-2019, as have cumulative net CO2 emissions since 1850. Average annual GHG emissions during 2010–2019 were higher than in any previous decade, but the rate of growth between 2010 and 2019 was lower than that between 2000 and 2009. (high confidence) Expand Figure SPM.1 Links to chaptersFigure 2.2, Figure 2.5, Table 2.1, 2.2, Figure TS.2
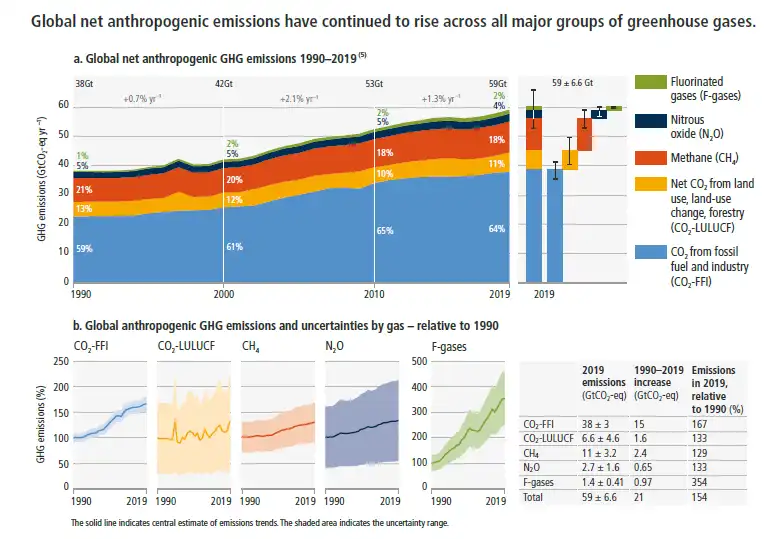
B.1.1 Global net anthropogenic GHG emissions were 59 ± 6.6 GtCO2-eq 7 , 8 in 2019, about 12% (6.5 GtCO2-eq) higher than in 2010 and 54% (21 GtCO2-eq) higher than in 1990. The annual average during the decade 2010–2019 was 56 ± 6.0 GtCO2-eq, 9.1 GtCO2-eq yr –1 higher than in 2000–2009. This is the highest increase in average decadal emissions on record. The average annual rate of growth slowed from 2.1% yr –1 between 2000 and 2009 to 1.3% yr –1 between 2010 and 2019. (high confidence) (Figure SPM.1) {Figure 2.2, Figure 2.5, Table 2.1, 2.2, Figure TS.2}
B.1.2Growth in anthropogenic emissions has persisted across all major groups of GHGs since 1990, albeit at different rates. By 2019, the largest growth in absolute emissions occurred in CO2 from fossil fuels and industry followed by CH4, whereas the highest relative growth occurred in fluorinated gases, starting from low levels in 1990 (high confidence). Net anthropogenic CO2 emissions from land use, land-use change and forestry (CO2-LULUCF) are subject to large uncertainties and high annual variability, with low confidence even in the direction of the long-term trend. 9 (Figure SPM.1) {Figure 2.2, Figure 2.5, 2.2, Figure TS.2}
B.1.3Historical cumulative net CO2 emissions from 1850 to 2019 were 2400 ± 240 GtCO2 (high confidence). Of these, more than half (58%) occurred between 1850 and 1989 [1400 ± 195 GtCO2], and about 42% between 1990 and 2019 [1000 ± 90 GtCO2]. About 17% of historical cumulative net CO2 emissions since 1850 occurred between 2010 and 2019 [410 ± 30 GtCO2]. 10 By comparison, the current central estimate of the remaining carbon budget from 2020 onwards for limiting warming to 1.5°C with a probability of 50% has been assessed as 500 GtCO2, and as 1150 GtCO2 for a probability of 67% for limiting warming to 2°C. Remaining carbon budgets depend on the amount of non-CO2 mitigation (±220 GtCO2) and are further subject to geophysical uncertainties. Based on central estimates only, cumulative net CO2 emissions between 2010 and 2019 compare to about four-fifths of the size of the remaining carbon budget from 2020 onwards for a 50% probability of limiting global warming to 1.5°C, and about one-third of the remaining carbon budget for a 67% probability to limit global warming to 2°C. Even when taking uncertainties into account, historical emissions between 1850 and 2019 constitute a large share of total carbon budgets for these global warming levels. 11 , 12 Based on central estimates only, historical cumulative net CO2 emissions between 1850 and 2019 amount to about four-fifths 12 of the total carbon budget for a 50% probability of limiting global warming to 1.5°C (central estimate about 2900 GtCO2), and to about two thirds 12 of the total carbon budget for a 67% probability to limit global warming to 2°C (central estimate about 3550 GtCO2). {Figure 2.7, 2.2, Figure TS.3, WGI Table SPM.2}
B.1.4Emissions of CO2-FFI dropped temporarily in the first half of 2020 due to responses to the COVID-19 pandemic (high confidence), but rebounded by the end of the year (medium confidence). The annual average CO2-FFI emissions reduction in 2020 relative to 2019 was about 5.8% [5.1–6.3%], or 2.2 [1.9–2.4] GtCO2 (high confidence). The full GHG emissions impact of the COVID-19 pandemic could not be assessed due to a lack of data regarding non-CO2GHG emissions in 2020. {Cross-Chapter Box 1 in Chapter 1, Figure 2.6, 2.2, Box TS.1, Box TS.1 Figure 1}
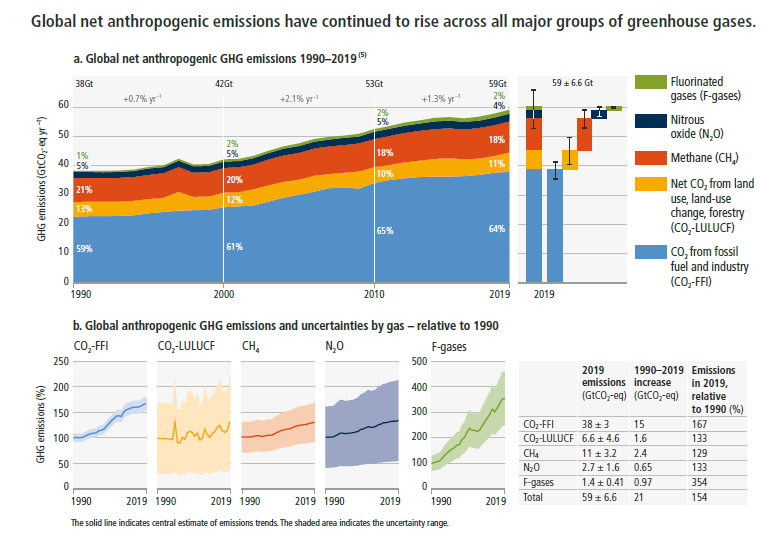
Figure SPM.1 | Global net anthropogenic GHG emissions (GtCO2-eqyr–1) 1990–2019. Global net anthropogenic GHG emissions include CO2 from fossil fuel combustion and industrial processes (CO2-FFI); net CO2 from land use, land-use change and forestry (CO2-LULUCF)9; methane (CH4); nitrous oxide (N2O); and fluorinated gases (HFCs, PFCs, SF6, NF3). 6Panel a shows aggregate annual global net anthropogenic GHG emissions by groups of gases from 1990 to 2019 reported in GtCO2-eq converted based on global warming potentials with a 100-year time horizon (GWP100-AR6) from the IPCC Sixth Assessment Report Working Group I (Chapter 7). The fraction of global emissions for each gas is shown for 1990, 2000, 2010 and 2019; as well as the aggregate average annual growth rate between these decades. At the right side of Panel a, GHG emissions in 2019 are broken down into individual components with the associated uncertainties (90% confidence interval) indicated by the error bars: CO2-FFI ±8%; CO2-LULUCF ±70%; CH4±30%; N2O ±60%; F-gases ±30%; GHG ±11%. Uncertainties in GHG emissions are assessed in Supplementary Material 2.2. The single-year peak of emissions in 1997 was due to higher CO2-LULUCF emissions from a forest and peat fire event in South East Asia. Panel b shows global anthropogenic CO2-FFI, net CO2-LULUCF, CH4, N2O and F-gas emissions individually for the period 1990–2019, normalised relative to 100 in 1990. Note the different scale for the included F-gas emissions compared to other gases, highlighting its rapid growth from a low base. Shaded areas indicate the uncertainty range. Uncertainty ranges as shown here are specific for individual groups of greenhouse gases and cannot be compared. The table shows the central estimate for: absolute emissions in 2019; the absolute change in emissions between 1990 and 2019; and emissions in 2019 expressed as a percentage of 1990 emissions. {2.2, Figure 2.5, Supplementary Material 2.2, Figure TS.2}
B.2Net anthropogenic GHG emissions have increased since 2010 across all major sectors globally. An increasing share of emissions can be attributed to urban areas. Emissions reductions in CO2 from fossil fuels and industrial processes (CO2-FFI), due to improvements in energy intensity of GDP and carbon intensity of energy, have been less than emissions increases from rising global activity levels in industry, energy supply, transport, agriculture and buildings. (high confidence) ExpandLinks to chapters2.2, 2.4, 6.3, 7.2, 8.3, 9.3, 10.1, 11.2
B.2.1In 2019, approximately 34% (20 GtCO2-eq) of total net anthropogenic GHG emissions came from the energy supply sector, 24% (14 GtCO2-eq) from industry, 22% (13 GtCO2-eq) from agriculture, forestry and other land use (AFOLU), 15% (8.7 GtCO2-eq) from transport and 6% (3.3 GtCO2-eq) from buildings. 13 If emissions from electricity and heat production are attributed to the sectors that use the final energy, 90% of these indirect emissions are allocated to the industry and buildings sectors, increasing their relative GHG emissions shares from 24% to 34%, and from 6% to 16%, respectively. After reallocating emissions from electricity and heat production, the energy supply sector accounts for 12% of global net anthropogenic GHG emissions. (high confidence) {Figure 2.12, 2.2, 6.3, 7.2, 9.3, 10.1, 11.2, Figure TS.6}
B.2.2Average annual GHG emissions growth between 2010 and 2019 slowed compared to the previous decade in energy supply (from 2.3% to 1.0%) and industry (from 3.4% to 1.4%), but remained roughly constant at about 2% yr –1 in the transport sector (high confidence). Emissions growth in AFOLU, comprising emissions from agriculture (mainly CH4 and N2O) and forestry and other land use (mainly CO2) is more uncertain than in other sectors due to the high share and uncertainty of CO2-LULUCF emissions (medium confidence). About half of total net AFOLU emissions are from CO2-LULUCF, predominantly from deforestation 14 (medium confidence). {Figure 2.13, 2.2, 6.3, 7.2, Figure 7.3, 9.3, 10.1, 11.2, TS.3}
B.2.3The global share of emissions that can be attributed to urban areas is increasing. In 2015, urban emissions were estimated to be 25 GtCO2-eq (about 62% of the global share) and in 2020, 29 GtCO2-eq (67–72% of the global share). 15 The drivers of urban GHG emission are complex and include population size, income, state of urbanisation and urban form. (high confidence) {8.1, 8.3}
B.2.4Global energy intensity (total primary energy per unit GDP) decreased by 2% yr –1 between 2010 and 2019. Carbon intensity (CO2 from fossil fuel combustion and industrial processes (CO2-FFI) per unit primary energy) decreased by 0.3% yr –1, with large regional variations, over the same period mainly due to fuel switching from coal to gas, reduced expansion of coal capacity, and increased use of renewables. This reversed the trend observed for 2000–2009. For comparison, the carbon intensity of primary energy is projected to decrease globally by about 3.5% yr –1 between 2020 and 2050 in modelled scenarios that limit warming to 2°C (>67%), and by about 7.7% yr –1 globally in scenarios that limit warming to 1.5°C (>50%) with no or limited overshoot. 16 (high confidence) {Figure 2.16, 2.2, 2.4, Table 3.4, 3.4, 6.3}
B.3 Regional contributions17 to global GHG emissions continue to differ widely. Variations in regional, and national per capita emissions partly reflect different development stages, but they also vary widely at similar income levels. The 10% of households with the highest per capita emissions contribute a disproportionately large share of global household GHG emissions. At least 18 countries have sustained GHG emission reductions for longer than 10 years. ( high confidence) Expand Figure SPM.2 Links to chaptersFigure 1.1, Figure 2.9, Figure 2.10, Figure 2.25, 2.2, 2.3, 2.4, 2.5, 2.6, Figure TS.4, Figure TS.5
B.3.1GHG emissions trends over 1990–2019 vary widely across regions and over time, and across different stages of development, as shown in Figure SPM.2. Average global per capita net anthropogenic GHG emissions increased from 7.7 to 7.8 tCO2-eq, ranging from 2.6 tCO2-eq to 19 tCO2-eq across regions. Least developed countries (LDCs) and Small Island Developing States (SIDS) have much lower per capita emissions (1.7 tCO2-eq and 4.6 tCO2-eq, respectively) than the global average (6.9 tCO2-eq), excluding CO2-LULUCF. 18 (high confidence) (Figure SPM.2) {Figure1.2, Figure 2.9, Figure 2.10, 2.2, Figure TS.4}
B.3.2Historical contributions to cumulative net anthropogenic CO2 emissions between 1850 and 2019 vary substantially across regions in terms of total magnitude, but also in terms of contributions to CO2-FFI (1650 ± 73 GtCO2-eq) and net CO2-LULUCF (760 ± 220 GtCO2-eq) emissions. 10Globally, the major share of cumulative CO2-FFI emissions is concentrated in a few regions, while cumulative CO2-LULUCF9 emissions are concentrated in other regions. LDCs contributed less than 0.4% of historical cumulative CO2-FFI emissions between 1850 and 2019, while SIDS contributed 0.5%. (high confidence) (Figure SPM.2) {Figure 2.10, 2.2, TS.3, Figure 2.7}
B.3.3In 2019, around 48% of the global population lives in countries emitting on average more than 6 tCO2-eq per capita, excluding CO2-LULUCF. 35% live in countries emitting more than 9 tCO2-eq per capita. Another 41% live in countries emitting less than 3 tCO2-eq per capita. A substantial share of the population in these low-emitting countries lack access to modern energy services. 19 Eradicating extreme poverty, energy poverty, and providing decent living standards 20 to all in these regions in the context of achieving sustainable development objectives, in the near-term, can be achieved without significant global emissions growth. (high confidence) (Figure SPM.2) {Figure 1.2, 2.2, 2.4, 2.6, 3.7, 4.2, 6.7, Figure TS.4, Figure TS.5}
B.3.4Globally, the 10% of households with the highest per capita emissions contribute 34–45% of global consumption-based household GHG emissions, 21 while the middle 40% contribute 40–53%, and the bottom 50% contribute 13–15%. (high confidence) {2.6, Figure 2.25}
B.3.5At least 18 countries have sustained production-based GHG and consumption-based CO2 emission reductions for longer than 10 years. Reductions were linked to energy supply decarbonisation, energy efficiency gains, and energy demand reduction, which resulted from both policies and changes in economic structure. Some countries have reduced production-based GHG emissions by a third or more since peaking, and some have achieved several years of consecutive reduction rates of around 4% yr –1, comparable to global reductions in scenarios limiting warming to 2°C (>67%) or lower. These reductions have only partly offset global emissions growth. (high confidence) (Figure SPM.2) {Figure TS.4, 2.2, 1.3.2}
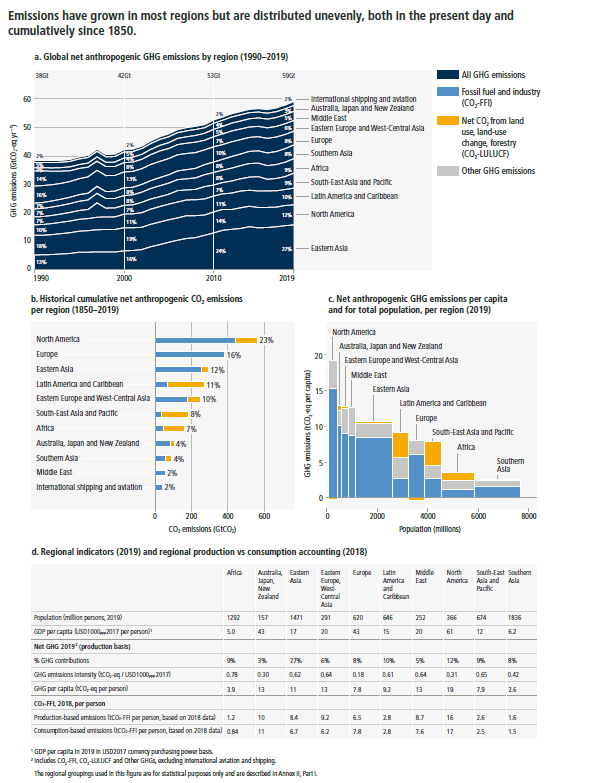
Figure SPM.2: Regional GHG emissions, and the regional proportion of total cumulativeproduction-basedCO2 emissions from 1850 to 2019. Panel a shows global net anthropogenic GHG emissions by region (in GtCO2-eq yr –1 (GWP100-AR6)) for the time period 1990–2019. 6Percentage values refer to the contribution of each region to total GHG emissions in each respective time period. The single-year peak of emissions in 1997 was due to higher CO2-LULUCF emissions from a forest and peat fire event in South East Asia. Regions are as grouped in Annex II. Panel b shows the share of historical cumulative net anthropogenic CO2 emissions per region from 1850 to 2019 in GtCO2. This includes CO2 from fossil fuel combustion and industrial processes (CO2-FFI) and net CO2 emissions from land use, land-use change, forestry (CO2-LULUCF). Other GHG emissions are not included. 6CO2-LULUCF emissions are subject to high uncertainties, reflected by a global uncertainty estimate of ±70% (90% confidence interval). Panel c shows the distribution of regional GHG emissions in tonnes CO2-eq per capita by region in 2019. GHG emissions are categorised into: CO2-FFI; net CO2-LULUCF; and other GHG emissions (methane, nitrous oxide, fluorinated gases, expressed in CO2-eq using GWP100-AR6). The height of each rectangle shows per capita emissions, the width shows the population of the region, so that the area of the rectangles refers to the total emissions for each region. Emissions from international aviation and shipping are not included. In the case of two regions, the area for CO2-LULUCF is below the axis, indicating net CO2 removals rather than emissions. CO2-LULUCF emissions are subject to high uncertainties, reflected by a global uncertainty estimate of ±70% (90% confidence interval). Panel d shows population, GDP per person, emission indicators by region in 2019 for percentage GHG contributions, total GHG per person, and total GHG emissions intensity, together with production-based and consumption-based CO2-FFI data, which is assessed in this report up to 2018. Consumption-based emissions are emissions released to the atmosphere in order to generate the goods and services consumed by a certain entity (e.g., region). Emissions from international aviation and shipping are not included. {1.3, Figure 1.2, 2.2, Figure 2.9, Figure 2.10, Figure 2.11, Annex II}
B.4 The unit costs of several low-emission technologies have fallen continuously since 2010. Innovation policy packages have enabled these cost reductions and supported global adoption. Both tailored policies and comprehensive policies addressing innovation systems have helped overcome the distributional, environmental and social impacts potentially associated with global diffusion of low-emission technologies. Innovation has lagged in developing countries due to weaker enabling conditions. Digitalisation can enable emission reductions, but can have adverse side effects unless appropriately governed. (high confidence) Expand Figure SPM.3 Links to chapters2.2, 6.3, 6.4, 7.2, 12.2, 16.2, 16.4, 16.5, Cross-Chapter Box 11 in Chapter 16
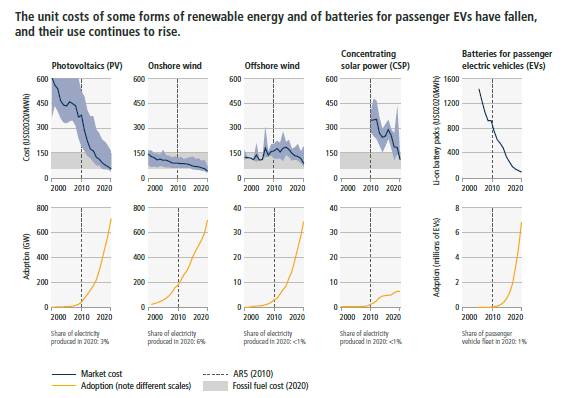
Figure SPM.3 | Unit cost reductions and use in some rapidly changing mitigation technologies. The top panel shows global costs per unit of energy (USD per MWh) for some rapidly changing mitigation technologies. Solid blue lines indicate average unit cost in each year. Light blue shaded areas show the range between the 5th and 95th percentiles in each year. Grey shading indicates the range of unit costs for new fossil fuel (coal and gas) power in 2020 (corresponding to USD55–148 per MWh). In 2020, the levelised costs of energy (LCOE) of the four renewable energy technologies could compete with fossil fuels in many places. For batteries, costs shown are for 1 kWh of battery storage capacity; for the others, costs are LCOE, which includes installation, capital, operations, and maintenance costs per MWh of electricity produced. The literature uses LCOE because it allows consistent comparisons of cost trends across a diverse set of energy technologies to be made. However, it does not include the costs of grid integration or climate impacts. Further, LCOE does not take into account other environmental and social externalities that may modify the overall (monetary and non-monetary) costs of technologies and alter their deployment. The bottom panel shows cumulative global adoption for each technology, in GW of installed capacity for renewable energy and in millions of vehicles for battery-electric vehicles. A vertical dashed line is placed in 2010 to indicate the change since AR5. Shares of electricity produced and share of passenger vehicle fleet are indicated in text for 2020 based on provisional data, i.e., percentage of total electricity production (for PV, onshore wind, offshore wind, CSP) and of total stock of passenger vehicles (for EVs). The electricity production share reflects different capacity factors; for example, for the same amount of installed capacity, wind produces about twice as much electricity as solar PV. {2.5, 6.4} Renewable energy and battery technologies were selected as illustrative examples because they have recently shown rapid changes in costs and adoption, and because consistent data are available. Other mitigation options assessed in the report are not included as they do not meet these criteria.
B.4.1From 2010 to 2019, there have been sustained decreases in the unit costs of solar energy (85%), wind energy (55%), and lithium-ion batteries (85%), and large increases in their deployment, e.g., >10× for solar and >100× for electric vehicles (EVs), varying widely across regions (Figure SPM.3). The mix of policy instruments which reduced costs and stimulated adoption includes public R&D, funding for demonstration and pilot projects, and demand pull instruments such as deployment subsidies to attain scale. In comparison to modular small-unit size technologies, the empirical record shows that multiple large-scale mitigation technologies, with fewer opportunities for learning, have seen minimal cost reductions and their adoption has grown slowly. (high confidence) {1.3, 1.5, Figure 2.5, 2.5, 6.3, 6.4, 7.2, 11.3, 12.2, 12.3, 12.6, 13.6, 16.3, 16.4, 16.6}
B.4.2Policy packages tailored to national contexts and technological characteristics have been effective in supporting low-emission innovation and technology diffusion. Appropriately designed policies and governance have helped address distributional impacts and rebound effects. Innovation has provided opportunities to lower emissions and reduce emission growth and created social and environmental co-benefits (high confidence). Adoption of low-emission technologies lags in most developing countries, particularly least developed ones, due in part to weaker enabling conditions, including limited finance, technology development and transfer, and capacity. In many countries, especially those with limited institutional capacities, several adverse side effects have been observed as a result of diffusion of low-emission technology, for example, low-value employment, and dependency on foreign knowledge and suppliers. Low-emission innovation along with strengthened enabling conditions can reinforce development benefits, which can, in turn, create feedbacks towards greater public support for policy. (medium confidence) {9.9, 13.6, 13.7, 16.3, 16.4, 16.5, 16.6, Cross-Chapter Box 12 in Chapter 16, TS.3}
B.4.3Digital technologies can contribute to mitigation of climate change and the achievement of several SDGs (high confidence). For example, sensors, internet of things, robotics, and artificial intelligence can improve energy management in all sectors, increase energy efficiency, and promote the adoption of many low-emission technologies, including decentralised renewable energy, while creating economic opportunities (high confidence). However, some of these climate change mitigation gains can be reduced or counterbalanced by growth in demand for goods and services due to the use of digital devices (high confidence). Digitalisation can involve trade-offs across several SDGs, for example, increasing electronic waste, negative impacts on labour markets, and exacerbating the existing digital divide. Digital technology supports decarbonisation only if appropriately governed (high confidence). {5.3, 10, 12.6, 16.2, Cross-Chapter Box 11 in Chapter 16, TS.5, Box TS.14}
B.5There has been a consistent expansion of policies and laws addressing mitigation since AR5. This has led to the avoidance of emissions that would otherwise have occurred and increased investment in low-GHG technologies and infrastructure. Policy coverage of emissions is uneven across sectors. Progress on the alignment of financial flows towards the goals of the Paris Agreement remains slow and tracked climate finance flows are distributed unevenly across regions and sectors. (high confidence) ExpandLinks to chapters5.6, 13.2, 13.4, 13.5, 13.6, 13.9, 14.3, 14.4, 14.5, Cross-Chapter Box 10 in Chapter 14, 15.3, 15.5
B.5.1The Kyoto Protocol led to reduced emissions in some countries and was instrumental in building national and international capacity for GHG reporting, accounting and emissions markets (high confidence). At least 18 countries that had Kyoto targets for the first commitment period have had sustained absolute emission reductions for at least a decade from 2005, of which two were countries with economies in transition (very high confidence). The Paris Agreement, with near universal participation, has led to policy development and target-setting at national and sub-national levels, in particular in relation to mitigation, as well as enhanced transparency of climate action and support (medium confidence). {14.3, 14.6}
B.5.2The application of diverse policy instruments for mitigation at the national and sub-national levels has grown consistently across a range of sectors (high confidence). By 2020, over 20% of global GHG emissions were covered by carbon taxes or emissions trading systems, although coverage and prices have been insufficient to achieve deep reductions (medium confidence). By 2020, there were ‘direct’ climate laws focused primarily on GHG reductions in 56 countries covering 53% of global emissions (medium confidence). Policy coverage remains limited for emissions from agriculture and the production of industrial materials and feedstocks (high confidence). {5.6, 7.6, 11.5, 11.6, 13.2, 13.6}
B.5.3In many countries, policies have enhanced energy efficiency, reduced rates of deforestation and accelerated technology deployment, leading to avoided and in some cases reduced or removed emissions (high confidence). Multiple lines of evidence suggest that mitigation policies have led to avoided global emissions of several GtCO2-eq yr –1 (medium confidence). At least 1.8 GtCO2-eq yr –1 can be accounted for by aggregating separate estimates for the effects of economic and regulatory instruments. Growing numbers of laws and executive orders have impacted global emissions and were estimated to result in 5.9 GtCO2-eq yr –1 less emissions in 2016 than they otherwise would have been. (medium confidence) (Figure SPM.3) {2.2, 2.8, 6.7, 7.6, 9.9, 10.8, 13.6, Cross-chapter Box 10 in Chapter 14}
B.5.4Annual tracked total financial flows for climate mitigation and adaptation increased by up to 60% between 2013/14 and 2019/20 (in USD2015), but average growth has slowed since 201822 (medium confidence). These financial flows remained heavily focused on mitigation, are uneven, and have developed heterogeneously across regions and sectors (high confidence). In 2018, public and publicly mobilised private climate finance flows from developed to developing countries were below the collective goal under the UNFCCC and Paris Agreement to mobilise USD100 billion per year by 2020 in the context of meaningful mitigation action and transparency on implementation (medium confidence). Public and private finance flows for fossil fuels are still greater than those for climate adaptation and mitigation (high confidence). Markets for green bonds, ESG (environmental, social and governance) and sustainable finance products have expanded significantly since AR5. Challenges remain, in particular around integrity and additionality, as well as the limited applicability of these markets to many developing countries. (high confidence){Box 15.4, 15.3, 15.5, 15.6, Box 15.7}
B.6 Global GHG emissions in 2030 associated with the implementation of Nationally Determined Contributions (NDCs) announced prior to COP2623 would make it likely that warming will exceed 1.5°C during the 21st century. 24 Likely limiting warming to below 2°C would then rely on a rapid acceleration of mitigation efforts after 2030. Policies implemented by the end of 202025 are projected to result in higher global GHG emissions than those implied by NDCs. (high confidence) Expand Figure SPM.4 Links to chapters3.3, 3.5, 4.2, Cross-Chapter Box 4 in Chapter 4
B.6.1Policies implemented by the end of 2020 are projected to result in higher global GHG emissions than those implied by NDCs, indicating an implementation gap. A gap remains between global GHG emissions in 2030 associated with the implementation of NDCs announced prior to COP26 and those associated with modelled mitigation pathways assuming immediate action (for quantification see Table SPM.1). 26 The magnitude of the emissions gap depends on the global warming level considered and whether only unconditional or also conditional elements of NDCs 27 are considered. 28 (high confidence) {3.5, 4.2, Cross-Chapter Box 4 in Chapter 4}
Table SPM.1 | Projected global emissions in 2030 associated with policies implemented by the end of 2020 and NDCs announced prior to COP26, and associated emissions gaps. *Emissions projections for 2030 and absolute differences in emissions are based on emissions of 52–56 GtCO2-eq yr –1 in 2019 as assumed in underlying model studies. (medium confidence) {4.2, Table 4.3, Cross-Chapter Box 4 in Chapter 4}
Implied by policies implemented by the end of 2020 (GtCO2-eq yr –1) | Implied by NDCs announced prior to COP26 | ||
Unconditional elements (GtCO2-eq yr –1) | Including conditional elements (GtCO2-eq yr –1) | ||
Median projected global emissions (min–max)* | 57 [52–60] | 53 [50–57] | 50 [47–55] |
Implementation gap between implemented policies and NDCs (median) | 4 | 7 | |
Emissions gap between NDCs and pathways that limit warming to 2°C (>67%) with immediate action | 10–16 | 6–14 | |
Emissions gap between NDCs and pathways that limit warming to 1.5°C (>50%) with no or limited overshoot with immediate action | 19–26 | 16–23 | |
B.6.2Global emissions in 2030 associated with the implementation of NDCs announced prior to COP26 are lower than the emissions implied by the original NDCs 29 (high confidence). The original emissions gap has fallen by about 20% to one-third relative to pathways that limit warming to 2°C (>67%) with immediate action (category C3a in Table SPM.2), and by about 15–20% relative to pathways limiting warming to 1.5°C (>50%) with no or limited overshoot (category C1 in Table SPM.2) (medium confidence). (Figure SPM.4) {3.5, 4.2, Cross-Chapter Box 4 in Chapter 4}
B.6.3Modelled global emission pathways consistent with NDCs announced prior to COP26 that limit warming to 2°C (>67%) (category C3b in Table SPM.2) imply annual average global GHG emissions reduction rates of 0–0.7 GtCO2-eq yr –1 during the decade 2020–2030, with an unprecedented acceleration to 1.4–2.0 GtCO2-eq yr –1 during 2030–2050 (medium confidence). Continued investments in unabated high-emitting infrastructure and limited development and deployment of low-emitting alternatives prior to 2030 would act as barriers to this acceleration and increase feasibility risks (high confidence). {3.3, 3.5, 3.8, Cross-Chapter Box 5 in Chapter 4}
B.6.4Modelled global emission pathways consistent with NDCs announced prior to COP26 will likely exceed 1.5°C during the 21st century. Those pathways that then return warming to 1.5°C by 2100 with a likelihood of 50% or greater imply a temperature overshoot of 0.15°C–0.3°C (42 pathways in category C2 in Table SPM.2). In such pathways, global cumulative net-negative CO2 emissions are –380 [–860 to –200] GtCO230 in the second half of the century, and there is a rapid acceleration of other mitigation efforts across all sectors after 2030. Such overshoot pathways imply increased climate-related risk, and are subject to increased feasibility concerns, 31 and greater social and environmental risks, compared to pathways that limit warming to 1.5°C (>50%) with no or limited overshoot. (high confidence) (Figure SPM.4, Table SPM.2) {3.3, 3.5, 3.8, 12.3; AR6 WGII SPM B.6}
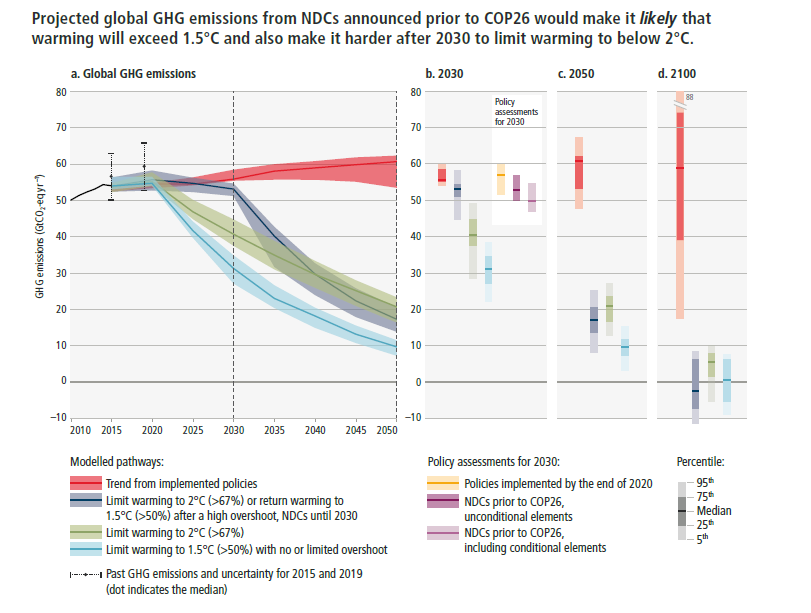
Figure SPM.4: Global GHG emissions of modelled pathways (funnels in Panel a, and associated bars in Panels b, c, d) and projected emission outcomes from near-termpolicy assessments for 2030 (Panel b). Panel a shows global GHG emissions over 2015–2050 for four types of assessed modelled global pathways:
–Trend from implemented policies: Pathways with projected near-term GHG emissions in line with policies implemented until the end of 2020 and extended with comparable ambition levels beyond 2030 (29 scenarios across categories C5–C7, Table SPM.2).
–Limit to 2°C (>67%) or return warming to 1.5°C (>50%) after a high overshoot, NDCs until 2030: Pathways with GHG emissions until 2030 associated with the implementation of NDCs announced prior to COP26, followed by accelerated emissions reductions likely to limit warming to 2°C (C3b, Table SPM.2) or to return warming to 1.5°C with a probability of 50% or greater after high overshoot (subset of 42 scenarios from C2, Table SPM.2).
–Limit to 2°C (>67%) with immediate action: Pathways that limit warming to 2°C (>67%) with immediate action after 202026 (C3a, Table SPM.2).
–Limit to 1.5°C (>50%) with no or limited overshoot: Pathways limiting warming to 1.5°C with no or limited overshoot (C1, Table SPM.2 C1). All these pathways assume immediate action after 2020.
Past GHG emissions for 2010–2015 used to project global warming outcomes of the modelled pathways are shown by a black line 32 and past global GHG emissions in 2015 and 2019 as assessed in Chapter 2 are shown by whiskers. Panels b, c and d show snapshots of the GHG emission ranges of the modelled pathways in 2030, 2050, and 2100, respectively. Panel b also shows projected emissions outcomes from near-term policy assessments in 2030 from Chapter 4.2 (Tables 4.2 and 4.3; median and full range). GHG emissions are in CO2-equivalent using GWP100 from AR6 WGI. {3.5, 4.2, Table 4.2, Table 4.3, Cross-Chapter Box 4 in Chapter 4}
B.7Projected cumulative future CO2 emissions over the lifetime of existing and currently planned fossil fuel infrastructure without additional abatement exceed the total cumulative net CO2 emissions in pathways that limit warming to 1.5°C (>50%) with no or limited overshoot. They are approximately equal to total cumulative net CO2 emissions in pathways that limit warming to 2°C (>67%). (high confidence)ExpandLinks to chapters2.7, 3.3
B.7.1If historical operating patterns are maintained, 33 and without additional abatement, 34 estimated cumulative future CO2 emissions from existing fossil fuel infrastructure, the majority of which is in the power sector, would, from 2018 until the end of its lifetime, amount to 660 [460–890] GtCO2. They would amount to 850 [600–1100] GtCO2 when unabated emissions from currently planned infrastructure in the power sector is included. These estimates compare with cumulative global net CO2 emissions from all sectors of 510 [330–710] GtCO2 until the time of reaching net zero CO2 emissions 35 in pathways that limit warming to 1.5°C (>50%) with no or limited overshoot, and 890 [640–1160] GtCO2 in pathways that limit warming to 2°C (>67%). (high confidence) (Table SPM.2) {2.7, Figure 2.26, Figure TS.8}
B.7.2In modelled global pathways that limit warming to 2°C (>67%) or lower, most remaining fossil fuel CO2 emissions until the time of global net zero CO2 emissions are projected to occur outside the power sector, mainly in industry and transport. Decommissioning and reduced utilisation of existing fossil fuel-based power sector infrastructure, retrofitting existing installations with CCS, 36 switches to low-carbon fuels, and cancellation of new coal installations without CCS are major options that can contribute to aligning future CO2 emissions from the power sector with emissions in the assessed global modelled least-cost pathways. The most appropriate strategies will depend on national and regional circumstances, including enabling conditions and technology availability. (high confidence) (Box SPM.1) {Table 2.7, 2.7, 3.4, 6.3, 6.5, 6.7}
C. System Transformations to Limit Global Warming
C.1Global GHG emissions are projected to peak between 2020 and at the latest before 2025 in global modelled pathways that limit warming to 1.5°C (>50%) with no or limited overshoot and in those that limit warming to 2°C (>67%) and assume immediate action (see Table SPM.2 footnote i). 37 In both types of modelled pathways, rapid and deep GHG emissions reductions follow throughout 2030, 2040 and 2050 (high confidence). Without a strengthening of policies beyond those that are implemented by the end of 2020, GHG emissions are projected to rise beyond 2025, leading to a median global warming of 3.2 [2.2 to 3.5] °C by 210038,39 (medium confidence).Expand Table SPM.2 Figure SPM.4 Figure SPM.5Links to chapters3.3, 3.4
C.1.1Net global GHG emissions are projected to fall from 2019 levels by 27% [13–45%] by 2030 and 63% [52–76%]40 by 2050 in global modelled pathways that limit warming to 2°C (>67%) and assuming immediate action (category C3a, Table SPM.2). This compares with reductions of 43% [34–60%] by 2030 and 84% [73–98%] by 2050 in pathways that limit warming to 1.5°C (>50%) with no or limited overshoot (C1, Table SPM.2) (high confidence). 41 In modelled pathways that return warming to 1.5°C (>50%) after a high overshoot, 42 GHG emissions are reduced by 23% [0–44%] in 2030 and by 75% [62–91%] in 2050 (C2, Table SPM.2) (high confidence). Modelled pathways that are consistent with NDCs announced prior to COP26 until 2030 and assume no increase in ambition thereafter have higher emissions, leading to a median global warming of 2.8 [2.1–3.4] °C by 2100 (medium confidence). 23 (Figure SPM.4) {3.3}
Table SPM.2 | Key characteristics of the modelled global emissions pathways. Summary of projected CO2 and GHG emissions, projected net zero timings and the resulting global warming outcomes. Pathways are categorised (rows), according to their likelihood of limiting warming to different peak warming levels (if peak temperature occurs before 2100) and 2100 warming levels. Values shown are for the median [p50] and 5th–95th percentiles [p5–p95], noting that not all pathways achieve net zero CO2 or GHGs.
p50 [p5–p95]a | GHG emissions (GtCO2-eqyr–1) g | GHG emissions reductions from 2019 (%) h | Emissions milestonesi, j | Cumulative CO2 emissions (GtCO2) m | Cumulativenet-negativeCO2 emissions (GtCO2) | Global mean temperature changes 50% probability (°C) n | Likelihood of peak global warming staying below (%) o | |||||||||||||
Categoryb, c, d[# pathways] | Category/subset label | WGI SSP & WGIII IPs/IMPsalignment e, f | 2030 | 2040 | 2050 | 2030 | 2040 | 2050 | Peak CO2 emissions (% peak before 2100) | Peak GHG emissions (% peak before 2100) | Net zeroCO2(%net zeropathways) | Net zeroGHGs (%net zeropathways) k, l | 2020 tonet zeroCO2 | 2020–2100 | Year of net zeroCO2to 2100 | at peak warming | 2100 | <1.5°C | <2.0°C | <3.0°C |
Modelled global emissions pathways categorised by projected global warming levels (GWL). Detailed likelihood definitions are provided in SPM Box 1. The five illustrative scenarios (SSPx-yy) considered by AR6 WGI and the Illustrative (Mitigation) Pathways assessed in WGIII are aligned with the temperature categories and are indicated in a separate column. Global emission pathways contain regionally differentiated information. This assessment focuses on their global characteristics. | Projected median annual GHG emissions in the year across the scenarios, with the 5th–95th percentile in brackets. Modelled GHG emissions in 2019: 55 [53–58]GtCO2-eq. | Projected median GHG emissions reductions of pathways in the year across the scenarios compared to modelled 2019, with the 5th–95th percentile in brackets. Negative numbers indicate increase in emissions compared to 2019. | Median 5-year intervals at which projected CO2& GHG emissions peak, with the 5th–95th percentile interval in square brackets. Percentage of peaking pathways is denoted in round brackets. Three dots (…) denotes emissions peak in 2100 or beyond for that percentile. | Median 5-year intervals at which projected CO2& GHG emissions of pathways in this category reachnet zero, with the 5th–95th percentile interval in square brackets. Percentage of net zero pathways is denoted in round brackets. Three dots (…) denotes net zero not reached for that percentile. | Median cumulative net CO2 emissions across the projected scenarios in this category until reachingnet zeroor until 2100, with the5th–95thpercentile interval in square brackets. | Median cumulativenet-negativeCO2 emissions between the year of net zeroCO2and 2100. Morenet-negativeresults in greater temperature declines after peak. | Projected temperature change of pathways in this category (50% probability across the range of climate uncertainties), relative to 1850–1900, at peak warming and in 2100, for the median value across the scenarios and the 5th–95th percentile interval in square brackets. | Median likelihood that the projected pathways in this category stay below a given global warming level, with the 5th–95th percentile interval in square brackets. | ||||||||||||
C1 [97] | limit warming to 1.5°C (>50%) with no or limited overshoot | 31 [21–36] | 17 [6–23] | 9 [1–15] | 43 [34–60] | 69 [58–90] | 84 [73–98] | 2020–2025 (100%) [2020–2025] | 2050–2055 (100%) [2035–2070] | 2095–2100 (52%) [2050–...] | 510 [330–710] | 320 [–210 to 570] | –220 [–660 to –20] | 1.6 [1.4–1.6] | 1.3 [1.1–1.5] | 38 [33–58] | 90 [86–97] | 100 [99–100] | ||
C1a [50] | … withnet zeroGHGs | SSP1–1.9, SP LD | 33 [22–37] | 18 [6–24] | 8 [0–15] | 41 [31–59] | 66 [58–89] | 85 [72–100] | 2070–2075 (100%) [2050–2090] | 550 [340–760] | 160 [–220 to 620] | –360 [–680 to –140] | 1.6 [1.4–1.6] | 1.2 [1.1–1.4] | 38 [34–60] | 90 [85–98] | 100 [99–100] | |||
C1b [47] | … without net zeroGHGs | Ren | 29 [21–36] | 16 [7–21] | 9 [4–13] | 48 [35–61] | 70 [62–87] | 84 [76–93] | …–… [0%] | 460 [320–590] | 360 [10–540] | –60 [–440 to 0] | 1.6 [1.5–1.6] | 1.4 [1.3–1.5] | 37 [33–56] | 89 [87–96] | 100 [99–100] | |||
[…–…] | ||||||||||||||||||||
C2 [133] | return warming to 1.5°C (>50%) after a high overshoot | Neg | 42 [31–55] | 25 [17–34] | 14 [5–21] | 23 [0–44] | 55 [40–71] | 75 [62–91] | 2020–2025 (100%) | 2055–2060 (100%) [2045–2070] | 2070–2075 (87%) [2055–...] | 720 [530–930] | 400 [–90 to 620] | –360 [–680 to –60] | 1.7 [1.5–1.8] | 1.4 [1.2–1.5] | 24 [15–42] | 82 [71–93] | 100 [99–100] | |
[2020–2030] | [2020–2025] | |||||||||||||||||||
C3 [311] | limit warming to 2°C (>67%) | 44 [32–55] | 29 [20–36] | 20 [13–26] | 21 [1–42] | 46 [34–63] | 64 [53–77] | 2020–2025 (100%) | 2070–2075 (93%) [2055–...] | ...–... (30%) [2075–...] | 890 [640–1160] | 800 [510–1140] | –40 [–290 to 0] | 1.7 [1.6–1.8] | 1.6 [1.5–1.8] | 20 [13–41] | 76 [68–91] | 99 [98–100] | ||
[2020–2030] | [2020–2025] | |||||||||||||||||||
C3a [204] | … with action starting in 2020 | SSP1–2.6 | 40 [30–49] | 29 [21–36] | 20 [14–27] | 27 [13–45] | 47 [35–63] | 63 [52–76] | 2020–2025 (100%) [2020–2025] | 2070–2075 (91%) [2055–...] | ...–... (24%) [2080–...] | 860 [640–1180] | 790 [480–1150] | –30 [–280 to 0] | 1.7 [1.6–1.8] | 1.6 [1.5–1.8] | 21 [14–42] | 78 [69–91] | 100 [98–100] | |
C3b [97] | … NDCs until 2030 | GS | 52 [47–56] | 29 [20–36] | 18 [10–25] | 5 [0–14] | 46 [34–63] | 68 [56–82] | 2020–2025 (100%) [2020–2030] | 2065–2070 (97%) [2055–2090] | ...–... (41%) [2075–...] | 910 [720–1150] | 800 [560–1050] | –60 [–300 to 0] | 1.8 [1.6–1.8] | 1.6 [1.5–1.7] | 17 [12–35] | 73 [67–87] | 99 [98–99] | |
C4 [159] | limit warming to 2°C (>50%) | 50 [41–56] | 38 [28–44] | 28 [19–35] | 10 [0–27] | 31 [20–50] | 49 [35–65] | 2080–2085 (86%) [2065–...] | ...–... (31%) [2075–...] | 1210 [970–1490] | 1160 [700–1490] | –30 [–390 to 0] | 1.9 [1.7–2.0] | 1.8 [1.5–2.0] | 11 [7–22] | 59 [50–77] | 98 [95–99] | |||
C5 [212] | limit warming to 2.5°C (>50%) | 52 [46–56] | 45 [37–53] | 39 [30–49] | 6 [–1 to 18] | 18 [4–33] | 29 [11–48] | ...–... (41%) [2080–...] | ...–... (12%) [2090–...] | 1780 [1400–2360] | 1780 [1260–2360] | 0 [–160 to 0] | 2.2 [1.9–2.5] | 2.1 [1.9–2.5] | 4 [0–10] | 37 [18–59] | 91 [83–98] | |||
C6 [97] | limit warming to 3°C (>50%) | SSP2–4.5 ModAct | 54 [50–62] | 53 [48–61] | 52 [45–57] | 2 [–10 to 11] | 3 [–14 to 14] | 5 [–2 to 18] | 2030–2035 (96%) | 2020–2025 (97%) | nonet zero | nonet zero | 2790 [2440–3520] | nonet zero | temperaturedoes not peak by 2100 | 2.7 [2.4–2.9] | 0 [0–0] | 8 [2–18] | 71 [53–88] | |
[2020–2090] | ||||||||||||||||||||
C7 [164] | limit warming to 4°C (>50%) | SSP3–7.0 CurPol | 62 [53–69] | 67 [56–76] | 70 [58–83] | –11 [–18 to 3] | –19 [–31 to 1] | –24 [–41 to –2] | 2085–2090 (57%) | 2090–2095 (56%) | 4220 [3160–5000] | 3.5 [2.8–3.9] | 0 [0–0] | 0 [0–2] | 22 [7–60] | |||||
[2040–...] | ||||||||||||||||||||
C8 [29] | exceed warming of 4°C (≥50%) | SSP5–8.5 | 71 [69–81] | 80 [78–96] | 88 [82–112] | –20 [–34 to –17] | –35 [–65 to –29] | –46 [–92 to –36] | 2080–2085 (90%) [2070–...] | 5600 | 4.2 [3.7–5.0] | 0 [0–0] | 0 [0–0] | 4 [0–11] | ||||||
[4910–7450] | ||||||||||||||||||||
aValues in the table refer to the 50th and [5th–95th] percentile values across the pathways falling within a given category as defined in Box SPM.1. For emissions-related columns these values relate to the distribution of all the pathways in that category. Harmonised emissions values are given for consistency with projected global warming outcomes using climate emulators. Based on the assessment of climate emulators in AR6 WGI (WG1 Chapter 7, Box 7.1), two climate emulators are used for the probabilistic assessment of the resulting warming of the pathways. For the ‘Temperature change’ and ‘Likelihood’ columns, the single upper-row values represent the 50th percentile across the pathways in that category and the median [50th percentile] across the warming estimates of the probabilistic MAGICC climate model emulator. For the bracketed ranges, the median warming for every pathway in that category is calculated for each of the two climate model emulators (MAGICC and FaIR). Subsequently, the 5th and 95th percentile values across all pathways for each emulator are calculated. The coolest and warmest outcomes (i.e., the lowest p5 of two emulators, and the highest p95, respectively) are shown in square brackets. These ranges therefore cover both the uncertainty of the emissions pathways as well as the climate emulators’ uncertainty.
bFor a description of pathways categories see Box SPM.1.
cAll global warming levels are relative to 1850–1900. (See footnote n below and Box SPM.145 for more details.)
dC3 pathways are sub-categorised according to the timing of policy action to match the emissions pathways in Figure SPM.4. Two pathways derived from a cost-benefit analysis have been added to C3a, whilst 10 pathways with specifically designed near-term action until 2030, whose emissions fall below those implied by NDCs announced prior to COP26, are not included in either of the two subsets.
eAlignment with the categories of the illustrative SSP scenarios considered in AR6 WGI, and the Illustrative (Mitigation) Pathways (IPs/IMPs) of WGIII. The IMPs have common features such as deep and rapid emissions reductions, but also different combinations of sectoral mitigation strategies. See Box SPM.1 for an introduction of the IPs and IMPs, and Chapter 3 for full descriptions. {3.2, 3.3, Annex III.II.4}
f The Illustrative Mitigation Pathway ‘Neg’ has extensive use of carbon dioxide removal (CDR) in the AFOLU, energy and the industry sectors to achieve net negative emissions. Warming peaks around 2060 and declines to below 1.5°C (50% likelihood) shortly after 2100. Whilst technically classified as C3, it strongly exhibits the characteristics of C2 high-overshoot pathways, hence it has been placed in the C2 category. See Box SPM.1 for an introduction of the IPs and IMPs.
gThe 2019 range of harmonised GHG emissions across the pathways [53–58 GtCO2-eq] is within the uncertainty ranges of 2019 emissions assessed in Chapter 2 [53–66 GtCO2-eq]. 49 (Figure SPM.1, Figure SPM.2, Box SPM.1)
hRates of global emission reduction in mitigation pathways are reported on a pathway-by-pathway basis relative to harmonised modelled global emissions in 2019 rather than the global emissions reported in SPM Section B and Chapter 2; this ensures internal consistency in assumptions about emission sources and activities, as well as consistency with temperature projections based on the physical climate science assessment by WGI. 49{Annex III.II.2.5}. Negative values (e.g., in C7, C8) represent an increase in emissions.
iEmissions milestones are provided for five-year intervals in order to be consistent with the underlying five-year time-step data of the modelled pathways. Peak emissions (CO2 and GHGs) are assessed for five-year reporting intervals starting in 2020. The interval 2020–2025 signifies that projected emissions peak as soon as possible between 2020 and at latest before 2025. The upper five-year interval refers to the median interval within which the emissions peak or reach net zero. Ranges in square brackets underneath refer to the range across the pathways, comprising the lower bound of the 5th percentile five-year interval and the upper bound of the 95th percentile five-year interval. Numbers in round brackets signify the fraction of pathways that reach specific milestones.
jPercentiles reported across all pathways in that category include those that do not reach net zero before 2100 (fraction of pathways reaching net zero is given in round brackets). If the fraction of pathways that reach net zero before 2100 is lower than the fraction of pathways covered by a percentile (e.g., 0.95 for the 95th percentile), the percentile is not defined and denoted with ‘…’. The fraction of pathways reaching net zero includes all with reported non-harmonised, and/or harmonised emissions profiles that reach net zero. Pathways were counted when at least one of the two profiles fell below 100 MtCO2 yr –1 until 2100.
kThe timing of net zero is further discussed in SPM C2.4 and Cross-Chapter Box 3 in Chapter 3 on net zero CO2 and net zero GHG emissions.
lFor cases where models do not report all GHGs, missing GHG species are infilled and aggregated into a Kyoto basket of GHG emissions in CO2-eq defined by the 100-year global warming potential. For each pathway, reporting of CO2, CH4, and N2O emissions was the minimum required for the assessment of the climate response and the assignment to a climate category. Emissions pathways without climate assessment are not included in the ranges presented here. {See Annex III.II.5}
mCumulative emissions are calculated from the start of 2020 to the time of net zero and 2100, respectively. They are based on harmonised net CO2 emissions, ensuring consistency with the WGI assessment of the remaining carbon budget. 50{Box 3.4}
nGlobal mean temperature change for category (at peak, if peak temperature occurs before 2100, and in 2100) relative to 1850–1900, based on the median global warming for each pathway assessed using the probabilistic climate model emulators calibrated to the AR6 WGI assessment. 12 (See also Box SPM.1) {Annex III.II.2.5; WGI Cross-Chapter Box 7.1}
oProbability of staying below the temperature thresholds for the pathways in each category, taking into consideration the range of uncertainty from the climate model emulators consistent with the AR6 WGI assessment. The probabilities refer to the probability at peak temperature. Note that in the case of temperature overshoot (e.g., category C2 and some pathways in C1), the probabilities of staying below at the end of the century are higher than the probabilities at peak temperature.
C.1.2In modelled pathways that limit warming to 2°C (>67%) assuming immediate action, global net CO2 emissions are reduced compared to modelled 2019 emissions by 27% [11–46%] in 2030 and by 52% [36–70%] in 2040; and global CH4 emissions are reduced by 24% [9–53%] in 2030 and by 37% [20–60%] in 2040. In pathways that limit warming to 1.5°C (>50%) with no or limited overshoot global net CO2 emissions are reduced compared to modelled 2019 emissions by 48% [36–69%] in 2030 and by 80% [61–109%] in 2040; and global CH4 emissions are reduced by 34% [21–57%] in 2030 and 44% [31–63%] in 2040. There are similar reductions of non-CO2 emissions by 2050 in both types of pathways: CH4 is reduced by 45% [25–70%]; N2O is reduced by 20% [–5 to +55%]; and F-gases are reduced by 85% [20–90%]. 43 Across most modelled pathways, this is the maximum technical potential for anthropogenic CH4 reductions in the underlying models (high confidence). Further emissions reductions, as illustrated by the IMP-SP pathway, may be achieved through changes in activity levels and/or technological innovations beyond those represented in the majority of the pathways (medium confidence). Higher emissions reductions of CH4 could further reduce peak warming. (high confidence) (Figure SPM.5) {3.3}
C.1.3In modelled pathways consistent with the continuation of policies implemented by the end of 2020, GHG emissions continue to rise, leading to global warming of 3.2 [2.2–3.5] °C by 2100 (within C5–C7, Table SPM.2) (medium confidence). Pathways that exceed warming of >4°C (≥50%) (C8, SSP5-8.5, Table SPM.2) would imply a reversal of current technology and/or mitigation policy trends (medium confidence). Such warming could occur in emission pathways consistent with policies implemented by the end of 2020 if climate sensitivity is higher than central estimates (high confidence). (Table SPM.2, Figure SPM.4) {3.3, Box 3.3}
C.1.4Global modelled pathways falling into the lowest temperature category of the assessed literature (C1, Table SPM.2) are on average associated with a higher median peak warming in AR6 compared to pathways in the same category in SR1.5. In the modelled pathways in AR6, the likelihood of limiting warming to 1.5°C has on average declined compared to SR1.5. This is because GHG emissions have risen since 2017, and many recent pathways have higher projected emissions by 2030, higher cumulative net CO2 emissions and slightly later dates for reaching net zero CO2 or net zero GHG emissions. High mitigation challenges, for example, due to assumptions of slow technological change, high levels of global population growth, and high fragmentation as in the Shared Socio-economic Pathway SSP3, may render modelled pathways that limit warming to 2°C (>67%) or lower infeasible. (medium confidence) (Table SPM.2, Box SPM.1) {3.3, 3.8, Annex III Figure II.1, Annex III Figure II.3}
Box SPM.1 | Assessment of Modelled Global Emission Scenarios
A wide range of modelled global emission pathways and scenarios from the literature is assessed in this report, including pathways and scenarios with and without mitigation. 44 Emissions pathways and scenarios project the evolution of GHG emissions based on a set of internally consistent assumptions about future socio-economic conditions and related mitigation measures. 45 These are quantitative projections and are neither predictions nor forecasts. Around half of all modelled global emission scenarios assume cost-effective approaches that rely on least-cost emission abatement options globally. The other half look at existing policies and regionally and sectorally differentiated actions. Most do not make explicit assumptions about global equity, environmental justice or intra-regional income distribution. Global emission pathways, including those based on cost-effective approaches, contain regionally differentiated assumptions and outcomes, and have to be assessed with the careful recognition of these assumptions. This assessment focuses on their global characteristics. The majority of the assessed scenarios (about 80%) have become available since the SR1.5, but some were assessed in that report. Scenarios with and without mitigation were categorised based on their projected global warming over the 21st century, following the same scheme as in the SR1.5 for warming up to and including 2°C. {1.5, 3.2, 3.3, Annex III.II.2, Annex III.II.3}
Scenario categories are defined by their likelihood of exceeding global warming levels (at peak and in 2100) and referred to in this report as follows: 46 , 47
•Category C1 comprises modelled scenarios that limit warming to 1.5°C in 2100 with a likelihood of greater than 50%, and reach or exceed warming of 1.5°C during the 21st century with a likelihood of 67% or less. In this report, these scenarios are referred to as scenarios that limit warming to 1.5°C (>50%) with no or limited overshoot. Limited overshoot refers to exceeding 1.5°C global warming by up to about 0.1°C and for up to several decades. 48
•Category C2 comprises modelled scenarios that limit warming to 1.5°C in 2100 with a likelihood of greater than 50%, and exceed warming of 1.5°C during the 21st century with a likelihood of greater than 67%. In this report, these scenarios are also referred to as scenarios that return warming to 1.5°C (>50%) after a high overshoot. High overshoot refers to temporarily exceeding 1.5°C global warming by 0.1°C–0.3°C for up to several decades.
•Category C3 comprises modelled scenarios that limit peak warming to 2°C throughout the 21st century with a likelihood of greater than 67%. In this report, these scenarios are also referred to as scenarios that limit warming to 2°C (>67%).
•Categories C4, C5, C6 and C7 comprise modelled scenarios that limit warming to 2°C, 2.5°C, 3°C, 4°C, respectively, throughout the 21st century with a likelihood of greater than 50%. In some scenarios in C4 and many scenarios in C5–C7, warming continues beyond the 21st century.
•Category C8 comprises modelled scenarios that exceed warming of 4°C during the 21st century with a likelihood of 50% or greater. In these scenarios warming continues to rise beyond the 21st century.
Categories of modelled scenarios are distinct and do not overlap; they do not contain categories consistent with lower levels of global warming, for example, the category of C3 scenarios that limit warming to 2°C (>67%) does not include the C1 and C2 scenarios that limit or return warming to 1.5°C (>50%). Where relevant, scenarios belonging to the group of categories C1–C3 are referred to in this report as scenarios that limit warming to 2°C (>67%) or lower.
Methods to project global warming associated with the scenarios were updated to ensure consistency with the AR6 WGI assessment of physical climate science. 49 {3.2, Annex III.II.2.5; AR6 WGI Cross-Chapter Box 7.1}
These updated methods affect the categorisation of some scenarios. On average across scenarios, peak global warming is projected to be lower by up to about 0.05 [±0.1]°C than if the same scenarios were evaluated using the SR1.5 methodology, and global warming in 2100 is projected to be lower by about 0.1 [±0.1]°C. {Annex III.II.٢.٥.١, Annex III Figure II.٣}
Resulting changes to the emission characteristics of scenario categories described in Table SPM.2 interact with changes in the characteristics of the wider range of emission scenarios published since the SR1.5. Proportionally more scenarios assessed in AR6 are designed to limit temperature overshoot and more scenarios limit large-scale net negative CO2 emissions than in SR1.5. As a result, AR6 scenarios in the lowest temperature category (C1) generally reach net zero GHG emissions later in the 21st century than scenarios in the same category assessed in SR1.5, and about half do not reach net zero GHG by 2100. The rate of decline of GHG emissions in the near term by 2030 in category C1 scenarios is very similar to the assessed rate in SR1.5, but absolute GHG emissions of category C1 scenarios in AR6 are slightly higher in 2030 than in SR1.5, since the reductions start from a higher emissions level in 2020. (Table SPM.2) {Annex III, 2.5, 3.2, 3.3}
The large number of global emissions scenarios assessed, including 1202 scenarios with projected global warming outcomes using climate emulators, come from a wide range of modelling approaches. They include the five illustrative scenarios (Shared Socio-economic Pathways; SSPs) assessed by WGI for their climate outcomes but cover a wider and more varied set in terms of assumptions and modelled outcomes. For this assessment, Illustrative Mitigation Pathways (IMPs) were selected from this larger set to illustrate a range of different mitigation strategies that would be consistent with different warming levels. The IMPs illustrate pathways that achieve deep and rapid emissions reductions through different combinations of mitigation strategies. The IMPs are not intended to be comprehensive and do not address all possible themes in the underlying report. They differ in terms of their focus, for example, placing greater emphasis on renewables (IMP-Ren), deployment of carbon dioxide removal that results in net negative global GHG emissions (IMP-Neg), and efficient resource use as well as shifts in consumption patterns globally, leading to low demand for resources, while ensuring a high level of services and satisfying basic needs (IMP-LD) (Figure SPM.5). Other IMPs illustrate the implications of a less rapid introduction of mitigation measures followed by a subsequent gradual strengthening (IMP-GS), and how shifting global pathways towards sustainable development, including by reducing inequality, can lead to mitigation (IMP-SP). The IMPs reach different climate goals as indicated in Table SPM.2 and Box SPM.1, Figure 1. {1.5, 3.1, 3.2, 3.3, 3.6, Figure 3.7, Figure 3.8, Box 3.4, Annex III.II.2.4}
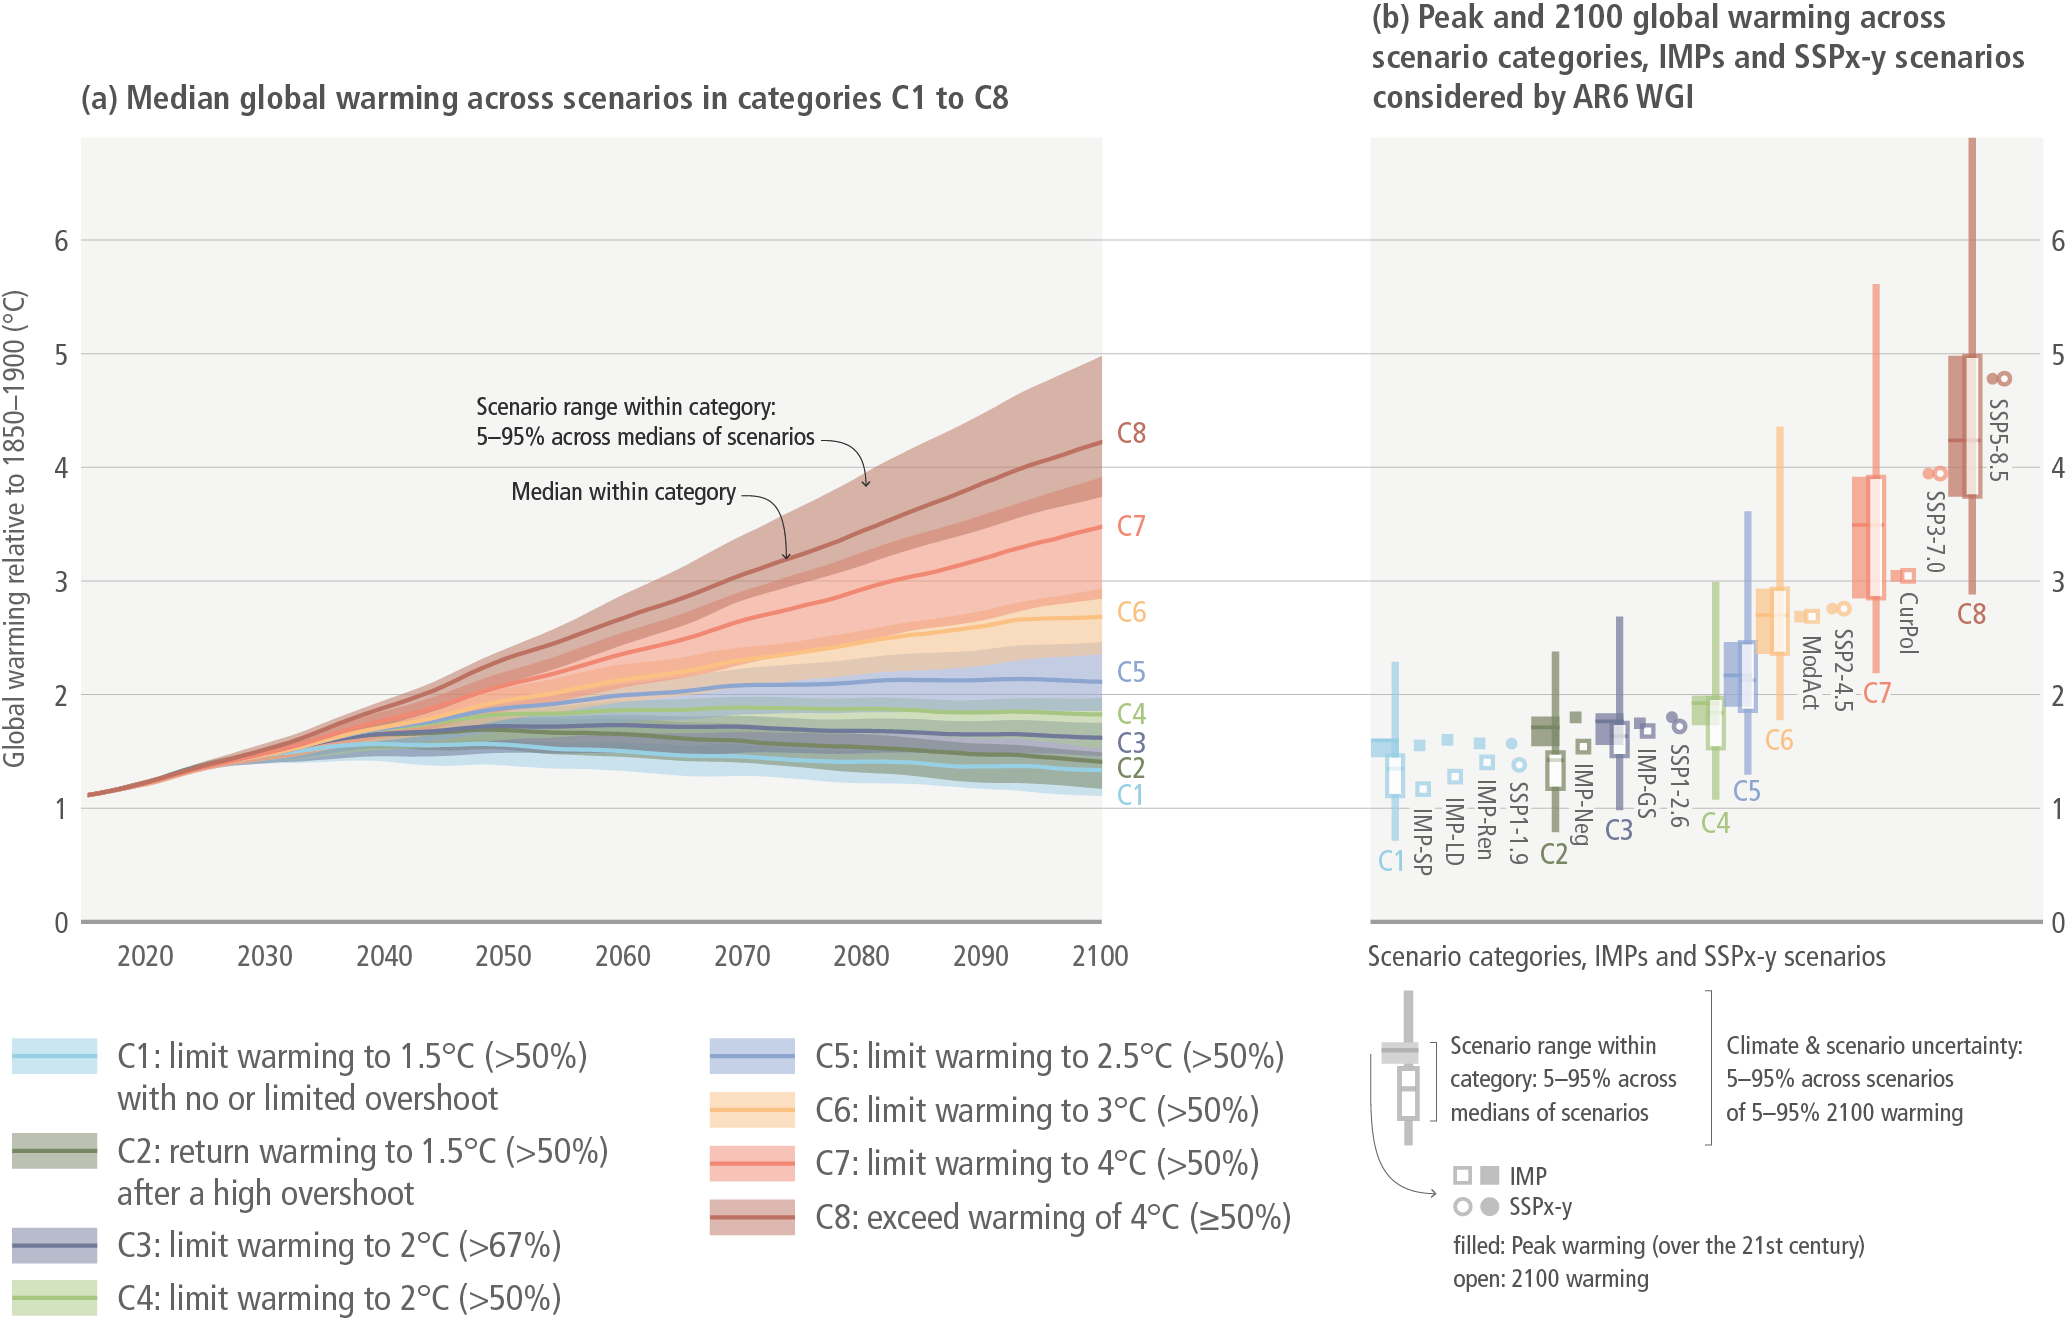
Box SPM.1, Figure 1 | Projected global mean warming of the ensemble of modelled scenarios included in the climate categories C1–C8 and IMPs (based on emulators calibrated to the WGI assessment), as well as five illustrative scenarios (SSPx-y) as considered by AR6 WGI. Panel a shows the p5–p95 range of projected median warming across global modelled pathways within a category, with the category medians (line). Panel b shows the peak and 2100 emulated temperature outcomes for the categories C1 to C8 and for IMPs, and the five illustrative scenarios (SSPx-y) as considered by AR6 WGI. The boxes show the p5–p95 range within each scenario category, as in panel a. The combined p5–p95 range across scenarios and the climate uncertainty for each category C1–C8 is also shown for 2100 warming (thin vertical lines). (Table SPM.2) {Figure 3.11; AR6 WGI Figure SPM.8}
C.2Global net zero CO2 emissions are reached in the early 2050s in modelled pathways that limit warming to 1.5°C (>50%) with no or limited overshoot, and around the early 2070s in modelled pathways that limit warming to 2°C (>67%). Many of these pathways continue to net negative CO2 emissions after the point of net zero. These pathways also include deep reductions in other GHG emissions. The level of peak warming depends on cumulative CO2 emissions until the time of net zero CO2 and the change in non-CO2 climate forcers by the time of peaking. Deep GHG emissions reductions by 2030 and 2040, particularly reductions of methane emissions, lower peak warming, reduce the likelihood of overshooting warming limits and lead to less reliance on net negative CO2 emissions that reverse warming in the latter half of the century. Reaching and sustaining global net zero GHG emissions results in a gradual decline in warming. (high confidence)Expand Table SPM.2 Links to chapters3.3, 3.5, Box 3.4, Cross-Chapter Box 3 in Chapter 3, AR6 WGI SPM D1.8
C.2.1Modelled global pathways limiting warming to 1.5°C (>50%) with no or limited overshoot are associated with projected cumulative net CO2 emissions 50 until the time of net zero CO2 of 510 [330–710] GtCO2. Pathways limiting warming to 2°C (>67%) are associated with 890 [640–1160] GtCO2 (Table SPM.2). (high confidence) {3.3, Box 3.4}
C.2.2Modelled global pathways that limit warming to 1.5°C (>50%) with no or limited overshoot involve more rapid and deeper near-term GHG emissions reductions through to 2030, and are projected to have less net negative CO2 emissions and less carbon dioxide removal (CDR) in the longer term, than pathways that return warming to 1.5°C (>50%) after a high overshoot (C2 category). Modelled pathways that limit warming to 2°C (>67%) have on average lower net negative CO2 emissions compared to pathways that limit warming to 1.5°C (>50%) with no or limited overshoot and pathways that return warming to 1.5°C (>50%) after a high overshoot (C1 and C2 categories respectively). Modelled pathways that return warming to 1.5°C (>50%) after a high overshoot (C2 category) show near-term GHG emissions reductions similar to pathways that limit warming to 2°C (>67%) (C3 category). For a given peak global warming level, greater and more rapid near-term GHG emissions reductions are associated with later net zero CO2 dates. (high confidence) (Table SPM.2) {3.3, Table 3.5, Cross-Chapter Box 3 in Chapter 3, Annex I: Glossary}
C.2.3Future non-CO2 warming depends on reductions in non-CO2GHGs, aerosols and their precursors, and ozone precursor emissions. In modelled global low-emission pathways, the projected reduction of cooling and warming aerosol emissions over time leads to net warming in the near- to mid-term. In these mitigation pathways, the projected reductions of cooling aerosols are mostly due to reduced fossil fuel combustion that was not equipped with effective air pollution controls. Non-CO2GHG emissions at the time of net zero CO2 are projected to be of similar magnitude in modelled pathways that limit warming to 2°C (>67%) or lower. These non-CO2GHG emissions are about 8 [5–11] GtCO2-eq yr –1, with the largest fraction from CH4 (60% [55–80%]), followed by N2O (30% [20–35%]) and F-gases (3% [2–20%]). 51 Due to the short lifetime of CH4 in the atmosphere, projected deep reduction of CH4 emissions up until the time of net zero CO2 in modelled mitigation pathways effectively reduces peak global warming. (high confidence) {3.3; AR6 WGI SPM D1.7}
C.2.4At the time of global net zero GHG emissions, net negative CO2 emissions counterbalance metric-weighted non-CO2GHG emissions. Typical emissions pathways that reach and sustain global net zero GHG emissions based on the 100-year global warming potential (GWP-100)7 are projected to result in a gradual decline of global warming. About half of the assessed pathways that limit warming to 1.5°C (>50%) with no or limited overshoot (C1 category) reach net zero GHG emissions during the second half of the 21st century. These pathways show greater reduction in global warming after the peak to 1.2 [1.1–1.4] °C by 2100 than modelled pathways in the same category that do not reach net zero GHG emissions before 2100 and that result in warming of 1.4 [1.3–1.5] °C by 2100. In modelled pathways that limit warming to 2°C (>67%) (C3 category), there is no significant difference in warming by 2100 between those pathways that reach net zero GHGs (around 30%) and those that do not (high confidence). In pathways that limit warming to 2°C (>67%) or lower and that do reach net zero GHG, net zero GHG occurs around 10–40 years later than net zero CO2 emissions (medium confidence). {Cross-Chapter Box 2 in Chapter 2, 3.3, Cross-Chapter Box 3 in Chapter 3; AR6 WGI SPM D1.8}
C.3 All global modelled pathways that limit warming to 1.5°C (>50%) with no or limited overshoot, and those that limit warming to 2°C (>67%), involve rapid and deep and in most cases immediate GHG emission reductions in all sectors. Modelled mitigation strategies to achieve these reductions include transitioning from fossil fuels without CCS to very low- or zero-carbon energy sources, such as renewables or fossil fuels with CCS, demand side measures and improving efficiency, reducing non-CO2 emissions, and deploying carbon dioxide removal (CDR) methods to counterbalance residual GHG emissions. Illustrative Mitigation Pathways (IMPs) show different combinations of sectoral mitigation strategies consistent with a given warming level. (high confidence)Expand Figure SPM.5Links to chapters3.2, 3.3, 3.4, 6.4, 6.6
C.3.1There is a variation in the contributions of different sectors in modelled mitigation pathways, as illustrated by the Illustrative Mitigation Pathways (IMPs). However, modelled pathways that limit warming to 2°C (>67%) or lower share common characteristics, including rapid and deep GHG emission reductions. Doing less in one sector needs to be compensated by further reductions in other sectors if warming is to be limited. (high confidence) (Figure SPM.5) {3.2, 3.3, 3.4}
C.3.2In modelled pathways that limit warming to 1.5°C (>50%) with no or limited overshoot, the global use of coal, oil and gas in 2050 is projected to decline with median values of about 95%, 60% and 45% respectively, compared to 2019. The interquartile ranges are (80 to 100%), (40 to 75%) and (20 to 60%) and the p5–p95 ranges are [60 to 100%], [25 to 90%] and [–30 to +85%], respectively. In modelled pathways that limit warming to 2°C (>67%), these projected declines have a median value and interquartile range of 85% (65 to 95%), 30% (15 to 50%) and 15% (–10 to +40%) respectively by 2050. The use of coal, oil and gas without CCS in modelled pathways that limit warming to 1.5°C (>50%) with no or limited overshoot is projected to be reduced to a greater degree, with median values of about 100%, 60% and 70% in 2050 compared to 2019. The interquartile ranges are (95 to 100%), (45 to 75%) and (60 to 80%) and the p5–p95 ranges about [85 to 100%], [25 to 90%] and [35 to 90%] for coal, oil and gas respectively. In these global modelled pathways, in 2050 almost all electricity is supplied from zero- or low-carbon sources, such as renewables or fossil fuels with CCS, combined with increased electrification of energy demand. As indicated by the ranges, choices in one sector can be compensated for by choices in another while being consistent with assessed warming levels. 52 (high confidence) {3.4, 3.5, Table 3.6, Figure 3.22, Figure 6.35}
C.3.3In modelled pathways that reach global net zero CO2 emissions: at the point they reach net zero, 5–16 GtCO2 of emissions from some sectors are compensated for by net negative CO2 emissions in other sectors. In most global modelled pathways that limit warming to 2°C (>67%) or lower, the AFOLU sector, via reforestation and reduced deforestation, and the energy supply sector reach net zero CO2 emissions earlier than the buildings, industry and transport sectors. (high confidence) (Figure SPM.5e,f) {3.4}
C.3.4In modelled pathways that reach global net zero GHG emissions, at the point they reach net zero GHG, around 74% [54 to 90%] of global emissions reductions are achieved by CO2 reductions in energy supply and demand, 13% [4 to 20%] by CO2 mitigation options in the AFOLU sector, and 13% [10 to 18%] through the reduction of non-CO2 emissions from land-use, energy and industry (medium confidence). (Figure SPM.5f) {3.3, 3.4}
C.3.5Methods and levels of CDR deployment in global modelled mitigation pathways vary depending on assumptions about costs, availability and constraints. 53 In modelled pathways that report CDR and that limit warming to 1.5°C (>50%) with no or limited overshoot, global cumulative CDR during 2020–2100 from bioenergy with carbon dioxide capture and storage (BECCS) and direct air carbon dioxide capture and storage (DACCS) is 30–780 GtCO2 and 0–310 GtCO2, respectively. In these modelled pathways, the AFOLU sector contributes 20–400 GtCO2 net negative emissions. Total cumulative net negative CO2 emissions including CDR deployment across all options represented in these modelled pathways are 20–660 GtCO2. In modelled pathways that limit warming to 2°C (>67%), global cumulative CDR during 2020–2100 from BECCS and DACCS is 170–650 GtCO2 and 0–250 GtCO2 respectively, the AFOLU sector contributes 10–250 GtCO2 net negative emissions, and total cumulative net negative CO2 emissions are around 40 [0–290] GtCO2. (Table SPM.2) (high confidence) {Table 3.2, 3.3, 3.4}
C.3.6All mitigation strategies face implementation challenges, including technology risks, scaling, and costs. Many challenges, such as dependence on CDR, pressure on land and biodiversity (e.g., bioenergy) and reliance on technologies with high upfront investments (e.g., nuclear), are significantly reduced in modelled pathways that assume using resources more efficiently (e.g., IMP-LD) or that shift global development towards sustainability (e.g., IMP-SP). (high confidence) (Figure SPM.5) {3.2, 3.4, 3.7, 3.8, 4.3, 5.1}
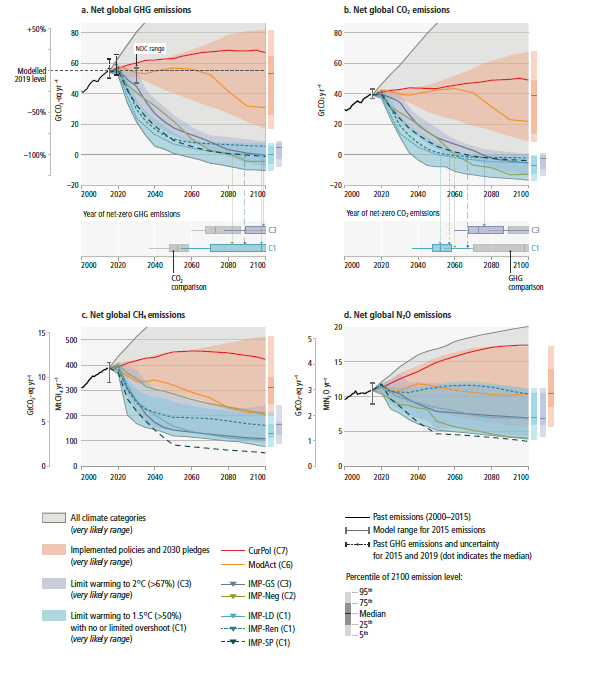
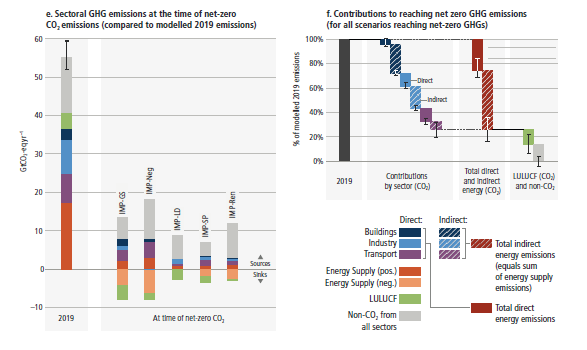
Figure SPM.5: Illustrative Mitigation Pathways (IMPs) and net zero CO2and GHG emissions strategies. Panels a and b show the development of global GHG and CO2 emissions in modelled global pathways (upper sub-panels) and the associated timing of when GHG and CO2 emissions reach net zero (lower sub-panels). Panels c and d show the development of global CH4 and N2O emissions, respectively. Coloured ranges denote the 5th to 95th percentile across pathways. The red ranges depict emissions pathways assuming policies that were implemented by the end of 2020 and pathways assuming implementation of NDCs (announced prior to COP26). Ranges of modelled pathways that limit warming to 1.5°C (>50%) with no or limited overshoot are shown in light blue (category C1) and pathways that limit warming to 2°C (>67%) are shown in light purple (category C3). The grey range comprises all assessed pathways (C1–C8) from the 5th percentile of the lowest warming category (C1) to the 95th percentile of the highest warming category (C8). The modelled pathway ranges are compared to the emissions from two pathways illustrative of high emissions (CurPol and ModAct) and five IMPs: IMP-LD, IMP-Ren, IMP-SP, IMP-Neg and IMP-GS. Emissions are harmonised to the same 2015 base year. The vertical error bars in 2015 show the 5–95th percentile uncertainty range of the non-harmonised emissions across the pathways, and the uncertainty range, and median value, in emission estimates for 2015 and 2019. The vertical error bars in 2030 (panel a) depict the assessed range of the NDCs, as announced prior to COP26 (Figure SPM.4). 23Panel e shows the sectoral contributions of CO2 and non-CO2 emissions sources and sinks at the time when net zero CO2 emissions are reached in the IMPs. Positive and negative emissions for different IMPs are compared to the GHG emissions from the year 2019. Energy supply (neg.) includes BECCS and DACCS. DACCS features in only two of the five IMPs (IMP-REN and IMP-GS) and contributes <1% and 64%, respectively, to the net negative emissions in Energy Supply (neg.). Panel f shows the contribution of different sectors and sources to the emissions reductions from a 2019 baseline for reaching net zero GHG emissions. Bars denote the median emissions reductions for all pathways that reach net zero GHG emissions. The whiskers indicate the p5–p95 range. The contributions of the service sectors (transport, buildings, industry) are split into direct (demand-side) as well as indirect (supply-side) CO2 emissions reductions. Direct emissions represent demand-side emissions due to the fuel use in the respective demand sector. Indirect emissions represent upstream emissions due to industrial processes and energy conversion, transmission and distribution. In addition, the contributions from the LULUCF sector and reductions from non-CO2 emissions sources (green and grey bars) are displayed. {3.3, 3.4}
C.4Reducing GHG emissions across the full energy sector requires major transitions, including a substantial reduction in overall fossil fuel use, the deployment of low-emission energy sources, switching to alternative energy carriers, and energy efficiency and conservation. The continued installation of unabated fossil fuel54infrastructure will ‘lock-in’ GHG emissions. (high confidence)ExpandLinks to chapters2.7, 6.6, 6.7, 16.4
C.4.1Net-zero CO2 energy systems entail: a substantial reduction in overall fossil fuel use, minimal use of unabated fossil fuels, and use of CCS in the remaining fossil fuel system; 54 electricity systems that emit no net CO2; widespread electrification of the energy system including end uses; energy carriers such as sustainable biofuels, low-emissions hydrogen, and derivatives in applications less amenable to electrification; energy conservation and efficiency; and greater physical, institutional, and operational integration across the energy system. CDR will be needed to counterbalance residual emissions in the energy sector. The most appropriate strategies depend on national and regional circumstances, including enabling conditions and technology availability. (high confidence) {3.4, 6.6, 11.3, 16.4}
C.4.2Unit cost reductions in key technologies, notably wind power, solar power, and storage, have increased the economic attractiveness of low-emission energy sector transitions through 2030. Maintaining emission-intensive systems may, in some regions and sectors, be more expensive than transitioning to low emission systems. Low-emission energy sector transitions will have multiple co-benefits, including improvements in air quality and health. The long-term economic attractiveness of deploying energy system mitigation options depends, inter alia, on policy design and implementation, technology availability and performance, institutional capacity, equity, access to finance, and public and political support. (high confidence) (Figure SPM.3) {3.4, 6.4, 6.6, 6.7, 13.7}
C.4.3Electricity systems powered predominantly by renewables are becoming increasingly viable. Electricity systems in some countries and regions are already predominantly powered by renewables. It will be more challenging to supply the entire energy system with renewable energy. Even though operational, technological, economic, regulatory, and social challenges remain, a variety of systemic solutions to accommodate large shares of renewables in the energy system have emerged. A broad portfolio of options, such as integrating systems, coupling sectors, energy storage, smart grids, demand-side management, sustainable biofuels, electrolytic hydrogen and derivatives, and others will ultimately be needed to accommodate large shares of renewables in energy systems. (high confidence) {Box 6.8, 6.4, 6.6}
C.4.4Limiting global warming to 2°C or below will leave a substantial amount of fossil fuels unburned and could strand considerable fossil fuel infrastructure (high confidence). Depending on its availability, CCS could allow fossil fuels to be used longer, reducing stranded assets (high confidence). The combined global discounted value of the unburned fossil fuels and stranded fossil fuel infrastructure has been projected to be around USD1–4 trillion from 2015 to 2050 to limit global warming to approximately 2°C, and it will be higher if global warming is limited to approximately 1.5°C (medium confidence). In this context, coal assets are projected to be at risk of being stranded before 2030, while oil and gas assets are projected to be more at risk of being stranded towards mid-century. A low-emission energy sector transition is projected to reduce international trade in fossil fuels. (high confidence) {6.7, Figure 6.35}
C.4.5Global methane emissions from energy supply, primarily fugitive emissions from production and transport of fossil fuels, accounted for about 18% [13–23%] of global GHG emissions from energy supply, 32% [22–42%] of global CH4 emissions, and 6% [4–8%] of global GHG emissions in 2019 (high confidence). About 50–80% of CH4 emissions from these fossil fuels could be avoided with currently available technologies at less than USD50 tCO2-eq –1 (medium confidence). {6.3, 6.4.2, Box 6.5, 11.3, 2.2.2, Table 2.1, Figure 2.5, Annex1: Glossary}
C.4.6CCS is an option to reduce emissions from large-scale fossil-based energy and industry sources, provided geological storage is available. When CO2 is captured directly from the atmosphere (DACCS), or from biomass (BECCS), CCS provides the storage component of these CDR methods. CO2 capture and subsurface injection is a mature technology for gas processing and enhanced oil recovery. In contrast to the oil and gas sector, CCS is less mature in the power sector, as well as in cement and chemicals production, where it is a critical mitigation option. The technical geological CO2 storage capacity is estimated to be on the order of 1000 GtCO2, which is more than the CO2 storage requirements through 2100 to limit global warming to 1.5°C, although the regional availability of geological storage could be a limiting factor. If the geological storage site is appropriately selected and managed, it is estimated that the CO2 can be permanently isolated from the atmosphere. Implementation of CCS currently faces technological, economic, institutional, ecological-environmental and socio-cultural barriers. Currently, global rates of CCS deployment are far below those in modelled pathways limiting global warming to 1.5°C or 2°C. Enabling conditions such as policy instruments, greater public support and technological innovation could reduce these barriers. (high confidence) {2.5, 6.3, 6.4, 6.7, 11.3, 11.4, Cross-Chapter Box 8 in Chapter 12, Figure TS.31; SRCCL Chapter 5}
C.5 Net zero CO2 emissions from the industrial sector are challenging but possible. Reducing industry emissions will entail coordinated action throughout value chains to promote all mitigation options, including demand management, energy and materials efficiency, circular material flows, as well as abatement technologies and transformational changes in production processes. Progressing towards net zero GHG emissions from industry will be enabled by the adoption of new production processes using low- and zero-GHG electricity, hydrogen, fuels, and carbon management. (high confidence)ExpandLinks to chapters11.2, 11.3, 11.4, Box TS.4
C.5.1The use of steel, cement, plastics, and other materials is increasing globally, and in most regions. There are many sustainable options for demand management, materials efficiency, and circular material flows that can contribute to reduced emissions, but how these can be applied will vary across regions and different materials. These options have a potential for being more used in industrial practice and would need more attention from industrial policy. These options, as well as new production technologies, are generally not considered in recent global scenarios nor in national economy-wide scenarios due to relative newness. As a consequence, the mitigation potential in some scenarios is underestimated compared to bottom-up industry-specific models. (high confidence) {3.4, 5.3, Figure 5.7, 11.2, Box 11.2, 11.3, 11.4, 11.5.2, 11.6}
C.5.2For almost all basic materials – primary metals, 55 building materials and chemicals – many low- to zero-GHG intensity production processes are at the pilot to near-commercial and in some cases commercial stage but they are not yet established industrial practice. Introducing new sustainable production processes for basic materials could increase production costs but, given that only a small fraction of consumer costs are based on materials, such new processes are expected to translate into minimal cost increases for final consumers. Hydrogen direct reduction for primary steelmaking is near-commercial in some regions. Until new chemistries are mastered, deep reduction of cement process emissions will rely on already commercialised cementitious material substitution and the availability of CCS. Reducing emissions from the production and use of chemicals would need to rely on a life cycle approach, including increased plastics recycling, fuel and feedstock switching, and carbon sourced through biogenic sources, and, depending on availability, carbon capture and use (CCU), direct air CO2 capture, as well as CCS. Light industry, mining and manufacturing have the potential to be decarbonised through available abatement technologies (e.g., material efficiency, circularity), electrification (e.g., electrothermal heating, heat pumps) and low- or zero-GHG emitting fuels (e.g., hydrogen, ammonia, and bio-based and other synthetic fuels). (high confidence) {Table 11.4, Box 11.2, 11.3, 11.4}
C.5.3Action to reduce industry sector emissions may change the location of GHG-intensive industries and the organisation of value chains. Regions with abundant low-GHG energy and feedstocks have the potential to become exporters of hydrogen-based chemicals and materials processed using low-carbon electricity and hydrogen. Such reallocation will have global distributional effects on employment and economic structure. (medium confidence) {Box 11.1}
C.5.4Emissions-intensive and highly traded basic materials industries are exposed to international competition, and international cooperation and coordination may be particularly important in enabling change. For sustainable industrial transitions, broad and sequential national and sub-national policy strategies reflecting regional contexts will be required. These may combine policy packages including: transparent GHG accounting and standards; demand management; materials and energy efficiency policies; R&D and niche markets for commercialisation of low-emission materials and products; economic and regulatory instruments to drive market uptake; high quality recycling, low-emissions energy and other abatement infrastructure (e.g., for CCS); and socially inclusive phase-out plans of emissions-intensive facilities within the context of just transitions. The coverage of mitigation policies could be expanded nationally and sub-nationally to include all industrial emission sources, and both available and emerging mitigation options. (high confidence) {11.6}
C.6 Urban areas can create opportunities to increase resource efficiency and significantly reduce GHG emissions through the systemic transition of infrastructure and urban form through low-emission development pathways towards net-zero emissions. Ambitious mitigation efforts for established, rapidly growing and emerging cities will encompass (i) reducing or changing energy and material consumption, (ii) electrification, and (iii) enhancing carbon uptake and storage in the urban environment. Cities can achieve net-zero emissions, but only if emissions are reduced within and outside of their administrative boundaries through supply chains, which will have beneficial cascading effects across other sectors. (very high confidence)ExpandLinks to sections8.2, 8.3, 8.4, 8.5, 8.6, 13.2
C.6.1In modelled scenarios, global consumption-based urban CO2 and CH4 emissions 15 are projected to rise from 29 GtCO2-eq in 2020 to 34 GtCO2-eq in 2050 with moderate mitigation efforts (intermediate GHG emissions, SSP2-4.5), and up to 40 GtCO2-eq in 2050 with low mitigation efforts (high GHG emissions, SSP3-7.0). With ambitious and immediate mitigation efforts, including high levels of electrification and improved energy and material efficiency, global consumption-based urban CO2 and CH4 emissions could be reduced to 3 GtCO2-eq in 2050 in the modelled scenario with very low GHG emissions (SSP1-1.9). 56 (medium confidence) {8.3}
C.6.2The potential and sequencing of mitigation strategies to reduce GHG emissions will vary depending on a city’s land use, spatial form, development level, and state of urbanisation (high confidence). Strategies for established cities to achieve large GHG emissions savings include efficiently improving, repurposing or retrofitting the building stock, targeted infilling, and supporting non-motorised (e.g., walking, bicycling) and public transport. Rapidly growing cities can avoid future emissions by co-locating jobs and housing to achieve compact urban form, and by leapfrogging or transitioning to low-emissions technologies. New and emerging cities will have significant infrastructure development needs to achieve high quality of life, which can be met through energy efficient infrastructures and services, and people-centred urban design (high confidence). For cities, three broad mitigation strategies have been found to be effective when implemented concurrently: (i) reducing or changing energy and material use towards more sustainable production and consumption; (ii) electrification in combination with switching to low-emission energy sources; and (iii) enhancing carbon uptake and storage in the urban environment, for example through bio-based building materials, permeable surfaces, green roofs, trees, green spaces, rivers, ponds and lakes. 57 (very high confidence) {5.3, Figure 5.7, Supplementary Material Table 5.SM.2, 8.2, 8.4, 8.6, Figure 8.21, 9.4, 9.6, 10.2}
C.6.3The implementation of packages of multiple city-scale mitigation strategies can have cascading effects across sectors and reduce GHG emissions both within and outside a city’s administrative boundaries. The capacity of cities to develop and implement mitigation strategies varies with the broader regulatory and institutional settings, as well as enabling conditions, including access to financial and technological resources, local governance capacity, engagement of civil society, and municipal budgetary powers. (very high confidence){Figure 5.7, Supplementary Material Table 5.SM.2, 8.4, 8.5, 8.6, 13.2, 13.3, 13.5, 13.7, Cross-Chapter Box 9 in Chapter 13}
C.6.4A growing number of cities are setting climate targets, including net-zero GHG targets. Given the regional and global reach of urban consumption patterns and supply chains, the full potential for reducing consumption-based urban emissions to net zero GHG can be met only when emissions beyond cities’ administrative boundaries are also addressed. The effectiveness of these strategies depends on cooperation and coordination with national and sub-national governments, industry, and civil society, and whether cities have adequate capacity to plan and implement mitigation strategies. Cities can play a positive role in reducing emissions across supply chains that extend beyond cities’ administrative boundaries, for example through building codes and the choice of construction materials. (very high confidence) {8.4, Box 8.4, 8.5, 9.6, 9.9, 13.5, 13.9}
C.7.In modelled global scenarios, existing buildings, if retrofitted, and buildings yet to be built, are projected to approach net zero GHG emissions in 2050 if policy packages, which combine ambitious sufficiency, efficiency, and renewable energy measures, are effectively implemented and barriers to decarbonisation are removed. Low ambition policies increase the risk of locking-in buildings’ carbon for decades, while well-designed and effectively implemented mitigation interventions (in both new buildings and existing ones if retrofitted), have significant potential to contribute to achieving SDGs in all regions while adapting buildings to future climate. (high confidence)ExpandLinks to chapters9.1, 9.3, 9.4, 9.5, 9.6, 9.9
C.7.1In 2019, global direct and indirect GHG emissions from buildings and emissions from cement and steel use for building construction and renovation were 12 GtCO2-eq. These emissions include indirect emissions from offsite generation of electricity and heat, direct emissions produced onsite and emissions from cement and steel used for building construction and renovation. In 2019, global direct and indirect emissions from non-residential buildings increased by about 55% and those from residential buildings increased by about 50% compared to 1990. The latter increase, according to the decomposition analysis, was mainly driven by the increase of the floor area per capita, population growth and the increased use of emission-intensive electricity and heat while efficiency improvements have partly decreased emissions. There are great differences in the contribution of each of these drivers to regional emissions. (high confidence) {9.3}
C.7.2Integrated design approaches to the construction and retrofit of buildings have led to increasing examples of zero energy or zero carbon buildings in several regions. However, the low renovation rates and low ambition of retrofitted buildings have hindered the decrease of emissions. Mitigation interventions at the design stage include buildings typology, form, and multi-functionality to allow for adjusting the size of buildings to the evolving needs of their users and repurposing unused existing buildings to avoid using GHG-intensive materials and additional land. Mitigation interventions include: at the construction phase, low-emission construction materials, highly efficient building envelope and the integration of renewable energy solutions; 58 at the use phase, highly efficient appliances/equipment, the optimisation of the use of buildings and their supply with low-emission energy sources; and at the disposal phase, recycling and re-using construction materials. (high confidence) {9.4, 9.5, 9.6, 9.7}
C.7.3By 2050, bottom-up studies show that up to 61% (8.2 GtCO2) of global building emissions could be mitigated. Sufficiency policies 59 that avoid the demand for energy and materials contribute 10% to this potential, energy efficiency policies contribute 42%, and renewable energy policies 9%. The largest share of the mitigation potential of new buildings is available in developing countries while in developed countries the highest mitigation potential is within the retrofit of existing buildings. The 2020–2030 decade is critical for accelerating the learning of know-how, building the technical and institutional capacity, setting the appropriate governance structures, ensuring the flow of finance, and in developing the skills needed to fully capture the mitigation potential of buildings. (high confidence) {9.3, 9.4, 9.5, 9.6, 9.7, 9.9}
C.8Demand-side options and low-GHG emissions technologies can reduce transport sector emissions in developed countries and limit emissions growth in developing countries (high confidence). Demand-focused interventions can reduce demand for all transport services and support the shift to more energy efficient transport modes (medium confidence). Electric vehicles powered by low-emissions electricity offer the largest decarbonisation potential for land-based transport, on a life cycle basis (high confidence). Sustainable biofuels can offer additional mitigation benefits in land-based transport in the short and medium term (medium confidence). Sustainable biofuels, low-emissions hydrogen, and derivatives (including synthetic fuels) can support mitigation of CO2 emissions from shipping, aviation, and heavy-duty land transport but require production process improvements and cost reductions (medium confidence). Many mitigation strategies in the transport sector would have various co-benefits, including air quality improvements, health benefits, equitable access to transportation services, reduced congestion, and reduced material demand (high confidence).ExpandLinks to chapters10.2, 10.4, 10.5, 10.6, 10.7
C.8.1In scenarios that limit warming to 1.5°C (>50%) with no or limited overshoot, global transport-related CO2 emissions fall by 59% (42–68% interquartile range) by 2050 relative to modelled 2020 emissions, but with regionally differentiated trends (high confidence). In global modelled scenarios that limit warming to 2°C (>67%), transport-related CO2 emissions are projected to decrease by 29% [14–44% interquartile range] by 2050 compared to modelled 2020 emissions. In both categories of scenarios, the transport sector likely does not reach zero CO2 emissions by 2100 so negative emissions are likely needed to counterbalance residual CO2 emissions from the sector (high confidence). {3.4, 10.7}
C.8.2Changes in urban form (e.g., density, land-use mix, connectivity, and accessibility) in combination with programmes that encourage changes in consumer behaviour (e.g., transport pricing) could reduce transport-related greenhouse gas emissions in developed countries and slow growth in emissions in developing countries (high confidence). Investments in public inter- and intra-city transport and active transport infrastructure (e.g., bicycle and pedestrian pathways) can further support the shift to less GHG-intensive transport modes (high confidence). Combinations of systemic changes, including teleworking, digitalisation, dematerialisation, supply chain management, and smart and shared mobility may reduce demand for passenger and freight services across land, air, and sea (high confidence). Some of these changes could lead to induced demand for transport and energy services, which may decrease their GHG emissions reduction potential (medium confidence). {5.3, 10.2, 10.8}
C.8.3Electric vehicles powered by low-GHG emissions electricity have large potential to reduce land-based transport GHG emissions, on a life cycle basis (high confidence). Costs of electrified vehicles, including automobiles, two- and three-wheelers, and buses, are decreasing and their adoption is accelerating, but they require continued investments in supporting infrastructure to increase scale of deployment (high confidence). Advances in battery technologies could facilitate the electrification of heavy-duty trucks and complement conventional electric rail systems (medium confidence). There are growing concerns about critical minerals needed for batteries. Material and supply diversification strategies, energy and material efficiency improvements, and circular material flows can reduce the environmental footprint and material supply risks for battery production (medium confidence). Sourced sustainably and with low-GHG emissions feedstocks, bio-based fuels, blended or unblended with fossil fuels, can provide mitigation benefits, particularly in the short and medium term (medium confidence). Low-GHG emissions hydrogen and hydrogen derivatives, including synthetic fuels, can offer mitigation potential in some contexts and land-based transport segments (medium confidence). {3.4, 6.3, 10.3, 10.4, 10.7, 10.8, Box 10.6}
C.8.4While efficiency improvements (e.g., optimised aircraft and vessel designs, mass reduction, and propulsion system improvements) can provide some mitigation potential, additional CO2 emissions mitigation technologies for aviation and shipping will be required (high confidence). For aviation, such technologies include high energy density biofuels (high confidence), and low-emission hydrogen and synthetic fuels (medium confidence). Alternative fuels for shipping include low-emission hydrogen, ammonia, biofuels, and other synthetic fuels (medium confidence). Electrification could play a niche role for aviation and shipping for short trips (medium confidence) and can reduce emissions from port and airport operations (high confidence). Improvements to national and international governance structures would further enable the decarbonisation of shipping and aviation (medium confidence). Such improvements could include, for example, the implementation of stricter efficiency and carbon intensity standards for the sectors (medium confidence). {10.3. 10.5, 10.6, 10.7, 10.8, Box 10.5}
C.8.5The substantial potential for GHG emissions reductions, both direct and indirect, in the transport sector largely depends on power sector decarbonisation, and low-emissions feedstocks and production chains (high confidence). Integrated transport and energy infrastructure planning and operations can enable sectoral synergies and reduce the environmental, social, and economic impacts of decarbonising the transport and energy sectors (high confidence). Technology transfer and financing can support developing countries leapfrogging or transitioning to low-emissions transport systems thereby providing multiple co-benefits (high confidence). {10.2, 10.3, 10.4, 10.5, 10.6, 10.7, 10.8}
C.9AFOLU mitigation options, when sustainably implemented, can deliver large-scale GHG emission reductions and enhanced removals, but cannot fully compensate for delayed action in other sectors. In addition, sustainably sourced agricultural and forest products can be used instead of more GHG-intensive products in other sectors. Barriers to implementation and trade-offs may result from the impacts of climate change, competing demands on land, conflicts with food security and livelihoods, the complexity of land ownership and management systems, and cultural aspects. There are many country-specific opportunities to provide co-benefits (such as biodiversity conservation, ecosystem services, and livelihoods) and avoid risks (for example, through adaptation to climate change). (high confidence)ExpandLinks to chapters7.4, 7.6, 7.7, 12.5, 12.6
C.9.1The projected economic mitigation potential of AFOLU options between 2020 and 2050, at costs below USD100 tCO2-eq –1, is 8–14 GtCO2-eq yr –160 (high confidence). 30–50% of this potential is available at less than USD20 tCO2-eq and could be upscaled in the near term across most regions (high confidence). The largest share of this economic potential [4.2–7.4 GtCO2-eq yr –1] comes from the conservation, improved management, and restoration of forests and other ecosystems (coastal wetlands, peatlands, savannas and grasslands), with reduced deforestation in tropical regions having the highest total mitigation. Improved and sustainable crop and livestock management, and carbon sequestration in agriculture (the latter including soil carbon management in croplands and grasslands, agroforestry and biochar), can contribute 1.8–4.1 GtCO2-eq yr –1 reduction. Demand-side and material substitution measures, such as shifting to balanced, sustainable healthy diets, 61 reducing food loss and waste, and using bio-materials, can contribute 2.1 [1.1–3.6] GtCO2-eq yr –1 reduction. In addition, demand-side measures together with the sustainable intensification of agriculture can reduce ecosystem conversion and CH4 and N2O emissions, and free up land for reforestation and restoration, and the production of renewable energy. The improved and expanded use of wood products sourced from sustainably managed forests also has potential through the allocation of harvested wood to longer-lived products, increasing recycling or material substitution. AFOLU mitigation measures cannot compensate for delayed emission reductions in other sectors. Persistent and region-specific barriers continue to hamper the economic and political feasibility of deploying AFOLU mitigation options. Assisting countries to overcome barriers will help to achieve significant mitigation (medium confidence). (Figure SPM.6) {7.1, 7.4, 7.5, 7.6}
C.9.2AFOLU carbon sequestration and GHG emission reduction options have both co-benefits and risks in terms of biodiversity and ecosystem conservation, food and water security, wood supply, livelihoods and land tenure and land-use rights of Indigenous Peoples, local communities and small land owners. Many options have co-benefits but those that compete for land and land-based resources can pose risks. The scale of benefit or risk largely depends on the type of activity undertaken, deployment strategy (e.g., scale, method), and context (e.g., soil, biome, climate, food system, land ownership) that vary geographically and over time. Risks can be avoided when AFOLU mitigation is pursued in response to the needs and perspectives of multiple stakeholders to achieve outcomes that maximize co-benefits while limiting trade-offs. (high confidence) {7.4, 7.6, 12.3}
C.9.3Realising the AFOLU mitigation potential entails overcoming institutional, economic and policy constraints and managing potential trade-offs (high confidence). Land-use decisions are often spread across a wide range of land owners; demand-side measures depend on billions of consumers in diverse contexts. Barriers to the implementation of AFOLU mitigation include insufficient institutional and financial support, uncertainty over long-term additionality and trade-offs, weak governance, insecure land ownership, low incomes and the lack of access to alternative sources of income, and the risk of reversal. Limited access to technology, data, and know-how is a barrier to implementation. Research and development are key for all measures. For example, measures for the mitigation of agricultural CH4 and N2O emissions with emerging technologies show promising results. However, the mitigation of agricultural CH4 and N2O emissions is still constrained by cost, the diversity and complexity of agricultural systems, and by increasing demands to raise agricultural yields, and increasing demand for livestock products. (high confidence) {7.4, 7.6}
C.9.4Net costs of delivering 5–6 GtCO2 yr –1 of forest-related carbon sequestration and emission reduction as assessed with sectoral models are estimated to reach to about USD400 billion yr –1 by 2050. The costs of other AFOLU mitigation measures are highly context specific. Financing needs in AFOLU, and in particular in forestry, include both the direct effects of any changes in activities as well as the opportunity costs associated with land-use change. Enhanced monitoring, reporting and verification capacity, and the rule of law, are crucial for land-based mitigation in combination with policies also recognising interactions with wider ecosystem services, could enable engagement by a wider array of actors, including private businesses, NGOs, and Indigenous Peoples and local communities. (medium confidence) {7.6, 7.7}
C.9.5Context specific policies and measures have been effective in demonstrating the delivery of AFOLU carbon sequestration and GHG emission reduction options but the above-mentioned constraints hinder large scale implementation (medium confidence). Deploying land-based mitigation can draw on lessons from experience with regulations, policies, economic incentives, payments (e.g., for biofuels, control of nutrient pollution, water regulations, conservation and forest carbon, ecosystem services, and rural livelihoods), and from diverse forms of knowledge such as Indigenous knowledge, local knowledge and scientific knowledge. Indigenous Peoples, private forest owners, local farmers and communities manage a significant share of global forests and agricultural land and play a central role in land-based mitigation options. Scaling successful policies and measures relies on governance that emphasises integrated land-use planning and management framed by SDGs, with support for implementation. (high confidence) {7.4, Box 7.2, 7.6}
C.10 Demand-side mitigation encompasses changes in infrastructure use, end-use technology adoption, and socio-cultural and behavioural change. Demand-side measures and new ways of end-use service provision can reduce global GHG emissions in end-use sectors by 40–70% by 2050 compared to baseline scenarios, while some regions and socioeconomic groups require additional energy and resources. Demand-side mitigation response options are consistent with improving basic well-being for all. (high confidence)ExpandFigure SPM.6Links to sections5.3, 5.4, Figure 5.6, Figure 5.14, 8.2, 9.4, 10.2, 11.3, 11.4, 12.4, Figure TS.22
C.10.1Infrastructure design and access, and technology access and adoption, including information and communication technologies, influence patterns of demand and ways of providing services, such as mobility, shelter, water, sanitation, and nutrition. Illustrative global low-demand scenarios, accounting for regional differences, indicate that more efficient end-use energy conversion can improve services while reducing the need for upstream energy by 45% by 2050 compared to 2020. Demand-side mitigation potential differs between and within regions, and some regions and populations require additional energy, capacity, and resources for human well-being. The lowest population quartile by income worldwide faces shortfalls in shelter, mobility, and nutrition. (high confidence) {5.2, 5.3, 5.4, 5.5, Figure 5.6, Figure 5.10, Table 5.2, Figure TS.20, Figure TS.22}
C.10.2By 2050, comprehensive demand-side strategies could reduce direct and indirect CO2 and non-CO2GHG emissions in three end-use sectors (buildings, land transport, and food) globally by 40%–70% compared to the 2050 emissions projection of two scenarios consistent with policies announced by national governments until 2020. With policy support, socio-cultural options and behavioural change can reduce global GHG emissions of end-use sectors by at least 5% rapidly, with most of the potential in developed countries, and more until 2050, if combined with improved infrastructure design and access. Individuals with high socio-economic status contribute disproportionately to emissions and have the highest potential for emissions reductions, e.g., as citizens, investors, consumers, role models, and professionals. (high confidence) (Figure SPM.6) {5.2, 5.3, 5.4, 5.5, 5.6, Supplementary Material Table 5.SM.2, 8.4, 9.9, 13.2, 13.5, 13.8, Figure TS.20}
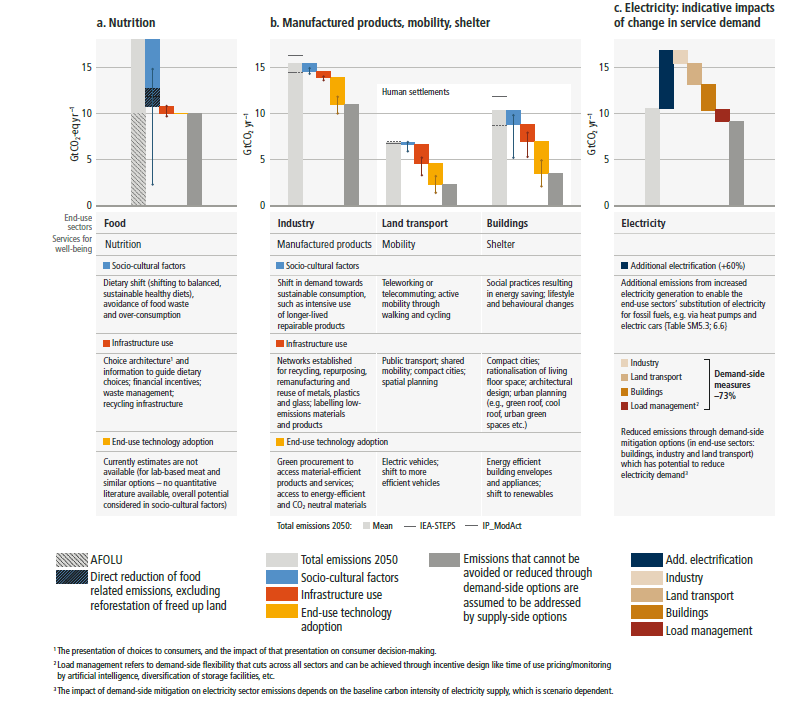
Figure SPM.6 | Indicative potential of demand-side mitigation options by 2050. Figure SPM.6 covers the indicative potential of demand-side options for the year 2050. Figure SPM.7 covers cost and potentials for the year 2030. Demand-side mitigation response options are categorised into three broad domains: ‘socio-cultural factors’, associated with individual choices, behaviour, lifestyle changes, social norms, and culture; ‘infrastructure use’, related to the design and use of supporting hard and soft infrastructure that enables changes in individual choices and behaviour; and ‘end-use technology adoption’, referring to the uptake of technologies by end-users. Demand-side mitigation is a central element of the IMP-LD and IMP-SP scenarios (Figure SPM.5). Panel a (Nutrition) demand-side potentials in 2050 assessment is based on bottom-up studies and is estimated following the 2050 baseline for the food sector presented in peer-reviewed literature (more information in Supplementary Material 5.II, and Section 7.4.5). Panel b (Manufactured products, mobility, shelter) the assessment of potentials for total emissions in 2050 are estimated based on approximately 500 bottom-up studies representing all global regions (detailed list is in Supplementary Material Table 5.SM.2). Baseline is provided by the sectoral mean GHG emissions in 2050 of the two scenarios consistent with policies announced by national governments until 2020. The heights of the coloured columns represent the potentials represented by the median value. These are based on a range of values available in the case studies from literature shown in Supplementary Material 5.SM.II. The range is shown by the dots connected by dotted lines representing the highest and the lowest potentials reported in the literature. Panel a shows the demand-side potential of socio-cultural factors and infrastructure use. The median value of direct emissions (mostly non-CO2) reduction through socio-cultural factors is 1.9 GtCO2-eq without considering land-use change through reforestation of freed up land. If changes in land-use pattern enabled by this change in food demand are considered, the indicative potential could reach 7 GtCO2-eq. Panel b illustrates mitigation potential in industry, land transport and buildings end-use sectors through demand-side options. Key options are presented in the summary table below the figure and the details are in Supplementary Material Table 5.SM.2. Panel c visualises how sectoral demand-side mitigation options (presented in panel b) change demand on the electricity distribution system. Electricity accounts for an increasing proportion of final energy demand in 2050 (additional electricity bar) in line with multiple bottom-up studies (detailed list is in Supplementary Material Table 5.SM.3), and Chapter 6 (Section 6.6). These studies are used to compute the impact of end-use electrification which increases overall electricity demand. Some of the projected increase in electricity demand can be avoided through demand-side mitigation options in the domains of socio-cultural factors and infrastructure use in end-use electricity use in buildings, industry, and land transport found in literature based on bottom-up assessments. Dark grey columns show the emissions that cannot be avoided through demand-side mitigation options. {5.3, Figure 5.7, Supplementary Material 5.SM.II}
C.10.3A range of 5–30% of global annual GHG emissions from end-use sectors are avoidable by 2050, compared to 2050 emissions projection of two scenarios consistent with policies announced by national governments until 2020, through changes in the built environment, new and repurposed infrastructures and service provision through compact cities, co-location of jobs and housing, more efficient use of floor space and energy in buildings, and reallocation of street space for active mobility (high confidence). (Figure SPM.6) {5.3.1, 5.3.3, 5.4, Figure 5.7, Figure 5.13, Table 5.1, Table 5.5, Supplementary Material Table 5.SM.2, 8.4, 9.5, 10.2, 11.3, 11.4, Table 11.6, Box TS.12}
C.10.4Choice architecture 62 can help end-users adopt, as relevant to consumers, culture and country contexts, low-GHG-intensive options such as balanced, sustainable healthy diets 61 acknowledging nutritional needs; food waste reduction; adaptive heating and cooling choices for thermal comfort; building-integrated renewable energy; and electric light-duty vehicles, and shifts to walking, cycling, shared pooled and public transit; and sustainable consumption by intensive use of longer-lived repairable products (high confidence). Addressing inequality and many forms of status consumption 63 and focusing on wellbeing supports climate change mitigation efforts (high confidence). (Figure SPM.6) {2.4.3, 2.6.2, 4.2.5, 5.1, 5.2, 5.3, 5.4, Figure 5.4, Figure 5.10, Table 5.2, Supplementary Material Table 5.SM.2, 7.4.5, 8.2, 8.4, 9.4, 10.2, 12.4, Figure TS.20}
C.11 The deployment of carbon dioxide removal (CDR) to counterbalance hard-to-abate residual emissions is unavoidable if net zero CO2 or GHG emissions are to be achieved. The scale and timing of deployment will depend on the trajectories of gross emission reductions in different sectors. Upscaling the deployment of CDR depends on developing effective approaches to address feasibility and sustainability constraints especially at large scales. (high confidence) ExpandLinks to chapters3.4, 7.4, 12.3, Cross-Chapter Box 8 in Chapter 12
C.11.1CDR refers to anthropogenic activities that remove CO2 from the atmosphere and store it durably in geological, terrestrial, or ocean reservoirs, or in products. CDR methods vary in terms of their maturity, removal process, time scale of carbon storage, storage medium, mitigation potential, cost, co-benefits, impacts and risks, and governance requirements (high confidence). Specifically, maturity ranges from lower maturity (e.g., ocean alkalinisation) to higher maturity (e.g., reforestation); removal and storage potential ranges from lower potential (<1 GtCO2 yr –1, e.g., blue carbon management) to higher potential (>3 GtCO2 yr –1, e.g., agroforestry); costs range from lower cost (e.g., USD-45–100 per tCO2 for soil carbon sequestration) to higher cost (e.g., USD100–300 per tCO2 for DACCS) (medium confidence). Estimated storage time scales vary from decades to centuries for methods that store carbon in vegetation and through soil carbon management, to 10,000 years or more for methods that store carbon in geological formations (high confidence). The processes by which CO2 is removed from the atmosphere are categorised as biological, geochemical or chemical. Afforestation, reforestation, improved forest management, agroforestry and soil carbon sequestration are currently the only widely practiced CDR methods (high confidence). {7.4, 7.6, 12.3, Table 12.6, Cross-Chapter Box 8 in Chapter 12, Table TS.7; AR6 WGI 5.6}
C.11.2The impacts, risks and co-benefits of CDR deployment for ecosystems, biodiversity and people will be highly variable depending on the method, site-specific context, implementation and scale (high confidence). Reforestation, improved forest management, soil carbon sequestration, peatland restoration and blue carbon management are examples of methods that can enhance biodiversity and ecosystem functions, employment and local livelihoods, depending on context (high confidence). In contrast, afforestation or production of biomass crops for BECCS or biochar, when poorly implemented, can have adverse socio-economic and environmental impacts, including on biodiversity, food and water security, local livelihoods and on the rights of Indigenous Peoples, especially if implemented at large scales and where land tenure is insecure (high confidence). Ocean fertilisation, if implemented, could lead to nutrient redistribution, restructuring of ecosystems, enhanced oxygen consumption and acidification in deeper waters (medium confidence). {7.4, 7.6, 12.3, 12.5}
C.11.3The removal and storage of CO2 through vegetation and soil management can be reversed by human or natural disturbances; it is also prone to climate change impacts. In comparison, CO2 stored in geological and ocean reservoirs (via BECCS, DACCS, ocean alkalinisation) and as carbon in biochar is less prone to reversal. (high confidence) {6.4, 7.4, 12.3}
C.11.4In addition to deep, rapid, and sustained emission reductions CDR can fulfil three different complementary roles globally or at country level: lowering net CO2 or net GHG emissions in the near term; counterbalancing ‘hard-to-abate’ residual emissions (e.g., emissions from agriculture, aviation, shipping, industrial processes) in order to help reach net zero CO2 or net zero GHG emissions in the mid-term; and achieving net negative CO2 or GHG emissions in the long term if deployed at levels exceeding annual residual emissions. (high confidence) {3.3, 7.4, 11.3, 12.3, Cross-Chapter Box 8 in Chapter 12}
C.11.5Rapid emission reductions in all sectors interact with future scale of deployment of CDR methods, and their associated risks, impacts and co-benefits. Upscaling the deployment of CDR methods depends on developing effective approaches to address sustainability and feasibility constraints, potential impacts, co-benefits and risks. Enablers of CDR include accelerated research, development and demonstration, improved tools for risk assessment and management, targeted incentives and development of agreed methods for measurement, reporting and verification of carbon flows. (high confidence) {3.4, 7.6, 12.3}
C.12Mitigation options costing USD100 tCO2-eq–1 or less could reduce global GHG emissions by at least half the 2019 level by 2030 (high confidence). Global GDP continues to grow in modelled pathways 64 but, without accounting for the economic benefits of mitigation action from avoided damages from climate change nor from reduced adaptation costs, it is a few percent lower in 2050 compared to pathways without mitigation beyond current policies. The global economic benefit of limiting warming to 2°C is reported to exceed the cost of mitigation in most of the assessed literature (medium confidence).Expand Figure SPM.7Links to chapters3.6, 3.8, Cross-Working Group Box 1 in Chapter 3, 12.2, Box TS.7
C.12.1Based on a detailed sectoral assessment of mitigation options, it is estimated that mitigation options costing USD100 tCO2-eq –1 or less could reduce global GHG emissions by at least half of the 2019 level by 2030 (options costing less than USD20 tCO2-eq –1 are estimated to make up more than half of this potential). 65 For a smaller part of the potential, deployment leads to net cost savings. Large contributions with costs less than USD20 tCO2-eq –1 come from solar and wind energy, energy efficiency improvements, reduced conversion of natural ecosystems, and CH4 emissions reductions (coal mining, oil and gas, waste). The mitigation potentials and mitigation costs of individual technologies in a specific context or region may differ greatly from the provided estimates. The assessment of the underlying literature suggests that the relative contribution of the various options could change beyond 2030. (medium confidence) (Figure SPM.7) {12.2}
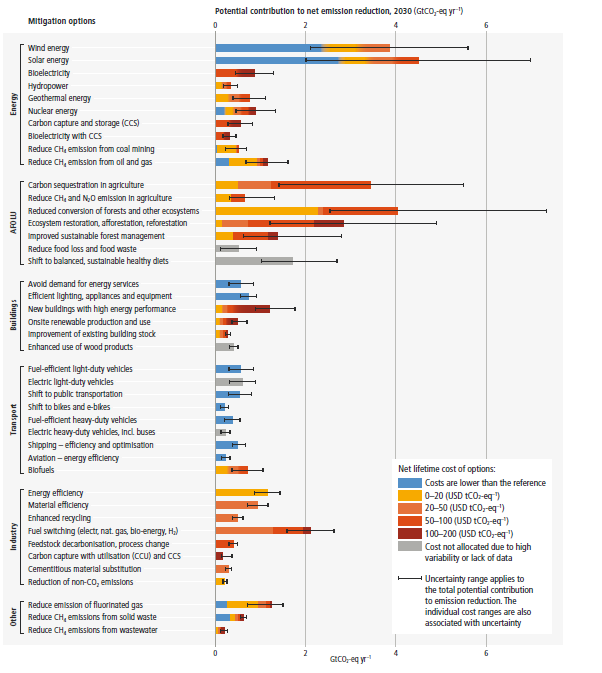
Figure SPM.7: Overview of mitigation options and their estimated ranges of costs and potentials in 2030. Costs shown are net lifetime costs of avoided greenhouse gas emissions. Costs are calculated relative to a reference technology. The assessments per sector were carried out using a common methodology, including definition of potentials, target year, reference scenarios, and cost definitions. The mitigation potential (shown in the horizontal axis) is the quantity of net GHG emission reductions that can be achieved by a given mitigation option relative to a specified emission baseline. Net GHG emission reductions are the sum of reduced emissions and/or enhanced sinks. The baseline used consists of current policy (around 2019) reference scenarios from the AR6 scenarios database (25/75 percentile values). The assessment relies on approximately 175 underlying sources, that together give a fair representation of emission reduction potentials across all regions. The mitigation potentials are assessed independently for each option and are not necessarily additive. {12.2.1, 12.2.2} The length of the solid bars represents the mitigation potential of an option. The error bars display the full ranges of the estimates for the total mitigation potentials. Sources of uncertainty for the cost estimates include assumptions on the rate of technological advancement, regional differences, and economies of scale, among others. Those uncertainties are not displayed in the figure. Potentials are broken down into cost categories, indicated by different colours (see legend). Only discounted lifetime monetary costs are considered. Where a gradual colour transition is shown, the breakdown of the potential into cost categories is not well known or depends heavily on factors such as geographical location, resource availability, and regional circumstances, and the colours indicate the range of estimates. Costs were taken directly from the underlying studies (mostly in the period 2015–2020) or recent datasets. No correction for inflation was applied, given the wide cost ranges used. The cost of the reference technologies were also taken from the underlying studies and recent datasets. Cost reductions through technological learning are taken into account. 69
–When interpreting this figure, the following should be taken into account:
–The mitigation potential is uncertain, as it will depend on the reference technology (and emissions) being displaced, the rate of new technology adoption, and several other factors.
–Cost and mitigation potential estimates were extrapolated from available sectoral studies. Actual costs and potentials would vary by place, context and time.
–Beyond 2030, the relative importance of the assessed mitigation options is expected to change, in particular while pursuing long-term mitigation goals, recognising also that the emphasis for particular options will vary across regions (for specific mitigation options see SPM Sections C4.1, C5.2, C7.3, C8.3 and C9.1).
–Different options have different feasibilities beyond the cost aspects, which are not reflected in the figure (compare with SPM Section E.1).
–The potentials in the cost range USD100–200 tCO2-eq –1 may be underestimated for some options.
–Costs for accommodating the integration of variable renewable energy sources in electricity systems are expected to be modest until 2030, and are not included because of complexities in attributing such costs to individual technology options.
–Cost range categories are ordered from low to high. This order does not imply any sequence of implementation.
–Externalities are not taken into account. {12.2, Table 12.3, 6.4, Table 7.3, Supplementary Material Table 9.SM.2, Supplementary Material Table 9.SM.3, 10.6, 11.4, Figure 11.13, Supplementary Material 12.SM.1.2.3}
C.12.2The aggregate effects of climate change mitigation on global GDP are small compared to global projected GDP growth in assessed modelled global scenarios that quantify the macroeconomic implications of climate change mitigation, but that do not account for damages from climate change nor adaptation costs (high confidence). For example, compared to pathways that assume the continuation of policies implemented by the end of 2020, assessed global GDP reached in 2050 is reduced by 1.3–2.7% in modelled pathways assuming coordinated global action starting between now and 2025 at the latest to limit warming to 2°C (>67%). The corresponding average reduction in annual global GDP growth over 2020–2050 is 0.04–0.09 percentage points. In assessed modelled pathways, regardless of the level of mitigation action, global GDP is projected to at least double (increase by at least 100%) over 2020–2050. For modelled global pathways in other temperature categories, the reductions in global GDP in 2050 compared to pathways that assume the continuation of policies implemented by the end of 2020 are as follows: 2.6–4.2% (C1), 1.6–2.8% (C2), 0.8–2.1% (C4), 0.5–1.2% (C5). The corresponding reductions in average annual global GDP growth over 2020–2050, in percentage points, are as follows: 0.09–0.14 (C1), 0.05–0.09 (C2), 0.03–0.07 (C4), 0.02–0.04 (C5). 66 There are large variations in the modelled effects of mitigation on GDP across regions, depending notably on economic structure, regional emissions reductions, policy design and level of international cooperation 67 (high confidence). Country-level studies also show large variations in the effect of mitigation on GDP depending notably on the level of mitigation and on the way it is achieved (high confidence). Macroeconomic implications of mitigation co-benefits and trade-offs are not quantified comprehensively across the above scenarios and depend strongly on mitigation strategies (high confidence). {3.6, 4.2, Box TS.7, Annex III.I.2, Annex III.I.9, Annex III.I.10 and Annex III.II.3}
C.12.3Estimates of aggregate economic benefits from avoiding damages from climate change, and from reduced adaptation costs, increase with the stringency of mitigation (high confidence). Models that incorporate the economic damages from climate change find that the global cost of limiting warming to 2°C over the 21st century is lower than the global economic benefits of reducing warming, unless: (i) climate damages are towards the low end of the range; or, (ii) future damages are discounted at high rates (medium confidence). 68 Modelled pathways with a peak in global emissions between now and 2025 at the latest, compared to modelled pathways with a later peak in global emissions, entail more rapid near-term transitions and higher up-front investments, but bring long-term gains for the economy, as well as earlier benefits of avoided climate change impacts (high confidence). The precise magnitude of these gains and benefits is difficult to quantify. {1.7, 3.6, Cross-Working Group Box 1 in Chapter 3, Box TS.7; AR6 WGII SPM B.4}
D. Linkages between Mitigation, Adaptation, and Sustainable Development
D.1 Accelerated and equitable climate action in mitigating, and adapting to, climate change impacts is critical to sustainable development. Climate change actions can also result in some trade-offs. The trade-offs of individual options could be managed through policy design. The Sustainable Development Goals (SDGs) adopted under the UN 2030 Agenda for Sustainable Development can be used as a basis for evaluating climate action in the context of sustainable development. (high confidence)Expand Figure SPM.8Links to chapters1.6, 3.7, 17.3, Figure TS.29
D.1.1Human-induced climate change is a consequence of more than a century of net GHG emissions from unsustainable energy use, land-use and land use change, lifestyle and patterns of consumption and production. Without urgent, effective and equitable mitigation actions, climate change increasingly threatens the health and livelihoods of people around the globe, ecosystem health and biodiversity. There are both synergies and trade-offs between climate action and the pursuit of other SDGs. Accelerated and equitable climate action in mitigating, and adapting to, climate change impacts is critical to sustainable development. (high confidence) {1.6, Cross-Chapter Box 5 in Chapter 4, 7.2, 7.3, 17.3; AR6 WGI SPM.A, Figure SPM.2; AR6 WGII SPM.B2, Figure SPM.3, Figure SPM.4b, Figure SPM.5}
D.1.2 Synergies and trade-offs depend on the development context including inequalities, with consideration of climate justice. They also depend on means of implementation, intra- and inter-sectoral interactions, cooperation between countries and regions, the sequencing, timing and stringency of mitigation actions, governance, and policy design. Maximising synergies and avoiding trade-offs pose particular challenges for developing countries, vulnerable populations, and Indigenous Peoples with limited institutional, technological and financial capacity, and with constrained social, human, and economic capital. Trade-offs can be evaluated and minimised by giving emphasis to capacity building, finance, governance, technology transfer, investments, and development and social equity considerations with meaningful participation of Indigenous Peoples and vulnerable populations. (high confidence) {1.6, 1.7, 3.7, 5.2, 5.6, 7.4, 7.6, 17.4}
D.1.3There are potential synergies between sustainable development and energy efficiency, renewable energy, urban planning with more green spaces, reduced air pollution, and demand-side mitigation including shifts to balanced, sustainable healthy diets (high confidence). Electrification combined with low-GHG energy, and shifts to public transport can enhance health, employment, and can elicit energy security and deliver equity (high confidence). In industry, electrification and circular material flows contribute to reduced environmental pressures and increased economic activity and employment. However, some industrial options could impose high costs (medium confidence). (Figure SPM.8) {5.2, 8.2, 11.3, 11.5, 17.3, Figure TS.29}
D.1.4Land-based options such as reforestation and forest conservation, avoided deforestation, restoration and conservation of natural ecosystems and biodiversity, improved sustainable forest management, agroforestry, soil carbon management and options that reduce CH4 and N2O emissions in agriculture from livestock and soil, can have multiple synergies with the SDGs. These include enhancing sustainable agricultural productivity and resilience, food security, providing additional biomass for human use, and addressing land degradation. Maximising synergies and managing trade-offs depend on specific practices, scale of implementation, governance, capacity building, integration with existing land use, and the involvement of local communities and Indigenous Peoples and through benefit-sharing, supported by frameworks such as Land Degradation Neutrality within the UNCCD. (high confidence) {3.7, 7.4, 12.5, 17.3}
D.1.5Trade-offs in terms of employment, water use, land-use competition and biodiversity, as well as access to, and the affordability of, energy, food, and water can be avoided by well-implemented land-based mitigation options, especially those that do not threaten existing sustainable land uses and land rights, though more frameworks for integrated policy implementation are required. The sustainability of bioenergy and other bio-based products is influenced by feedstock, land management practice, climatic region, the context of existing land management, and the timing, scale and speed of deployment. (medium confidence) {3.5, 3.7, 7.4, 12.4, 12.5, 17.1}
D.1.6CDR methods such as soil carbon sequestration and biochar 70 can improve soil quality and food production capacity. Ecosystem restoration and reforestation sequester carbon in plants and soil, and can enhance biodiversity and provide additional biomass, but can displace food production and livelihoods, which calls for integrated approaches to land-use planning, to meet multiple objectives including food security. However, due to limited application of some of the options today, there are some uncertainties about potential benefits. (high confidence) {3.7, 7.4, 7.6, 12.5, 17.3, Table TS.7}
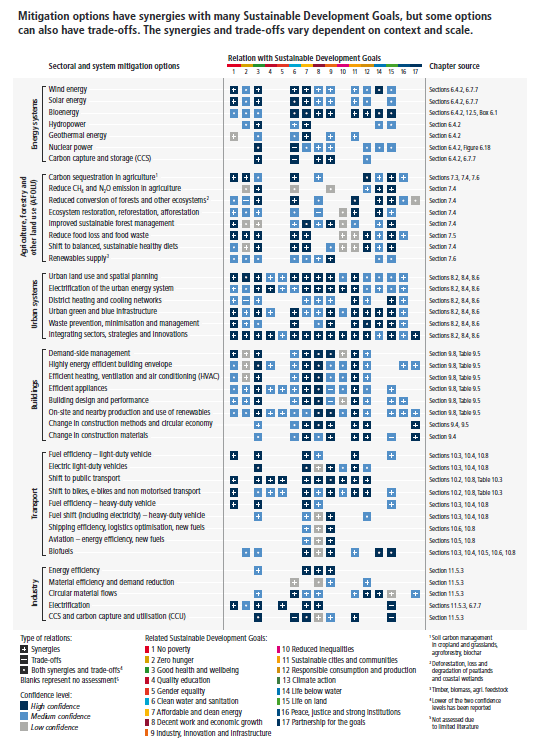
Figure SPM.8: Synergies andtrade-offs between sectoral and system mitigation options and the SDGs. The sectoral chapters (Chapters 6–11) include qualitative assessments of synergies and trade-offs between sectoral mitigation options and the SDGs. Figure SPM.8 presents a summary of the chapter-level assessment for selected mitigation options (see Supplementary Material Table 17.SM.1 for the underlying assessment). The last column provides a line of sight to the sectoral chapters, which provide details on context specificity and dependence of interactions on the scale of implementation. Blank cells indicate that interactions have not been assessed due to limited literature. They do not indicate the absence of interactions between mitigation options and the SDGs. Confidence levels depend on the quality of evidence and level of agreement in the underlying literature assessed by the sectoral chapters. Where both synergies and trade-offs exist, the lower of the confidence levels for these interactions is used. Some mitigation options may have applications in more than one sector or system. The interactions between mitigation options and the SDGs might differ depending on the sector or system, and also on the context and the scale of implementation. Scale of implementation particularly matters when there is competition for scarce resources. {6.3, 6.4, 6.7, 7.3, 7.4, 7.5, 7.6, 8.2, 8.4, 8.6, Figure 8.4, Supplementary Material Table 8.SM.1, Supplementary Material Table 8.SM.2, 9.4, 9.5, 9.8, Table 9.5, 10.3, 10.4, 10.5, 10.6, 10.8, Table 10.3, 11.5, 12.5, 17.3, Figure 17.1, Supplementary Material Table 17.SM.1, Annex II.IV.12}
D.2 There is a strong link between sustainable development, vulnerability and climate risks. Limited economic, social and institutional resources often result in high vulnerability and low adaptive capacity, especially in developing countries (medium confidence). Several response options deliver both mitigation and adaptation outcomes, especially in human settlements, land management, and in relation to ecosystems. However, land and aquatic ecosystems can be adversely affected by some mitigation actions, depending on their implementation (medium confidence). Coordinated cross-sectoral policies and planning can maximise synergies and avoid or reduce trade-offs between mitigation and adaptation (high confidence).ExpandLinks to sections3.7, 4.4, 13.8, 17.3, AR6 WGII
D.2.1 Sustainable urban planning and infrastructure design including green roofs and facades, networks of parks and open spaces, management of urban forests and wetlands, urban agriculture, and water-sensitive design can deliver both mitigation and adaptation benefits in settlements (medium confidence). These options can also reduce flood risks, pressure on urban sewer systems, urban heat island effects, and can deliver health benefits from reduced air pollution (high confidence). There could also be trade-offs. For example, increasing urban density to reduce travel demand, could imply high vulnerability to heat waves and flooding (high confidence). (Figure SPM.8) {3.7, 8.2, 8.4, 12.5, 13.8, 17.3}
D.2.2Land-related mitigation options with potential co-benefits for adaptation include agroforestry, cover crops, intercropping, perennial plants, restoring natural vegetation and rehabilitating degraded land. These can enhance resilience by maintaining land productivity and protecting and diversifying livelihoods. Restoration of mangroves and coastal wetlands sequesters carbon, while also reducing coastal erosion and protecting against storm surges, thus, reducing the risks from sea level rise and extreme weather. (high confidence) {4.4, 7.4, 7.6, 12.5, 13.8}
D.2.3 Some mitigation options can increase competition for scarce resources including land, water and biomass. Consequently, these can also reduce adaptive capacity, especially if deployed at larger scale and with high expansion rates thus exacerbating existing risks, in particular where land and water resources are very limited. Examples include the large-scale or poorly planned deployment of bioenergy, biochar, and afforestation of naturally unforested land. (high confidence) {12.5, 17.3}
D.2.4Coordinated policies, equitable partnerships and integration of adaptation and mitigation within and across sectors can maximise synergies and minimise trade-offs and thereby enhance the support for climate action (medium confidence). Even if extensive global mitigation efforts are implemented, there will be a large need for financial, technical, and human resources for adaptation. Absence or limited resources in social and institutional systems can lead to poorly coordinated responses, thus reducing the potential for maximising mitigation and adaptation benefits, and increasing risk (high confidence). {12.6, 13.8, 17.1, 17.3}
D.3 Enhanced mitigation and broader action to shift development pathways towards sustainability will have distributional consequences within and between countries. Attention to equity and broad and meaningful participation of all relevant actors in decision-making at all scales can build social trust, and deepen and widen support for transformative changes. (high confidence)ExpandLinks to sections3.6, 4.2, 4.5, 5.2, 13.2, 17.3, 17.4
D.3.1Countries at all stages of economic development seek to improve the well-being of people, and their development priorities reflect different starting points and contexts. Different contexts include social, economic, environmental, cultural, or political conditions, resource endowment, capabilities, international environment, and history. The enabling conditions for shifting development pathways towards increased sustainability will therefore also differ, giving rise to different needs. (high confidence) (Figure SPM.2) {1.6, 1.7, 2.4, 2.6, Cross-Chapter Box 5 in Chapter 4, 4.3.2, 17.4}
D.3.2Ambitious mitigation pathways imply large and sometimes disruptive changes in economic structure, with significant distributional consequences, within and between countries. Equity remains a central element in the UN climate regime, notwithstanding shifts in differentiation between states over time and challenges in assessing fair shares. Distributional consequences within and between countries include shifting of income and employment during the transition from high- to low-emissions activities. While some jobs may be lost, low-emissions development can also open more opportunities to enhance skills and create more jobs that last, with differences across countries and sectors. Integrated policy packages can improve the ability to integrate considerations of equity, gender equality and justice. (high confidence) {1.4, 1.6, 3.6, 4.2, 5.2, Box 11.1, 14.3, 15.2, 15.5, 15.6}
D.3.3Inequalities in the distribution of emissions and in the impacts of mitigation policies within countries affect social cohesion and the acceptability of mitigation and other environmental policies. Equity and just transitions can enable deeper ambitions for accelerated mitigation. Applying just transition principles and implementing them through collective and participatory decision-making processes is an effective way of integrating equity principles into policies at all scales, in different ways depending on national circumstances (medium confidence). This is already taking place in many countries and regions, as national just transition commissions or task forces, and related national policies, have been established in several countries. A multitude of actors, networks, and movements are engaged (high confidence). {1.6, 1.7, 2.4, 2.6, 4.5, 13.2, 13.9, 14.3, 14.5}
D.3.4Broadening equitable access to domestic and international finance, technologies that facilitate mitigation, and capacity, while explicitly addressing needs can further integrate equity and justice into national and international policies and act as a catalyst for accelerating mitigation and shifting development pathways (medium confidence). The consideration of ethics and equity can help address the uneven distribution of adverse impacts associated with 1.5°C and higher levels of global warming, in all societies (high confidence). Consideration of climate justice can help to facilitate shifting development pathways towards sustainability, including through equitable sharing of benefits and burdens of mitigation, increasing resilience to the impacts of climate change, especially for vulnerable countries and communities, and equitably supporting those in need (high confidence). {1.4, 1.6, 1.7, 3.6, 4.2, 4.5, Box 5.10, 13.4, 13.8, 13.9, 14.3, 14.5, 15.2, 15.5, 15.6, 16.5, 17.3, 17.4; SR1.5 SPM, AR6 WGII Chapter 18}
E. Strengthening the Response
E.1There are mitigation options which are feasible71 to deploy at scale in the near term. Feasibility differs across sectors and regions, and according to capacities and the speed and scale of implementation. Barriers to feasibility would need to be reduced or removed, and enabling conditions72 strengthened to deploy mitigation options at scale. These barriers and enablers include geophysical, environmental-ecological, technological, and economic factors, and especially institutional and socio-cultural factors. Strengthened near-term action beyond the NDCs (announced prior to UNFCCC COP26) can reduce and/or avoid long-term feasibility challenges of global modelled pathways that limit warming to 1.5°C (>50%) with no or limited overshoot. (high confidence)ExpandLinks to chapters3.8, 6.4, 8.5, 9.9, 10.8, 12.3, Figure TS.31, Annex II.IV.11
E.1.1 Several mitigation options, notably solar energy, wind energy, electrification of urban systems, urban green infrastructure, energy efficiency, demand-side management, improved forest- and crop/grassland management, and reduced food waste and loss, are technically viable, are becoming increasingly cost effective, and are generally supported by the public. This enables deployment in many regions (high confidence). While many mitigation options have environmental co-benefits, including improved air quality and reducing toxic waste, many also have adverse environmental impacts, such as reduced biodiversity, when applied at very large scale, for example very large scale bioenergy or large scale use of battery storage, that would have to be managed (medium confidence). Almost all mitigation options face institutional barriers that need to be addressed to enable their application at scale (medium confidence). {6.4, Figure 6.19, 7.4, 8.5, Figure 8.19, 9.9, Figure 9.20, 10.8, Figure 10.23, 12.3, Figure 12.4, Figure TS.31}
E.1.2The feasibility of mitigation options varies according to context and time. For example, the institutional capacity to support deployment varies across countries; the feasibility of options that involve large-scale land-use changes varies across regions; spatial planning has a higher potential at early stages of urban development; the potential of geothermal is site specific; and capacities, cultural and local conditions can either inhibit or enable demand-side responses. The deployment of solar and wind energy has been assessed to become increasingly feasible over time. The feasibility of some options can increase when combined or integrated, such as using land for both agriculture and centralised solar production. (high confidence) {6.4, 6.6, Supplementary Material Table 6.SM, 7.4, 8.5, Supplementary Material Table 8.SM.2, 9.9, Supplementary Material Table 9.SM.1, 10.8, Appendix 10.3, 12.3, Tables 12.SM.2.1 to 12.SM.2.6}
E.1.3Feasibility depends on the scale and speed of implementation. Most options face barriers when they are implemented rapidly at a large scale, but the scale at which barriers manifest themselves varies. Strengthened and coordinated near-term actions in cost-effective modelled global pathways that limit warming to 2°C (>67%) or lower, reduce the overall risks to the feasibility of the system transitions, compared to modelled pathways with relatively delayed or uncoordinated action. 73 (high confidence) {3.8, 6.4, 10.8, 12.3}
E.2 In all countries, mitigation efforts embedded within the wider development context can increase the pace, depth and breadth of emissions reductions (medium confidence). Policies that shift development pathways towards sustainability can broaden the portfolio of available mitigation responses, and enable the pursuit of synergies with development objectives (medium confidence). Actions can be taken now to shift development pathways and accelerate mitigation and transitions across systems (high confidence)ExpandLinks to chapters4.3, 4.4, Cross-Chapter Box 5 in Chapter 4, 5.2, 5.4, 13.9, 14.5, 15.6, 16.3, 16.4, 16.5
E.2.1Current development pathways may create behavioural, spatial, economic and social barriers to accelerated mitigation at all scales (high confidence). Choices made by policymakers, citizens, the private sector and other stakeholders influence societies’ development pathways (high confidence). Actions that steer, for example, energy and land systems transitions, economy-wide structural change, and behaviour change, can shift development pathways towards sustainability 74 (medium confidence). {4.3, Cross-Chapter Box 5 in Chapter 4, 5.4, 13.9}
E.2.2Combining mitigation with policies to shift development pathways, such as broader sectoral policies, policies that induce lifestyle or behaviour changes, financial regulation, or macroeconomic policies can overcome barriers and open up a broader range of mitigation options (high confidence). It can also facilitate the combination of mitigation and other development goals (high confidence). For example, measures promoting walkable urban areas combined with electrification and renewable energy can create health co-benefits from cleaner air and benefits from enhanced mobility (high confidence). Coordinated housing policies that broaden relocation options can make mitigation measures in transport more effective (medium confidence). {3.2, 4.3, 4.4, Cross-Chapter Box 5 in Chapter 4, 5.3, 8.2, 8.4}
E.2.3Institutional and regulatory capacity, innovation, finance, improved governance and collaboration across scales, and multi-objective policies enable enhanced mitigation and shifts in development pathways. Such interventions can be mutually reinforcing and establish positive feedback mechanisms, resulting in accelerated mitigation. (high confidence) {4.4, 5.4, Figure 5.14, 5.6, 9.9, 13.9, 14.5, 15.6, 16.3, 16.4, 16.5, Cross-Chapter Box 12 in Chapter 16}
E.2.4Enhanced action on all the above enabling conditions can be taken now (high confidence). In some situations, such as with innovation in technology at an early stage of development and some changes in behaviour towards low emissions, because the enabling conditions may take time to be established, action in the near term can yield accelerated mitigation in the mid-term (medium confidence). In other situations, the enabling conditions can be put in place and yield results in a relatively short time frame, for example the provision of energy related information, advice and feedback to promote energy saving behaviour (high confidence). {4.4, 5.4, Figure 5.14, 5.6, 6.7, 9.9, 13.9, 14.5, 15.6, 16.3, 16.4, 16.5, Cross-Chapter Box 12 in Chapter 16}
E.3Climate governance, acting through laws, strategies and institutions, based on national circumstances, supports mitigation by providing frameworks through which diverse actors interact, and a basis for policy development and implementation (medium confidence). Climate governance is most effective when it integrates across multiple policy domains, helps realise synergies and minimise trade-offs, and connects national and sub-national policymaking levels (high confidence). Effective and equitable climate governance builds on engagement with civil society actors, political actors, businesses, youth, labour, media, Indigenous Peoples and local communities (medium confidence).ExpandLinks to chapters5.4, 5.6, 8.5, 9.9, 13.2, 13.7, 13.9
E.3.1Climate governance enables mitigation by providing an overall direction, setting targets, mainstreaming climate action across policy domains, enhancing regulatory certainty, creating specialised organisations and creating the context to mobilise finance (medium confidence). These functions can be promoted by climate-relevant laws, which are growing in number, or climate strategies, among others, based on national and sub-national context (medium confidence). Framework laws set an overarching legal basis, either operating through a target and implementation approach, or a sectoral mainstreaming approach, or both, depending on national circumstance (medium confidence). Direct national and sub-national laws that explicitly target mitigation and indirect laws that impact emissions through mitigation-related policy domains have both been shown to be relevant to mitigation outcomes (medium confidence). {13.2}
E.3.2Effective national climate institutions address coordination across sectors, scales and actors, build consensus for action among diverse interests, and inform strategy setting (medium confidence). These functions are often accomplished through independent national expert bodies, and high-level coordinating bodies that transcend departmental mandates. Complementary sub-national institutions tailor mitigation actions to local context and enable experimentation but can be limited by inequities and resource and capacity constraints (high confidence). Effective governance requires adequate institutional capacity at all levels (high confidence). {4.4, 8.5, 9.9, 11.3, 11.5, 11.6, 13.2, 13.5, 13.7, 13.9}
E.3.3The extent to which civil society actors, political actors, businesses, youth, labour, media, Indigenous Peoples, and local communities are engaged influences political support for climate change mitigation and eventual policy outcomes. Structural factors of national circumstances and capabilities (e.g., economic and natural endowments, political systems and cultural factors and gender considerations) affect the breadth and depth of climate governance. Mitigation options that align with prevalent ideas, values and beliefs are more easily adopted and implemented. Climate-related litigation, for example by governments, private sector, civil society and individuals, is growing - with a large number of cases in some developed countries, and with a much smaller number in some developing countries - and in some cases, has influenced the outcome and ambition of climate governance. (medium confidence) {5.2, 5.4, 5.5, 5.6, 9.9, 13.3, 13.4}
E.4Many regulatory and economic instruments have already been deployed successfully. Instrument design can help address equity and other objectives. These instruments could support deep emissions reductions and stimulate innovation if scaled up and applied more widely (high confidence). Policy packages that enable innovation and build capacity are better able to support a shift towards equitable low-emission futures than are individual policies (high confidence). Economy-wide packages, consistent with national circumstances, can meet short-term economic goals while reducing emissions and shifting development pathways towards sustainability (medium confidence).ExpandLinks to chaptersCross-Chapter Box 5 in Chapter 4, 13.6, 13.7, 13.9, 16.3, 16.4, 16.6
E.4.1A wide range of regulatory instruments at the sectoral level have proven effective in reducing emissions. These instruments, and broad-based approaches including relevant economic instruments, 75 are complementary (high confidence). Regulatory instruments that are designed to be implemented with flexibility mechanisms can reduce costs (medium confidence). Scaling up and enhancing the use of regulatory instruments, consistent with national circumstances, could improve mitigation outcomes in sectoral applications, including but not limited to renewable energy, land use and zoning, building codes, vehicle and energy efficiency, fuel standards, and low-emissions industrial processes and materials (high confidence). {6.7, 7.6, 8.4, 9.9, 10.4, 11.5, 11.6, 13.6}
E.4.2Economic instruments have been effective in reducing emissions, complemented by regulatory instruments mainly at the national and also sub-national and regional level (high confidence). Where implemented, carbon pricing instruments have incentivised low-cost emissions reduction measures, but have been less effective, on their own and at prevailing prices during the assessment period, in promoting the higher-cost measures necessary for further reductions (medium confidence). Equity and distributional impacts of such carbon pricing instruments can be addressed by using revenue from carbon taxes or emissions trading to support low-income households, among other approaches (high confidence). Practical experience has informed instrument design and helped to improve predictability, environmental effectiveness, economic efficiency, distributional goals and social acceptance (high confidence). Removing fossil fuel subsidies would reduce emissions, improve public revenue and macroeconomic performance, and yield other environmental and sustainable development benefits; subsidy removal may have adverse distributional impacts especially on the most economically vulnerable groups which, in some cases can be mitigated by measures such as redistributing revenue saved, all of which depend on national circumstances (high confidence); fossil fuel subsidy removal is projected by various studies to reduce global CO2 emissions by 1–4%, and GHG emissions by up to 10% by 2030, varying across regions (medium confidence). {6.3, 13.6}
E.4.3Low-emission technological innovation is strengthened through the combination of dedicated technology-push policies and investments (e.g., for scientific training, R&D, demonstration), with tailored demand-pull policies (e.g., standards, feed-in tariffs, taxes), which create incentives and market opportunities. Developing countries’ abilities to deploy low-emission technologies, seize socio-economic benefits and manage trade-offs would be enhanced with increased financial resources and capacity for innovation which are currently concentrated in developed countries, alongside technology transfer. (high confidence) {16.2, 16.3, 16.4, 16.5}
E.4.4Effective policy packages would be comprehensive in coverage, harnessed to a clear vision for change, balanced across objectives, aligned with specific technology and system needs, consistent in terms of design and tailored to national circumstances. They are better able to realise synergies and avoid trade-offs across climate and development objectives. Examples include: emissions reductions from buildings through a mix of efficiency targets, building codes, appliance performance standards, information provision, carbon pricing, finance and technical assistance; and industrial GHG emissions reductions through innovation support, market creation and capacity building. (high confidence) {4.4, 6.7, 9.9, 11.6, 13.7, 13.9, 16.3, 16.4}
E.4.5Economy-wide packages that support mitigation and avoid negative environmental outcomes include: long-term public spending commitments; pricing reform; and investment in education and training, natural capital, R&D and infrastructure (high confidence). They can meet short-term economic goals while reducing emissions and shifting development pathways towards sustainability (medium confidence). Infrastructure investments can be designed to promote low-emissions futures that meet development needs (medium confidence). {Cross-Chapter Box 5 in Chapter 4, 5.4, 5.6, 8.5, 13.6, 13.9, 16.3, 16.5, 16.6}
E.4.6National policies to support technology development and diffusion, and participation in international markets for emission reduction, can bring positive spillover effects for other countries (medium confidence), although reduced demand for fossil fuels could result in costs to exporting countries (high confidence). There is no consistent evidence that current emission trading systems have led to significant emissions leakage, which can be attributed to design features aimed at minimising competitiveness effects, among other reasons (medium confidence). {13.6, 13.7, 13.8, 16.2, 16.3, 16.4}
E.5 Tracked financial flows fall short of the levels needed to achieve mitigation goals across all sectors and regions. The challenge of closing gaps is largest in developing countries as a whole. Scaling up mitigation financial flows can be supported by clear policy choices and signals from governments and the international community (high confidence). Accelerated international financial cooperation is a critical enabler of low-GHG and just transitions, and can address inequities in access to finance and the costs of, and vulnerability to, the impacts of climate change (high confidence)ExpandLinks to chapters15.2, 15.3, 15.4, 15.5, 15.6
E.5.1Average annual modelled investment requirements for 2020 to 2030 in scenarios that limit warming to 2°C or 1.5°C are a factor of three to six greater than current levels, and total mitigation investments (public, private, domestic and international) would need to increase across all sectors and regions (medium confidence). Mitigation investment gaps are wide for all sectors, and widest for the AFOLU sector in relative terms and for developing countries 76 (high confidence). Financing and investment requirements for adaptation, reduction of losses and damages, general infrastructure, regulatory environment and capacity building, and climate-responsive social protection further exacerbate the magnitude of the challenges for developing countries to attract financing (high confidence). {3.2, 14.4, 15.1, 15.2, 15.3, 15.4, 15.5}
E.5.2There is sufficient global capital and liquidity to close global investment gaps, given the size of the global financial system, but there are barriers to redirect capital to climate action both within and outside the global financial sector, and in the macroeconomic headwinds facing developing regions. Barriers to the deployment of commercial finance from within the financial sector as well as macroeconomic considerations include: inadequate assessment of climate-related risks and investment opportunities; regional mismatch between available capital and investment needs; home bias factors; country indebtedness levels; economic vulnerability; and limited institutional capacities (high confidence). Challenges from outside the financial sector include: limited local capital markets; unattractive risk-return profiles, in particular due to missing or weak regulatory environments consistent with ambition levels; limited institutional capacity to ensure safeguards; standardisation, aggregation, scalability and replicability of investment opportunities and financing models; and, a pipeline ready for commercial investments. (high confidence) {15.2, 15.3, 15.5, 15.6}
E.5.3Accelerated financial support for developing countries from developed countries and other sources is a critical enabler to enhance mitigation action and address inequities in access to finance, including its costs, terms and conditions, and economic vulnerability to climate change for developing countries (high confidence). Scaled-up public grants for mitigation and adaptation funding for vulnerable regions, especially in Sub-Saharan Africa, would be cost-effective and have high social returns in terms of access to basic energy (high confidence). Options for scaling up mitigation in developing regions include: increased levels of public finance and publicly mobilised private finance flows from developed to developing countries in the context of the USD100 billion-a-year goal; increase the use of public guarantees to reduce risks and leverage private flows at lower cost; local capital markets development; and building greater trust in international cooperation processes (high confidence). A coordinated effort to make the post-pandemic recovery sustainable and increased flows of financing over the next decade can accelerate climate action, including in developing regions and countries facing high debt costs, debt distress and macroeconomic uncertainty (high confidence). {15.2, 15.3, 15.4, 15.5, 15.6, Box 15.6}
E.5.4Clear signalling by governments and the international community, including a stronger alignment of public sector finance and policy, and higher levels of public sector climate finance, reduces uncertainty and transition risks for the private sector. Depending on national contexts, investors and financial intermediaries, central banks, and financial regulators can support climate action and can shift the systemic underpricing of climate-related risk by increasing awareness, transparency and consideration of climate-related risk, and investment opportunities. Financial flows can also be aligned with funding needs through: greater support for technology development; a continued role for multilateral and national climate funds and development banks; lowering financing costs for underserved groups through entities such as green banks existing in some countries, funds and risk-sharing mechanisms; economic instruments which consider economic and social equity and distributional impacts; gender-responsive and women-empowerment programmes as well as enhanced access to finance for local communities and Indigenous Peoples and small land owners; and greater public-private cooperation. (high confidence) {15.2, 15.5, 15.6}
E.6International cooperation is a critical enabler for achieving ambitious climate change mitigation goals. The UNFCCC, Kyoto Protocol, and Paris Agreement are supporting rising levels of national ambition and encouraging development and implementation of climate policies, although gaps remain. Partnerships, agreements, institutions and initiatives operating at the sub-global and sectoral levels and engaging multiple actors are emerging, with mixed levels of effectiveness. (high confidence)ExpandLinks to chapters8.5, 14.2, 14.3, 14.5, 14.6, 15.6, 16.5
E.6.1Internationally agreed processes and goals, such as those in the UNFCCC, Kyoto Protocol, and Paris Agreement – including transparency requirements for national reporting on emissions, actions and support, and tracking progress towards the achievement of Nationally Determined Contributions – are enhancing international cooperation, national ambition and policy development. International financial, technology and capacity building support to developing countries will enable greater implementation and encourage ambitious Nationally Determined Contributions over time. (medium confidence) {14.3}
E.6.2International cooperation on technology development and transfer accompanied by capacity building, knowledge sharing, and technical and financial support can accelerate the global diffusion of mitigation technologies, practices and policies at national and sub-national levels, and align these with other development objectives (high confidence). Challenges in and opportunities to enhance innovation cooperation exist, including in the implementation of elements of the UNFCCC and the Paris Agreement as per the literature assessed, such as in relation to technology development and transfer, and finance (high confidence). International cooperation on innovation works best when tailored to specific institutional and capability contexts, when it benefits local value chains, when partners collaborate equitably and on voluntary and mutually agreed terms, when all relevant voices are heard, and when capacity building is an integral part of the effort (medium confidence). Support to strengthen technological innovation systems and innovation capabilities, including through financial support in developing countries would enhance engagement in and improve international cooperation on innovation (high confidence). {4.4, 14.2, 14.4, 16.3, 16.5, 16.6}
E.6.3Transnational partnerships can stimulate policy development, low-emissions technology diffusion and emission reductions by linking sub-national and other actors, including cities, regions, non-governmental organisations and private sector entities, and by enhancing interactions between state and non-state actors. While this potential of transnational partnerships is evident, uncertainties remain over their costs, feasibility, and effectiveness. Transnational networks of city governments are leading to enhanced ambition and policy development and a growing exchange of experience and best practices (medium confidence). {8.5, 11.6, 14.5, 16.5, Cross-Chapter Box 12 in Chapter 16}
E.6.4International environmental and sectoral agreements, institutions, and initiatives are helping, and in some cases may help, to stimulate low-GHG emissions investment and reduce emissions. Agreements addressing ozone depletion and transboundary air pollution are contributing to mitigation, and in other areas, such as atmospheric emissions of mercury, may contribute to mitigation (high confidence). Trade rules have the potential to stimulate international adoption of mitigation technologies and policies, but may also limit countries’ ability to adopt trade-related climate policies (medium confidence). Current sectoral levels of ambition vary, with emission reduction aspirations in international aviation and shipping lower than in many other sectors (medium confidence). {14.5, 14.6}
1 The Report covers literature accepted for publication by 11 October 2021.
2 Each finding is grounded in an evaluation of underlying evidence and agreement. A level of confidence is expressed using five qualifiers, typeset in italics: very low, low, medium, high and very high. The assessed likelihood of an outcome or a result is described as: virtually certain 99–100% probability; very likely 90–100%; likely 66–100%; more likely than not 50–100%; about as likely as not 33–66%; unlikely 0–33%; very unlikely 0–10%; exceptionally unlikely 0–1%. Additional terms may also be used when appropriate, consistent with the IPCC uncertainty guidance: https://www.ipcc.ch/site/assets/uploads/2018/05/uncertainty-guidance-note.pdf.
3 The three Special Reports are: Global Warming of 1.5°C: an IPCC Special Report on the impacts of global warming of 1.5°C above pre-industrial levels and related global greenhouse gas emission pathways, in the context of strengthening the global response to the threat of climate change, sustainable development, and efforts to eradicate poverty (2018); Climate Change and Land: an IPCC Special Report on climate change, desertification, land degradation, sustainable land management, food security, and greenhouse gas fluxes in terrestrial ecosystems (2019); IPCC Special Report on the Ocean and Cryosphere in a Changing Climate (2019).
4 The term ‘temperature’ is used in reference to 'global surface temperatures' throughout this SPM as defined in footnote 8 of the AR6 WGI SPM (see note 14 of Table SPM.2). Emission pathways and associated temperature changes are calculated using various forms of models, as summarised in Box SPM.1 and Chapter 3, and discussed in Annex III.
5 Namely: Economic Benefits from Avoided Climate Impacts along Long-Term Mitigation Pathways {Cross-Working Group Box 1 in Chapter 3}; Urban: Cities and Climate Change {Cross-Working Group Box 2 in Chapter 8}; and Mitigation and Adaptation via the Bioeconomy {Cross-Working Group Box 3 in Chapter 12}.
6 Net GHG emissions in this report refer to releases of greenhouse gases from anthropogenic sources minus removals by anthropogenic sinks, for those species of gases that are reported under the common reporting format of the United Nations Framework Convention on Climate Change (UNFCCC): CO2 from fossil fuel combustion and industrial processes (CO2-FFI); net CO2 emissions from land use, land-use change and forestry (CO2-LULUCF); methane (CH4); nitrous oxide (N2O); and fluorinated gases (F-gases) comprising hydrofluorocarbons (HFCs), perfluorocarbons (PFCs), sulphur hexafluoride (SF6), as well as nitrogen trifluoride (NF3). Different datasets for GHG emissions exist, with varying time horizons and coverage of sectors and gases, including some that go back to 1850. In this report, GHG emissions are assessed from 1990, and CO2 sometimes also from 1850. Reasons for this include data availability and robustness, scope of the assessed literature, and the differing warming impacts of non-CO2 gases over time.
7 GHG emission metrics are used to express emissions of different greenhouse gases in a common unit. Aggregated GHG emissions in this report are stated in CO2-equivalent (CO2-eq) using the Global Warming Potential with a time horizon of 100 years (GWP100) with values based on the contribution of Working Group I to the AR6. The choice of metric depends on the purpose of the analysis, and all GHG emission metrics have limitations and uncertainties, given that they simplify the complexity of the physical climate system and its response to past and future GHG emissions. {Cross-Chapter Box 2 in Chapter 2, Supplementary Material 2.SM.3, Box TS.2; AR6 WGI <a class='section-link' data-title='Agriculture, Forestry, and Other Land Uses (AFOLU)' href='/chapters/chapter-7'>Chapter 7</a> Supplementary Material}
8 In this SPM, uncertainty in historic GHG emissions is reported using 90% uncertainty intervals unless stated otherwise. GHG emission levels are rounded to two significant digits; as a consequence, small differences in sums due to rounding may occur.
9 Global databases make different choices about which emissions and removals occurring on land are considered anthropogenic. Currently, net CO2 fluxes from land reported by global bookkeeping models used here are estimated to be about 5.5 GtCO2 yr –1 higher than the aggregate global net emissions based on national GHG inventories. This difference, which has been considered in the literature, mainly reflects differences in how anthropogenic forest sinks and areas of managed land are defined. Other reasons for this difference, which are more difficult to quantify, can arise from the limited representation of land management in global models and varying levels of accuracy and completeness of estimated LULUCF fluxes in national GHG inventories. Neither method is inherently preferable. Even when the same methodological approach is applied, the large uncertainty of CO2-LULUCF emissions can lead to substantial revisions to estimated emissions. {Cross-Chapter Box 3 in Chapter 3, 7.2, SRCCL SPM A.3.3}
10 For consistency with WGI, historical cumulative CO2 emissions from 1850 to 2019 are reported using 68% confidence intervals.
11 The carbon budget is the maximum amount of cumulative net global anthropogenic CO2 emissions that would result in limiting global warming to a given level with a given likelihood, taking into account the effect of other anthropogenic climate forcers. This is referred to as the ‘total carbon budget’ when expressed starting from the pre-industrial period, and as the ‘remaining carbon budget’ when expressed from a recent specified date. The total carbon budgets reported here are the sum of historical emissions from 1850 to 2019 and the remaining carbon budgets from 2020 onwards, which extend until global net zero CO2 emissions are reached. {Annex I: Glossary; WGI SPM}
12 Uncertainties for total carbon budgets have not been assessed and could affect the specific calculated fractions.
13 Sector definitions can be found in Annex II.9.1.
14 Land overall constituted a net sink of –6.6 (±4.6) GtCO2 yr –1 for the period 2010–2019, comprising a gross sink of –12.5 (±3.2) GtCO2 yr –1 resulting from responses of all land to both anthropogenic environmental change and natural climate variability, and net anthropogenic CO2-LULUCF emissions +5.7 (±4.0) GtCO2 yr –1 based on bookkeeping models. {Table 2.1, 7.2, Table 7.1}
15 This estimate is based on consumption-based accounting, including both direct emissions from within urban areas, and indirect emissions from outside urban areas related to the production of electricity, goods and services consumed in cities. These estimates include all CO2 and CH4 emission categories except for aviation and marine bunker fuels, land-use change, forestry and agriculture. {8.1, Annex I: Glossary}
16 See Box SPM.1 for the categorisation of modelled long-term emission scenarios based on projected temperature outcomes and associated probabilities adopted in this report.
17 See Annex II, Part 1 for regional groupings adopted in this report.
18 In 2019, LDCs are estimated to have emitted 3.3% of global GHG emissions, and SIDS are estimated to have emitted 0.6% of global GHG emissions, excluding CO2-LULUCF. These country groupings cut across geographic regions and are not depicted separately in Figure SPM.2. {Figure 2.10}
19 In this report, access to modern energy services is defined as access to clean, reliable and affordable energy services for cooking and heating, lighting, communications, and productive uses. {Annex I: Glossary}
20 In this report, decent living standards are defined as a set of minimum material requirements essential for achieving basic human well-being, including nutrition, shelter, basic living conditions, clothing, health care, education, and mobility. {5.1}
21 Consumption-based emissions refer to emissions released to the atmosphere to generate the goods and services consumed by a certain entity (e.g., a person, firm, country, or region). The bottom 50% of emitters spend less than USD3 PPP (purchasing power parity) per capita per day. The top 10% of emitters (an open-ended category) spend more than USD23 PPP per capita per day. The wide range of estimates for the contribution of the top 10% results from the wide range of spending in this category and differing methods in the assessed literature. {2.6, Annex I: Glossary}
22 Estimates of financial flows (comprising both private and public, domestic and international flows) are based on a single report which assembles data from multiple sources and which has applied various changes to their methodology over the past years. Such data can suggest broad trends but is subject to uncertainties.
23 NDCs announced prior to COP26 refer to the most recent Nationally Determined Contributions submitted to the UNFCCC up to the literature cut-off date of this report, 11 October 2021, and revised NDCs announced by China, Japan and the Republic of Korea prior to October 2021 but only submitted thereafter. 25 NDC updates were submitted between 12 October 2021 and the start of COP26.
24 This implies that mitigation after 2030 can no longer establish a pathway with less than 67% probability to exceed 1.5°C during the 21st century, a defining feature of the class of pathways that limit warming to 1.5°C (>50%) with no or limited overshoot assessed in this report (category C1 in Table SPM.2). These pathways limit warming to 1.6°C or lower throughout the 21st century with a 50% likelihood.
25 The policy cut-off date in studies used to project GHG emissions of ‘policies implemented by the end of 2020’ varies between July 2019 and November 2020. {Table 4.2}
26 Immediate action in modelled global pathways refers to the adoption between 2020 and at latest before 2025 of climate policies intended to limit global warming to a given level. Modelled pathways that limit warming to 2°C (>67%) based on immediate action are summarised in category C3a in Table SPM.2. All assessed modelled global pathways that limit warming to 1.5°C (>50%) with no or limited overshoot assume immediate action as defined here (Category C1 in Table SPM.2).
27 In this report, ‘unconditional’ elements of NDCs refer to mitigation efforts put forward without any conditions. ‘Conditional’ elements refer to mitigation efforts that are contingent on international cooperation, for example bilateral and multilateral agreements, financing or monetary and/or technological transfers. This terminology is used in the literature and the UNFCCC’s NDC Synthesis Reports, not by the Paris Agreement. {4.2.1, 14.3.2}
28 Two types of gaps are assessed: the implementation gap is calculated as the difference between the median of global emissions in 2030 implied by policies implemented by the end of 2020 and those implied by NDCs announced prior to COP26. The emissions gap is calculated as the difference between GHG emissions implied by the NDCs (minimum/maximum emissions in 2030) and the median of global GHG emissions in modelled pathways limiting warming to specific levels based on immediate action and with stated likelihoods as indicated (Table SPM.2).
29 Original NDCs refer to those submitted to the UNFCCC in 2015 and 2016. Unconditional elements of NDCs announced prior to COP26 imply global GHG emissions in 2030 that are 3.8 [3.0–5.3] GtCO2-eq yr –1 lower than those from the original NDCs, and 4.5 [2.7–6.3] GtCO2-eq yr –1 lower when conditional elements of NDCs are included. NDC updates at or after COP26 could further change the implied emissions.
30 Median and very likely range [5th to 95th percentile].
31 Returning to below 1.5°C in 2100 from GHG emissions levels in 2030 associated with the implementation of NDCs is infeasible for some models due to model-specific constraints on the deployment of mitigation technologies and the availability of net negative CO2 emissions.
32 See Box SPM.1 for a description of the approach to project global warming outcomes of modelled pathways and its consistency with the climate assessment in AR6 WGI.
33 Historical operating patterns are described by load factors and lifetimes of fossil fuel installations as observed in the past (average and range).
34 Abatement here refers to human interventions that reduce the amount of greenhouse gases that are released from fossil fuel infrastructure to the atmosphere.
35 Total cumulative CO2 emissions up to the time of global net zero CO2 emissions are similar but not identical to the remaining carbon budget for a given temperature limit assessed by Working Group I. This is because the modelled emission scenarios assessed by Working Group III cover a range of temperature levels up to a specific limit, and exhibit a variety of reductions in non-CO2 emissions that also contribute to overall warming. {Box 3.4}
36 In this context, capture rates of new installations with CCS are assumed to be 90–95%+ {11.3.5}. Capture rates for retrofit installations can be comparable, if plants are specifically designed for CCS retrofits {11.3.6}.
37 All reported warming levels are relative to the period 1850–1900. If not otherwise specified, ‘pathways’ always refer to pathways computed with a model. Immediate action in the pathways refers to the adoption of climate policies between 2020 and at latest 2025 intended to limit global warming at a given level.
38 Long-term warming is calculated from all modelled pathways assuming mitigation efforts consistent with national policies that were implemented by the end of 2020 (scenarios that fall into policy category P1b of Chapter 3) and that pass through the 2030 GHG emissions ranges of such pathways assessed in Chapter 4 (see footnote 25). {3.2, Table 4.2}
39 Warming estimates refer to the 50th and [5th–95th] percentile across the modelled pathways and the median temperature change estimate of the probabilistic WGI climate model emulators (see Table SPM.2 footnote a).
40 In this report, emissions reductions are reported relative to 2019 modelled emission levels, while in SR1.5 emissions reductions were calculated relative to 2010. Between 2010 and 2019 global GHG and global CO2 emissions have grown by 12% (6.5 GtCO2-eq) and 13% (5.0 GtCO2) respectively. In global modelled pathways assessed in this report that limit warming to 1.5°C (>50%) with no or limited overshoot, GHG emissions are projected to be reduced by 37% [28–57%] in 2030 relative to 2010. In the same type of pathways assessed in SR1.5, reported GHG emissions reductions in 2030 were 39–51% (interquartile range) relative to 2010. In absolute terms, the 2030 GHG emissions levels of pathways that limit warming to 1.5°C (>50%) with no or limited overshoot are higher in AR6 (31 [21–36] GtCO2-eq) than in SR1.5 (28 (26–31 interquartile range) GtCO2-eq). (Figure SPM.1, Table SPM.2) {3.3, SR1.5 Figure SPM.3b}
41 Scenarios in this category limit peak warming to 2°C throughout the 21st century with close to, or more than, 90% likelihood.
42 This category contains 91 scenarios with immediate action and 42 scenarios that are consistent with the NDCs until 2030.
43 These numbers for CH4, N2O, and F-gases are rounded to the nearest 5% except numbers below 5%.
44 In the literature, the terms ‘pathways’ and ‘scenarios’ are used interchangeably, with the former more frequently used in relation to climate goals. For this reason, this SPM uses mostly the term (emissions and mitigation) pathways. {Annex III.II.1.1}
45 Key assumptions relate to technology development in agriculture and energy systems and socio-economic development, including demographic and economic projections. IPCC is neutral with regard to the assumptions underlying the scenarios in the literature assessed in this report, which do not cover all possible futures. Additional scenarios may be developed. The underlying population assumptions range from 8.5 to 9.7 billion in 2050 and 7.4 to 10.9 billion in 2100 (5–95th percentile) starting from 7.6 billion in 2019. The underlying assumptions on global GDP growth (ppp) range from 2.5 to 3.5% per year in the 2019–2050 period and 1.3 to 2.1% per year in the 2050–2100 (5–95th percentile). Many underlying assumptions are regionally differentiated. {1.5; 3.2; 3.3; Figure 3.9; Annex III.II.1.4; Annex III.II.3}
46 The future scenario projections presented here are consistent with the total observed increase in global surface temperature between 1850–1900 and 1995–2014 as well as to 2011–2020 (with best estimates of 0.85°C and 1.09°C, respectively) assessed in WGI. The largest contributor to historical human-induced warming is CO2, with historical cumulative CO2 emissions from 1850 to 2019 being 2400 ± 240 GtCO2. {WGI SPM A.1.2, WGI Table SPM.2, WGI Table 5.1, WGIII SPM Section B}.
47 In case no explicit likelihood is provided, the reported warming levels are associated with a likelihood of >50%.
48 Scenarios in this category are found to have simultaneous likelihood to limit peak global warming to 2°C throughout the 21st century of close to and more than 90%.
49 This involved improved methodologies to use climate emulators (MAGICC7 and FAIR v1.6), which were evaluated and calibrated to closely match the global warming response to emissions as assessed in AR6 WGI. It included harmonisation of global GHG emissions in 2015 in modelled scenarios (51–56 GtCO2-eq; 5th to 95th percentiles) with the corresponding emission value underlying the CMIP6 projected climate response assessed by WGI (54 GtCO2-eq), based on similar data sources of historical emissions that are updated over time. The assessment of past GHG emissions in Chapter 2 of the report is based on a more recent dataset providing emissions of 57 [±6.3] GtCO2-eq in 2015 (B.1). Differences are well within the assessed uncertainty range, and arise mainly from differences in estimated CO2-LULUCF emissions, which are subject to large uncertainties, high annual variability and revisions over time. Projected rates of global emission reduction in mitigation scenarios are reported relative to modelled global emissions in 2019 rather than the global emissions reported in Chapter 2; this ensures internal consistency in assumptions about emission sources and activities, as well as consistency with temperature projections based on the physical climate science assessment by WG I. {Annex III.II.2.5}
50 Cumulative net CO2 emissions from the beginning of the year 2020 until the time of net zero CO2 in assessed pathways are consistent with the remaining carbon budgets assessed by WGI, taking account of the ranges in the WGIII temperature categories and warming from non-CO2 gases. {Box 3.4}
51 All numbers here rounded to the closest 5%, except values below 5% (for F-gases).
52 Most but not all models include the use of fossil fuels for feedstock with varying underlying standards.
53 Aggregate levels of CDR deployment are higher than total net negative CO2 emissions given that some of the deployed CDR is used to counterbalance remaining gross emissions. Total net negative CO2 emissions in modelled pathways might not match the aggregated net negative CO2 emissions attributed to individual CDR methods. Ranges refer to the 5–95th percentile across modelled pathways that include the specific CDR method. Cumulative levels of CDR from AFOLU cannot be quantified precisely given that: (i) some pathways assess CDR deployment relative to a baseline; and (ii) different models use different reporting methodologies that in some cases combine gross emissions and removals in AFOLU. Total CDR from AFOLU equals or exceeds the net negative emissions mentioned.
54 In this context, ‘unabated fossil fuels’ refers to fossil fuels produced and used without interventions that substantially reduce the amount of GHG emitted throughout the life cycle; for example, capturing 90% or more CO2 from power plants, or 50–80% of fugitive methane emissions from energy supply. {Box 6.5, 11.3}
55 Primary metals refers to virgin metals produced from ore.
56 These scenarios have been assessed by WGI to correspond to intermediate, high and very low GHG emissions.
57 These examples are considered to be a subset of nature-based solutions or ecosystem-based approaches.
58 Integration of renewable energy solutions refers to the integration of solutions such as solar photovoltaics, small wind turbines, solar thermal collectors, and biomass boilers.
59 Sufficiency policies are a set of measures and daily practices that avoid demand for energy, materials, land and water while delivering human well-being for all within planetary boundaries.
60 The global top-down estimates and sectoral bottom-up estimates described here do not include the substitution of emissions from fossil fuels and GHG-intensive materials. 8–14 GtCO2-eq yr –1 represents the mean of the AFOLU economic mitigation potential estimates from top-down estimates (lower bound of range) and global sectoral bottom-up estimates (upper bound of range). The full range from top-down estimates is 4.1–17.3 GtCO2-eq yr –1 using a ‘no policy’ baseline. The full range from global sectoral studies is 6.7–23.4 GtCO2-eq yr –1 using a variety of baselines. ( high confidence)
61 ‘Sustainable healthy diets’ promote all dimensions of individuals’ health and well-being; have low environmental pressure and impact; are accessible, affordable, safe and equitable; and are culturally acceptable, as described in FAO and WHO. The related concept of ‘balanced diets’ refers to diets that feature plant-based foods, such as those based on coarse grains, legumes, fruits and vegetables, nuts and seeds, and animal-sourced food produced in resilient, sustainable and low-GHG emission systems, as described in SRCCL.
62 ‘Choice architecture’ describes the presentation of choices to consumers, and the impact that presentation has on consumer decision-making.
63 ‘Status consumption’ refers to the consumption of goods and services which publicly demonstrates social prestige.
64 In modelled pathways that limit warming to 2°C (>67%) or lower.
65 The methodology underlying the assessment is described in the caption to Figure SPM.7.
66 These estimates are based on 311 pathways that report effects of mitigation on GDP and that could be classified in temperature categories, but that do not account for damages from climate change nor adaptation costs and that mostly do not reflect the economic impacts of mitigation co-benefits and trade-offs. The ranges given are interquartile ranges. The macroeconomic implications quantified vary largely depending on technology assumptions, climate/emissions target formulation, model structure and assumptions, and the extent to which pre-existing inefficiencies are considered. Models that produced the pathways classified in temperature categories do not represent the full diversity of existing modelling paradigms, and there are in the literature models that find higher mitigation costs, or conversely lower mitigation costs and even gains. {1.7, 3.2, 3.6, Annex III.I.2, Annex III.I.9, Annex III.I.10 and Annex III.II.3}
67 In modelled cost-effective pathways with a globally uniform carbon price, without international financial transfers or complementary policies, carbon intensive and energy exporting countries are projected to bear relatively higher mitigation costs because of a deeper transformation of their economies and changes in international energy markets. {3.6}
68 The evidence is too limited to make a similar robust conclusion for limiting warming to 1.5°C.
69 For nuclear energy, modelled costs for long-term storage of radioactive waste are included.
70 Potential risks, knowledge gaps due to the relative immaturity of use of biochar as a soil amendment and unknown impacts of widespread application, and co-benefits of biochar are reviewed in Section 7.4.3.2.
71 In this report, the term ‘feasibility’ refers to the potential for a mitigation or adaptation option to be implemented. Factors influencing feasibility are context-dependent and may change over time. Feasibility depends on geophysical, environmental-ecological, technological, economic, socio-cultural and institutional factors that enable or constrain the implementation of an option. The feasibility of options may change when different options are combined and increase when enabling conditions are strengthened.
72 In this report, the term ‘enabling conditions’ refers to conditions that enhance the feasibility of adaptation and mitigation options. Enabling conditions include finance, technological innovation, strengthening policy instruments, institutional capacity, multi-level governance, and changes in human behaviour and lifestyles.
73 The future feasibility challenges described in the modelled pathways may differ from the real-world feasibility experiences of the past.
74 Sustainability may be interpreted differently in various contexts as societies pursue a variety of sustainable development objectives.
75 Economic instruments are structured to provide a financial incentive to reduce emissions and include, among others, market- and price-based instruments.
76 In modelled pathways, regional investments are projected to occur when and where they are most cost-effective to limit global warming. The model quantifications help to identify high-priority areas for cost-effective investments, but do not provide any indication on who would finance the regional investments.


