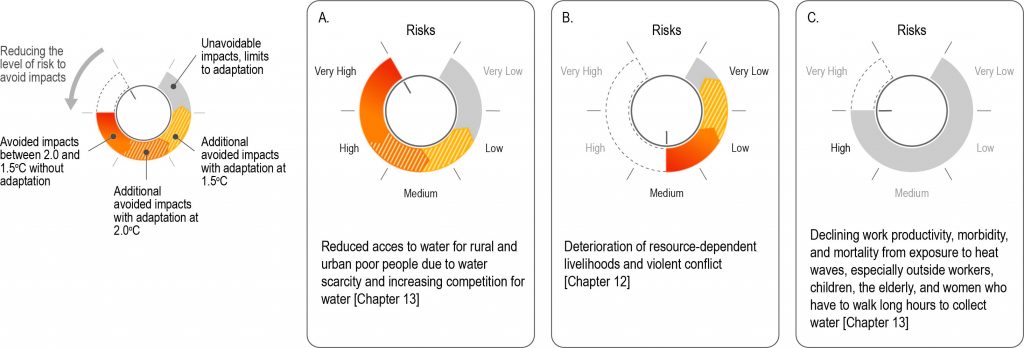
Cross-Chapter Box 12, Figure 1
Stylized reduced risk levels due to avoided impacts between 2°C and 1.5°C warming (in solid red-orange), additional avoided impacts with adaptation under 2°C (striped orange) and under 1.5°C (striped yellow), and unavoidable impacts (losses) with no or very limited potential for adaptation (grey), extracted from the AR5 WGII risk tables (Field et al., 2014)63, and underlying chapters by Adger et al. (2014)64 and Olsson et al. (2014)65.