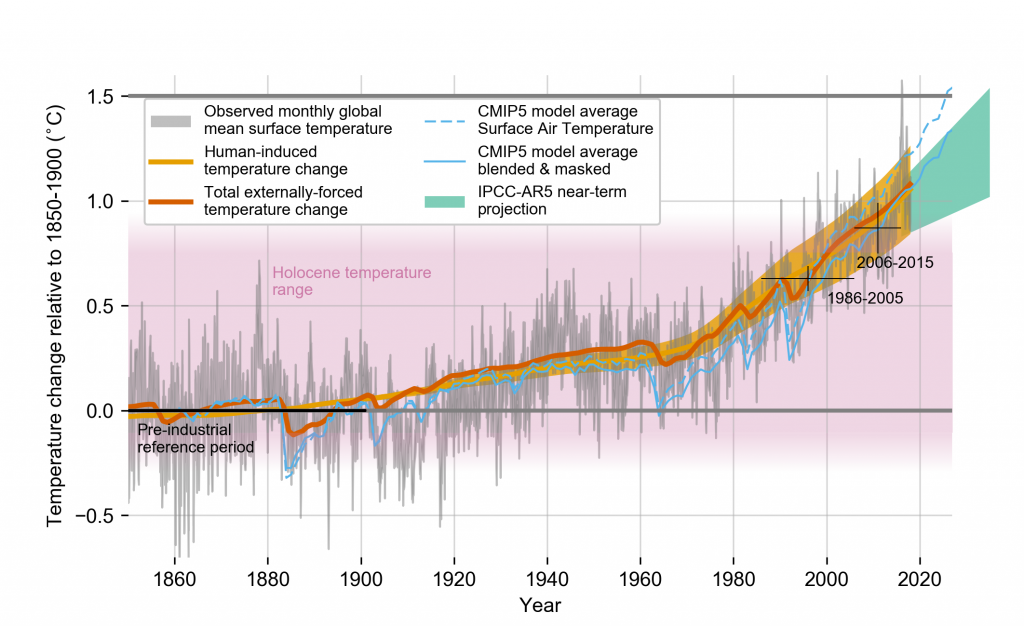
Evolution of global mean surface temperature (GMST) over the period of instrumental observations.
Grey shaded line shows monthly mean GMST in the HadCRUT4, NOAAGlobalTemp, GISTEMP and Cowtan-Way datasets, expressed as departures from 1850–1900, with varying grey line thickness indicating inter-dataset range. All observational datasets shown represent GMST as a weighted average of near surface air temperature over land and sea surface temperature over oceans. Human-induced (yellow) and total (human- and naturally-forced, orange) contributions to these GMST changes are shown calculated following Otto et al. (2015) and Haustein et al. (2017). Fractional uncertainty in the level of human-induced warming in 2017 is set equal to ±20% based on multiple lines of evidence. Thin blue lines show the modelled global mean surface air temperature (dashed) and blended surface air and sea surface temperature accounting for observational coverage (solid) from the CMIP5 historical ensemble average extended with RCP8.5 forcing (Cowtan et al., 2015; Richardson et al., 2018). The pink shading indicates a range for temperature fluctuations over the Holocene (Marcott et al., 2013). Light green plume shows the AR5 prediction for average GMST over 2016–2035 (Kirtman et al., 2013). See Supplementary Material 1.SM for further details.