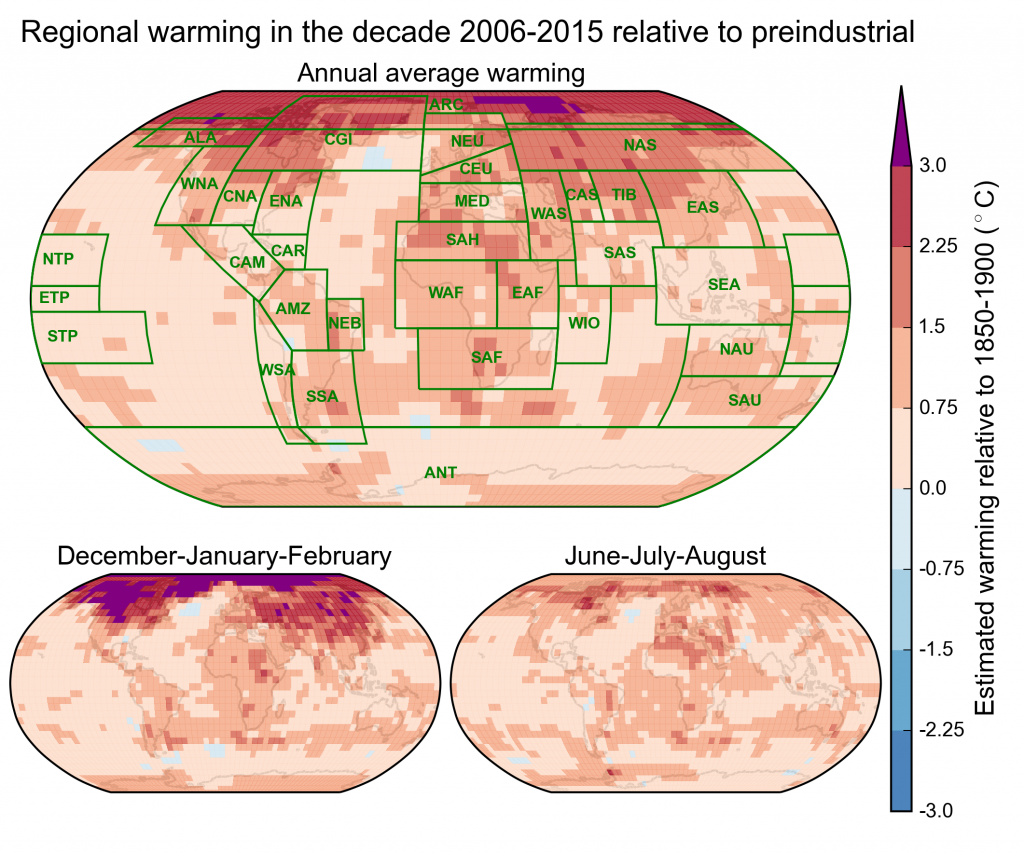
Spatial and seasonal pattern of present-day warming.
Regional warming for the 2006–2015 decade relative to 1850–1900 for the annual mean (top), the average of December, January, and February (bottom left) and for June, July, and August (bottom right). Warming is evaluated by regressing regional changes in the Cowtan and Way (2014) dataset onto the total (combined human and natural) externally forced warming (yellow line in Figure 1.2). See Supplementary Material 1.SM for further details and versions using alternative datasets. The definition of regions (green boxes and labels in top panel) is adopted from the AR5 (Christensen et al., 2013).