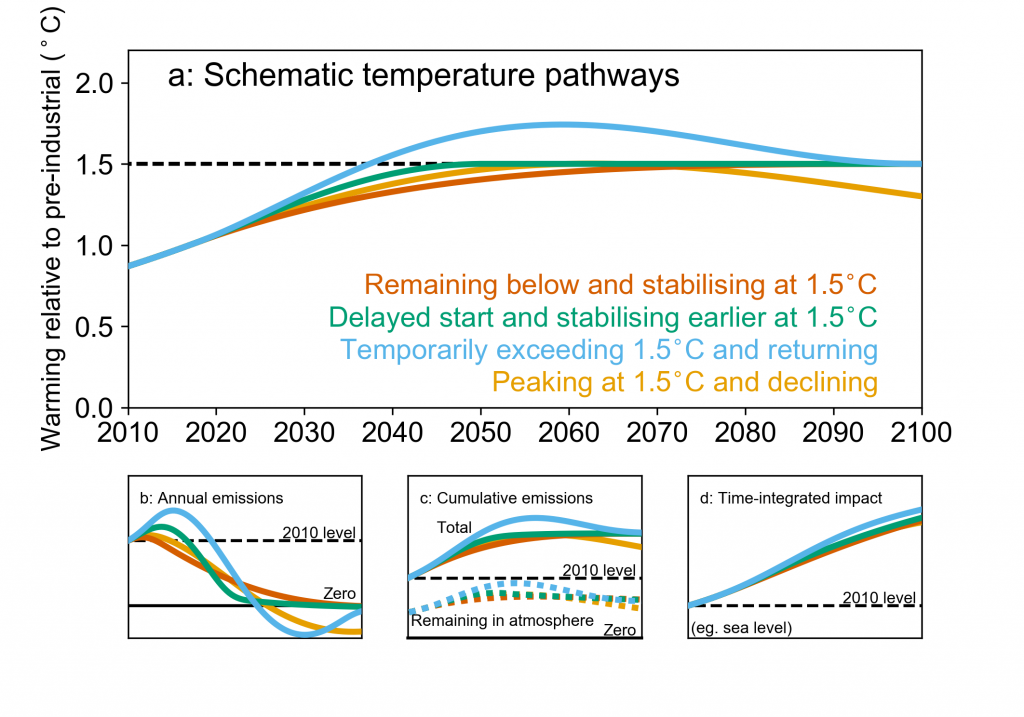
Different 1.5°C pathways Schematic illustration of the relationship between (a) global mean surface temperature (GMST) change; (b) annual rates of CO2 emissions, assuming constant fractional contribution of non-CO2 forcing to total human-induced warming; (c) total cumulative CO2 emissions (solid lines) and the fraction thereof remaining in the atmosphere (dashed lines; these also indicates changes in atmospheric CO2 concentrations); and (d) a time-integrated impact, such as sea level rise, that continues to increase even after GMST has stabilized.
Different 1.5°C pathways Schematic illustration of the relationship between (a) global mean surface temperature (GMST) change; (b) annual rates of CO2 emissions, assuming constant fractional contribution of non-CO2 forcing to total human-induced warming; (c) total cumulative CO2 emissions (solid lines) and the fraction thereof remaining in the atmosphere (dashed lines; these also indicates changes in atmospheric CO2 concentrations); and (d) a time-integrated impact, such as sea level rise, that continues to increase even after GMST has stabilized. Colours indicate different 1.5°C pathways. Brown: GMST remaining below and stabilizing at 1.5°C in 2100; Green: a delayed start but faster emission reductions pathway with GMST remaining below and reaching 1.5°C earlier; Blue: a pathway temporarily exceeding 1.5°C, with temperatures reduced to 1.5°C by net negative CO2 emissions after temperatures peak; and Yellow: a pathway peaking at 1.5°C and subsequently declining. Temperatures are anchored to 1°C above pre-industrial in 2017; emissions–temperature relationships are computed using a simple climate model (Myhre et al., 2013; Millar et al., 2017a; Jenkins et al., 2018) with a lower value of the Transient Climate Response (TCR) than used in the quantitative pathway assessments in Chapter 2 to illustrate qualitative differences between pathways: this figure is not intended to provide quantitative information. The time-integrated impact is illustrated by the semi-empirical sea level rise model of Kopp et al. (2016).