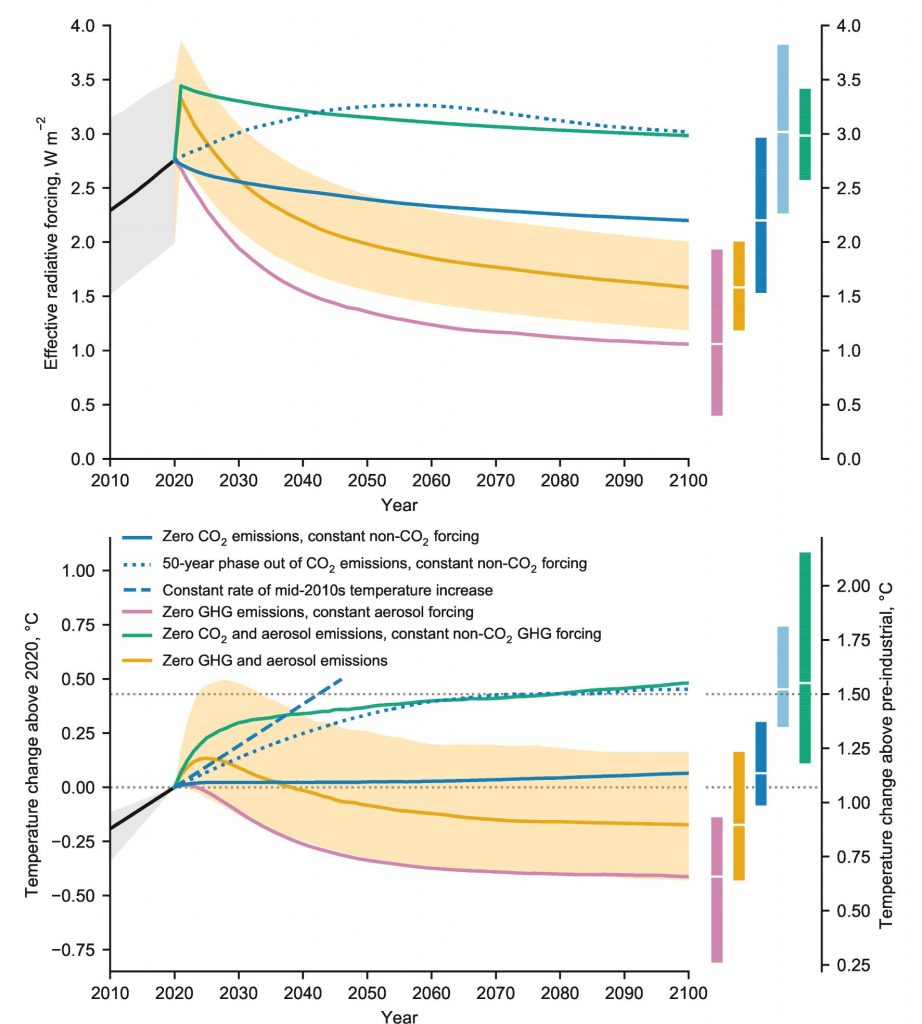
Warming commitment from past emissions of greenhouse gases and aerosols.
Radiative forcing (top) and global mean surface temperature change (bottom) for scenarios with different combinations of greenhouse gas and aerosol precursor emissions reduced to zero in 2020. Variables were calculated using a simple climate–carbon cycle model (Millar et al., 2017a) with a simple representation of atmospheric chemistry (Smith et al., 2018). The bars on the right-hand side indicate the median warming in 2100 and 5–95% uncertainty ranges (also indicated by the plume around the yellow line) taking into account one estimate of uncertainty in climate response, effective radiative forcing and carbon cycle sensitivity, and constraining simple model parameters with response ranges from AR5 combined with historical climate observations (Smith et al., 2018). Temperatures continue to increase slightly after elimination of CO2 emissions (blue line) in response to constant non-CO2 forcing. The dashed blue line extrapolates one estimate of the current rate of warming, while dotted blue lines show a case where CO2 emissions are reduced linearly to zero assuming constant non-CO2 forcing after 2020. Under these highly idealized assumptions, the time to stabilize temperatures at 1.5°C is approximately double the time remaining to reach 1.5°C at the current warming rate.